
Submitted:
13 April 2023
Posted:
14 April 2023
You are already at the latest version
Abstract
In this paper, a systematic literature review is presented, through a survey in the main digital databases, about modelling methods for Short-Term Load Forecasting (STLF) for hourly electricity demand for residential electricity and to realize the performance evolution and impact of the Artificial Intelligent (AI) in STLF. With these specific objectives, it was developed a conceptual framework on the subject, a systematic review of the literature based on scientific publications with high impact and a bibliometric study directed to the scientific production of AI and STLF. The review of research articles over a 10-year period, which takes place between 2012-2022, uses the Preferred Reporting Items for Systematic and Meta-Analyses (PRISMA) method. This research resulted in more than 300 articles, available in 4 (four) databases: Web of Science, IEEE Xplore, Scopus and Science Direct. The research was organized around 3 (three) central themes, which were defined through keywords: STLF, Electricity, Residential and their corresponding synonyms. 334 research articles were analyzed and identified the year of publication, journal, author, geography by continent and country and the area of application. Of the 334 documents found in the initial research and after applying the inclusion/exclusion criteria, which allowed delimiting the subject addressed in the topics of interest for analysis, 37 (thirty-seven) documents are in English (25 are journal articles and 12 are conference papers). The results point to a diversity of modelling techniques and associated algorithms. The corresponding performance is measured with different metrics and, therefore, cannot be compared directly. Hence, it should be desirable to have a unified data set together with a set of benchmarks with well-defined metrics for a clear comparison of all the modelling techniques and the corresponding algorithms.
Keywords:
STLF
; electricity
; residential (household)
; Artificial Intelligence
; energy demand
; modelling techniques
; hour-ahead load
1. Introduction
The growth and development rate of countries around the world is and has been, annually and inevitably, increasing strongly [1]. The extraordinary increase in the global population, related to economic advancement, industrialization, social advances, and expectations of prosperity, has had a significant impact on energy and environmental issues [2]. Associated with the growth of the human population in the demand for housing and well-being, the development of countries and societies will also continue to increase. To ensure these growths and developments, an increase in energy generation will be needed to stimulate global demand and, at the same time, the environment should be kept safe [1,2]. The increase in population and consumption patterns have promoted the increase in energy consumption that, unavoidably, has been growing at an annual high rate. According to the U.S. Energy Information Administration (EIA), energy consumption is expected to grow by more than 50% by 2050 [3]. Energy plays a vital role in the progress and socio-economic development of a country [4]. A criterion for assessing the rate of development and the welfare rate of a country is to compute the amount of energy it consumes [4,5,6].
The world, in particular developing countries, faces a future increase in energy demand as population growth and the demand for welfare conditions promote a strong pressure and dependence on fossil fuels in societies and increasing challenges associated with climate change [1]. This enormous growth is driven by the growing industrial revolution and urbanization [7]. The introduction of new and advanced technologies increases dependence on electricity [5]. The increase in population requires a rapid expansion of residential and commercial areas, which also contributes to an increase in energy consumption. At the same time, environmental issues should be considered in this development to reduce pollution, carbon footprint and greenhouse effect [1].
The latest annual report from the International Energy Agency (IEA) mentions that developing countries have the fastest growth rate demand for electricity than developed countries. It is therefore necessary to provide for such a diversified demand for electricity using robust and high-performance forecasting methods for adequate power generation planning [3].
To meet the objective of the Paris Agreement and reduce greenhouse gas (GHG) emissions, it is essential to move towards a low-carbon energy system [4]. The International Energy Agency (IEA) has identified energy efficiency as one of the measures to ensure the long-term decarbonization of the energy sector [2]. One of the main solutions to reduce emissions is to reduce the intensity of primary energy through energy efficiency [5] and electrification – based on renewable energy sources (RES) – a solution increasingly adopted for the industrial, commercial, residential and transport sectors.
To mitigate the effects of climate change and protect the environment, developed countries have set themselves the goal of increasing their share of RES in energy production [6,8,9]. The increased penetration of renewable energies, such as wind and solar energy, is characterized by stochastic nature. Most RES are characterized by variability and intermittency, making it difficult to predict their power output (i.e., they depend on solar irradiation or wind speed). These features make the operation and management of energy systems more challenging because more flexibility is needed to safeguard their normal operation and stability [9,10].
However, since the production of renewable energy from sources such as wind or sun is intermittent, accurate forecasts of non-controllable electrical loads are needed to flexibly manage and achieve the balance between demand and supply. Therefore, in the ongoing energy transition, significant investments and developments in research are underway to quickly harness electricity generated from renewable sources [2].
In addition, the 2019 coronavirus disease pandemic (COVID-19) had a notable and unexpected impact on fluctuating patterns of electricity in several sectors, especially the residential sector. Following the indications of the World Health Organization (WHO), the population stayed and spent more time at home, particularly in developed countries, leading to an increase in electricity consumption in the domestic sector, higher than in the past [11].
People spend about 90% of their time in buildings and 80 to 90 % of the overall electricity consumption throughout the life cycle of a building is intended to fulfil internal tasks and building operations. Thus, residential buildings become the largest consumers of electricity in the world, representing 39 % of electricity consumption and 38% of greenhouse gas emissions [2]. In Europe, energy consumption and total carbon dioxide emissions from buildings account for 40% and 36%, respectively [5].
The scarcity of energy supply increased global energy demand, pollution, and GHG emissions and the lack of studies on sustainable and clean energy systems have led all research results to conclude that the management of electricity consumption is a key observation issue [2]. Electricity is a necessity of life and represents a great challenge to all countries. Increasing electricity consumption at an alarming rate has become a challenge for distribution companies [5]. Energy institutions and organizations in each country need to ensure and adjust the demand for supply at competitive prices, avoid waste of resources and, safely, provide it to their economy and their citizens [12,13].
These circumstances indicate the essential need for an effective electric load forecasting system to accommodate several uncertainties associated with changing end-user-related load consumption behaviour and RES intermittency [6,8,10]. In addition, an effective load forecasting system can help maintain the reliability, efficiency and sustainability of the energy system by establishing more effective management, developing future economic planning and promoting support systems for the decision-making of emerging generation and distribution energy. In the context of the impressive digital revolution promoted by Industry 4.0, several intelligent methods of load forecasting have recently been developed [9].
The forecasting of the demand for resources within a power distribution network has relevant importance for the management of the limited availability of assets. An accurate load forecasting system can reduce the high cost of excessive contracts and subcontracts in balance markets due to load forecasting errors [14]. Electricity demand forecasting has been decisive in electricity production capacity, transmission planning and pricing [12]. In addition, it keeps energy markets efficient and provides a better understanding of the dynamics of the monitored system [14].
STLF allows the power grid industry to manage many operating decisions. To this end, STLF is often used to improve system operations and provide reliable services [2], being an active area of research, namely in the residential sector, where high electricity consumption requires demand-side management (DSM) strategies. As mentioned above, electricity consumption in the residential sector represents a considerable share of total energy consumption. Thus, by providing accurate forecasts at the residential level, electric power service companies can optimize energy production and manage demand [10].
Energy demand forecasting techniques can be grouped into three (3) categories, namely: correlation, extrapolation and a combination of both. Extrapolation techniques involve the adjustment and reproduction of trend curves based on historical data on electricity demand. In these cases, the future value of the electricity demand is obtained by projecting the function of the trend curve at the desired future point. It is a simple technique, and its results are very realistic in some cases. However, correlation techniques seek to relate the system load demand curve to several economic and demographic factors. Therefore, these techniques seek the existing association between patterns of increased demand and other measurable factors. The disadvantage of correlation techniques lies in forecasting economic and demographic factors, making it harder than demand forecasting itself. Normally, correlation techniques are used for population data, building permits, heating, ventilation and cooling, employment, weather data, and typologies of buildings. However, proper planning and useful applications of electric load forecasting require a specific forecast period (lead time) [15].
Electricity consumption varies in short-, medium- and long-term periods, which cover three forecast time horizons. They range, respectively, from one hour to a week, one week to a year, and more than a year [8,9,16]. They are based on several factors such as climate, region and sector (residential, industrial, commercial). Residential loads consume most of the electricity generated [9,17]. STLF is important for cost reduction, energy savings, fine scheduling, and safety assurance [18].
To improve the forecasting of electricity demand accuracy, several computational and statistical methods have been applied [19,20]. Some researchers cluster the forecasting models into two models. Those that are data-driven, are usually applied with artificial intelligence techniques – equal to extrapolation techniques – and engineering methods – equal to correlation techniques. Even so, no single method is scientifically accepted as being better than others in all situations [11].
Over the years, many different forecasting models have been applied in energy systems that can be categorized into three methods: Engineering, Statistics and AI [1,10]. Among them, the most applied are AI and statistical methods. Engineering methods are still applied, but some shortcomings have been identified, such as the complexity that contributes to the practical difficulties of application and their lack of input information. However, it was found that statistical methods lack accuracy and are not flexible, which makes the AI method preferred among researchers [1]. There is no consensus on a specific forecasting model and the use of one method over another is associated with the expert's preference [19]. Therefore, it is relevant to identify which model is adequate for a specific situation.
The purpose of this systematic review is to analyze and identify the quality of a method compared to some of the other potential solutions in a specific forecasting scenario and help users in selecting their forecasting method by simply answering questions such as: "Is there any STLF model capable to forecast electricity demand, between 1 hour until 24 hours, for a single residence with acceptable error?".
In AI, Machine Learning (ML) is the most widely implemented due to the ability to analyze nonlinear problems and its more accurate results. The several methods used in ML can also learn from the historical pattern during analyzing the data. In addition, it has capabilities in pattern recognition and pattern classification. Although the statistical forecasting method is simple, for the stability of the original time series it needs many requirements. It is a method that has difficulty adapting to the increasingly complex characteristics of energy consumption, which normally leads to lower forecasting accuracy [21].
The following sections of this article are structured as follows: Section 2 presents the motivation and the review scope. Section 3 presents the methodology used in the paper for a systematic review. Section 4 presents a literature review of STLF methods. Finally, concluding remarks are given in Section 6 summarizing the findings and guidelines for future research.
2. Motivation and review scope
Electricity grid infrastructure has had difficulty managing the growing need for energy [22] and increased penetration of renewable energy systems [21]. In Europe, electricity consumption in the residential sector accounts for a considerable share of total energy consumption reaching 40% [10]. In recent years, there has been a growing trend toward implementing electricity generation systems from renewable sources and their rapid development has presented important challenges for energy system operators [10]. The smart grid provides infrastructure for the power management system and facilitates the smooth integration of RES [4].
The introduction of smart grids also promoted the development of STLF techniques and the implementation of one of the main devices of a smart grid: smart metering [4]. The capabilities of smart grid technologies and real-time metering can enable them to forecast individual demand for electricity by residential consumers and aggregate all of them to forecast total demand at the electric utility. This opportunity motivates new approaches to the STLF in which the residential sector can forecast the consumption of electricity per resident, per cluster and agglomerate. The possibility of the residential sector demands can be forecast independently and individually the future demand for electricity of a residence and communicated to the electricity supplier and the consumer [23].
Electricity forecasting is an essential component of the smart grid and has attracted academic interest. However, from several models developed, the selection of a model is difficult to choose, for a particular application [19]. The promotion of accurate forecasts of electricity demand in the residential sector allows electric utilities to optimize energy production and manage demand, reducing congestion and overloads on the transmission network [20]. Reducing the STLF error benefits the power generation plan and the management of electricity systems [23]. Load forecasting is an important technique to ensure that the power grid operates safely and reliably [21,24]. STLF solutions in the residential sector are also essential to contribute to the decarbonization of the economy, the reduction of GHG emissions and to balance of the demand and supply of electrical systems. These contributions increased the interest and the need for a systematic review to summarize the algorithms used for the different models applied in the STLF.
Most of the articles analyzed in this systematic review provide valuable contributions. However, they tend to focus only on the development of the algorithm-specific technique and application domain. The growing need for solutions in this area reinforces the need for a comprehensive review that tracks its evolution and acts as a guide to highlight the most promising STLF solutions used in the residential sector, based on the existing knowledge so far reported in existing publications, in its different typologies: individual, cluster and agglomerate. The purpose of our analysis is:
- First, provide a comprehensive overview and a detailed assessment of previous state-of-the-art STLF solutions applied to electricity demand in the residential sector, a perspective of their evolution and possible future research paths.
- Secondly, present a concise summary of the useful characteristics of STLF comparative techniques applied to the electrical load.
- Third, present a systematic analysis of the advantages and disadvantages of using a specific STLF solution.
This is a comprehensive review of the STLF solutions applied in the residential sector in electricity demand over the past 10 years. More specifically, it includes 37 studies/articles (summarized in tables of the Appendix).
3. Methodology
This article presents a relevant literature systematic review on STLF in the forecasting in the residential sector for electricity demand. The protocol Preferred-Reporting Items for Systematic-Review and Meta-Analysis (PRISMA) was applied due to its ability to increase the value and quality of systematic review compared to other forms of review [11].
The PRISMA protocol is used for extensive research in the existing literature and meta-analysis of the consultation, reducing the effect of chance and biases. This protocol has a well-defined procedure that brings clarity, accuracy and repeatability. In summary, PRISMA begins with the definition of the research question(s); then, the search criteria to be applied to select the correct publications are defined. After the selection, the data should be analyzed and finally discuss the results.
The criteria adopted for research were selected according to the research question. To optimize and limit the search in the online databases adopted, Web of Science, IEEE Xplore, Scopus and Science Direct, it was identified some assertive keywords that emerged naturally with the survey of the question to be answered, namely "STLF", "Electricity" or "Residential". It was searched as follows: "STLF" AND "Electricity" AND "Residential". Synonyms of the keywords "Residential" were also used, such as "domestic", "house", "household", “dwelling” or "building", within the title, abstract, text or keywords.
The consultation of the databases mentioned made it possible to identify a total of 334 (three hundred and thirty-four) interesting scientific articles for this systematic review collected and published in relevant journals and conferences. The articles were downloaded from the internet and were later carefully analyzed the titles, abstracts and keywords using the free web tool: Rayyan. For assistance in systematic review and meta-analysis, the semi-automatic process of the Rayyan application speeds up initial screening by abstracts, titles and keywords [25].
The Rayyan tool allows the automatic detection of articles that are partially or totally (100%) duplicated. The tool allows erasure or keeps the article seemingly duplicated. Subsequently, the articles were consulted by the year of publication, title, abstract and keyword.
The date of publication was one of the exclusion criteria. Articles with a date before 2012 were excluded and those published in the last 10 years were maintained. Figure 1 shows that there is an interesting number of publications on the topic underlying the question during this period. Another exclusion criterion was the "Review" articles. The other exclusion factors were the articles whose aim of the study is not directly related to the "Residential" sector or the results of the studies that were not aligned with the future electricity demand forecasting. All articles submitted by the databases consulted had the text in English, there was no exclusion for this reason. Thus, there were 37 articles for quantitative analysis. The PRISMA flow diagram shown in Figure 2 identifies the different phases and exclusion criteria.
Therefore, the research in the databases identified 334 (three hundred and thirty-four) articles from scientific journals and conferences. 24 (twenty-four) duplicate articles were removed and remain 310 (three hundred and ten) articles for the screening stage. In the screening stage, 1 (one) article was removed because the study was not related to the services of the electrical networks. 16 (sixteen) articles were published before 2012 and removed, reducing the articles eligible for analysis to 293 (two hundred and ninety-three). Thus, these 293 articles were used for qualitative analysis. Among these, 25 (twenty-five) articles were removed because they presented reviews of electrical load forecasting, reducing the number of articles eligible for qualitative analysis to 268 (two hundred and sixty-eight). Of the 268 articles that remained for analysis, 111 (one hundred and eleven) were rejected because the works did not cover the residential sector and 120 (one hundred and twenty) were also removed because the results were not related to future electricity demand. Thirty-seven (37) articles were left for quantitative analysis, as shown in Figure 2.
3.1. Cases comparison – Results and discussion
Studies for electricity consumption in the residential sector have different results and approaches when they are oriented to the typologies of one residence, cluster or agglomerate of residences. The residential or domestic sector refers to a residence or dwelling where people live on a day-to-day basis alone, with family and friends in a villa, in a condominium, on a floor or block of buildings located in a rural or urban zone. Since they provide relevant results, the literature selected for this approach and electricity demand forecasting presents works with two main methods: AI methods and statistical methods. To harness the strength of the different methods, some researchers use hybrid methods – two or more AI and statistical techniques – to improve the forecasting accuracy models adopted.
The selected works of forecasting the consumption of electricity seek to identify the partial or total hourly load, daily, weekly, monthly, seasonally or annual hourly or total of one residence, cluster or agglomerate of residences to be provided by an electric power supply. The STLF models presented by most of the studies use historical data of several days, weeks, months or years of the electrical load and exogenous variables to input, e.g.: meteorological data, calendar (weekdays, weekends, holidays), tariff, appliances and socio-economic effects and project the forecasting for the hourly electric load, daily, weekly, monthly, seasonal or annual. The techniques used to evaluate the performance of the studied models are statistical. Most of the selected articles use MAPE, MAE, MSE and RSME. The performance results were classified as high, satisfactory and low. For performance, the adopted high interval should be among the first 5% of one or more evaluation methods. For a satisfactory assessment, it should be between 5% to 20% and low performance above 20%. It turns out that most of the work that focuses on agglomerate has a high performance. While those who focus on one residence have satisfactory or low performance, given the volatility and occupation behaviour of the residents.
3.2. Summary of statistical analysis
The 37 articles were analyzed to allow the first observation. Table 1 shows the number of articles published in the last decades on STLF for the residential sector. The largest number of publications (19 articles, more than 50%) occurred in the last two years. This evidence the increase of interest by the scientific community in this subject. Figure 3 shows that more than half of the publications are journal articles (62%) and the rest are articles published at conferences (28%). Figure 4 shows the countries with the origin of the analyzed publications. The three main continents with the highest number of publications in STLF for energy demand in the residential sector come from the Northern Hemisphere, namely Europe (44.8%), Asia (27.6%) and North America (24.1%). The main countries with the most publications are France and the USA (both with 13.8%), followed by the same number of articles published in Canada, Ireland and Pakistan (10.3%) and, finally, Bangladesh and Portugal (7 %). Figure 5 shows the cities covered by the published articles. The cities of Sceaux (France), Lahore (Pakistan), Lisbon (Portugal) and New York (USA) stand out.
3.3. A highlight of articles published in forecasting models
The development of robust, effective, and accurate load forecasting models in the residential sector has been an opportunity to improve the responsiveness related to the operation of the electricity grid and the electricity demand. For suppliers and residential customers, the development of load forecasting solutions is very important to support the management decision-making, cost reduction and anticipation of possible problems with the operation of electricity grid systems. Thus, the task of forecasting demand for future energy consumption (load forecasting) has become an important component of any electric power management system [2].
Figure 3.
Types of publication documents from 2014 to 2022.
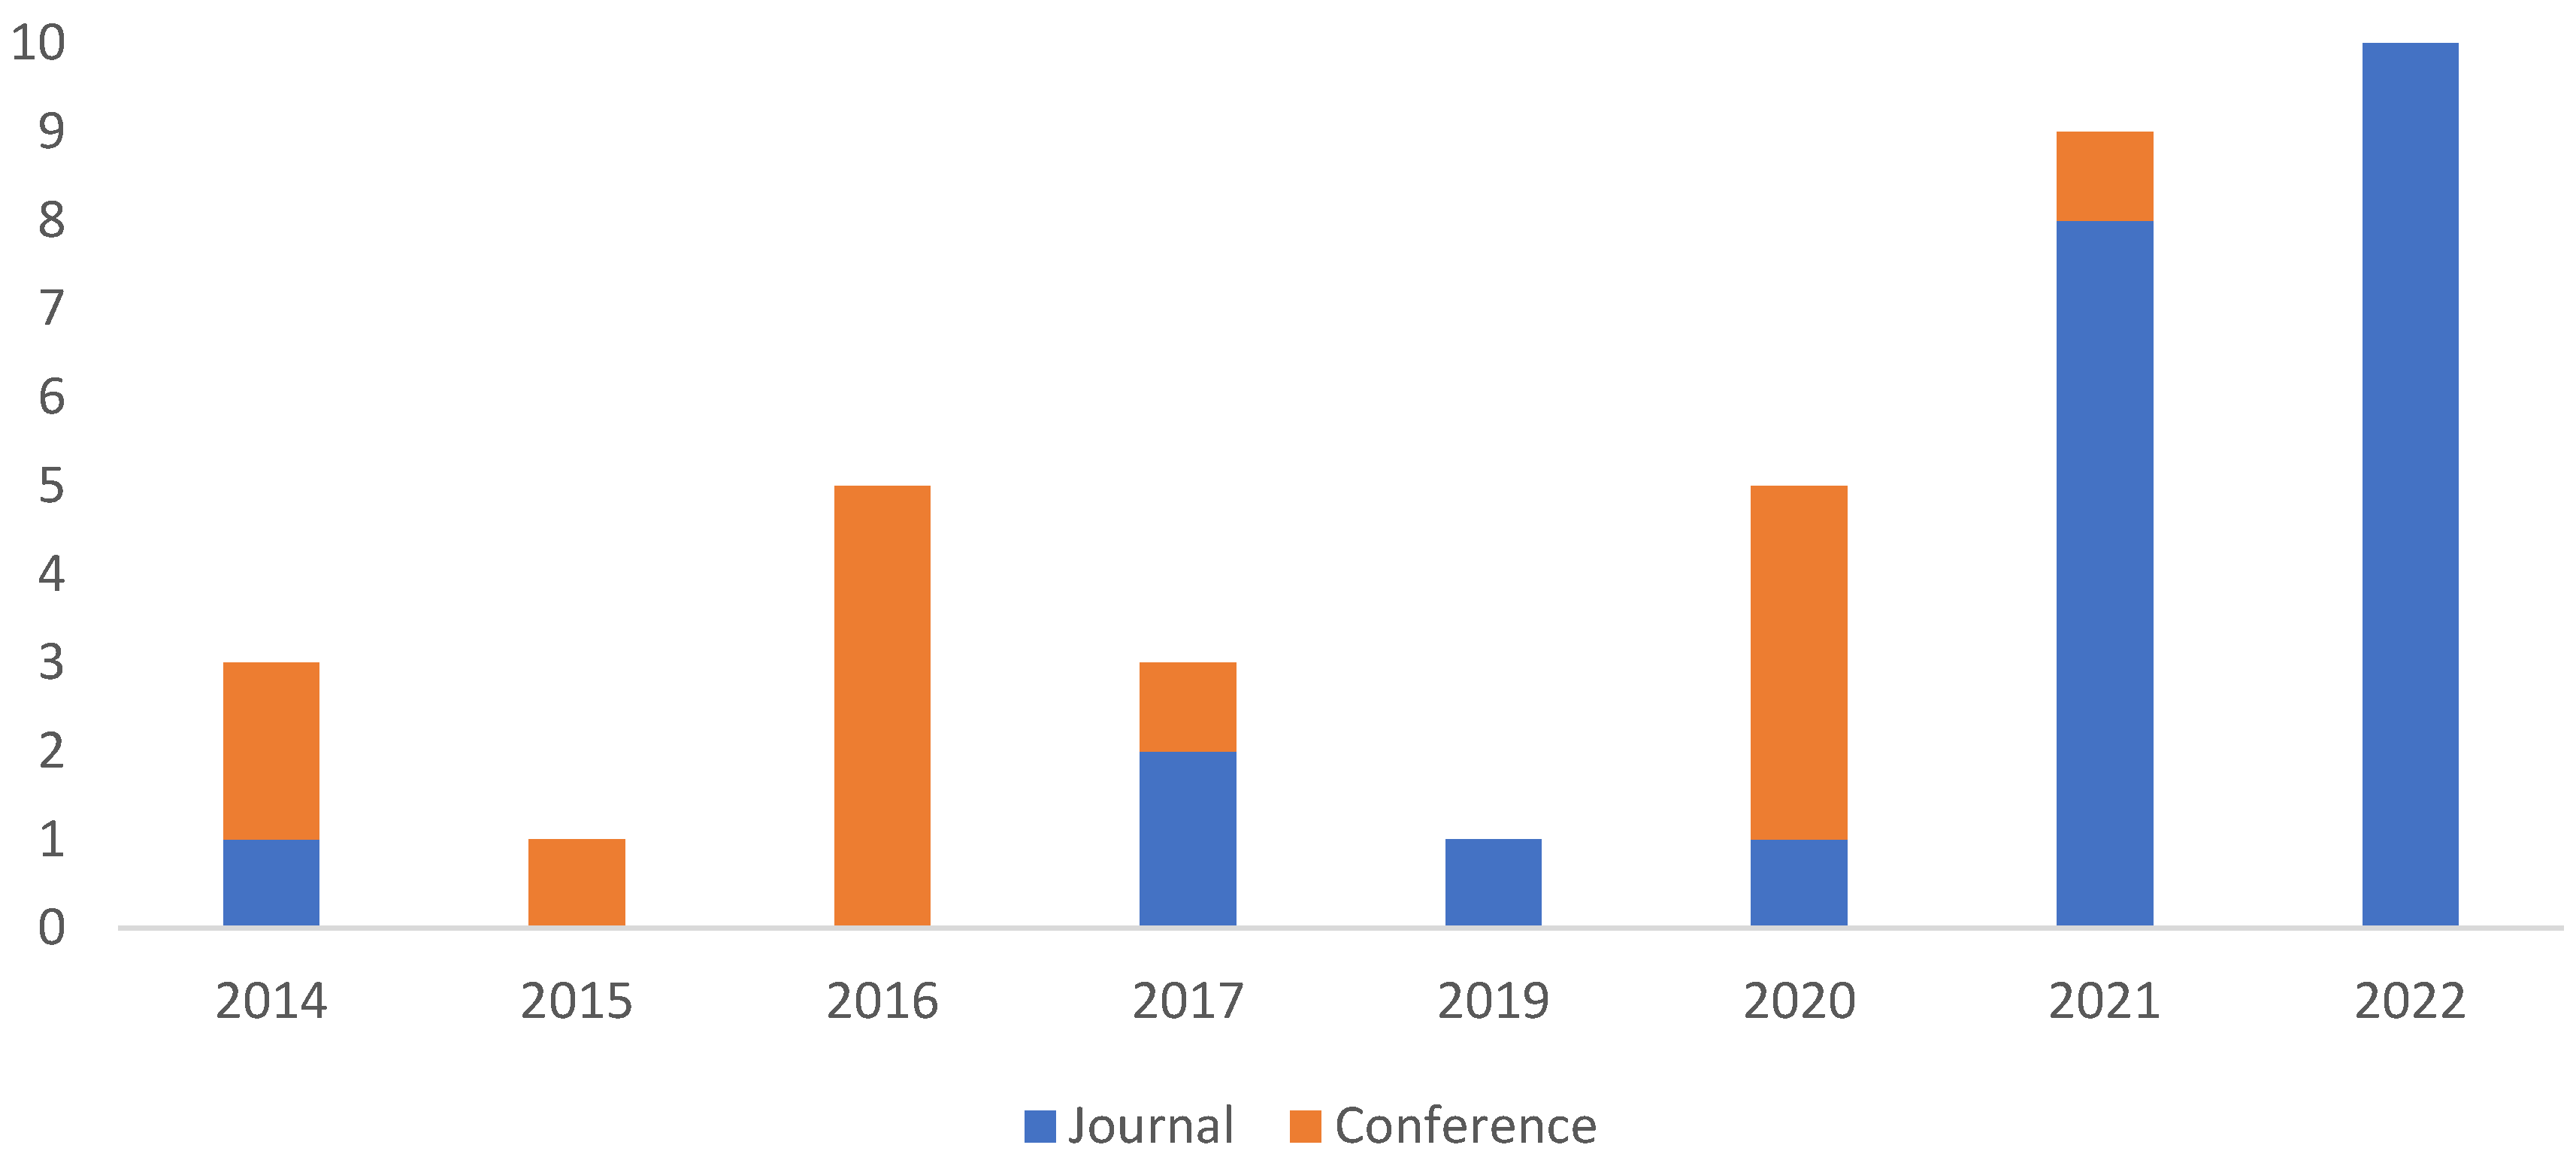
Figure 4.
Regions and countries subject to the study of publications from 2014 to 2022.
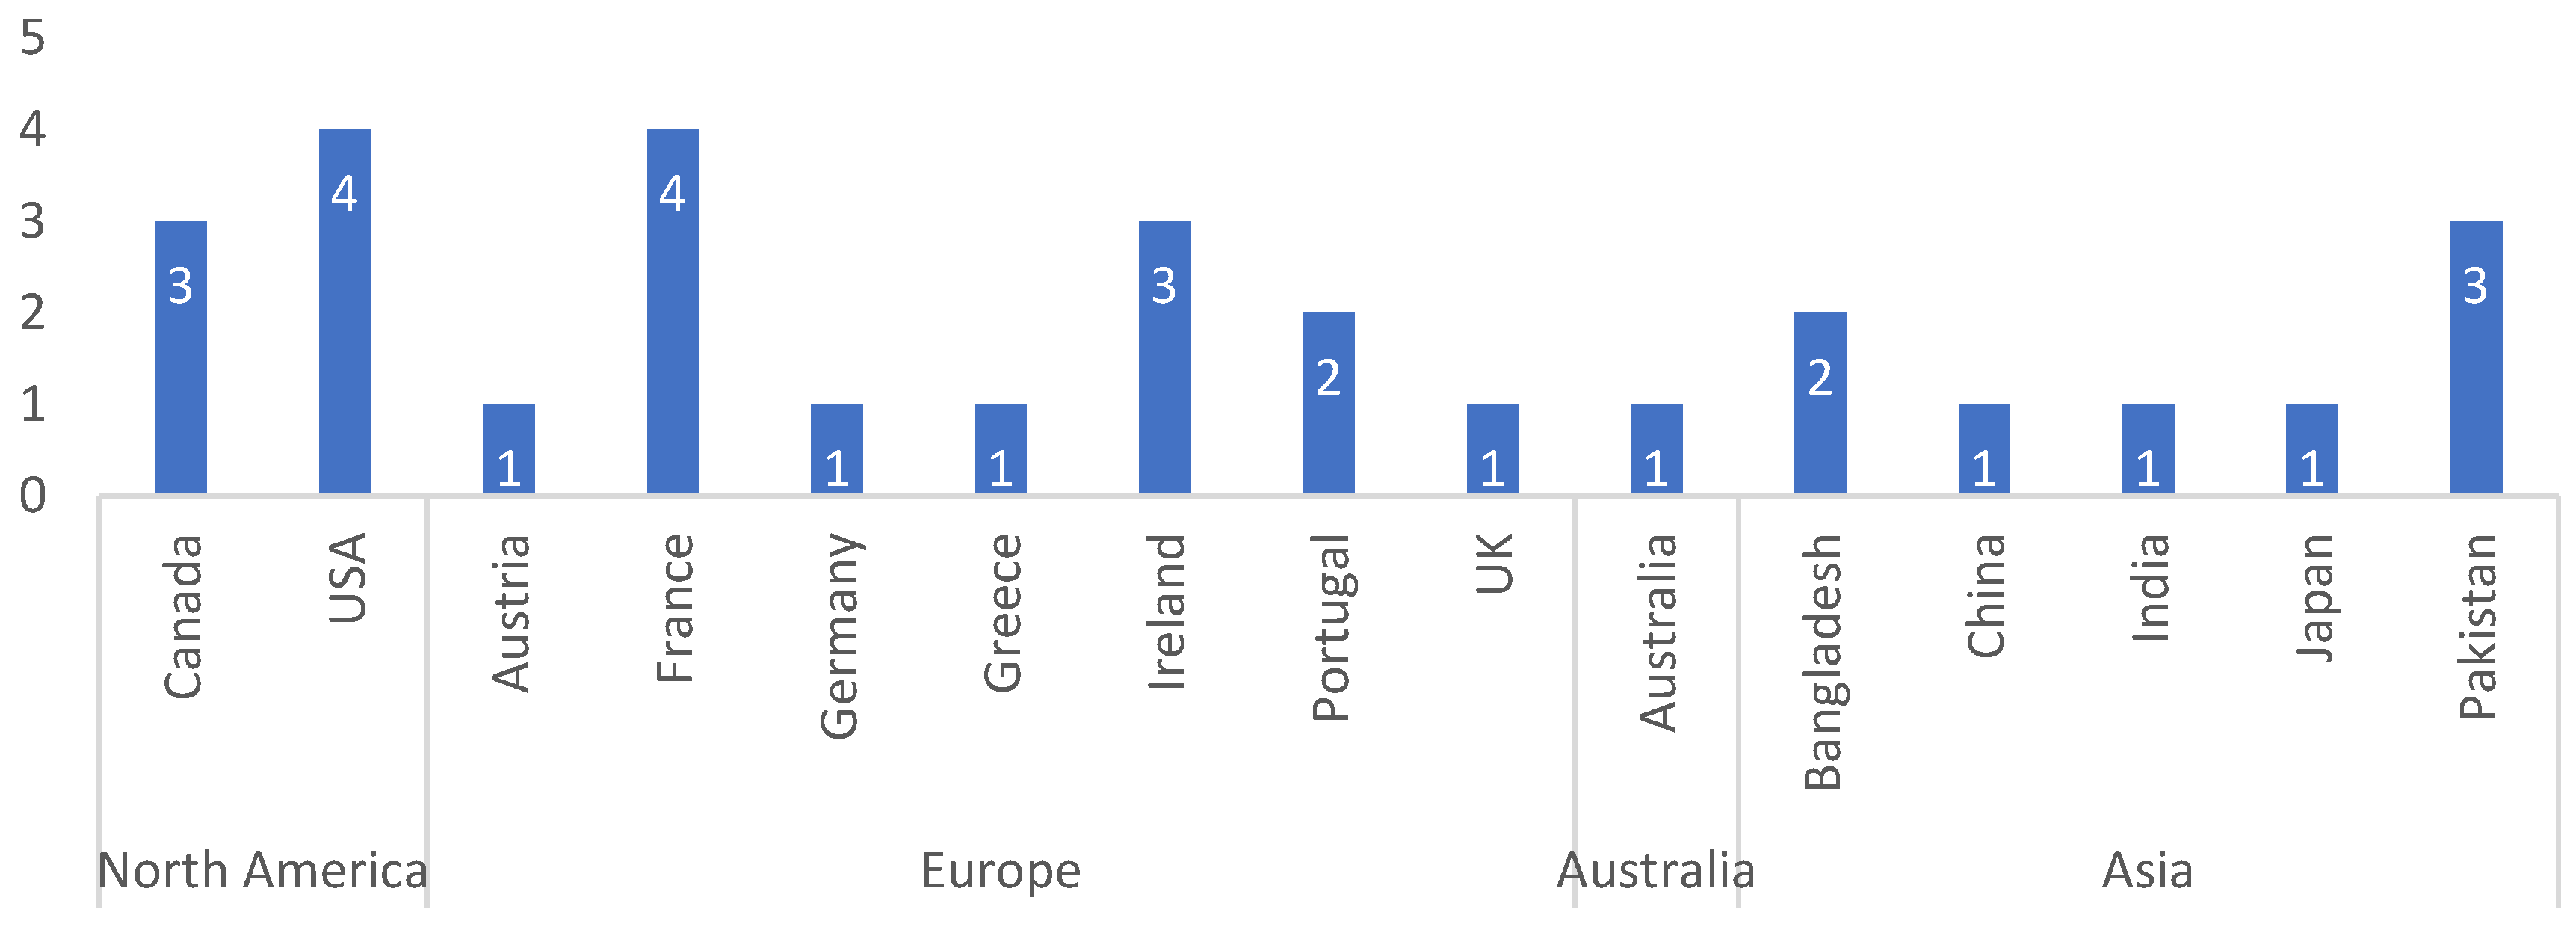
Figure 5.
Cities targeted for the study of publications from 2014 to 2022.

STLF solutions have become increasingly relevant in the face of the extensive proliferation of Internet-of-Things (IoT) and Metering Infrastructure (MI) technologies that allow greater granularity in the aggregation of electricity consumption data of each consumer and monitoring of relevant exogenous variables, such as the predominant data of the zone's climate conditions [2].
The analysis of the 37 articles shows that the input data used in the various models applied to STLF solutions increase the arbitrariness of the load/energy time series. There is a correlation with the calendar effects, among them, the numerous holidays, the same days of previous weeks and between several working days and weekends. They are also vulnerable to variations in exogenous conditions, such as climate conditions, occupation and social behaviours.
The methods presented in the 37 articles analyzed can be categorized under two labels, namely: AI methods and statistical methods. Analyzing the distribution of models through all articles allows having a reading of the current trend in the use of the forecasting model.
Figure 6 illustrates the distribution of the different forecasting methods analyzed. It is highlighted that in some articles, there are forecasting methods that apply various techniques to a specific solution and this systematic review seeks to provide a better reading of the actual trend.
Table 2 shows a clear trend in the use of STLF forecasting methods for the residential sector. The Deep Learning methodology is the most applied and is present in 21 of the 37 articles (56.8% of the articles). AI and statistics approaches are present in 9 articles (24.3% of the articles) in a hybrid algorithm. The statistical methods are present in 18.9% of the articles, i.e., 7 articles. The other models are singularities.
Table 3 shows the methods used by categories of residences in the articles reviewed. In recent years, there has been a growing increase in the application of STLF solutions for individual residences. In 2021 and 2022, 8 articles were presented - 4 articles in each of the mentioned years. Meanwhile, in the category of agglomerates or clusters of residences, the same number has been maintained every year - between 1 to 2 articles per year.
Table 4 and Table 5 shows the most used algorithms in the 37 analyzed articles. The algorithms can be applied to various specific forecasting models and the distribution of the algorithms across the reviewed articles provides a better view of the real trend. The distribution allows identifying the algorithms used in the applications in the reviewed articles and not the number of algorithms used in each application presented in the reviewed article.
Figure 7 shows the most widely used models of AI and which are DL, LSTM, SVR, ANN, CFNN and MLP. The models that predominate are DL with 8 articles (year occurrence 2022), LSTM (year occurrence 2021), and ANN (years occurrence 2014 to 2017), with 4 articles each. The prevailing statistical models are the Bayesian and MLR with 3 articles each, in 14 articles, as shown in Figure 8.
The efficiency of each forecasting model is partially dependent on the input variables. The input variables used in the electrical load forecasting were also analyzed. Figure 9 shows the input parameters used by the authors in the forecasting models. The analysis of the revised articles found that, as was to be expected, everyone applies the energy historical data. Table 5 and Table 6 characterize the type of input variables and the number of articles that used them. It is observed that a high majority of the electricity demand forecasting in the residential sector applies to the inputs of the energy historical data (37 articles), the calendar effect (24 articles) and the weather data (22 articles). However, there is less relevance in the use of other data, such as energy tariffs, occupants’ lifestyles, household appliances and socio-economic conditions.
Table 7 shows that most of the authors of the reviewed articles applied the hourly load reference period (24 articles), from historical energy data, for the inputs to the forecasting models proposed for the energy demand of the residential sector.
3.4. Evaluation metrics used
The forecasting performance evaluation is an important part of the development of load forecasting models, to allow researchers to evaluate the model developed in the modelling phase. Over the past few decades, researchers in the forecasting community have proposed many metrics to assess the performance and accuracy of their forecasting models. In the articles analyzed, the authors proposed several performance evaluation metrics for each model. Table 8 shows that the most used metric by the authors was MAPE (24 articles), mainly due to its simplicity and transparency in understanding, its effectiveness and its usefulness for short-term forecasting. The other most used metrics are RSME, MSE and MAE.
3.5. Data pre-processing
In some of the works presented (16 articles) the authors adopted data pre-processing techniques to increase the accuracy of the forecasting models proposed by them, avoiding or reducing the noise in the data used in their models. Table 10 shows the three classifications, high (< 5%), satisfactory (5% to 20%) and low (>20%) adopted to assess the performance of the energy demand forecasting models for the residential sector. In two articles was not possible to identify whether pre-processing techniques were used in the input data. At first sight, it seems that the solution to improve the accuracy of the model proposed involves the solution of the algorithm used in the modelling rather than the pre-processing of the input data.
Most of the mentioned methods applied to the residential agglomerate have shown good performances, both AI and statistical methods. However, when applied to small clusters or individual households, performance in modelling nonlinear consumption patterns fails. The main reason pointed out is the random behaviour of residents throughout the days of the week or the failure to predict exogenous variables, such as weather data [27,28].
The analyzed articles use short-term load forecasting methods in their studies based on scenarios with historical load data between 2 weeks and 10 years. Most are sufficient to be used in the proposed load forecasting models. However, in scenarios where historical load data are scarce, the accuracy of the forecasting will drop significantly or even make the study invalid [21,29].
The load of the residential sector is a typical time series, many statistical methods have been and continue to be used for STLF solutions, such as the auto-regressive integrated moving average (ARIMA) [26], or the Bayesian [12,30] or Gaussian processes (GP) [28]. However, due to the non-linearity of the behaviour of residential energy consumption, the effects of these models are often limited, and the availability of the original time sequences is mandatory, the statistical models present in the STLF solutions are low-performance.
Machine learning algorithms, such as support vector regression (SVR) [14,15,16] and artificial neural networks (ANN) [7,17,18,19,20], have been successfully applied to deal with the nonlinear characteristics of load forecasting. In SVR, inappropriate kernel function selection or hyperparameter settings have a great impact and compromise the results of the STLF. The use of ANN to load forecasting has a certain learning and auto-adaptive ability but easily converges to the optimal local value, resulting in a large error between the predicted value and the true value. The models that employ SVRs and ANNs to predict electricity consumption in the short term, hourly or daily for cluster or individual residence typologies, most of them show satisfactory or low results. Machine learning algorithms, such as SVR [31,32,33] and ANN [22,26,34,35], have been successfully applied to deal with the nonlinear characteristics of load forecasting.
However, recently, DL have been demonstrated as efficient techniques and most of the studies analyzed have shown good results. The authors of the studies emphasize the significant performance improvements for STLF by applying DL models compared to conventional methods. The solutions with the best results and the most successful are DL models that incorporate Convolution Neural Networks (CNN) [10,21,22,23,24,25] and Long Short-Term Memory (LSTM) [24,26,27], with large-scale data, from historical data from 2 weeks to 10 years. DL approaches integrated with CNN models have been studied to predict daily or hourly energy consumption, while LSTM architectures have been studied to predict energy consumption in different periods, namely short-term, i.e., seven days or one month since it can capture long-term dependencies in time series.
The third type of data-driven approach to STLF solutions is called a hybrid method which aims to integrate various types of techniques that harness the strength of different machine learning or statistical techniques and overperform the classic or recent models. The authors of the analyzed studies sought to hybridize two or more ML [8,10,25] and statistical [28,29,30] techniques to improve the forecasting accuracy of their models.
Hybrid forecasting methods combine the advantage of one or more techniques to decrease forecasting errors in STLF solutions. These models overperform the disadvantages presented by non-hybrid structures in the search for better forecasting accuracy by increasing the robustness and efficiency of a hybrid model. Most hybrid models presented combine linear and nonlinear models for effective forecasting. The authors of the analyzed articles present hybrid models developed mainly by combining: (1) traditional statistical methods; (2) machine learning algorithms.
4. Literature review of STLF methods
The electrical short-term load forecasting usually covers the hourly forecast horizon up to one week [40]. This period is crucial in the decision-making of the electricity grid utility, from the management of the small to the large scales electricity grid, where countries and groups of countries have common energy systems, such as the European Union [40,41,42].
In the analyzed literature, electricity demand forecasting has received some attention from many researchers in different countries due to its essential contribution to the planning and management of the electrical system [12,17]. This attention has been more oriented to the agglomerate of residences. However, in the last two years, researchers have been increasing their work on individual residences, a task that induces greater variability in the results.
Generally, the load profile in the residential sector follows cyclical and seasonal patterns related to the activities of residents and generates a time series of real consumption [43]. The dynamics of this system can vary significantly during the observation period (calendar effects), depending on the nature of the system and external influences (weather, occupancy, socioeconomic environment, etc.). It promotes variations in the results accuracy of the forecasting between different samples, even when using the same forecasting model. In the last decade, STLF solutions for the residential sector have had approaches based on different models, each characterized by different advantages and disadvantages in terms of forecasting accuracy, training complexity, sensitivity to parameters and limitations in the prospect of expected forecasting [43].
In the analyzed literature, statistical and machine learning models are usually used in the forecasting of short-term load for residences, although the boundary between the two is becoming increasingly ambiguous since there is more multidisciplinary collaboration in the scientific community [44].
4.1. Synthesizing residential demand forecasting
The load forecasting of a single household is less predictable than that of a cluster or residential agglomerate, as it has a more aggregated load profile [27,45]. Some of the forecasting studies presented found that the standard forecasting error decreased with the increase in the number of households in the cluster and agglomerate since the smoothing effect of the aggregation of the residential load profile arises [27]. Some of the studies presented proposed an approach to the classification of residences according to similar load profile patterns, suggesting that they eliminate part of the noise [27]. In the analyzed articles, historical load data (37 articles), calendar effects (26 articles) and weather data (22 articles) are the main sources of inputs for load forecasting models. Others (8 articles) employ simulations of the random use of various appliances to generate demand profiles of a residence. In residential clusters, adding sociodemographic factors (3 articles) contributes to increasing the performance of the forecasting model.
In the analyzed literature, historical load and weather data are at the centre of load forecasting models [27]. The use of all available data was a common approach or, if the data set was incomplete, the longest periods with complete information were selected to build the forecasting model [27]. In the papers analyzed in this systematic review, the authors proposed forecasting models using data sets of at least 2 weeks and a maximum of 10 years.
The advantages of increasing the use of historical data are analyzed in the forecasting models developed. This analysis has the greatest importance when used in independent and dependent variable models [27]. Additional data that does not reinforce the accuracy of the forecasting model should be avoided because it can create noise, impair its performance and require more computational time and power [27]. It turns out that using a larger historical dataset reduces the error in forecasting. However, it was shown that the approach of less historical data has a lower forecasting accuracy since the reduction in the amount of historical data reduces the quality of training of forecasting models. However, multi-year data can promote similar errors of accuracy, as families generally have dynamic habits and lifestyles.
Calendar effects promote variations in the load profile related to the days of the week and holidays days or calendar periods. The use of calendar effects in load forecasting identified weekly and seasonal energy consumption patterns, as well as enabled the forecasting of peak demand [27]. In the analyzed literature, 26 articles addressed the interaction between residential load and the effects of the calendar on the forecasting models presented. To recognize the similarities in load variation at different periods of the week, they used dummy variables, mostly binary, to characterize each hour of the day, day of the week and weekend. Other authors have considered seasonal variability (winter-summer). Historical data were split into subsets to have the same day of the week or by certain hours of the day. The added calendar effects produced a smaller error in the accuracy of the forecasting models that used AI, but the statistical methods did not highlight significant differences between the proposed models.
However, to improve the performance of the proposed statistical models, the authors add other variables, such as sociodemographic factors [30], energy prices [39], occupancy behaviour [30,39], home appliances [30,39], which have brought some improvements in agglomerate residences.
Most short-term load forecasting models are typically trained and tested at forecast intervals of 15, 30, or 60 minutes. The forecast is usually provided for daily forecasting for the next day, the next 24 hours, hourly, or weekly [31]. For individual residences, the forecast provided is daily or weekly. While for cluster and agglomerate residential, the periods are usually monthly and seasonal. The choice of a 24-hour horizon may be related to the operation of the next day's electricity market [27]. For residents with self-production systems, the forecast for the next day is equally important in the decision-making process of the self-production operation [27].
4.2. Forecasting models comparative analysis
4.2.1. Artificial intelligence method
The latest developments in the fields of data science and artificial intelligence have led to research on energy consumption forecasting using the historical data produced by consumption, behaviour and weather conditions. From this perspective, several AI approaches applied to STLF were developed, which can be divided into 4 groups based on the methodological nature of the algorithms: ML, ANN, DL and hybrid [2]. A complete list of recognized articles that used AI in their forecasting methods is presented in Appendix A.
The most used AI algorithms are ANN, SVR and DL models [46]. ANN has very good results in nonlinear systems and is widely used in STLF solutions in load forecasting [46]. However, ANN suffers from a limitation of settling in the local minima and overfitting problems [46]. To avoid overfitting, the authors increased the amount of data, dropout others and trained with momentum [12]. Training a neural network consists of modifying its parameters through gradient descent optimization, which minimizes a given loss function that quantifies the network's accuracy in performing the desired task [43] reducing the training error [47]. SVR is a statistical machine learning approach that has been successful in electricity load forecasting [46]. SVR can accurately obtain the best overall solution in the sample by the principle of structural risk minimization. However, SVR works well with a small sample of data but performs worse when using larger datasets [32]. DL allows modelling high-level abstractions and recognising, and extracting hidden invariant structures and intrinsic characteristics of the data [2]. However, this flexibility has a cost, namely, the DL architecture requires a lot of data to overcome other approaches, training is computationally intensive, and its interpretation is not easy [12]. It works well on certain types of STLF solutions, and it seems that arbitrarily increasing the depth of an ANN may not always produce the best results [12].
4.2.1.1. ML
The ML approach includes a set of methods that try to learn from historical data [10]. This group of AI techniques involves models that can automatically identify patterns in the data and then use them to predict and develop techniques that contribute to decision-making in an uncertain environment [10]. The application of ML models in STLF emerged to identify the correlation between input and output data and has been used to address the drawbacks presented by traditional techniques [2].
4.2.1.2. ANN
The ANN is widely used in STLF solutions due to its high accuracy in forecasting [22]. For this reason, it has gained great popularity to solve forecasting problems in STLF solutions [5]. ANN is an approach inspired by the behaviour of human brain neurons. ANN is an information processing system inspired by how biological nervous systems are interconnected with each other [5]. ANN is a model that uses artificial neurons that are composed of layers within the network. The typical ANN has several input neurons and typically a single output neuron with several hidden layers and has a connection between them that is given a specific weight. The ANN model uses several supervised examples to learn from the input dataset to later be used to label new datasets with similar and never-before-seen characteristics [5].
The main feature of the neuronal network is its ability to learn, automatically, from the environment and adjusts its performance through learning [7]. ANNs can converge easily after training with the appropriate number of samples. ANNs can produce an output with a very small error (or almost that) with new input data without ever having trained them before. Another interesting fact is that ANN has a tolerance for noisy data [7].
The use of learning algorithms enables ANNs to approach any continuous function, to any desired precision, by creating internal ANN representations avoiding the use of explicit mathematical models to illustrate the input-output relationships [7].
4.2.1.3. DL
DL based models are a class of ML algorithms, and in recent years, has been widely used in STLF [46]. DL systems are based on the ANN, and in time series modelling, recurrent neural network (RNN) is the most widely used DL architecture for residence load forecasting [24,36]. RNNs fall under the unsupervised learning category [10,12,33,48]. In unsupervised learning methods, only the inputs are given. RNN put the state values of the last neurons in the next neurons to perform time series data mining and has provided new approaches to STLF solutions. RNN demonstrated its ability to forecasting medium and long-term electricity consumption at 1-hour intervals of residences, which results showed that it had relative errors lower than the common multilayer networks. However, in training, RNNs are prone to gradient problems, limiting their application in load forecasting systems [46].
Given this limitation and to better deal with long-term dependencies, LSTM networks were proposed in exchange for a higher computational cost [46]. To prevent the gradient from disappearing or exploding after multiple iterations of time steps, traditionally hidden nodes are replaced with memory modules [46]. CNN network can identify nonlinear relationships between adjacent samples in local regions. CNN is a supervised learning algorithm and can be used when sufficient data can be labelled [10]. In supervised learning, the goal is to learn a mapping between the input vector and the outputs, if there is an existing labelled set of input-output pairs. CNN is skilled at assembling the characteristics and extracting complex relationships using convolutional operators and nonlinear activation functions in the hidden layers [22].
LSTM and CNN are two different neural network architectures that can be combined to overcome some of the limitations of each approach. For example, LSTM networks are particularly good at handling long-term dependencies in sequences of data, but can be computationally expensive. On the other hand, CNNs are better suited for identifying non-linear relationships in local regions of data, but require labelled data for supervised learning [36].
By combining LSTM and CNN architectures, it is possible to take advantage of the strengths of each approach while mitigating their weaknesses. A CNN, for example, can be used as a feature extractor for picture data, with the retrieved features subsequently passed into an LSTM for sequence processing. To better handle long-term dependencies in the data, the LSTM can take advantage of the rich and sophisticated feature representations learned by CNN. The combination of the LSTM and CNN architectures enables more robust and adaptable machine-learning models that can handle a variety of tasks, including natural language processing and image recognition. The combination of LSTM and CNN architectures enables higher accuracy and generalization performance in a wide range of applications [36].
4.2.1.4. SVM
In machine learning, the SVM is a supervised learning method with associated learning algorithms that analyze data for classification and regression analysis [34,44]. SVM is one of the most robust forecasting methods, based on statistical learning structures [1].
The SVM analyzes the data and classifies it into one of two categories. The task of the SVM is to determine which category a new data point belongs to, making it a non-binary linear classifier type [3]. It is trained with a series of data already classified into two categories, building the model as it is initially trained and generating a map of the data classified. The SVM both performs linear sorting and can efficiently perform a nonlinear classification, using the technique called the kernel, implicitly mapping its inputs into high-dimension resource spaces [29,31,49].
The main benefits of the SVM approach are that it is noise robust and reduces overfitting and underfitting while meeting the overall minimums of the objective function. The SVM handles excessive and insufficient adjustment of the training samples, minimizing training error and regularization terms.
4.2.1.5. Hybrid algorithms
The purpose of hybrid algorithms is to develop a forecasting model using optimization algorithms or pre-processing techniques to optimize the model parameters, leading to methodologies for attenuating or eliminating noise in the pre-processing of the electrical load and applying relevant characteristics, in the time series by decomposing it into the original series. Most classic and original models have flaws, and the intended level of precision is not reached, so the researchers propose a hybrid model to take advantage of each model that composes it and smooth out the forecasting errors from the original forecasting model [50]. A complete list of recognized articles that used both methods in their forecasting methods is presented in Appendix B.
4.2.2. Statistical methods
In recent decades, extensive research has been done on the development of models based on statistical methods to define methodologies applied to the forecasting of electricity demand in STLF. The models used in statistical methods correlate energy consumption or energy index with influence variables [51,52]. These models are developed from sufficient time series historical data and, like the ML models, are subsequently trained. Among these historical data, simplified variables such as weather data are used to correlate energy consumption to obtain an energy characteristic that stands out [51]. The selection of the models of the statistical method depends on the variation of the input data and the expected period. However, the statistical method is unable to deal with the dynamics system effectively due to nonlinearities induced by nonlinear data, such as calendar effect (weekday, weekend) or seasonality, which affect the electrical load profile [26,53].
The most used models for analysis and forecasting of time series are the Autoregressive Integrated Moving Average (ARIMA) and SARIMA which is an ARIMA where the letter “S” stands for seasonality [26,53]. The autoregressive model (AR) is a linear regression of the current value based on one or more previous values. Like the AR model, the moving average (MA) is a linear regression [19]. The difference lies in the regression of current values with noise or errors of one or more past values [19]. While SARIMA needs only the past value of a non-stationary time series, it is adaptable and can handle seasonality [19].
ARIMA is the most popular and mature among all other approaches due to the adaptability of linear patterns and having a simplified algorithm. However, the residential electricity consumption profile is a non-stationary profile [53]. The ARIMA and SARIMA models use the lagged mean values of STLF time series data to convert non-stationary data to stationary data.
In the analyzed literature, other statistical models and their variation are also studied, such as adaptations to Bayesian inference, Gaussian processes and wavelets. However, even with the adjustments introduced by the researchers, the statistical algorithms remain limited in identifying temporal variations and non-linear patterns of residential electrical load as required by STLF solutions and are inappropriate for an individual residence. A complete list of recognized articles that used statistical methods in their forecasting methods is presented in Appendix C.
4.2.3. Time series analysis
Statistical models are the simplest that use time series trend analysis to forecast future energy needs. In the analyzed studies, models are proposed for STLF, which varies from one hour to one week and the input variables used are times series of historical data of electricity consumption, weather, appliances, and socio-economic conditions. Medium-term forecasts are usually from one week to a year. Although depending on the forecasting granularity requested, in general, the models developed based on statistical methods for longer-term periods (> 1 year), have uninteresting performances, consume a large amount of computation time, and require a good understanding of the underlying statistics.
4.2.4. Performance analysis metrics
For performance evaluation, the various articles apply multiple metrics of statistical evaluation methods for error assessment, namely MAPE, RSME and MAE. However, several authors express concerns that traditional approaches to error assessment are not adequate in predicting household load due to a high error in values close to zero or scale problems due to differences in load profiles between households [27]. MAPE's limitations, such as difficulties in handling small and zero denominators, are not very relevant to traditional load forecasting problems, because the aggregate load is rarely zero or close to a very small number.
5. Conclusions
From the large and diversified literature analyzed for STLF solutions in the residential sector, we highlight the modelling approaches for the electricity demand that is a fundamental tool of greatest interest to the energy sector. In the last decade, there has been an increase in model proposals with a variety of formulations and applications, and a wide temporal and spatial scale. The modelling models proposed and analyzed have their merit and advantages in each application case in the evaluation of the best methods, algorithms and metrics of accuracy performance. This systematic review seeks to provide a comprehensive review of the modelling literature for STLF solutions in the residential sector.
The present systematic review of the analyzed literature sought to identify which of the modelling methods presents the best performance and accuracy in predicting future energy demand in the residential sector. The direct comparison of the cases presented is difficult due to the numerous variables that influence the performance of each model. Most models are implemented for different locations, in different periods, with more or less good quality data and supported by scripts more or less well written. Even the performance evaluation metrics for determining the accuracy of the models are different (MAPE, MAE, RSME, MSE, and others) which makes the comparison harder.
Given the number of articles published, it is acceptable to recognize that recurrence in the use of forecasting models reflects good practices. Some models seem to be favoured for forecasts of electricity consumption and load demand, such as time series and ML models. It is noteworthy that a large number of different ML models are being used, but it seems that some techniques are more suitable than others for specific tasks. They are mainly used in short-term forecasting, where patterns of electricity load and energy consumption are more complex.
Statistical methods are often used for longer-period forecasting, where periodicity and changes are less significant. They are often associated with socio-economic variables, tariffs and appliances that reflect the correlation between these variables and electricity consumption over longer periods. Statistical models are relatively easy to implement but have the disadvantages of lacking precision and flexibility.
AI models are suitable for solving nonlinear problems, which makes them very interesting in applying energy demand forecasting in the residential sector. They provide very accurate forecasting solutions as long as the model selection and parameter configuration are well executed. The disadvantages of AI models are that they require enough historical data to perform well and can be extremely complex to implement and difficult to interpret results.
The most commonly used models in AI are DLs, RNAs and SVMs. They are configured primarily with past energy consumption values, weather data, weekdays and occupancy levels. The decomposition and classification of days of the week are particularly useful when the solution depends heavily on occupancy or when the time series has been decomposed into underlying patterns. Data decomposition and classification allow splitting complex series into simpler series and thus providing better forecasting performance.
To avoid noise in the time series used in the forecasting models, the authors also recommended a pre-analysis and pre-processing of the input data to eliminate absences and atypical values, by smoothing the time series of errors and interpolating the missing values.
When analyzing the preparation of the academic and scientific papers presented, the collection of information was a challenge and difficult. All authors declare that, when presenting their work, they explicitly provide the framework for implementing the forecasting model (period, time resolution, scale, inputs, outputs, pre-processing...). To facilitate direct comparison among the papers, authors should use a pattern of metrics for measuring the equivalent result error in all studies. However, this would be impractical and, hence, it should be desirable to have a unified data set together with a set of benchmarks with well-defined metrics for a clear comparison of all the modelling techniques and the corresponding algorithms.
The future of modelling for STLF solutions in energy demand for the residential sector seems to be the use of the AI method based on ML models in conjunction with improved data patterns and computational advances to estimate the demand for electricity from a single home, cluster or agglomerate using dependent variables such as time series of the history of electricity load, time series of past weather data, independent variables such as the effect of the weekly and annual calendar, level of occupancy and household appliances. This model would capture the complexity inherent to the daily variability promoted by the occupant’s behaviour during the hours of day and night, weekdays and weather conditions. This would allow the optimization of the management and operating costs of the electricity grid. It would also allow for optimization in the use of primary resources and consequently to the reduction of GHG emissions, thus contributing to the environmental targets assumed by the international community at United Nations guidelines.
The forecasting modelling of the electricity demand in the field of STLF for the residential sector faces some challenges, including technical obstacles related to the complexity of the methods and uncertainty of the models and variables to be used. Growing availability and opportunity in methods and technology, including new data sources such as cloud computing and model-adjusted universal metrics, can contribute to enhancing forecasting quality.
The forecasting modelling of the demand of the electric load in STLF systems for the residential sector undoubtedly has great potential and should face several other new challenges that are not addressed here. However, this review has attempted to bring together a diverse body of practices in a recognizable field, to which researchers and professionals can contribute and develop even more.
Acknowledgments
This work was supported by FCT, through IDMEC, under LAETA, project UIDB/50022/2020 and FCT under the ICT (Institute of Earth Sciences) project UIDB/04683/2020.
Appendix A

Table A1.
A complete list of recognized articles which used AI methods in their forecasting methods. (for N = 21 papers).
Table A1.
A complete list of recognized articles which used AI methods in their forecasting methods. (for N = 21 papers).
| Year | Articles | City | Country | Region | Historical data | Category | Forecasting models | |||||
|---|---|---|---|---|---|---|---|---|---|---|---|---|
| 2022 | [38] | Journal | Lahore | Pakistan | Asia | > 1 year | 2010 - 2019 | Agglomerate | DL | CNN | LSTM | |
| 2022 | [54] | Journal | Texas | USA | North America | > 1 year | 2016 - 2017 | Individual | DL | KNN | Isolation forest | |
| 2022 | [3] | Journal | Sceaux | France | Europe | > 1 year | 2006 - 2010 | Individual | DL | CNN | LSTM | |
| 2022 | [9] | Journal | Osaka | Japan | Asia | > 1 year | 2013 - 2014 | Clusters | DL | LSTM | CNN | Others |
| 2022 | [21] | Journal | Los Angeles | USA | North America | ≤ 1 year | 2012 | Individual | DL | LSTM | BPNN | |
| 2022 | [17] | Journal | Mysore | India | Asia | 1 month | Feb 2020 | Individual | CFNN | LM | ||
| 2022 | [24] | Journal | Sceaux | France | Europe | > 1 year | 2006 - 2010 | Clusters | DL | |||
| 2021 | [18] | Journal | - | Canada | North America | > 1 year | 2012 - 2016 | Individual | DL | CNN | SVR | |
| 2021 | [55] | Journal | - | Ireland | Europe | > 1 year | 2011 - 2013 | Individual | LSTM | |||
| 2021 | [56] | Journal | New York | USA | North America | ≤ 1 year | 2019 | Clusters | LSTM | SVR | ||
| 2021 | [36] | Conference | Paris | France | Europe | > 1 year | 2006 - 2010 | Individual | LSTM | CNN | ||
| 2021 | [47] | Journal | Faisalabad | Pakistan | Asia | > 1 year | 2015 - 2017 | Agglomerate | LSTM | SVR | LM | |
| 2021 | [57] | Journal | - | Greece | Europe | ≤ 1 year | Spring 2018 | Individual | LSTM | MLP | SVR | Others |
| 2020 | [37] | Conference | Yan'na | China | Asia | ≤ 1 year | 2018 | Clusters | DL | LSTM | ||
| 2017 | [58] | Journal | - | - | - | > 1 year | 2006 - 2010 | Clusters | ANN | SVR | ||
| 2017 | [20] | Conference | - | - | North America | > 1 year | 1985 - 1990 | Agglomerate | ANFYS | KNN | ||
| 2016 | [22] | Conference | - | - | - | ≤ 1 year | 2012 | Individual | ANN | LM | ||
| 2016 | [32] | Conference | Surrey | Canada | North America | ≤ 1 year | 2014 | Clusters | SVR | |||
| 2015 | [53] | Conference | Bangladesh | Asia | ≤ 1 year | 2013 | Individual | ANN | ||||
| 2014 | [31] | Journal | New York | USA | North America | ≤ 1 year | 2012 | Individual | SVR | |||
| 2014 | [35] | Conference | Lisbon | Portugal | Europe | > 1 year | 2000 - 2001 | Individual | ANN | MLP | LM | |
Appendix B
Table A2.
A complete list of recognized articles which used both methods in their forecasting methods. (for N = 9 papers).
Table A2.
A complete list of recognized articles which used both methods in their forecasting methods. (for N = 9 papers).
| Year | Articles | City | Country | Region | Historical data | Category | Forecasting method | ||||||
|---|---|---|---|---|---|---|---|---|---|---|---|---|---|
| 2022 | [11] | Journal | Sceaux | France | Europe | > 1 year | 2006 - 2010 | Individual | DL | LSTM | SVR | ||
| 2021 | [8] | Journal | - | Germany | Europe | > 1 year | 2011 - 2016 | Clusters | DL | LSTM | SVR | ARIMA | MLR |
| 2021 | [59] | Journal | - | Austria | Europe | > 1 year | 2016 - 2017 | Individual | MLP | LR | ARIMA | ||
| 2020 | [5] | Conference | Lahore | Pakistan | Asia | ≤ 1 year | 2018 - 2019 | Clusters | ANN | SVR | MLR | ||
| 2020 | [16] | Conference | London | UK | Europe | > 1 year | 2012 - 2014 | Clusters | MLP | LSTM | SVR | LR | Seq2Seq network |
| 2019 | [34] | Journal | - | - | - | ≤ 1 year | 2015 - 2016 | Agglomerate | DL | ANN | RF | NARX | Nestrov |
| 2017 | [27] | Journal | NS Wales | Australia | Australia | > 1 year | 2013 - 2015 | Agglomerate | ANN | RNN | SVR | MLR | RT |
| 2016 | [60] | Conference | - | - | - | > 1 year | 2011 - 2014 | Individual | ANN | MLR | |||
| 2014 | [26] | Conference | - | Bangladesh | Asia | ≤ 1 year | 2013 | Individual | ANN | ARIMA | |||
Appendix C
Table A3.
A complete list of recognized articles which used statistical methods in their forecasting methods. (for N = 7 papers).
Table A3.
A complete list of recognized articles which used statistical methods in their forecasting methods. (for N = 7 papers).
| Year | Articles | City | Country | Region | Historical data | Category | Forecasting models | |||||
|---|---|---|---|---|---|---|---|---|---|---|---|---|
| 2022 | [12] | Journal | Ontario | Canada | North America | > 1 year | 2013 - 2019 | Agglomerate | Bayesian | NARX | ARIMA | LR |
| 2022 | [61] | Journal | Quebec | Canada | North America | ≤ 1 year | 2017 - 2018 | Clusters | Bayesian | GP | Monte Carlo Markov Chain | |
| 2021 | [39] | Journal | - | Ireland | Europe | > 1 year | 2009 - 2010 | Clusters | ARIMA | Wavelet | Others | |
| 2020 | [30] | Journal | - | Ireland | Europe | > 1 year | 2009 - 2010 | Agglomerate | Bayesian | |||
| 2020 | [62] | Conference | - | - | - | - | - | Clusters | AR | ARIMA | Hot-Winters | |
| 2016 | [13] | Conference | Lisbon | Portugal | Europe | > 1 year | 2000 - 2001 | Individual | FFT | GRG | ||
| 2016 | [23] | Conference | - | - | - | - | - | Agglomerate | Calculus | |||
References
- A. S. Ahmad et al., “A review on applications of ANN and SVM for building electrical energy consumption forecasting,” Renewable and Sustainable Energy Reviews, vol. 33. pp. 102–109, 2014. [CrossRef]
- C. Deb, F. Zhang, J. Yang, S. E. Lee, and K. W. Shah, “A review on time series forecasting techniques for building energy consumption,” Renewable and Sustainable Energy Reviews, vol. 74. pp. 902–924, 2017. [CrossRef]
- M. Aouad, H. Hajj, K. Shaban, R. A. Jabr, and W. El-Hajj, “A CNN-Sequence-to-Sequence network with attention for residential short-term load forecasting,” Electr. Power Syst. Res., vol. 211, p. 108152, 2022. [CrossRef]
- A. R. Khan, A. Mahmood, A. Safdar, Z. A. Khan, and N. A. Khan, “Load forecasting, dynamic pricing and DSM in smart grid: A review,” Renew. Sustain. Energy Rev., vol. 54, pp. 1311–1322, 2016. [CrossRef]
- A. Nadeem and N. Arshad, “Short term load forecasting on PRECON dataset,” in 2019 International Conference on Advances in the Emerging Computing Technologies, AECT 2019, 2020.
- F. M. Rodrigues, “Modelação do Consumo de Energia Elétrica para Previsão de Curto Prazo no Setor Doméstico,” Universidade de Lisboa - Instituto Superior Técnico, 2019.
- U. Javed et al., “Exploratory data analysis based short-term electrical load forecasting: A comprehensive analysis,” Energies, vol. 14, no. 17, pp. 1–22, 2021. [CrossRef]
- A. Groß, A. Lenders, F. Schwenker, D. A. Braun, and D. Fischer, “Comparison of short-term electrical load forecasting methods for different building types,” Energy Informatics, vol. 4, 2021. [CrossRef]
- A. Shaqour, T. Ono, A. Hagishima, and H. Farzaneh, “Electrical demand aggregation effects on the performance of deep learning-based short-term load forecasting of a residential building,” Energy AI, vol. 8, p. 100141, 2022. [CrossRef]
- I. Antonopoulos et al., “Artificial intelligence and machine learning approaches to energy demand-side response: A systematic review,” Renew. Sustain. Energy Rev., vol. 130, p. 109899, 2020. [CrossRef]
- S. Atef, K. Nakata, and A. B. Eltawil, “A deep bi-directional long-short term memory neural network-based methodology to enhance short-term electricity load forecasting for residential applications,” Comput. Ind. Eng., vol. 170, p. 108364, 2022. [CrossRef]
- N. Sultana, S. M. Z. Hossain, S. H. Almuhaini, and D. Dustegor, “Bayesian Optimization Algorithm-Based Statistical and Machine Learning Approaches for Forecasting Short-Term Electricity Demand,” Energies, vol. 15, no. 3425, 2022. [CrossRef]
- F. Rodrigues, C. Cardeira, J. M. F. Calado, and R. Melício, “Load Profile Analysis Tool for Electrical Appliances in Households,” in Energy Economics Iberian Conference, EEIC 2016, 2016, pp. 1–8.
- F. M. Bianchi, E. Maiorino, M. C. Kampffmeyer, A. Rizzi, and R. Jenssen, An overview and comparative analysis of Recurrent Neural Networks for Short Term Load Forecasting, no. January. 2017.
- I. K. Nti, M. Teimeh, O. Nyarko-Boateng, and A. F. Adekoya, “Electricity load forecasting: a systematic review,” J. Electr. Syst. Inf. Technol., vol. 7, no. 1, 2020. [CrossRef]
- T. T. Q. Nguyen, T. P. T. Tran, V. Debusschere, C. Bobineau, and R. Rigo-Mariani, “Comparing High Accurate Regression Models for Short-term Load Forecasting in Smart Buildings,” in IECON Proceedings (Industrial Electronics Conference), 2020, vol. 2020-Octob, pp. 1962–1967.
- Z. Tabassum and B. S. C. Shastry, “Short Term Load Forecasting of Residential and Commercial Consumers of Karnataka Electricity Board using CFNN,” Int. J. Electr. Electron. Res., vol. 10, no. 2, pp. 347–352, 2022. [CrossRef]
- M. Imani, “Electrical load-temperature CNN for residential load forecasting,” Energy, vol. 227, 2021. [CrossRef]
- C. Kuster, Y. Rezgui, and M. Mourshed, “Electrical load forecasting models: A critical systematic review,” Sustain. Cities Soc., vol. 35, no. July, pp. 257–270, 2017. [CrossRef]
- M. A. Nokar, F. Tashtarian, and M. H. Y. Moghaddam, “Residential power consumption forecasting in the smart grid using ANFIS system,” in 7th International Conference on Computer and Knowledge Engineering, ICCKE 2017, 2017, vol. 2017, pp. 111–118.
- Y. Lu, G. Wang, and S. Huang, “A short-term load forecasting model based on mixup and transfer learning,” Electr. Power Syst. Res., vol. 207, p. 107837, 2022. [CrossRef]
- S. M. Sulaiman, P. A. Jeyanthy, and D. Devaraj, “Artificial neural network based day ahead load forecasting using Smart Meter data,” 2016 - Bienn. Int. Conf. Power Energy Syst. Towar. Sustain. Energy, PESTSE 2016, pp. 1–6, 2016.
- K. Humphreys and J. Y. Yu, “Crowdsourced electricity demand forecast,” in IEEE 2nd International Smart Cities Conference: Improving the Citizens Quality of Life, ISC2 2016 - Proceedings, 2016.
- M. Abdel-Basset, H. Hawash, K. Sallam, S. S. Askar, and M. Abouhawwash, “STLF-Net: Two-stream deep network for short-term load forecasting in residential buildings,” J. King Saud Univ. - Comput. Inf. Sci., vol. 34, no. 7, pp. 4296–4311, 2022. [CrossRef]
- M. Ouzzani, H. Hammady, Z. Fedorowicz, and A. Elmagarmid, “Rayyan-a web and mobile app for systematic reviews,” Syst. Rev., vol. 5, no. 1, p. 210, 2016.
- K. M. U. Ahmed, M. Ampatzis, P. H. Nguyen, and W. L. Kling, “Application of time-series and Artificial Neural Network models in short term load forecasting for scheduling of storage devices,” in 49th International Universities Power Engineering Conference, UPEC 2014, 2014.
- P. Lusis, K. R. Khalilpour, L. Andrew, and A. Liebman, “Short-term residential load forecasting: Impact of calendar effects and forecast granularity,” Appl. Energy, vol. 205, pp. 654–669, 2017. [CrossRef]
- K. Dab, K. Agbossou, N. Henao, Y. Dubé, S. Kelouwani, and S. S. Hosseini, “A compositional kernel based gaussian process approach to day-ahead residential load forecasting,” Energy Build., vol. 254, p. 111459, 2022. [CrossRef]
- A. Al Mamun, M. Sohel, N. Mohammad, M. S. Haque Sunny, D. R. Dipta, and E. Hossain, “A Comprehensive Review of the Load Forecasting Techniques Using Single and Hybrid Predictive Models,” IEEE Access, vol. 8, pp. 134911–134939, 2020. [CrossRef]
- M. Bessani, J. A. D. Massignan, T. M. O. Santos, J. B. A. London, and C. D. Maciel, “Multiple households very short-term load forecasting using bayesian networks,” Electr. Power Syst. Res., vol. 189, p. 106733, 2020. [CrossRef]
- R. K. Jain, K. M. Smith, P. J. Culligan, and J. E. Taylor, “Forecasting energy consumption of multi-family residential buildings using support vector regression: Investigating the impact of temporal and spatial monitoring granularity on performance accuracy,” Appl. Energy, vol. 123, pp. 168–178, 2014. [CrossRef]
- J. Dhillon, S. A. Rahman, S. U. Ahmad, and M. J. Hossain, “Peak electricity load forecasting using online support vector regression,” in Canadian Conference on Electrical and Computer Engineering, 2016, vol. 2016-Octob.
- L. Li, C. J. Meinrenken, V. Modi, and P. J. Culligan, “Short-term apartment-level load forecasting using a modified neural network with selected auto-regressive features,” Appl. Energy, vol. 287, p. 116509, 2021. [CrossRef]
- S. V. Oprea and A. Bara, “Machine Learning Algorithms for Short-Term Load Forecast in Residential Buildings Using Smart Meters, Sensors and Big Data Solutions,” IEEE Access, vol. 7, pp. 177874–177889, 2019.
- F. Rodrigues, C. Cardeira, and J. M. F. Calado, “The daily and hourly energy consumption and load forecasting using artificial neural network method: A case study using a set of 93 households in Portugal,” in Energy Procedia, 2014, vol. 62, pp. 220–229. [CrossRef]
- X. Guo, Y. Gao, Y. Li, D. Zheng, and D. Shan, “Short-term household load forecasting based on Long- and Short-term Time-series network,” ICPE 2020-The Int. Conf. Power Eng., vol. 7, pp. 58–64, 2021. [CrossRef]
- H. Zhao, X. Li, and Y. Ren, “A big data framework for short-term load forecasting using heterogenous data,” in Proceedings - 2020 International Conference on Virtual Reality and Intelligent Systems, ICVRIS 2020, 2020, pp. 490–494.
- U. Javed et al., “A novel short receptive field based dilated causal convolutional network integrated with Bidirectional LSTM for short-term load forecasting,” Expert Syst. Appl., vol. 205, p. 117689, 2022. [CrossRef]
- U. Amato, A. Antoniadis, I. De Feis, Y. Goude, and A. Lagache, “Forecasting high resolution electricity demand data with additive models including smooth and jagged components,” Int. J. Forecast., vol. 37, no. 1, pp. 171–185, 2021. [CrossRef]
- A. Inteha and Nahid-Al-Masood, “A GRU-GA Hybrid Model Based Technique for Short Term Electrical Load Forecasting,” Int. Conf. Robot. Electr. Signal Process. Tech., pp. 515–519, 2021.
- G. Hafeez, N. Javaid, M. Riaz, A. Ali, K. Umar, and Z. Iqbal, Day Ahead Electric Load Forecasting by an Intelligent Hybrid Model Based on Deep Learning for Smart Grid, vol. 993. Springer International Publishing, 2020.
- G. Hafeez, K. S. Alimgeer, and I. Khan, “Electric load forecasting based on deep learning and optimized by heuristic algorithm in smart grid,” Appl. Energy, vol. 269, 2020. [CrossRef]
- F. M. Bianchi, E. Maiorino, M. C. Kampffmeyer, A. Rizzi, and R. Jenssen, An overview and comparative analysis of Recurrent Neural Networks for Short Term Load Forecasting, no. November. 2017.
- T. Hong and S. Fan, “Probabilistic electric load forecasting: A tutorial review,” Int. J. Forecast., vol. 32, no. 3, pp. 914–938, 2016. [CrossRef]
- J. Torriti, “A review of time use models of residential electricity demand,” Renew. Sustain. Energy Rev., vol. 37, pp. 265–272, Sep. 2014. [CrossRef]
- W. Yue, Q. Liu, Y. Ruan, F. Qian, and H. Meng, “A prediction approach with mode decomposition-recombination technique for short-term load forecasting,” Sustain. Cities Soc., vol. 85, p. 104034, 2022. [CrossRef]
- N. Mughees, S. A. Mohsin, A. Mughees, and A. Mughees, “Deep sequence to sequence Bi-LSTM neural networks for day-ahead peak load forecasting,” Expert Syst. Appl., vol. 175, p. 114844, 2021.
- A. Narayan and K. W. Hipely, “Long short term memory networks for short-term electric load forecasting,” 2017 IEEE Int. Conf. Syst. Man, Cybern. SMC 2017, vol. 2017, pp. 2573–2578, 2017.
- S. R. Khan and S. Noor, “Short Term Load Forecasting using SVM based PUK kernel,” 2020 3rd Int. Conf. Comput. Math. Eng. Technol. Idea to Innov. Build. Knowl. Econ. iCoMET 2020, 2020.
- P. Jiang, F. Liu, and Y. Song, “A hybrid forecasting model based on date-framework strategy and improved feature selection technology for short-term load forecasting,” Energy, vol. 119, pp. 694–709, 2017. [CrossRef]
- H. X. Zhao and F. Magoulès, “A review on the prediction of building energy consumption,” Renew. Sustain. Energy Rev., vol. 16, no. 6, pp. 3586–3592, 2012. [CrossRef]
- D. G. da Silva, M. T. B. Geller, M. S. dos S. Moura, and A. A. de M. Meneses, “Performance evaluation of LSTM neural networks for consumption prediction,” e-Prime - Adv. Electr. Eng. Electron. Energy, vol. 2, p. 100030, 2022. [CrossRef]
- K. M. U. Ahmed, M. A. A. Amin, M. T. Rahman, and C. for N. S. and E. R. (CNSER), “Application of short term energy consumption forecasting for household energy management system,” in 3rd International Conference on Green Energy and Technology, ICGET 2015, 2015.
- A. Forootani, M. Rastegar, and A. Sami, “Short-term individual residential load forecasting using an enhanced machine learning-based approach based on a feature engineering framework: A comparative study with deep learning methods,” Electr. Power Syst. Res., vol. 210, p. 108119, 2022. [CrossRef]
- S. Wang, X. Deng, H. Chen, Q. Shi, and D. Xu, “A bottom-up short-term residential load forecasting approach based on appliance characteristic analysis and multi-task learning,” Electr. Power Syst. Res., vol. 196, p. 107233, 2021. [CrossRef]
- L. Li, C. J. Meinrenken, V. Modi, and P. J. Culligan, “Short-term apartment-level load forecasting using a modified neural network with selected auto-regressive features,” Appl. Energy, vol. 287, p. 116509, 2021. [CrossRef]
- P. Koukaras, N. Bezas, P. Gkaidatzis, D. Ioannidis, D. Tzovaras, and C. Tjortjis, “Introducing a novel approach in one-step ahead energy load forecasting,” Sustain. Comput. Informatics Syst., vol. 32, p. 100616, 2021. [CrossRef]
- K. Amarasinghe, D. L. Marino, and M. Manic, “Deep neural networks for energy load forecasting,” IEEE Int. Symp. Ind. Electron., pp. 1483–1488, 2017. [CrossRef]
- A. V Kychkin and G. C. Chasparis, “Feature and model selection for day-ahead electricity-load forecasting in residential buildings,” Energy Build., vol. 249, p. 111200, 2021. [CrossRef]
- S. K. Aggarwal and M. Kumar, “ANN based residential demand forecasting using weather and special day information,” in India International Conference on Power Electronics, IICPE, 2016, vol. 2016-Novem.
- K. Dab, K. Agbossou, N. Henao, Y. Dubé, S. Kelouwani, and S. S. Hosseini, “A compositional kernel based gaussian process approach to day-ahead residential load forecasting,” Energy Build., vol. 254, p. 111459, 2022. [CrossRef]
- A. V. Kychkin and G. C. Chasparis, “Feature extraction for day-ahead electricity-load forecasting in residential buildings,” IFAC-PapersOnLine, vol. 53, no. 2, pp. 13094–13100, 2020. [CrossRef]
Figure 1.
Distribution of STLF articles published in the last 3 decades.
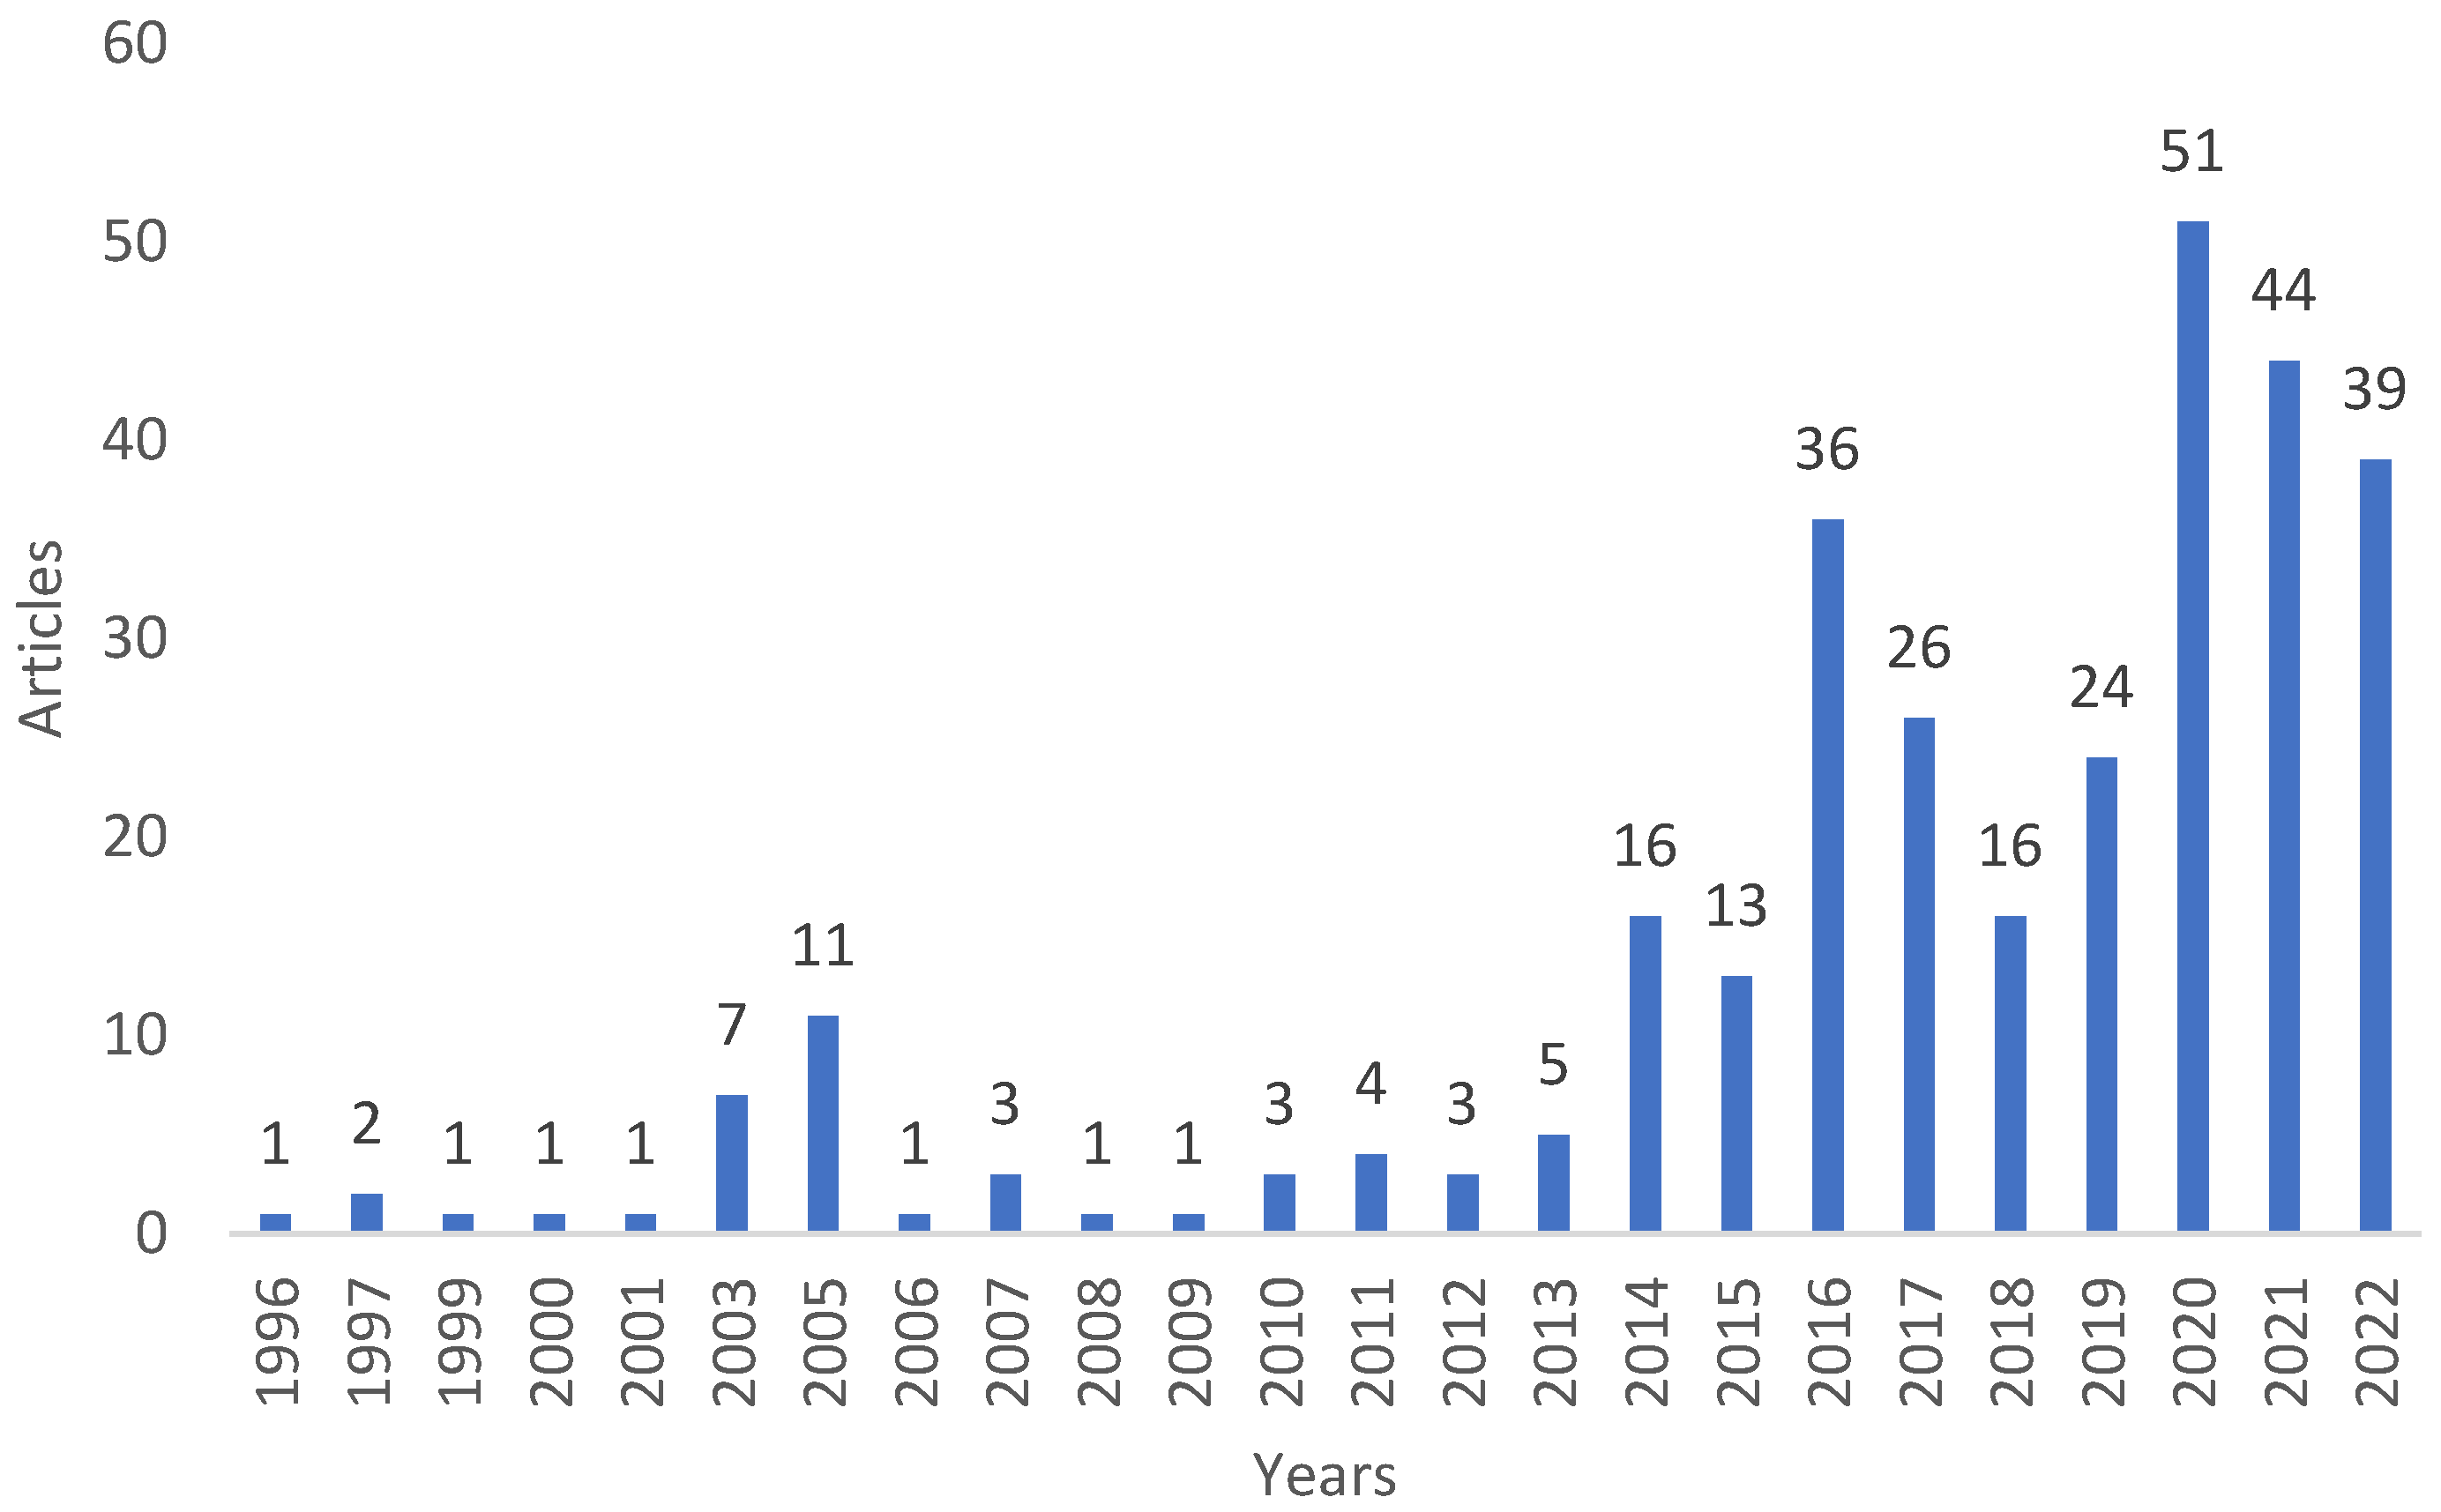
Figure 2.
The PRISMA flow diagram used for the selection procedure.
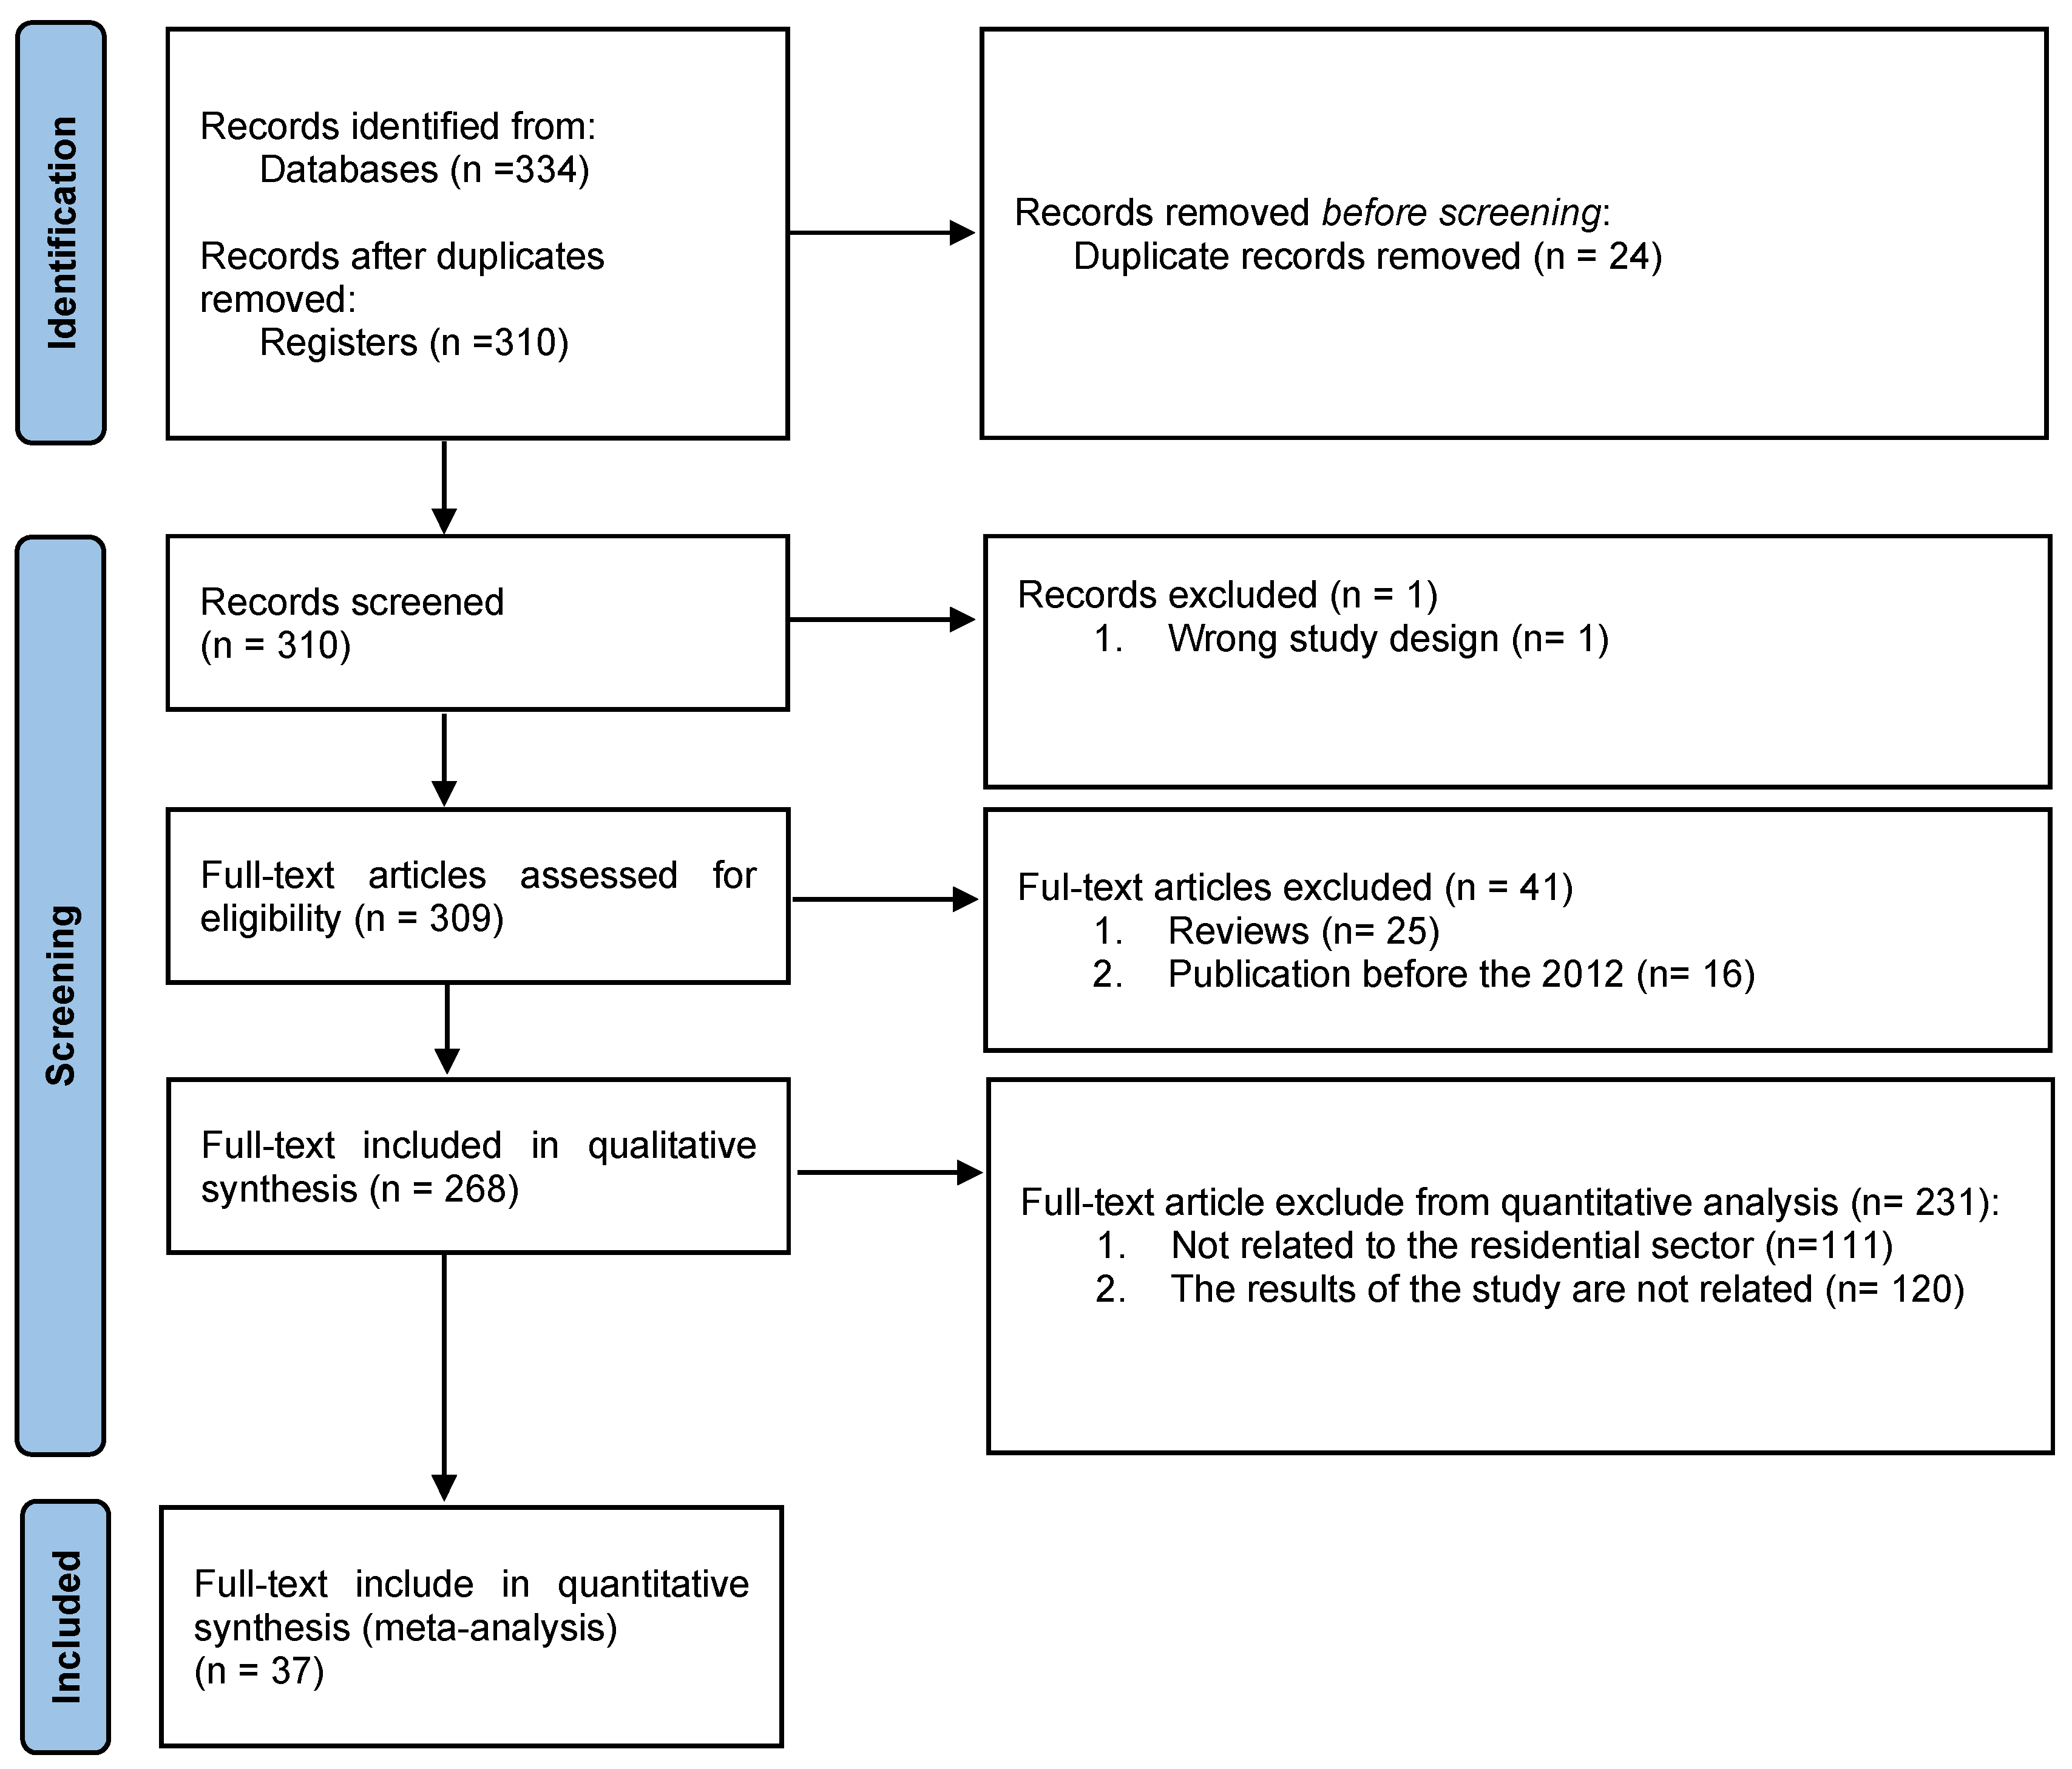
Figure 6.
Evolution of the methods used in the STLF research for the residential sector.
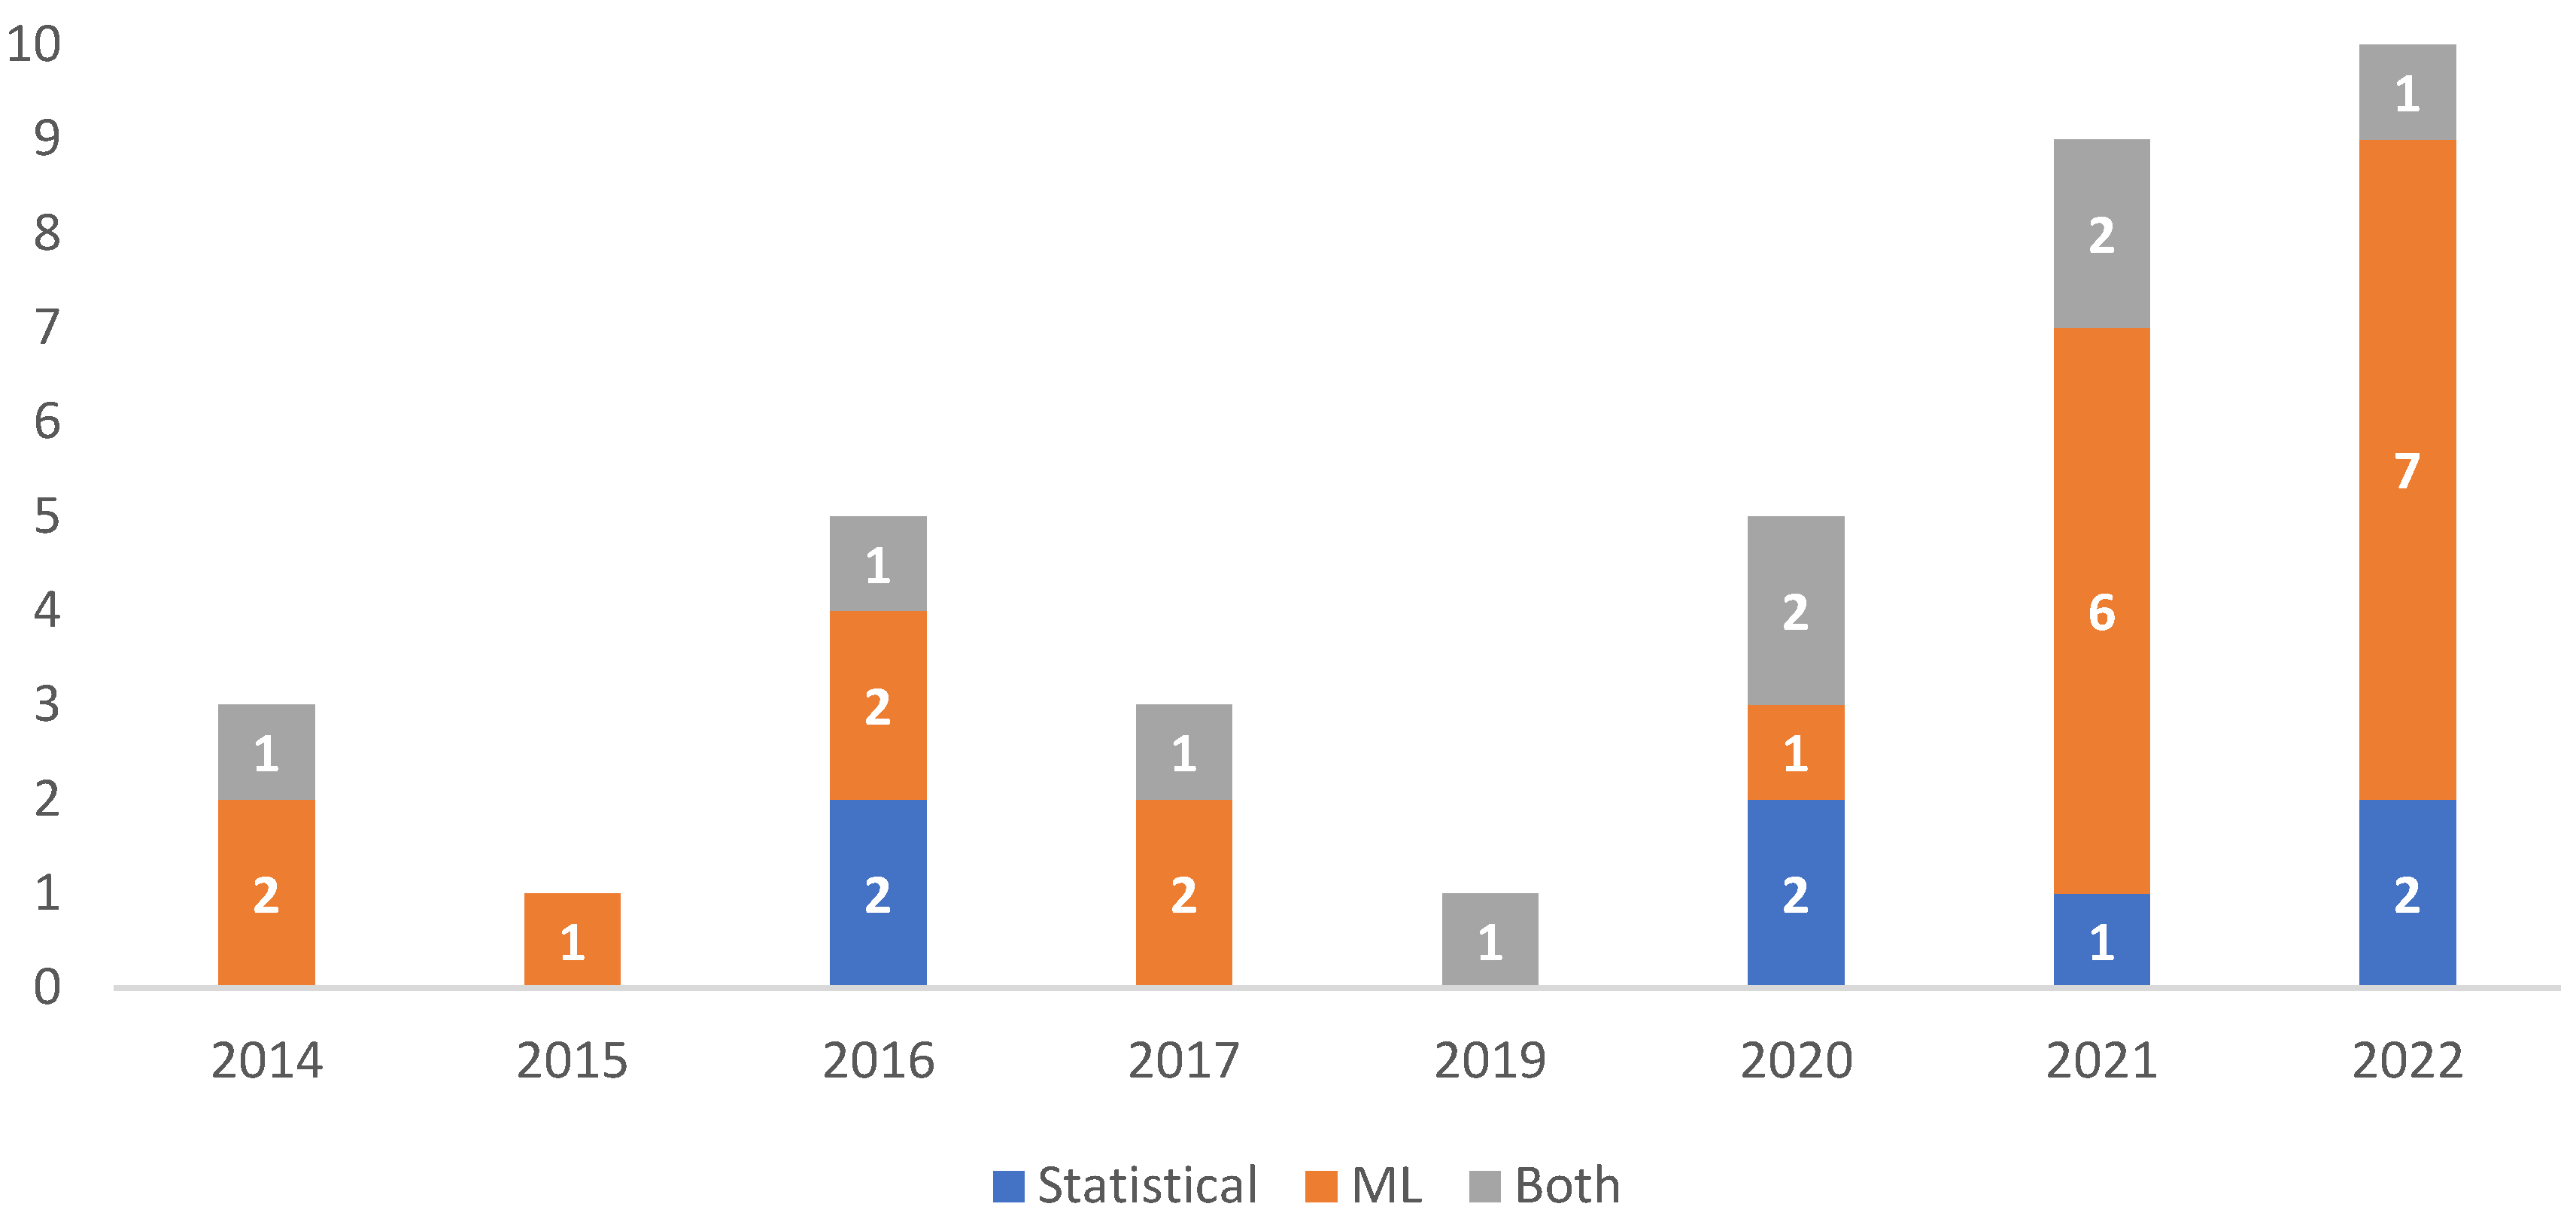
Figure 7.
Most used algorithms of AI for the residential sector.
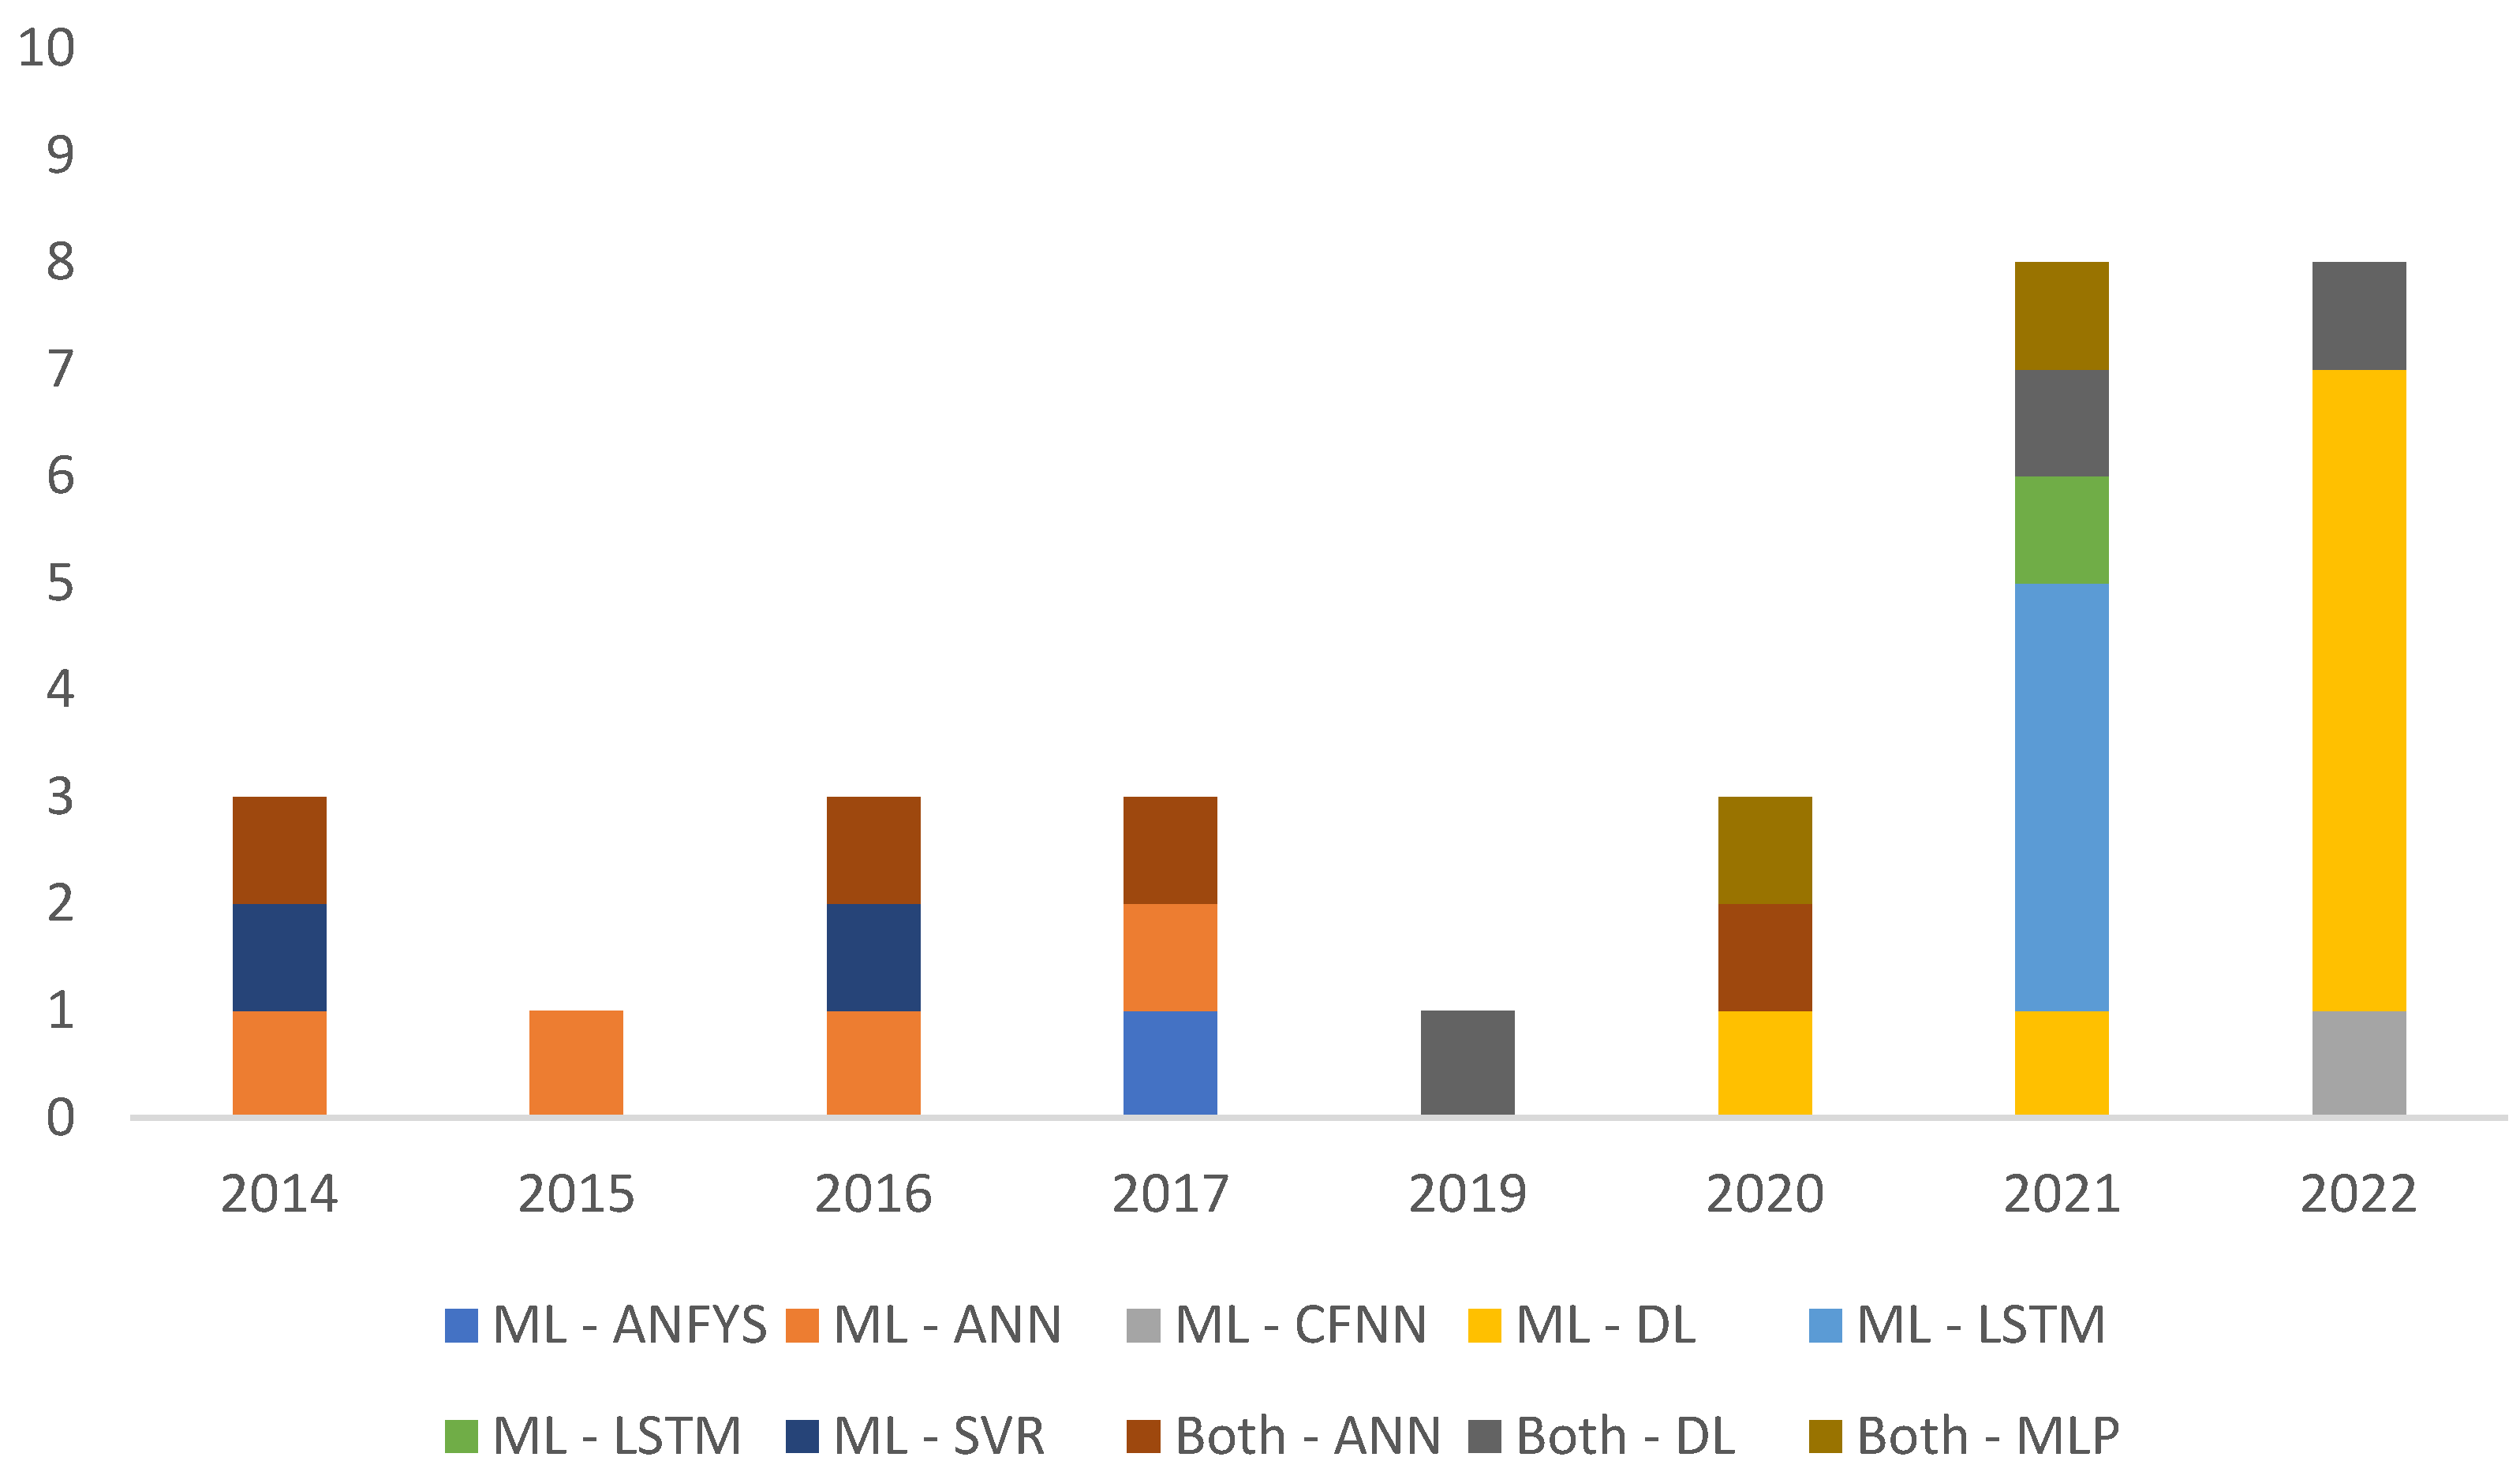
Figure 8.
Most used statistical algorithms in the residential sector.
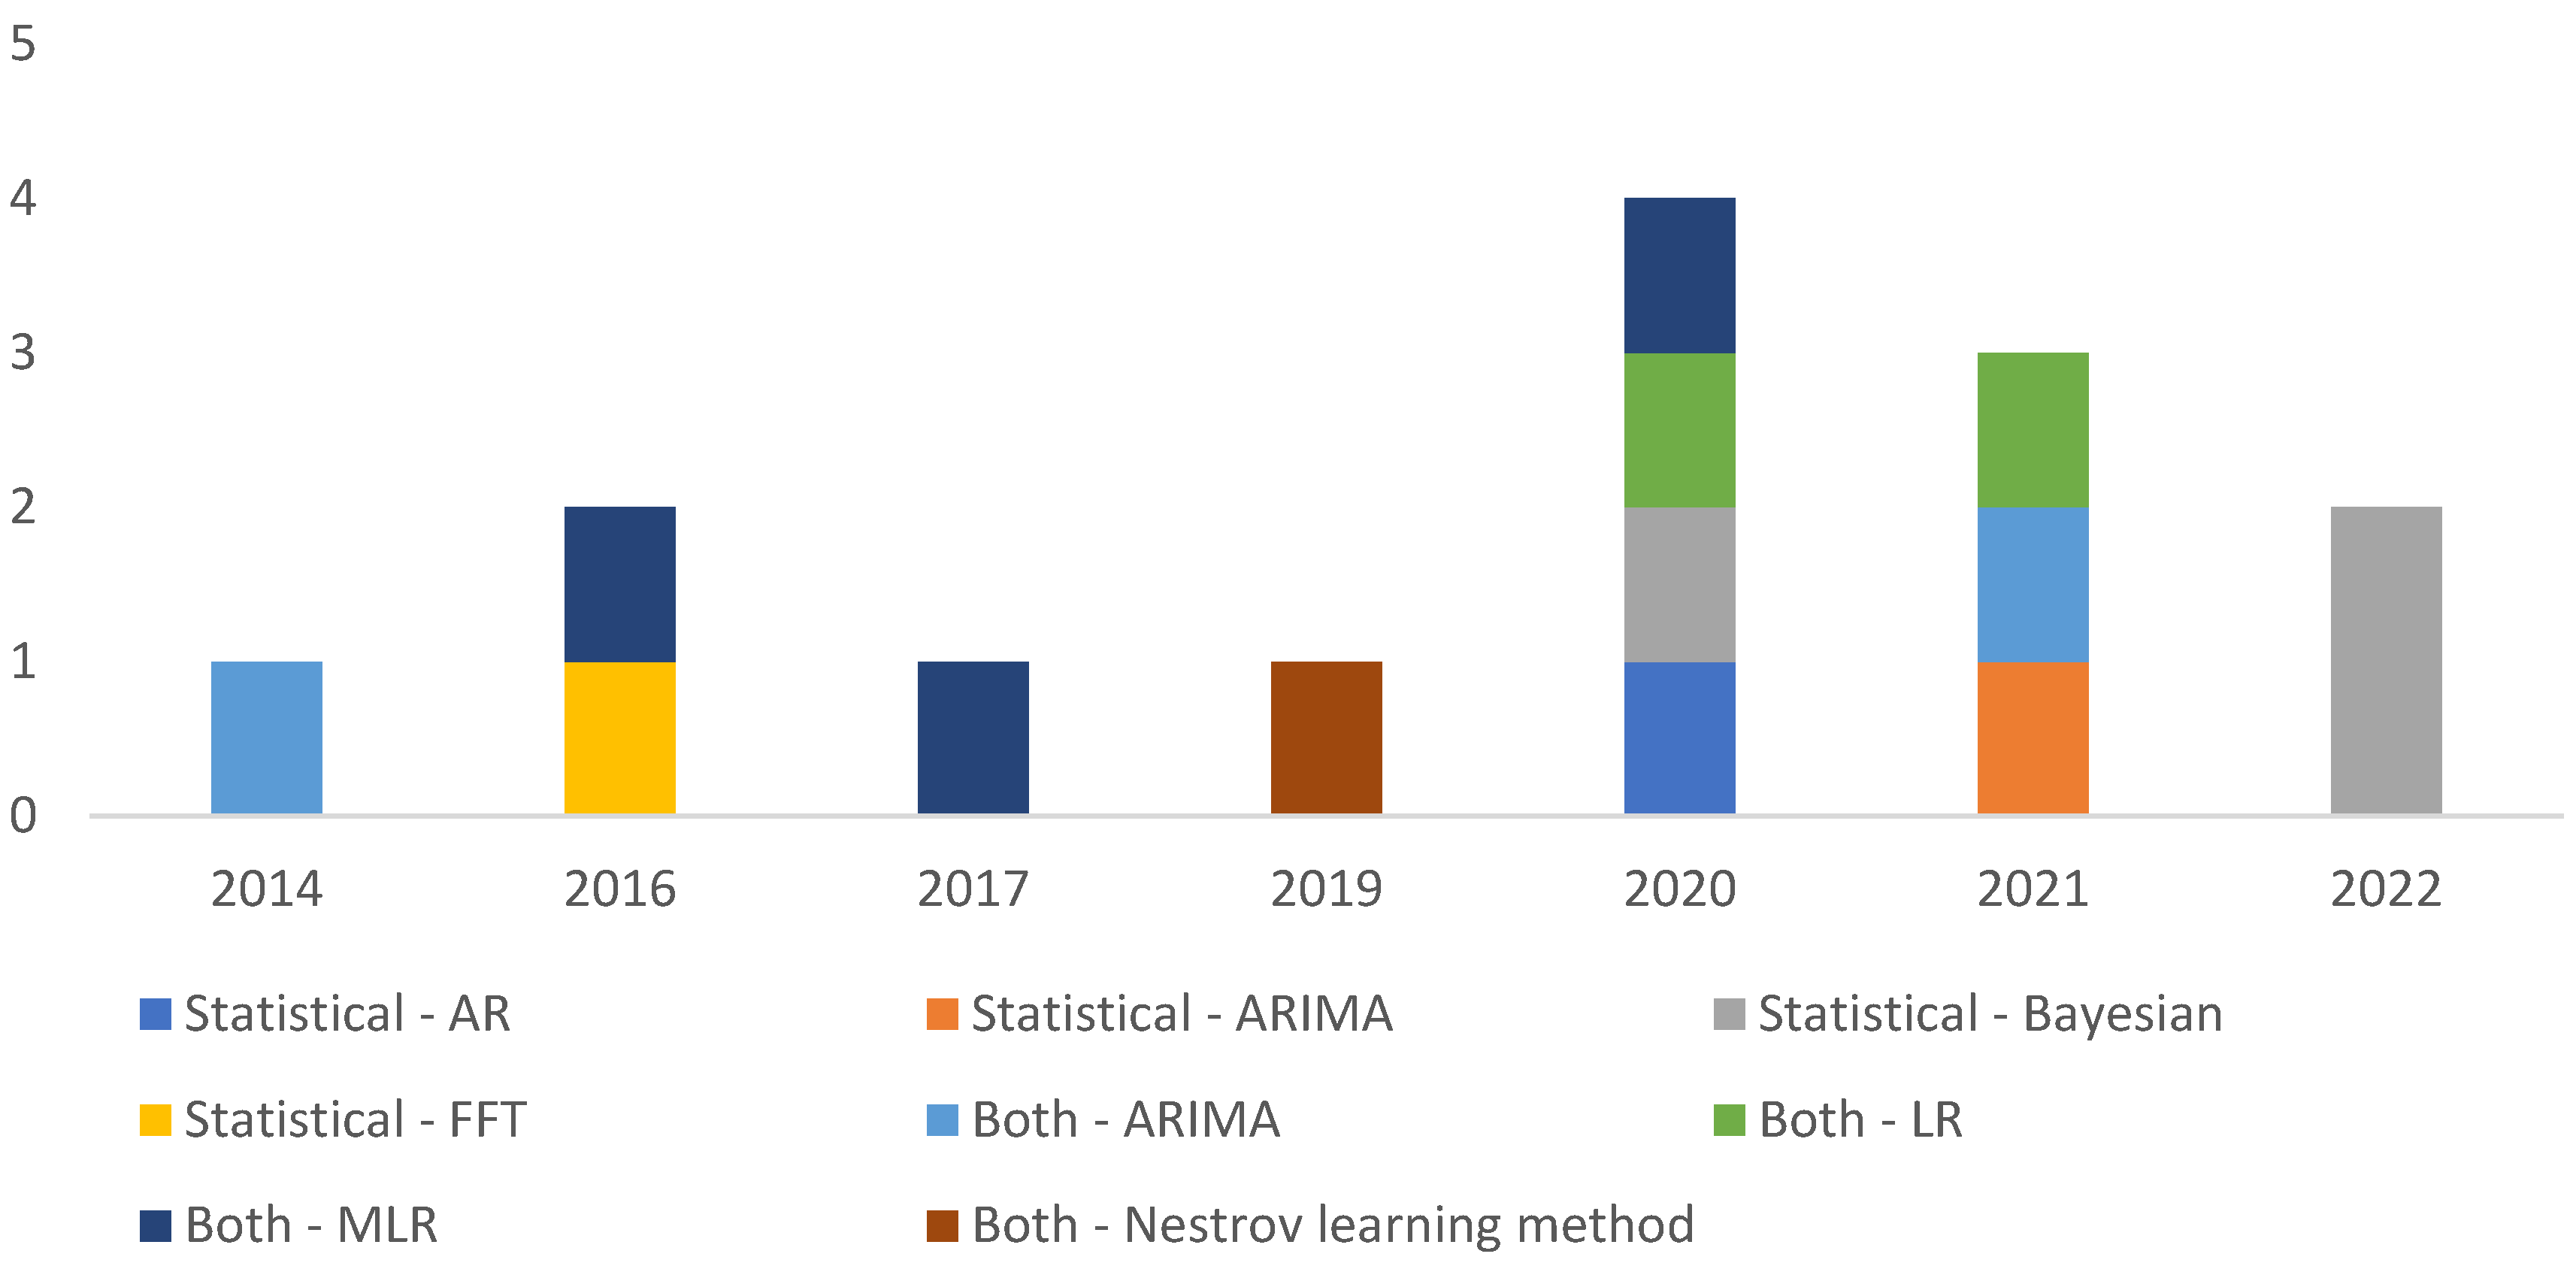
Figure 9.
Input parameters used for STLF forecasting.

Table 1.
Articles published in the last decade (for N = 37 papers).
| Year | No. Articles | Percentage |
|---|---|---|
| 2014 | 3 | 8,1% |
| 2015 | 1 | 2,7% |
| 2016 | 5 | 13,5% |
| 2017 | 3 | 8,1% |
| 2019 | 1 | 2,7% |
| 2020 | 5 | 13,5% |
| 2021 | 9 | 24,3% |
| 2022 | 10 | 27,0% |
Table 2.
Most used STLF forecasting methods (for N = 37 papers).
| Methods | No. Articles | Percentage |
|---|---|---|
| Statistical | 7 | 18,92% |
| ML | 21 | 56,76% |
| Both | 9 | 24,32% |
Table 3.
Methods applied in the three categories of residences for STLF forecasting. (for N = 37 papers).
Table 3.
Methods applied in the three categories of residences for STLF forecasting. (for N = 37 papers).
| Methods | No. Articles | Percentage |
|---|---|---|
| Agglomerate | 8 | 21,6% |
| Statistical | 3 | 8,1% |
| ML | 3 | 8,1% |
| Both | 2 | 5,4% |
| Clusters | 12 | 32,4% |
| Statistical | 3 | 8,1% |
| ML | 6 | 16,2% |
| Both | 3 | 8,1% |
| Individual | 17 | 45,9% |
| Statistical | 1 | 2,7% |
| ML | 12 | 32,4% |
| Both | 4 | 10,8% |
Table 4.
Statistical algorithms most used for STLF forecasting (for N = 7 papers).
| Algorithms | No. Articles | Percentage |
|---|---|---|
| Statistical | 7 | 100,0% |
| AR | 1 | 14,3% |
| ARIMA | 1 | 14,3% |
| Bayesian | 3 | 42,9% |
| Calculus | 1 | 14,3% |
| FFT | 1 | 14,3% |
Table 5.
AI algorithms most used for STLF forecasting (for N = 30 papers).
| Algorithms | No. Articles | Percentage |
|---|---|---|
| ML | 21 | 100,0% |
| ANFYS | 1 | 4,8% |
| ANN | 4 | 19,0% |
| CFNN | 1 | 4,8% |
| DL | 8 | 38,1% |
| LSTM | 4 | 19,0% |
| LSTM | 1 | 4,8% |
| SVR | 2 | 9,5% |
Table 6.
Input parameters used for STLF forecasting (for N = 37 papers).
| Parameters | No. Articles |
|---|---|
| Statistical | |
| Historical energy | 7 |
| Weather | 4 |
| Calendar effects | 3 |
| Energy tariff | 1 |
| Occupants’ lifestyle | 1 |
| Electric appliance | 4 |
| Socioeconomics | 1 |
| ML | |
| Historical energy | 21 |
| Weather | 12 |
| Calendar effects | 16 |
| Energy tariff | 1 |
| Occupants’ lifestyle | 0 |
| Electric appliance | 4 |
| Socioeconomics | 0 |
| Both | |
| Historical energy | 9 |
| Weather | 6 |
| Calendar effects | 5 |
| Energy tariff | 1 |
| Occupants’ lifestyle | 1 |
| Electric appliance | 0 |
| Socioeconomics | 2 |
Table 7.
Historical load data used for STLF forecasting (for N = 37 papers).
| Historical energy data | No. Articles |
|---|---|
| Statistical | 7 |
| 1 mn | 1 |
| 15 mn | 2 |
| 30 mn | 2 |
| hourly | 2 |
| ML | 21 |
| 1 mn | 1 |
| 15 mn | 2 |
| 30 mn | 1 |
| daily | 1 |
| hourly | 16 |
| Both | 9 |
| 15 mn | 2 |
| 30 mn | 1 |
| hourly | 6 |
Table 8.
The 1st evaluation metrics most used for STLF forecasting (for N = 37 papers).
| Metrics | No. Articles | Percentage |
|---|---|---|
| Statistical | 7 | 18,92% |
| MAPE | 4 | 10,81% |
| MSE | 1 | 2,70% |
| RSME | 2 | 5,41% |
| ML | 21 | 56,76% |
| MAPE | 16 | 43,24% |
| MSE | 1 | 2,70% |
| others | 3 | 8,11% |
| RSME | 1 | 2,70% |
| Both | 9 | 24,32% |
| MAPE | 4 | 10,81% |
| RSME | 5 | 13,51% |
Table 9.
The 2nd metric most used for STLF forecasting (for N = 24 papers).
| Metrics | No. Articles | Percentage |
|---|---|---|
| Statistical | 4 | 16,67% |
| MAE | 3 | 12,50% |
| others | 1 | 4,17% |
| ML | 16 | 66,67% |
| MAE | 6 | 25,00% |
| MSE | 3 | 12,50% |
| RSME | 7 | 29,17% |
| Both | 4 | 16,67% |
| MAE | 1 | 4,17% |
| MSE | 1 | 4,17% |
| others | 1 | 4,17% |
| RSME | 1 | 4,17% |
Table 10.
Data preprocessing used (Yes) or not used (No) for STLF forecasting (for N = 35 papers).
| Metrics | No. Articles | Percentage |
|---|---|---|
| Statistical | 7 | 20,00% |
| No | 4 | 11,43% |
| High | 2 | 5,71% |
| Low | 1 | 2,86% |
| Satisfactory | 1 | 2,86% |
| Yes | 3 | 8,57% |
| High | 1 | 2,86% |
| Satisfactory | 2 | 5,71% |
| ML | 20 | 57,14% |
| No | 11 | 31,43% |
| High | 5 | 14,29% |
| Low | 3 | 8,57% |
| Satisfactory | 3 | 8,57% |
| Yes | 9 | 25,71% |
| High | 1 | 2,86% |
| Low | 4 | 11,43% |
| Satisfactory | 4 | 11,43% |
| Both | 8 | 22,86% |
| No | 4 | 11,43% |
| High | 2 | 5,71% |
| Low | 1 | 2,86% |
| Satisfactory | 1 | 2,86% |
| Yes | 4 | 11,43% |
| High | 4 | 11,43% |
Disclaimer/Publisher’s Note: The statements, opinions and data contained in all publications are solely those of the individual author(s) and contributor(s) and not of MDPI and/or the editor(s). MDPI and/or the editor(s) disclaim responsibility for any injury to people or property resulting from any ideas, methods, instructions or products referred to in the content. |
© 2023 by the authors. Licensee MDPI, Basel, Switzerland. This article is an open access article distributed under the terms and conditions of the Creative Commons Attribution (CC BY) license (http://creativecommons.org/licenses/by/4.0/).
Copyright: This open access article is published under a Creative Commons CC BY 4.0 license, which permit the free download, distribution, and reuse, provided that the author and preprint are cited in any reuse.


