
Submitted:
13 April 2023
Posted:
13 April 2023
You are already at the latest version
Abstract
The importance of both recycling and additive manufacturing (AM) is increasing, however there has been a limited focus on development of AM alloys that are recyclably compatible with the larger scrap loops of wrought 5xxx, 6xxx and cast 3xx aluminium alloys. In this work the powder bed fusion (PBF) printability of AlMgSi alloys in the interval of 0-30wt%Mg and 0-4wt%Si is screened experimentally with a high throughput method. This method produces PBF mimicked material by PVD co-sputtering followed by laser remelting. Strong evidence was found for AlMgSi alloys being printable in two different composition ranges; Si+Mg<0.7wt% or for Si+2/3Mg>4wt% when Mg < 3wt% and Si > 3wt%. Increasing the amount of Mg and Si influence the grain structure by introducing fine columnar grains at the melt pool boundary, although the melt pool interior was unaffected. Hardness in as-built state increased with both Mg and Si, alt-hough Si had neglectable effect at low levels of Mg. Both evaporative loss of Mg and the amount of Mg in solid solution increased linearly with the amount of Mg.
Keywords:
Aluminium alloys
; AlMgSi
; Printability
; Powder Bed Fusion
; High Through Put
; Screening.
1. Introduction
As the recyclability of metals increase in importance, new emerging alloys for additive manufacturing (AM) should be designed with recyclability in mind. In terms of volume, a major part of all aluminium produced is either alloyed with Mg or Si or a combination. Specifically, as the wrought alloys in the 5xxx and 6xxx series or as cast 3xx series alloys. Although the levels of Mg and Si varies between the different alloys, alloying with the same elements still hugely simplifies recyclability as the alloying elements are the same. For instance, cast 3xx scarp and wrought 5xxx alloys, containing high levels of Si and Mg respectively, can be used for alloying Si and Mg into 6xxx alloys and 6xxx scrap can be alloyed with Si to be produce 3xx castings. This without any deterioration in between lifecycles as no other elements will accumulate.
Apart from the main alloying elements, minor elements such as Fe, Mn, Cr, Cu, Zn, Ti and B are typically also added. Those are either unintentionally added as impurities or intentionally added to tailor the alloy. Hence, preferably a new aluminium AM alloy should not contain element except those previously mentioned, furthermore the levels should be as low as possible to reduce the need for dilution with primary Al which otherwise will be required due to accumulation between lifecycles.
The current commercially available AlSi10Mg AM alloy is highly recyclable as it does not have any minor alloying elements to promote grain refinement (GF). However, the strength is moderate with Rp0.2 in the range of 300 MPa [1] and therefore its use is limited.
To reach higher strength in the AlSiMg alloys system, the level of Mg is required to increase as this will enable higher solid solution hardening and/or precipitation hardening. This comes however, with the drawback of reduced printability (the alloys ability to solidify crack free during printing). Printability is mainly controlled by alloy properties such as solidification shrinkage and melt permeability. Together they dictated the magnitude of tensile stress on the liquid at the final part of solidification. An increase in the Mg level increases the solidification shrinkage, as eutectic phases with greater shrinkage are formed during the end of the solidification. Increasing the level of Si on the other hand improve melt permeability as the viscosity of the melt is lowered [2]. The requirement of high melt permeability is lowered with decreasing grain size, therefore Ti, Zr or Sc elemental GFs or compound GFs like TiB2 or TiC are often added.
However, it is also possible to achieve GF by increasing the total amount of alloying elements, due to the effect of growth restriction [3].
Although traditional wrought alloys like 6082 and 6061 [4] (0,6-1,2wt%Mg and 0,7-1,3wt%Si) are not printable. Printability, for AlSiMg alloys have been achieved in some recent development [5,6], with addition of ~1wt% of Ti and/or Zr GFs. However, compared to wrought alloys the Ti addition is in the order of 10 times higher, and with additions of Zr a new incompatible element would be introduced into the scrap loop. By selecting the right composition within AlSiMg (4.4wt%Mg, 3.1wt%Si), Li et al [7] demonstrated a crack free alloy without addition of GF is possible. However, the composition space of printable AlSiMg alloys is today poorly understood.
In this study, we therefore seek to map out the printability of GF free AlSiMg alloys and find potential composition spaces.
2. Materials and Methods
The method developed in [8,9] was used with a target setup to produce a bi-directional and partly perpendicular composition gradient, see Figure 1a,b. This method provides a good setup for studying large compositional ranges with high composition resolution. The target setup consisted of three parts placed on two magnetrons. The left magnetron was filled with an alloy 1050A target, and the right with a two-part target, consisting of pure Mg at the bottom and a 1050A + AlSi12 compound target at the top. All targets were produced in-house from eighter 10mm 1050A sheet provided by Hydro Aluminium AS (Si and Fe < 0.10 wt% and remaining elements < 0.01 wt%) or 99,9wt% Mg ingot from REMAG Leichtmetall GmbH. The 1050A + AlSi12 compound target was produced by milling out a 7mm deep and 20mm wide slot at the racetrack position of 1050A sheet and by MIG welding filling this with AlSi12. The welding wire for this was bought from ESAB AB.
A 600x230x10mm substrate was cut from the same 1050A sheet material as the targets and positioned in relation to the targets as in previous work [8,9]. Deposition was carried out in 435 mPa Ar atmosphere for 7h using a constant magnetron power of 5kW, while voltage and current fluctuated it was on average 400V and 12.5A. The substrate temperature reached a steady state temperature of ~150°C. During the last 15min of the deposition the right magnetron was shutoff so that only the fully 1050A target deposited, this was done to even out the film reflectivity and thus provide a uniform laser response over the whole substrate during the following remelting.
To mimic powder bed fusion (PBF), the PVD film was laser melted in an Aconity MIDI laser PBF machine. To enable laser melting and SEM handling the substrate was first cut into 8 plates of size 110x110mm. The melt pattern, order and the laser parameters (340W, 1000mm/s and 100µm hatch spacing) were the same as in [9]. Those laser parameters were selected to match the estimated film thickness of ~180µm and before laser melting the plate was heated to 100°C. During laser melting the temperature increased and reached 145-150°C.
After laser melting the composition was mapped out directly on the laser melted surface on each sample plate at 117 equal spaced position with EDS in FEI Nova nano SEM 450. To improve accuracy, each EDS measurement was carried out over a 4.5mm2 area for 35-45s at each position. An image was also acquired in SE mode of the measured position, this image was reviewed for surface cracks.
Microstructure investigations have been carried out on cross sections in SEM. Grain size was measure with EBSD on a 256µm by 176µm area, with a pixel size of 0.4 µm located just beneath the top of the melted surface. 10° orientation difference was used for grain boundary identification.
Hardness measurements was made with a DuraScan G5, with 50 g load, on the cross-sections perpendicular to the laser scan direction with ~1mm spacing between indents and 100µm spacing to the top surface. The measurements were made one year after the laser melting and no heat treatment was given before measurement, thus the materials was in an “as-built” condition. To accurately map hardness against composition, 0.25– 0.38mm2 area EDS measurements was also carried out along the cross-section with 2mm spacing. Composition of the hardness indents was than linearly interpolated in between the closest EDS measurement points. Hardness values was averaged over 0.5wt%Mg x 0.5wt%Si composition intervals and only intervals containing at least two measurements were used in the evaluation.
To investigate the amount of Mg in solid solution, XRD have been carried out. An 8x8 point grid evenly spaced over sample plate #6 was automatically scanned using a Bruker D8 Discovery diffractometer in coupled 2theta mode. The position of the measurement was centered within each laser molten square to minimize the potential signal from the un-molten PVD film. Mg in solid solution (SS) expands the lattice by 0,0044 Å/wt%Mg [2] (kMg) and thus shifts the Al peaks to lower angles, lattice parameter can then be calculated through Bragg´s law. As the (111) plane reflection at 38.6° has the highest intensity, a 34°-42° scan interval was selected. This interval also covered peaks of the β-AlMg and Mg2Si phases. From the kMg coefficient, Eq 1 could be used to calculate the amount of Mg in SS;
Where ameasured is the measured lattice parameters for the studied alloy and aref is the references position. aref was calculated on the assumption of all Mg being in the SS at the position with lowest Mg. At this position Mg was only 0,85wt%, and this amount of Mg could be trapped in SS even using traditional methods such as extrusion. Using this position as CMgSS, aref was calculated to 4.035Å.
3. Results and Discussion
The target setup resulted in a very large Mg gradient ranging from 0 to 85wt%Mg, whereas Si ranged from 0-6wt%, see Figure 2b. From surface investigations it could be concluded that Mg increased the surface roughness, see Figure 3. At Mg levels below 10wt%, the periodicity of the laser pattern was visible, whereas above the surface had a stochastic non periodic appearance. The increase in surface roughness with Mg content, could be linked to increased melt viscosity [2], a similar trend was also observed in the previous study [8]. Flaking of the film occurred in a region with ~75wt%Mg, possibly caused by contamination on the substrate prior deposition.
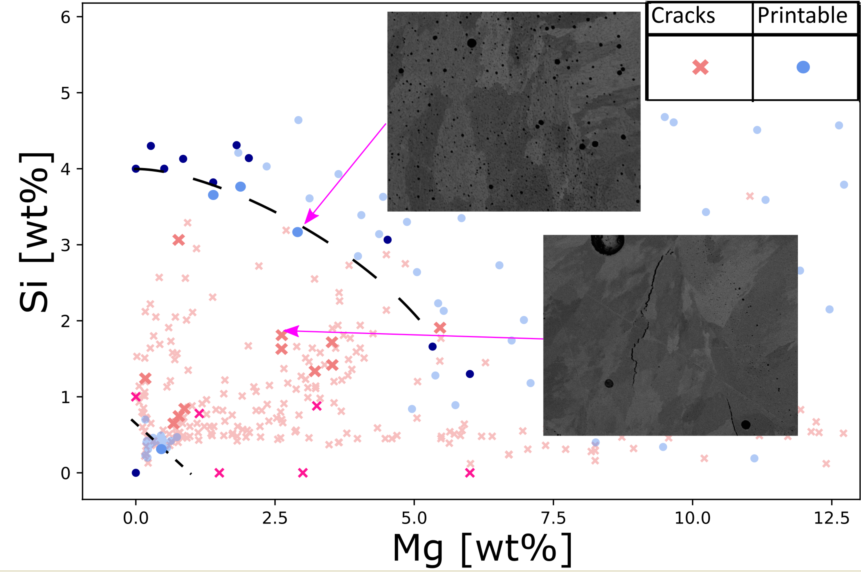
For most parts of the laser melted surfaces cracks were present, however two crack free areas were present. By plotting the data in the Mg, Si-space (see Figure 4), those areas were clearly reviled. The none printable composition space could approximatively be demarcated by Si+Mg>0.7wt% and Si+2/3Mg<4wt%, this agreed well with data reported in the literature [4,7,10,11,12,13,14]. Observation from cross-sections (see Figure 5 and Figure 6) could nearly confirmed the printability boarder observed from surface cracks. However, the boarder at Mg>3wt% and Si<3wt% could not be confirmed due to the extensive degree of porosity observed. Takahiro [11] also observed increased porosity with additions of Mg, although they optimized the beam parameter for each composition. In the present work only one set of beam parameters have been used, possibly this set could have been unsuitable for porosity at higher levels of Mg. Mg have a high vapor pressure and is one of few metals with substantial vapor pressure even in solid state, this increasing the likelihood for porosity. Another possible source of porosity is absorption of moisture in the columnar structure of PVD film. The columnar structure varies both distance to targets and composition, thus the amount of absorbed moister could vary with position as well.
The high vapor pressure of Mg also lead to a loss of the element during laser melting. The loss of Mg was measured by comparing the composition of the unmolten PVD film with the laser molten film in the close vicinity to each other, see Figure 7. The loss increased linearly with Mg content and the loss corresponds roughly to 10% independent of composition. These results are close to those values reported by Takahiro [11] using similar laser and scan parameters.
Interestingly, at Mg levels close to the stoichiometric β-AlMg phase (36wt%Mg) no porosity was present, while cracks showed a brittle behavior indicating formation of the β-AlMg phase. Since the PVD film had a columnar structure at this composition, see Figure 5d, the lack of porosity in the β-AlMg phase could be explained either by a lower solvability of H in the melt at the stoichiometric composition or a higher solvability in the solid β-AlMg phase.
The effect of Mg and Si on grain structure was most noticeable at the melt pool boundary, for which an increase had a refining effect, see Figure 8 and Table 1. This effect was visible from ~3wt% Mg suggesting the Mg had larger influence on grain size than Si, which is in line with the effect of the growth restricting factor [15] and also previous studies [11,13]. Although the melt pool boundaries had a layer of fine grains at ~8wt% Mg the melt pool interior still consisted of coarse grains.
Hardness in the as-built condition of the composition space Mg 0-12wt% and Si 0-4wt% is presented in Figure 9. Hardness naturally varied strongly with the Mg content, while the effect of Si varied with the composition of Mg. In the Mg interval 0-2wt%, a 2wt% increase of Si had a negligible effect on the hardness, whereas at ~12wt% Mg the same increase in Si raised the hardness 40-50Hv, to reach a maximum of 240Hv.
From the XRD spectrums a clear shift of the Al FCC (111) peak towards lower angles could be observed which corresponds to an increase in the lattice parameter a, see Figure 10a. Naturally the β-AlMg and Mg2Si phase peak intensity also increases with Mg and Si. From the lattice parameter, the Mg in SS (Mgss) was estimated, see Figure 9b, it was found that Mgss increased linearly with Mg. A classical description of SS hardening is;
where c is the composition, and the remaining parameters are constants. The exponent n for Mg in Al is close to unity [16], suggesting a linear increase in strength with Mgss. By calculating Mgss for the hardness data in Figure 9b it was found that a linear fit poorly represent the relation between Mgss and hardness. Best fit was found for a for Hv = 60*CMgss0,43.
5. Conclusions
- Strong evidence was found for AlMgSi alloys being printable in two different composition ranges. Either for Si+Mg<0.7wt% or for Si+2/3Mg>4wt% when Mg > 3wt% and Si > 3wt%.
- Grain refinement at the melt pool boundary increased with the Mg content.
- At low levels of Mg the effect of Si was neglectable on hardness, whereas at Mg levels ~12wt% a 2wt% addition of Si increased the hardness by 40-50Hv to reach values up to 240Hv.
- Both the amount of Mg in solid solution and the loss of Mg due to evaporation increased linearly with the Mg content.
- Porosity increased with Mg.
Author Contributions
Conceptualization, F.L.; methodology, F.L.; formal analysis, F.L..; investigation, F.L.; data curation, F.L.; writing—original draft preparation, F.L.; writing—review and editing, F.L. and J.M.; supervision, S.S. and J.M.; project administration, J.M.; funding acquisition, F.L. All authors have read and agreed to the published version of the manuscript.
Funding
This research was funded by Norsk Hydro ASA, the Swedish Agency for Innovation Systems via SIP LIGHTer, (Vinnova grant 2020-04266) and Carl Trygger’s Foundation for Scientific Research contracts CTS 15:219 and CTS 14:431.
Data Availability Statement
The data supporting the findings of this study are available from the corresponding author upon reasonable request.
Acknowledgments
For laser remelting the authors acknowledge AMEXCI AB for a good collaboration and support.
Conflicts of Interest
The authors declare no conflict of interest.
References
- Schuch, M.; Bleckmann, T.H.O.M. The mechanical behavior and microstructure of additively manufactured AlSi10Mg for different material states and loading conditions. Materials Science and Engineering: A 2021, 813, 141134. [Google Scholar] [CrossRef]
- Mondolfo, L.F. Aluminum Alloys: Structure and Properties, Butterworths, 1976.
- StJohn, M.E.O.D. Grain refinement of aluminum alloys: Part II. Confirmation of, and a mechanism for, the solute paradigm. Metallurgical and Materials Transactions A 1999, 30, 1625–1633. [Google Scholar]
- Mehta, A.; Zhou, L.; Huynh, T.; Park, S.; Hyer, H.; Song, S.; Bai, Y.; Imholte, D.D.; Woolstenhulme, N.E.; Sohn, D.M.W.O.Y. Additive manufacturing and mechanical properties of the dense and crack free Zr-modified alumi-num alloy 6061 fabricated by the laser-powder bed fusion. Additive Manufacturing 2021, 41, 101966. [Google Scholar] [CrossRef]
- Riener, K.; Nagler, A.; Leichtfried, I.L.-P.O.G. Processing of Aluminum Alloy 6182 with High Scan-ning Speed in LPBF by In-Situ Alloying with Zr and Ti Powder. Alloys 2022, 1, 277–287. [Google Scholar] [CrossRef]
- Zhang, X.X.; Lutz, A.; Andrä, H.; Lahres, M.; Sittig, D.; Maawad, E.; Knoop, W.M.G.O.D. An additively manu-factured and direct-aged AlSi3.5Mg2.5 alloy with superior strength and ductility: micromechanical mechanisms. International Journal of Plasticity 2021, 146, 103083. [Google Scholar] [CrossRef]
- Li, F.; Li, Z.; Tang, C.; Zhang, L.; Tan, Q.; Chen, C.; Zhou, M.Z.O.K. Design high-strength Al–Mg–Si alloy fabri-cated by laser powder bed fusion: Cracking suppression and strengthening mechanism. Materials Science and Engineering: A 2023, 864, 144591. [Google Scholar] [CrossRef]
- Leijon, F.; Wachter, S.; Fu, Z.; Körner, C.; Moverare, S.S.O.J. A novel rapid alloy development method to-wards powder bed additive manufacturing, demonstrated for binary Al-Ti, -Zr and -Nb alloys. Materials & Design 2021, 211, 110129. [Google Scholar]
- Leijon, F.; Johansson, E.; Lu, J.; Aling, B.; Moverare, S.S.O.J. Investigation of Ti1−x(Zr,Ta,V,W)xB2 and Al3Ti1−x(Zr,V)x grain refiners in additively manufactured Al-2 wt%Cu alloys by a high throughput method. Materials & Design 2022, 222, 111093. [Google Scholar]
- Kimura, T.; Nakamoto, T.; Araki, M.M.O.H. Effect of silicon content on densification, mechanical and thermal properties of Al-xSi binary alloys fabricated using selective laser melting. Materials Science and Engineering: A 2007, 682, 593–602. [Google Scholar] [CrossRef]
- Kimura, T.; Nakamoto, T.; Ozaki, T.; Sugita, K.; Araki, M.M.O.H. Microstructural formation and characterization mechanisms of selective laser melted Al–Si–Mg alloys with increasing magnesium content. Materials Science and Engineering: A 2019, 754, 786–798. [Google Scholar] [CrossRef]
- Zhou, L.; Hyer, H.; Chang, J.; Mehta, A.; Huynh, T.; Sohn, Y.Y.O.Y. Microstructure, mechanical performance, and corrosion behavior of additively manufactured aluminum alloy 5083 with 0.7 and 1.0 wt% Zr addition. Materials Science and Engineering: A 2021, 823, 141679. [Google Scholar] [CrossRef]
- Li, R.; Wang, M.; Li, Z.; Cao, P.; Zhu, T.Y.O.H. Developing a high-strength Al-Mg-Si-Sc-Zr alloy for selective laser melting: Crack-inhibiting and multiple strengthening mechanisms. Acta Materialia 2020, 193, 83–98. [Google Scholar] [CrossRef]
- Yang, H.; Zhang, Y.; Wang, J.; Liu, Z.; Ji, C.L.O.S. Additive manufacturing of a high strength Al-5Mg2Si-2Mg alloy: Microstructure and mechanical properties. Journal of Materials Science & Technology 2021, 91, 215–223. [Google Scholar]
- StJohn, M.E.O.D. Grain refinement of aluminum alloys: Part I. the nucleant and solute paradigms–a re-view of the literature. Metallurgical and Materials Transactions A 1999, 30, 1613–1623. [Google Scholar]
- Ryen, Ø.; Holmedal, B.; Nijs, O.; Nes, E.; Ekström, E.S.O.H.-E. Strengthening mechanisms in solid solu-tion aluminum alloys. Metallurgical and Materials Transactions A 2006, 37, 1999–2006. [Google Scholar] [CrossRef]
Figure 1.
a) Target setup, b) Substrate with indication of Si and Mg gradient directions and one position of the cut plates for laser melting marked.
Figure 1.
a) Target setup, b) Substrate with indication of Si and Mg gradient directions and one position of the cut plates for laser melting marked.
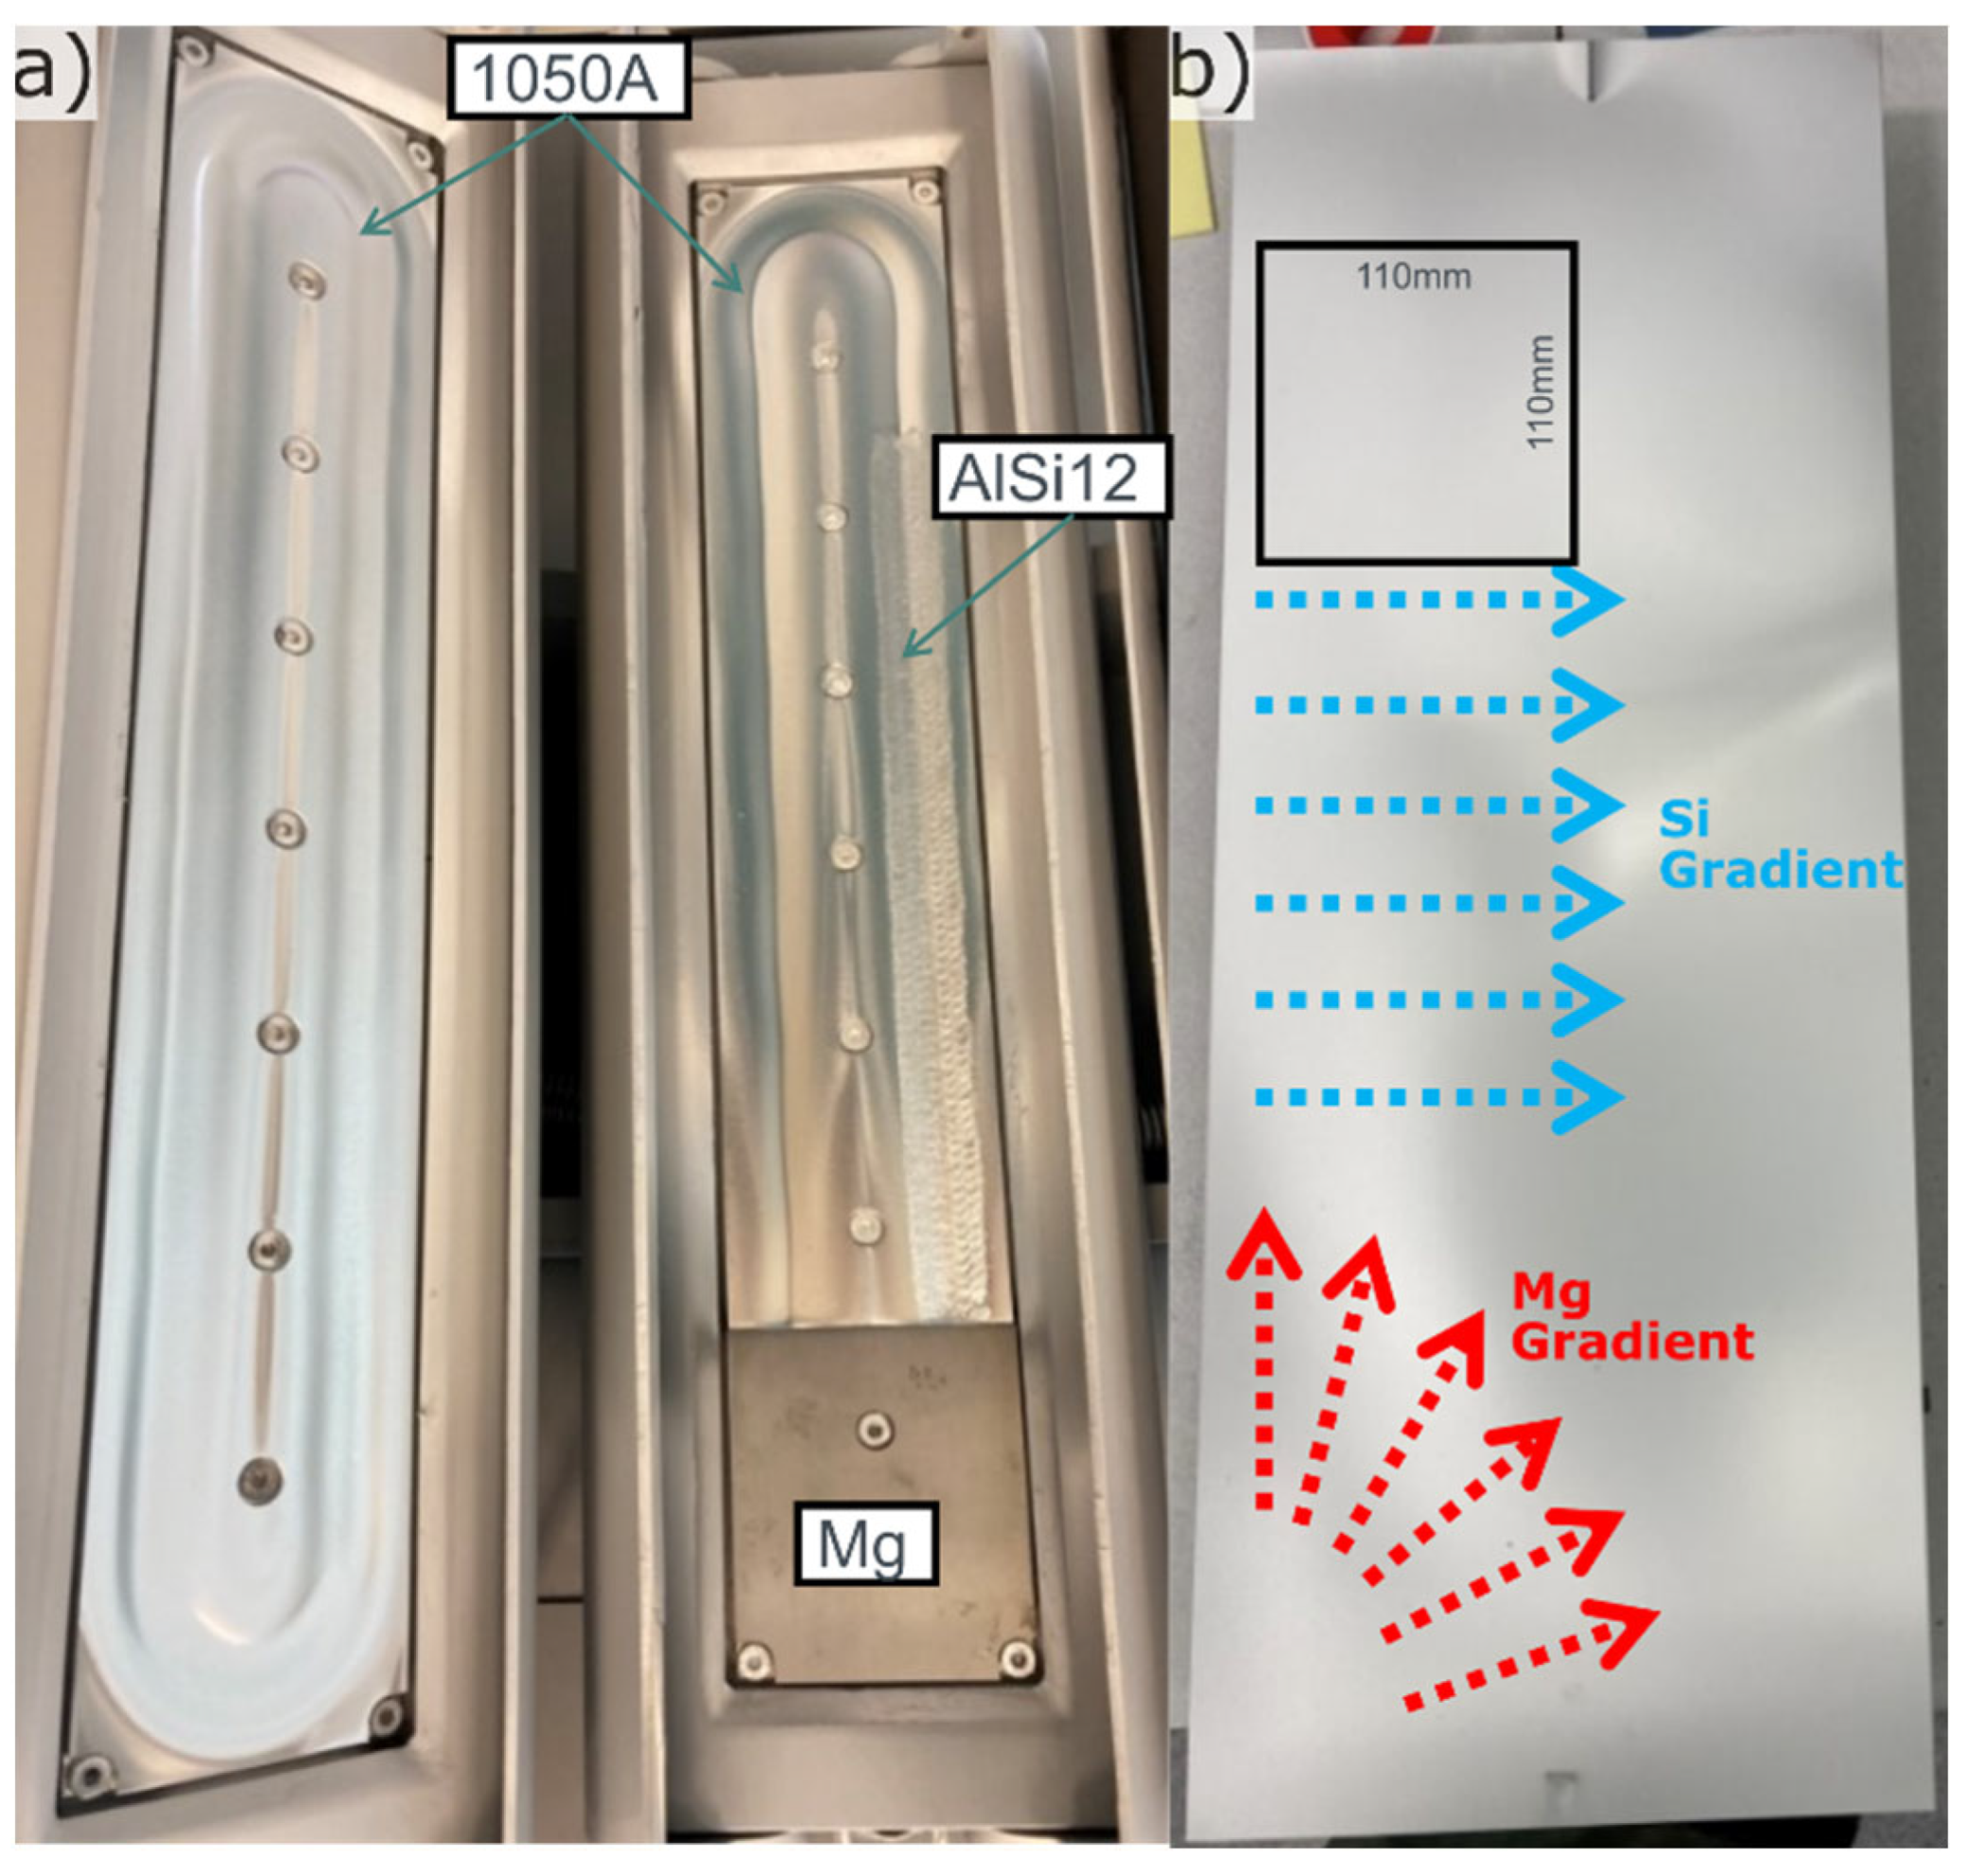
Figure 2.
a) Laser melted plates, placed side by side as deposited with #1 top left and #8 bottom right, b,c) Mg and Si composition mapped out and interpolated over the whole substrate. Black dots marks positions free from surface cracks and red cross positions with surface cracks. White areas indicated damaged/flaking film or faulty EDS measurements.
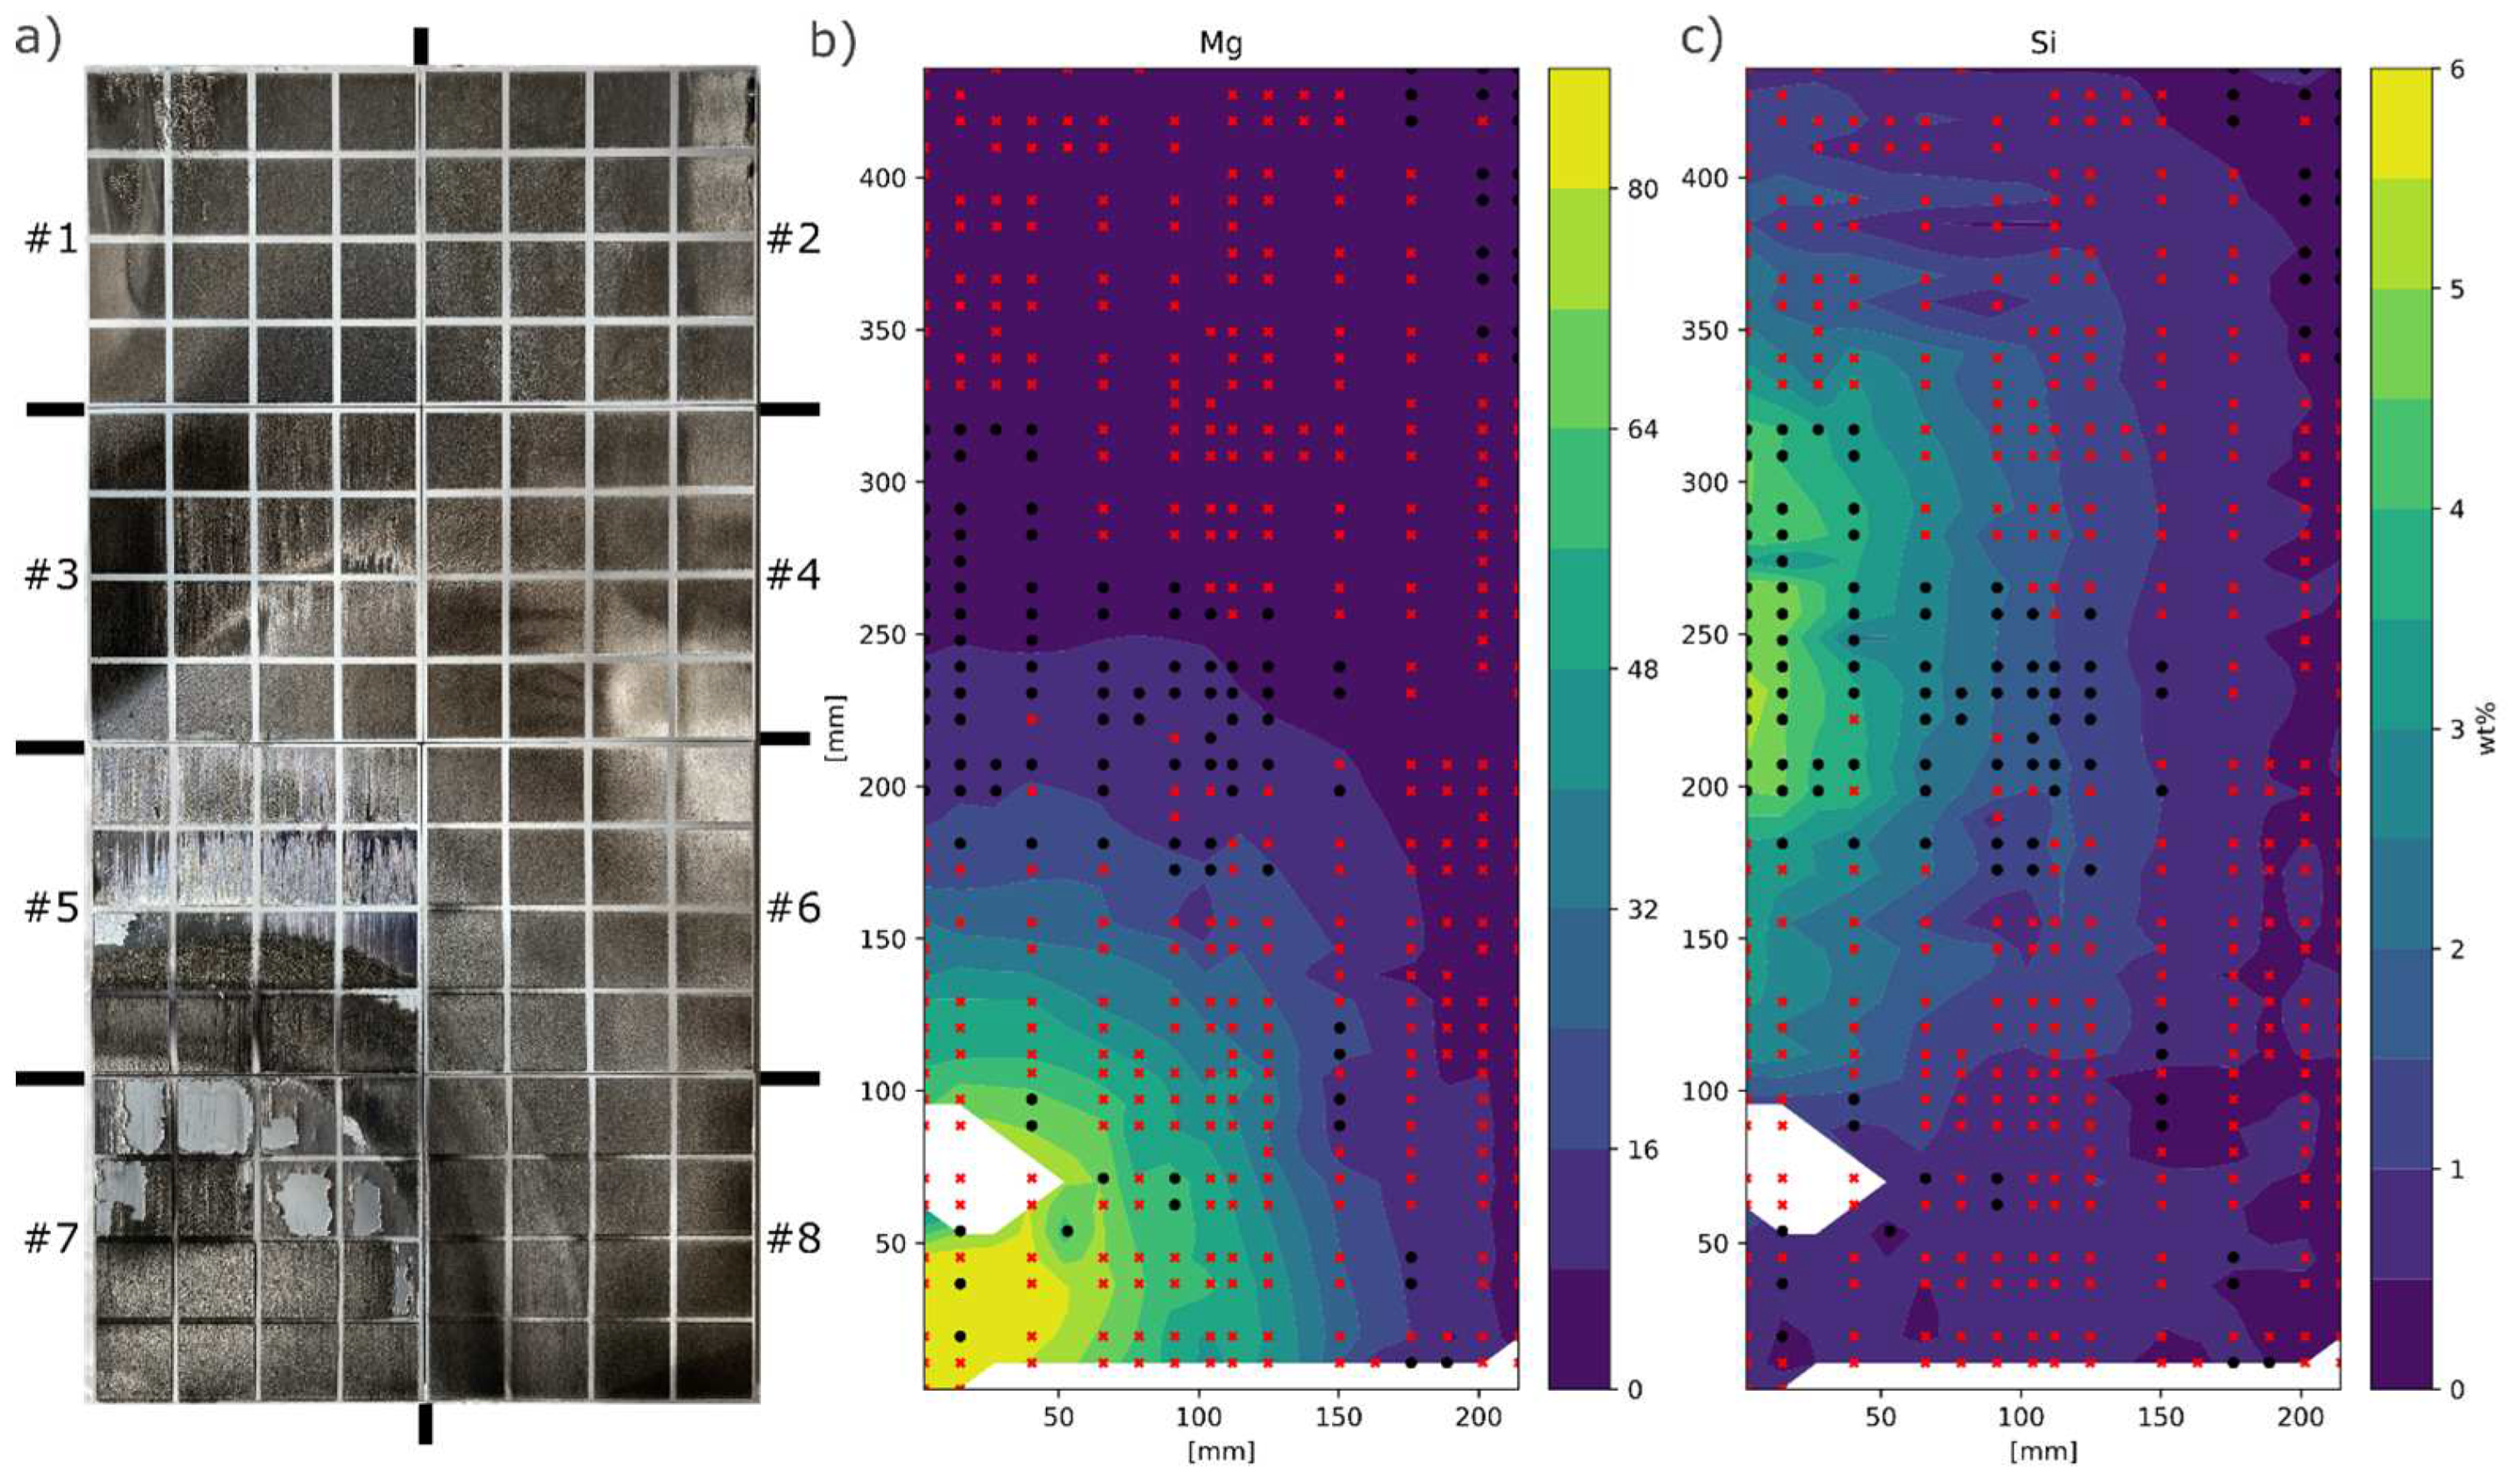
Figure 3.
Laser melted surface with composition in wt% a) Mg 0.3, Si 0.4, b) Mg 3.7, Si 0.8, c) Mg 6.2, Si 0.5, d) Mg 10.2, Si 3.4, e) Mg 25.6, Si 0.6, f) Mg 78.8, Si 0.7.
Figure 3.
Laser melted surface with composition in wt% a) Mg 0.3, Si 0.4, b) Mg 3.7, Si 0.8, c) Mg 6.2, Si 0.5, d) Mg 10.2, Si 3.4, e) Mg 25.6, Si 0.6, f) Mg 78.8, Si 0.7.
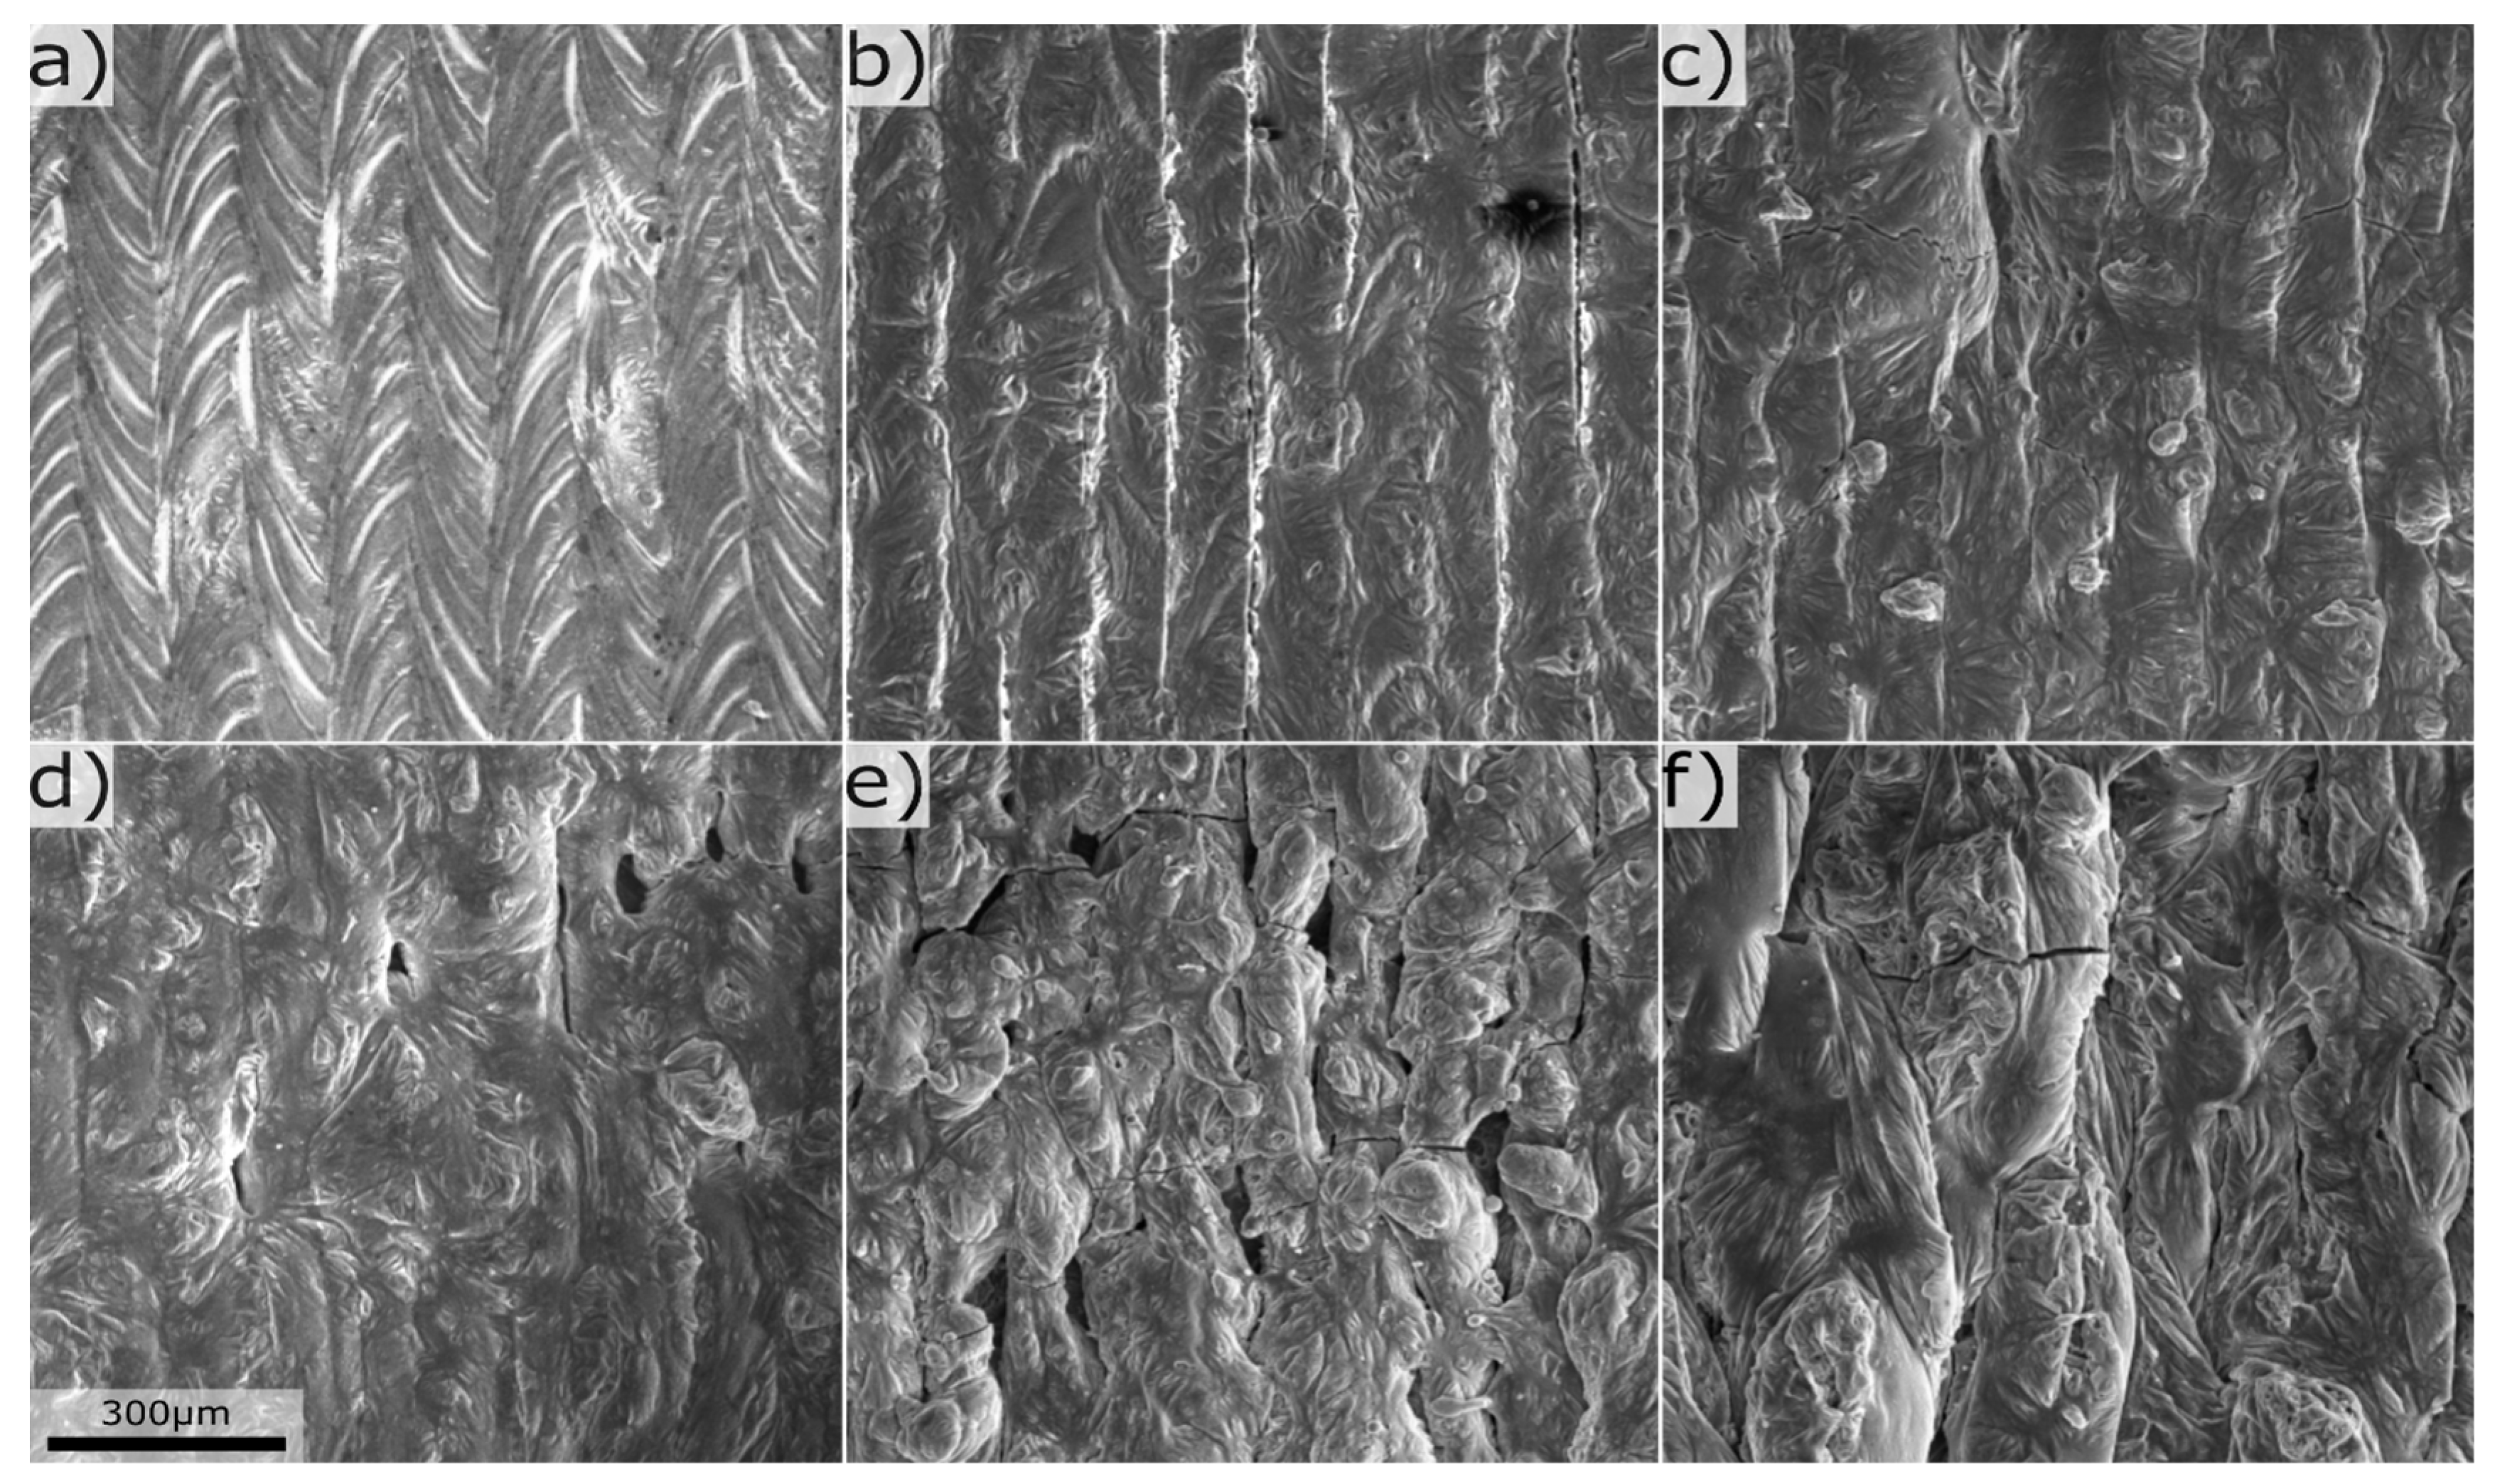
Figure 4.
Printability mapped out in Mg Si composition space. Shaded area marks area of high porosity.
Figure 4.
Printability mapped out in Mg Si composition space. Shaded area marks area of high porosity.
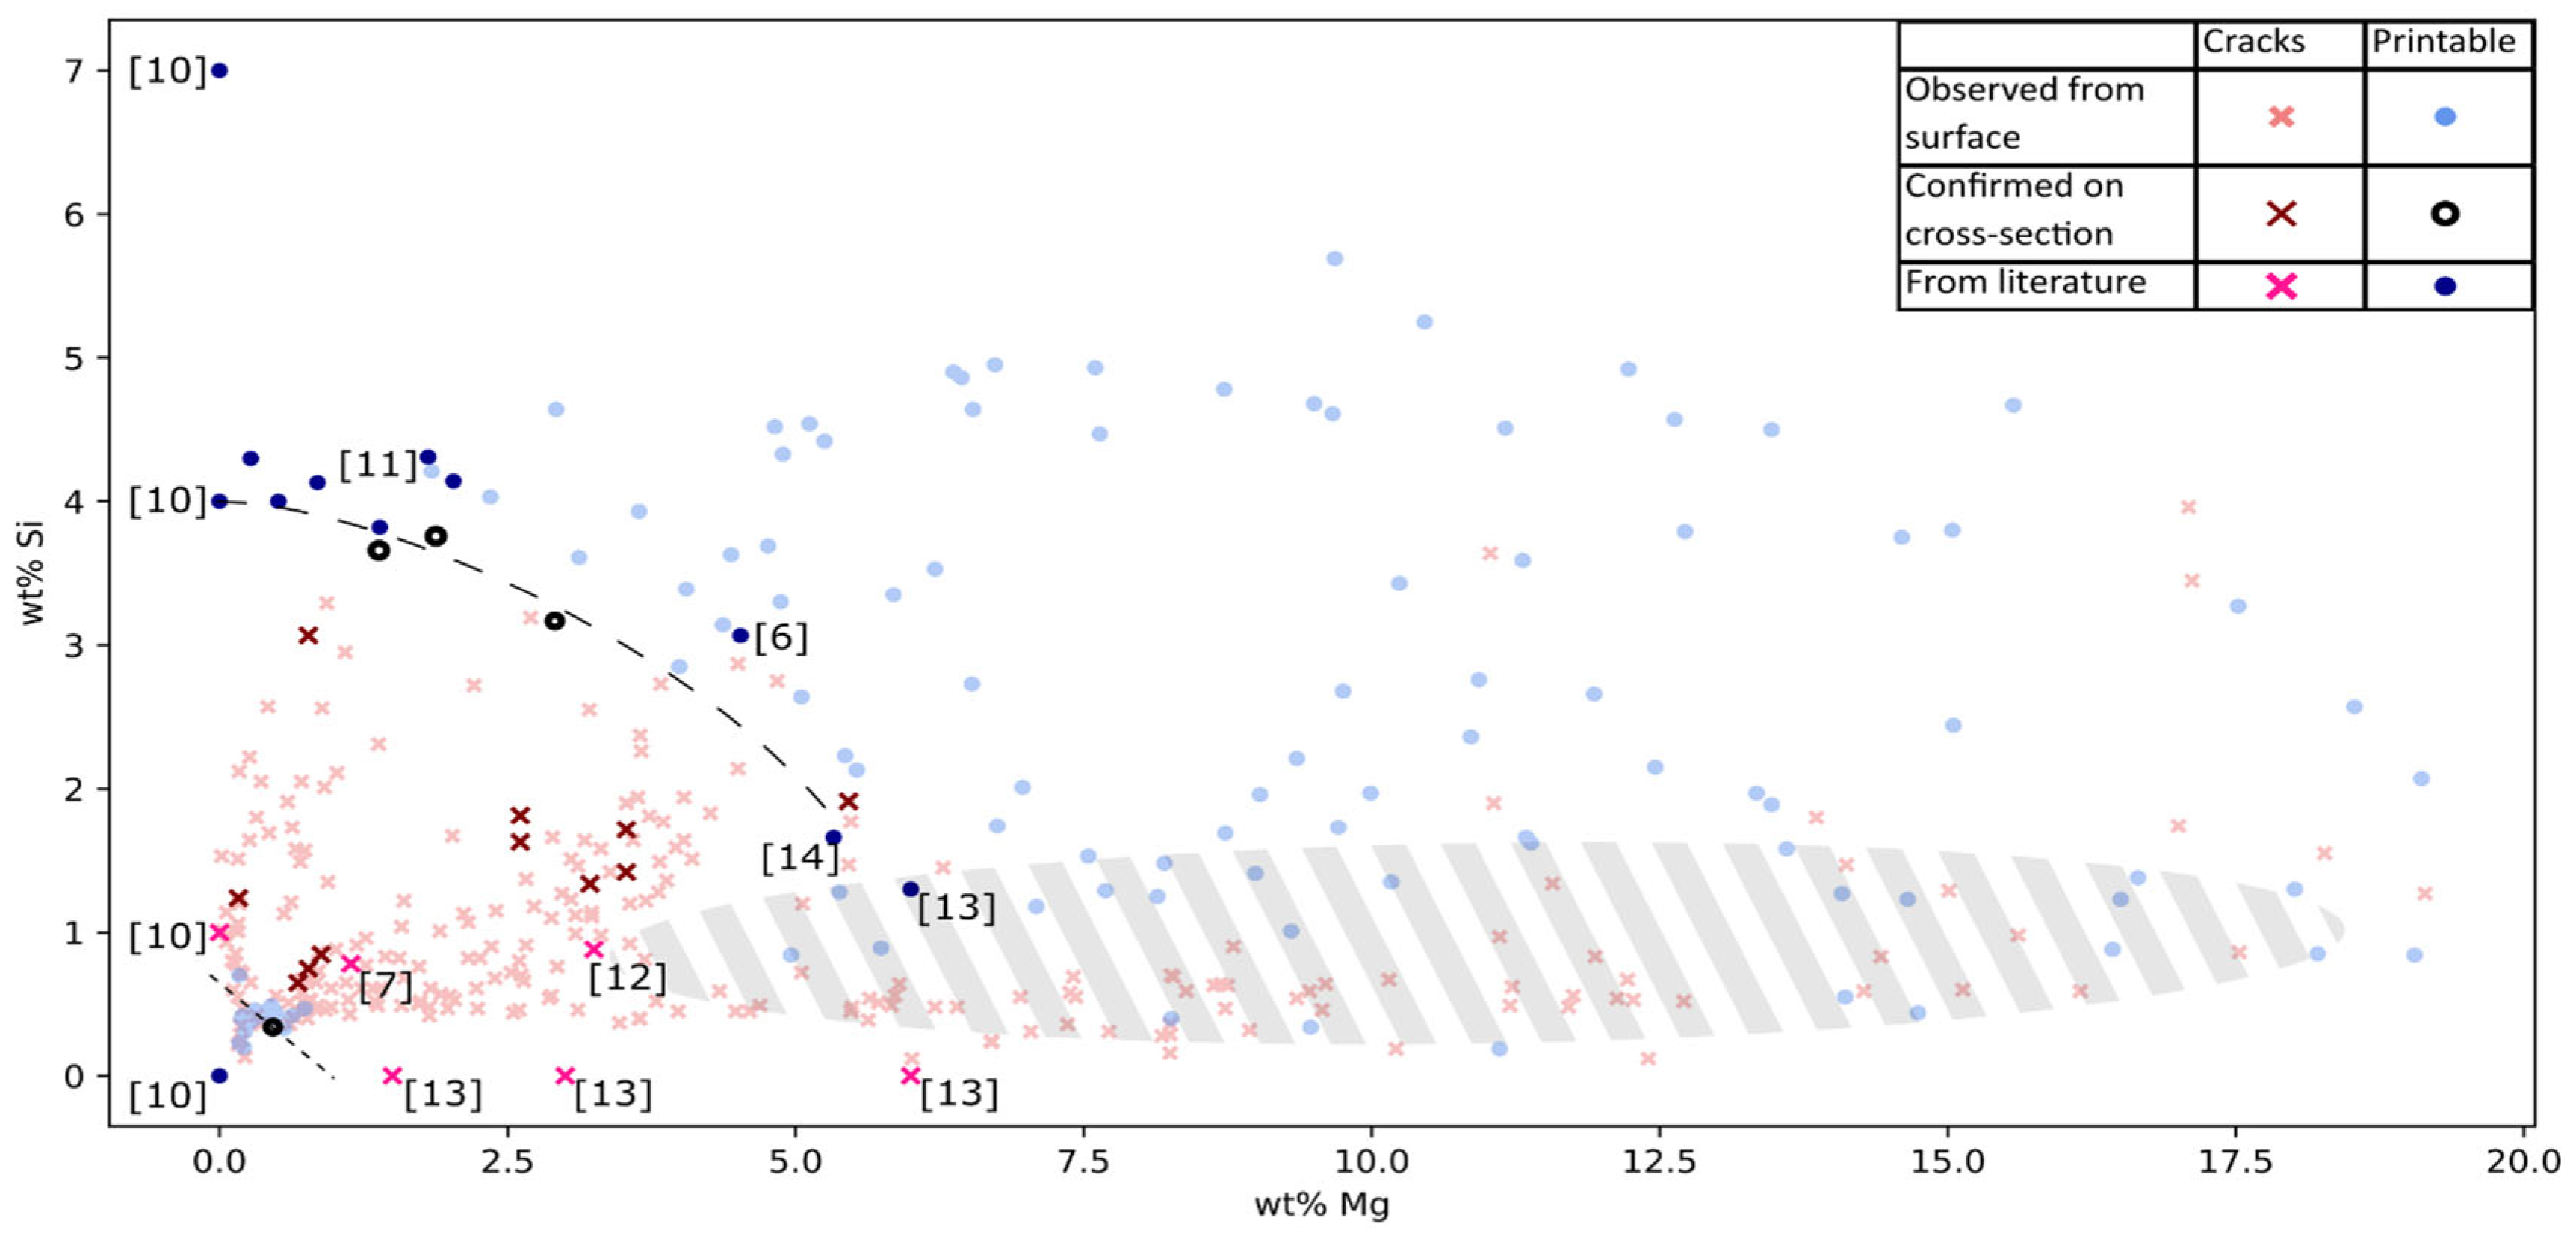
Figure 5.
Cross-section overviews of laser melts, a) Mg 2.4 Si 1.2, b) Mg 0.2 Si 0.4, c) Mg 7.8 Si 2.4, d) Mg 34,5 Si 3.1. All units in wt%. Dotted red line mark the border between laser melted (top) and no-melted areas (bottom).
Figure 5.
Cross-section overviews of laser melts, a) Mg 2.4 Si 1.2, b) Mg 0.2 Si 0.4, c) Mg 7.8 Si 2.4, d) Mg 34,5 Si 3.1. All units in wt%. Dotted red line mark the border between laser melted (top) and no-melted areas (bottom).
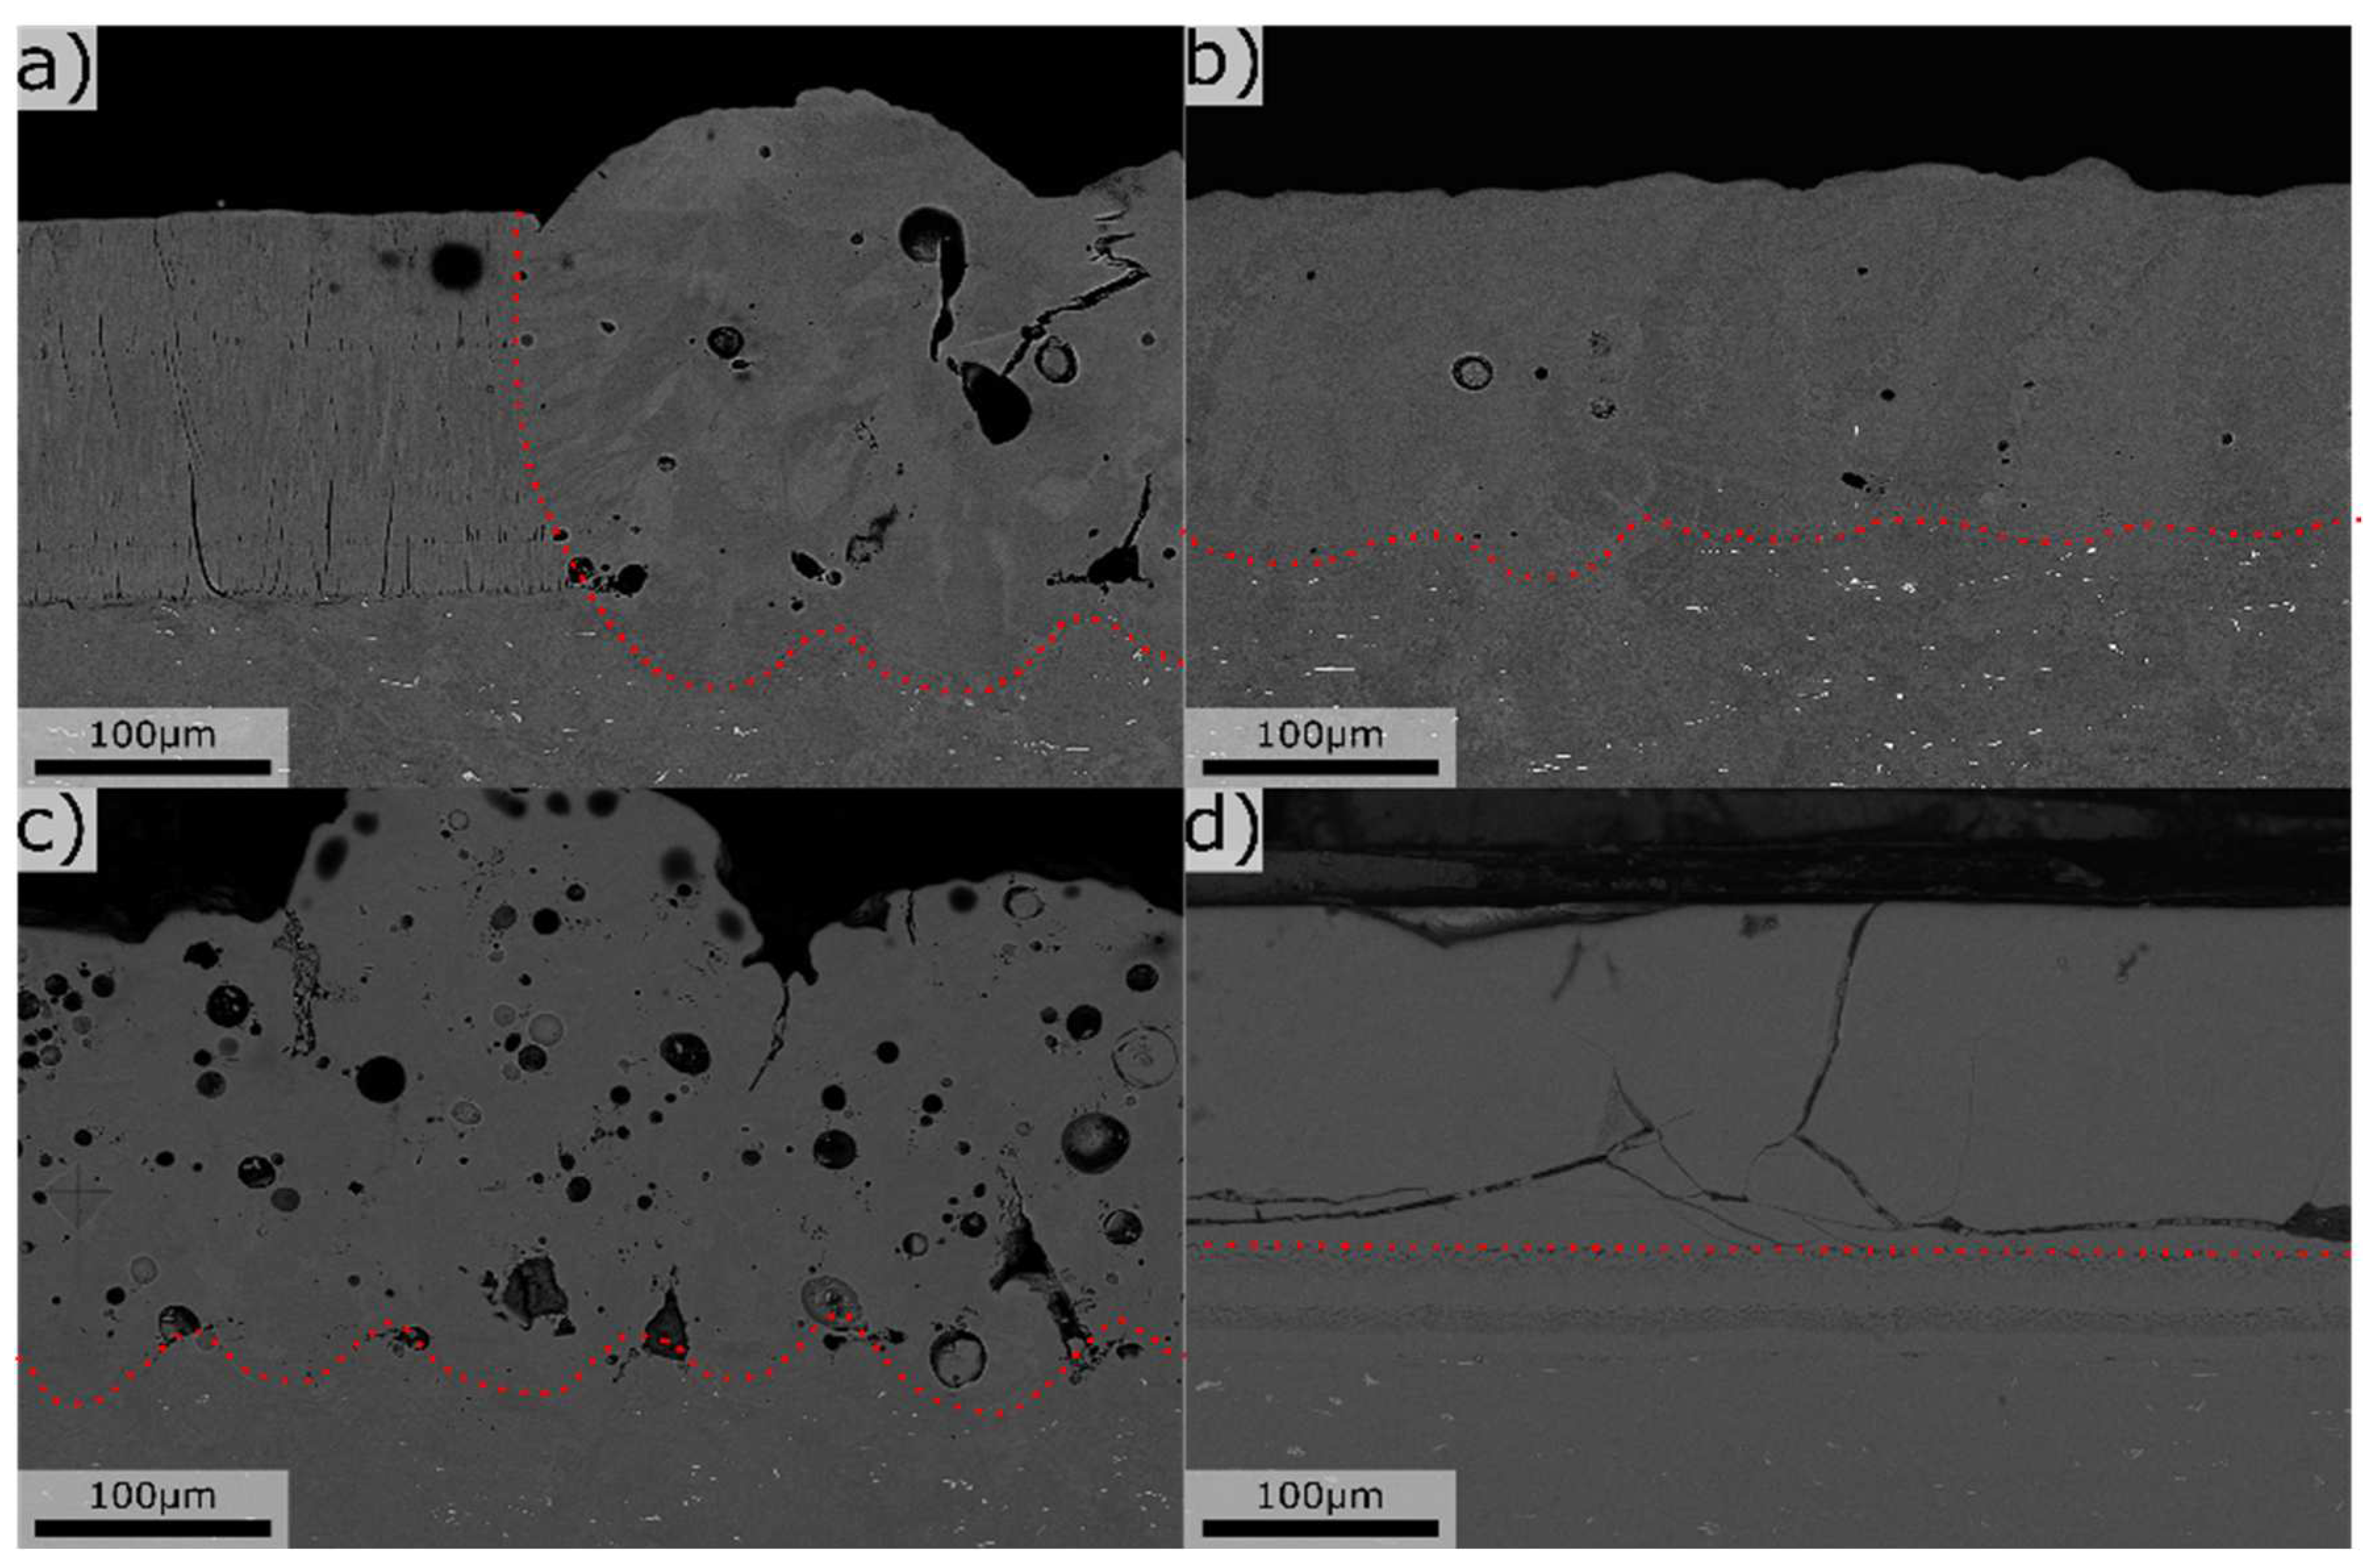
Figure 6.
Typical microstructure for various compositions, a) Mg 0.1 Si 1.4, b) Mg 2.8 Si 3.2, c) Mg 4.1 Si 2.4, d) Mg 2.5 Si 1.8, all values in wt%.
Figure 6.
Typical microstructure for various compositions, a) Mg 0.1 Si 1.4, b) Mg 2.8 Si 3.2, c) Mg 4.1 Si 2.4, d) Mg 2.5 Si 1.8, all values in wt%.
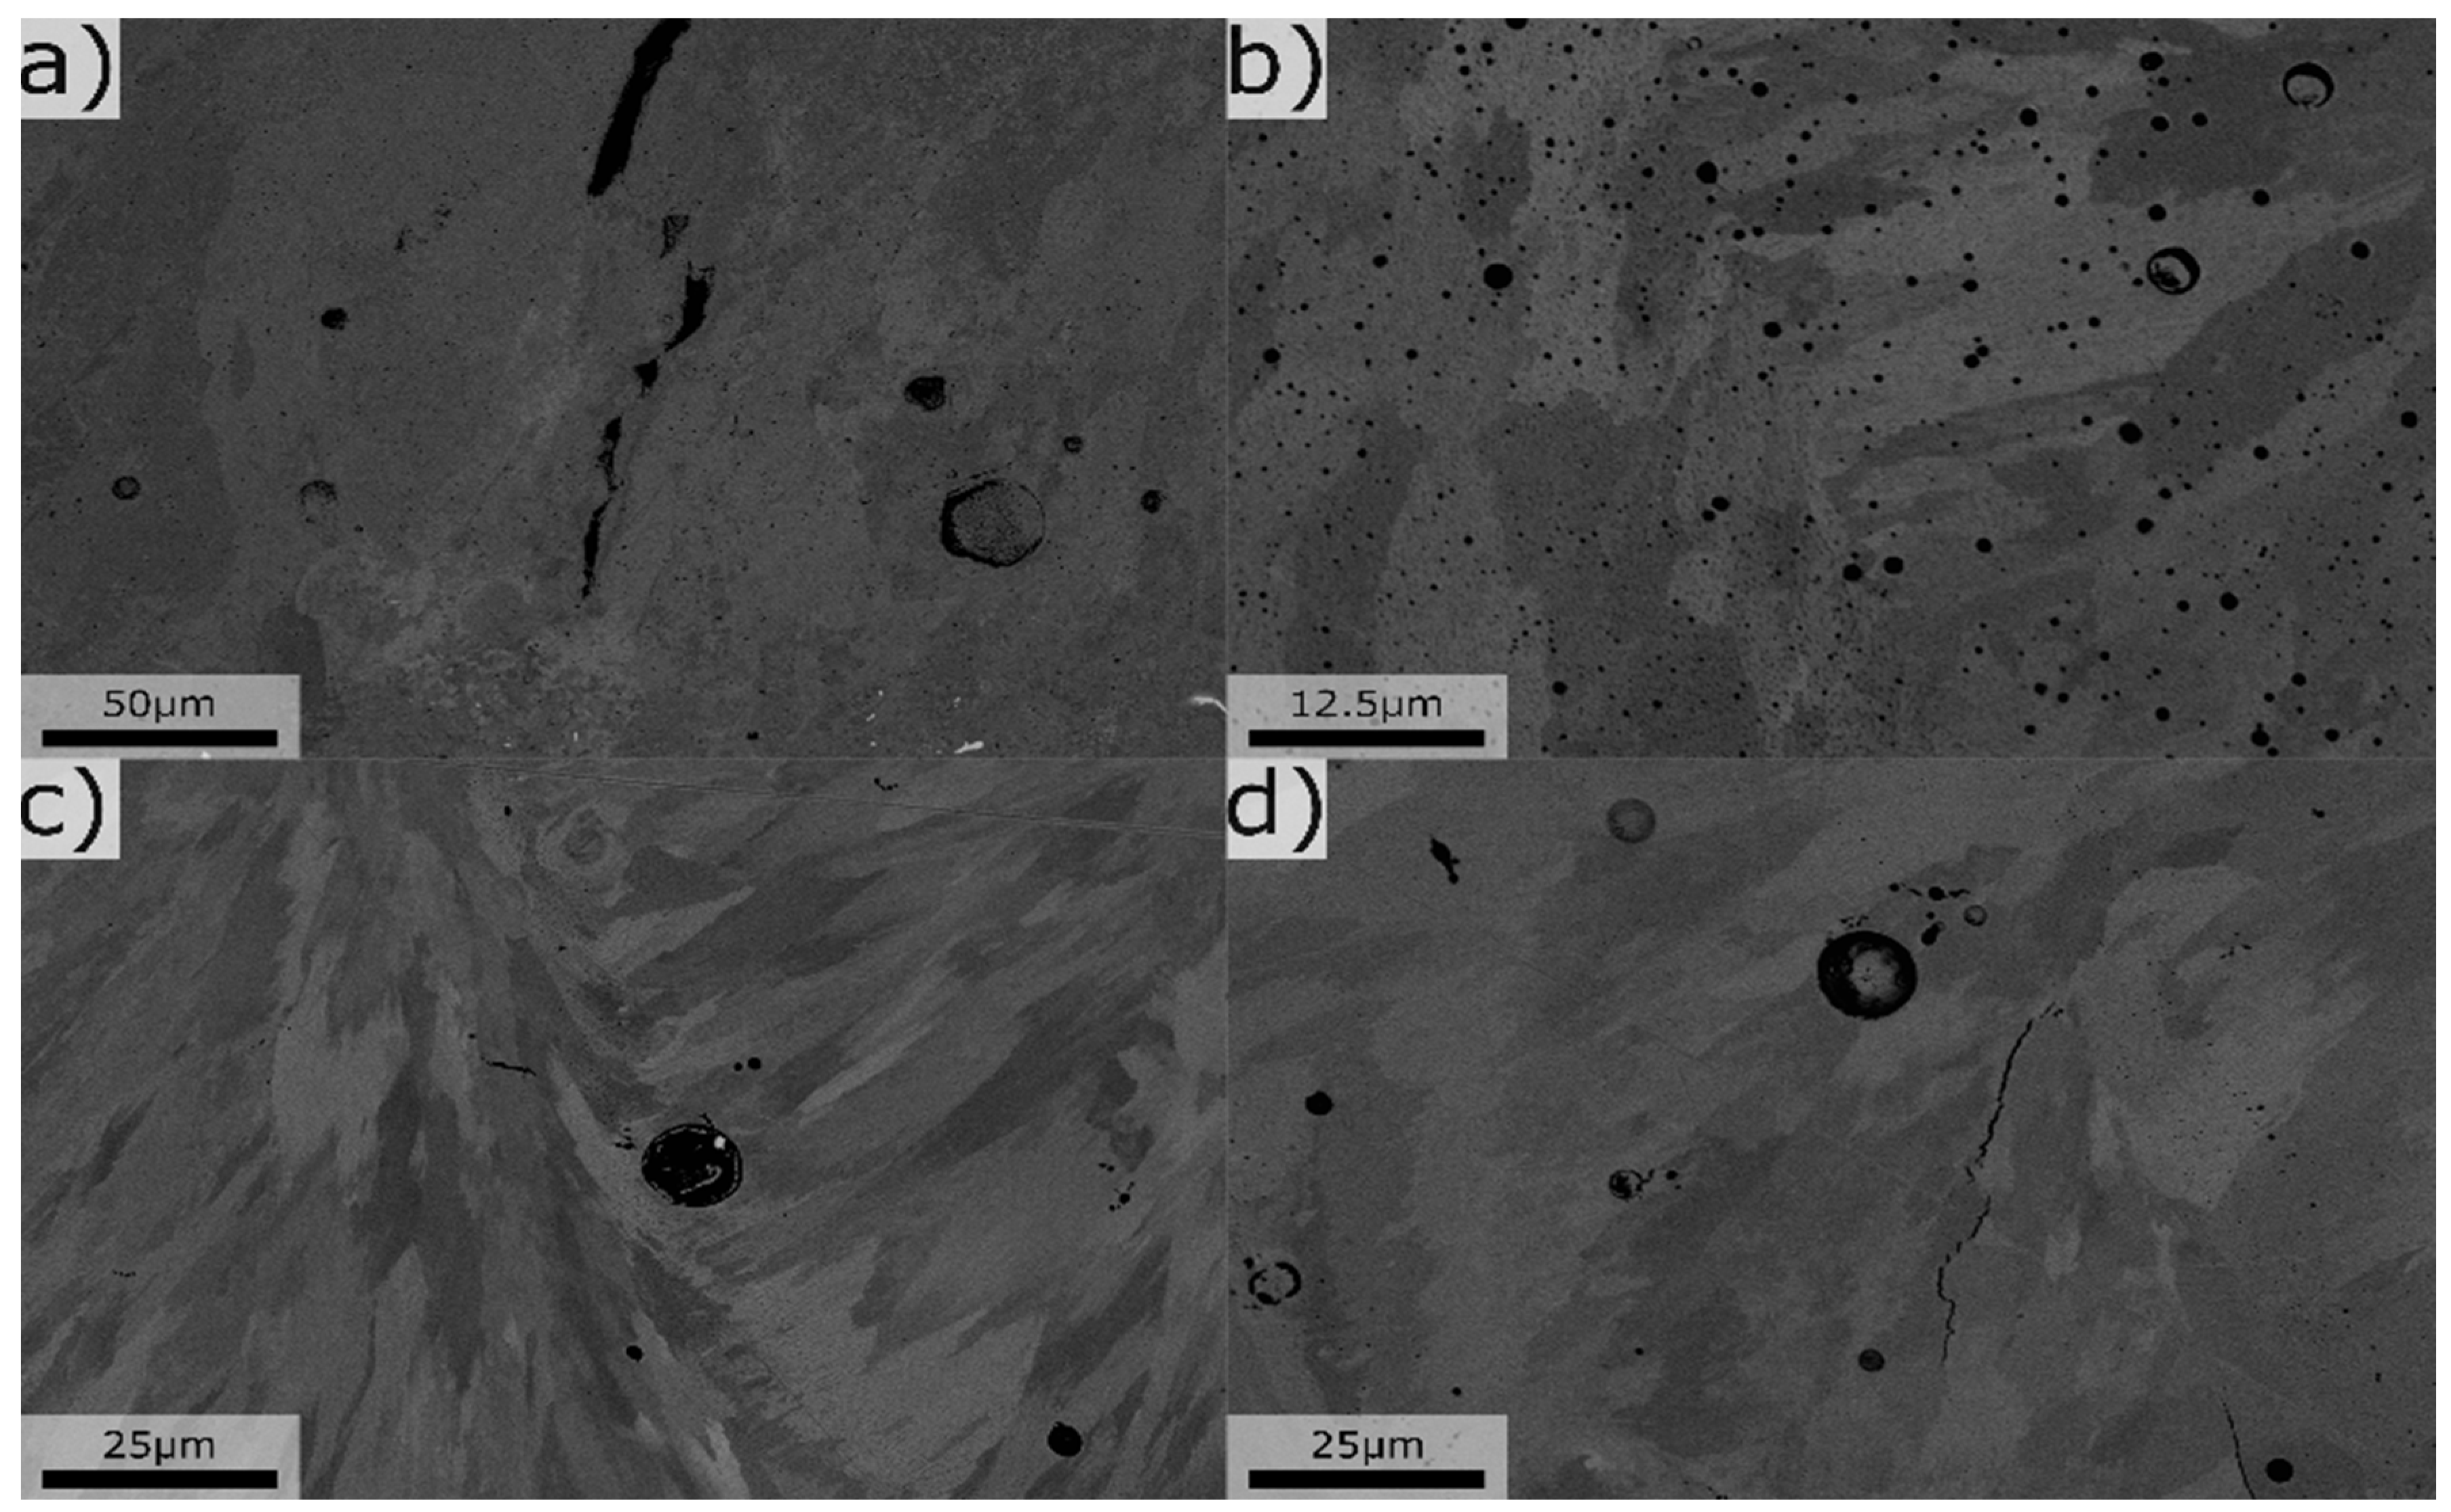
Figure 7.
Mg content before (in PVD film) and after (laser molten), for different levels of Mg.
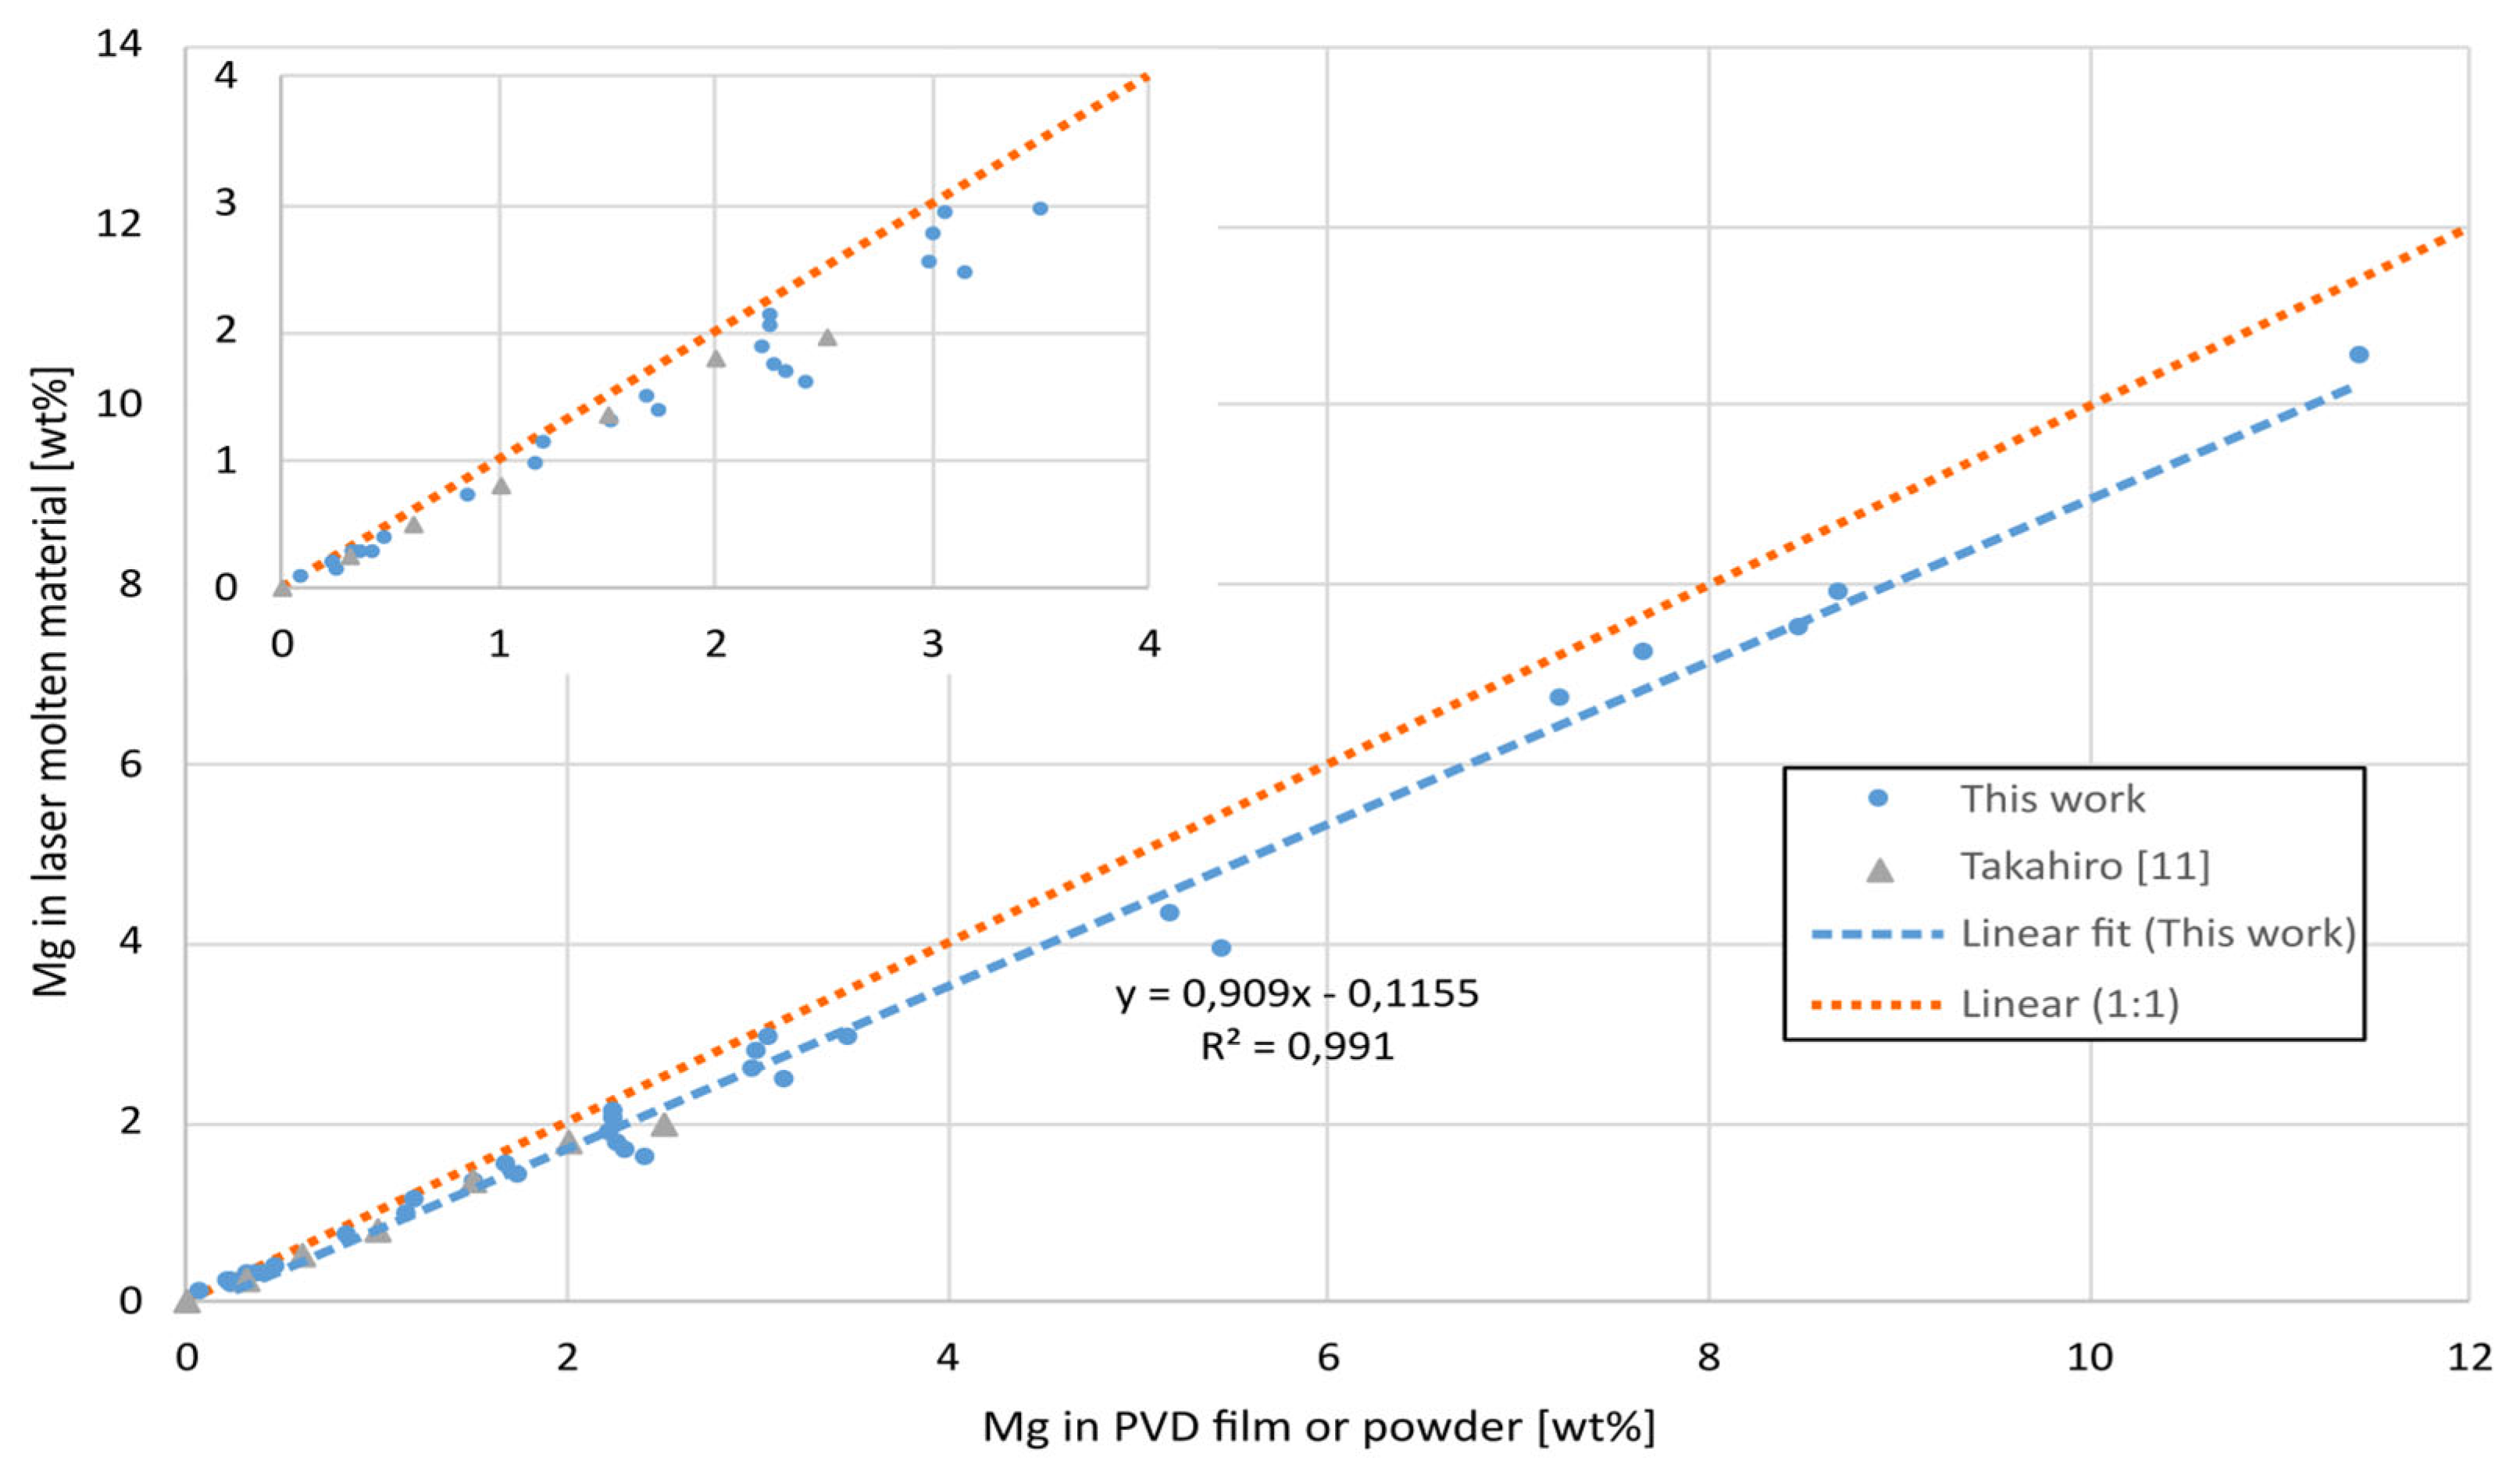
Figure 8.
Grain structure for different alloy compositions, a) 0.2wt%Mg, 2.4wt%Si, b) 3.4wt%Mg, 1.5wt%Si c) 7.8wt%Mg, 2.4wt%Si.
Figure 8.
Grain structure for different alloy compositions, a) 0.2wt%Mg, 2.4wt%Si, b) 3.4wt%Mg, 1.5wt%Si c) 7.8wt%Mg, 2.4wt%Si.
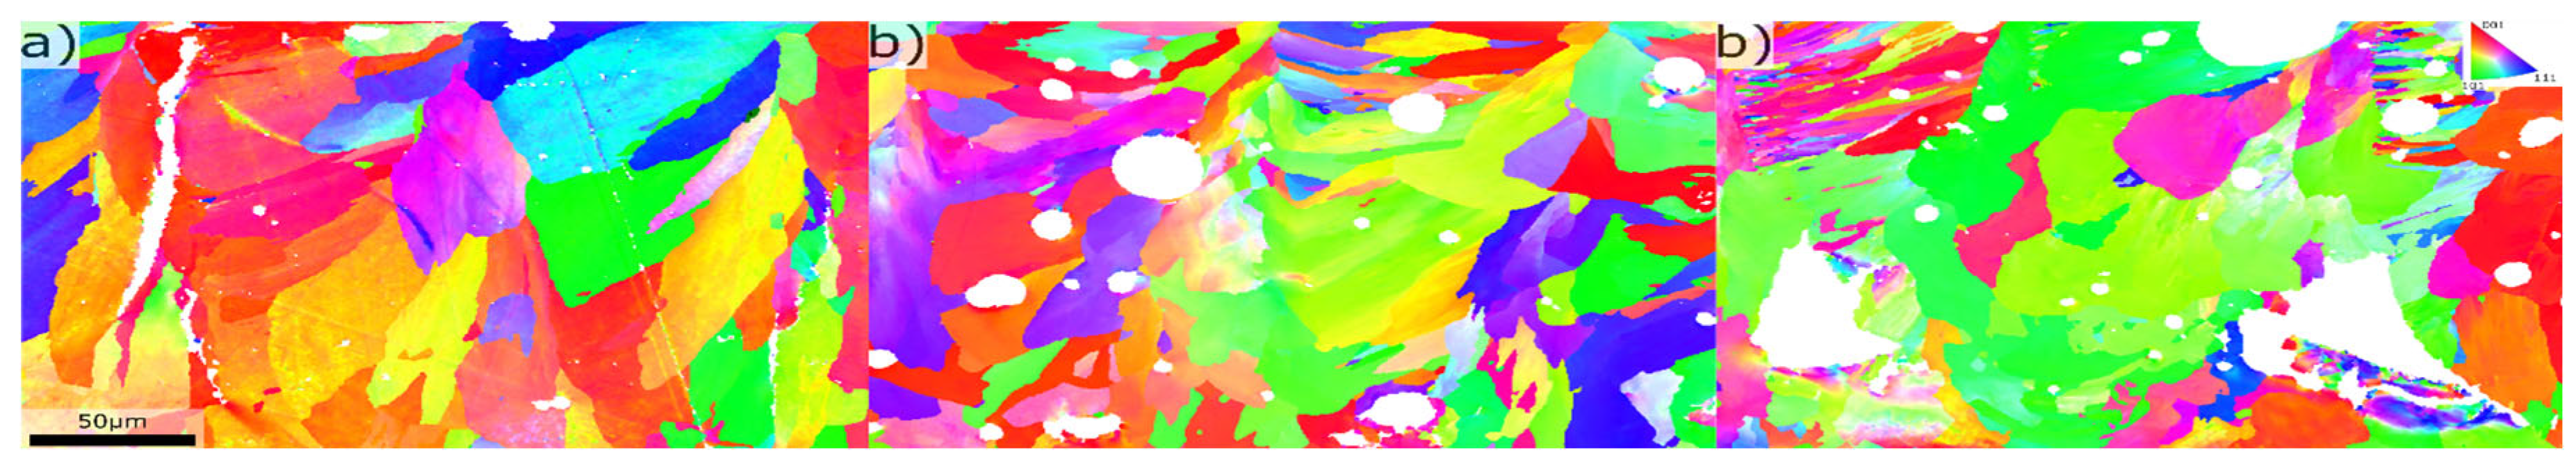
Figure 9.
As-built hardness a) mapped out in Mg Si composition space, black dots marks positions of average hardness in a 0.5wt% composition interval, b) influence of Mg for Si < 0.8wt% and Si for Mg > 11wt%.
Figure 9.
As-built hardness a) mapped out in Mg Si composition space, black dots marks positions of average hardness in a 0.5wt% composition interval, b) influence of Mg for Si < 0.8wt% and Si for Mg > 11wt%.
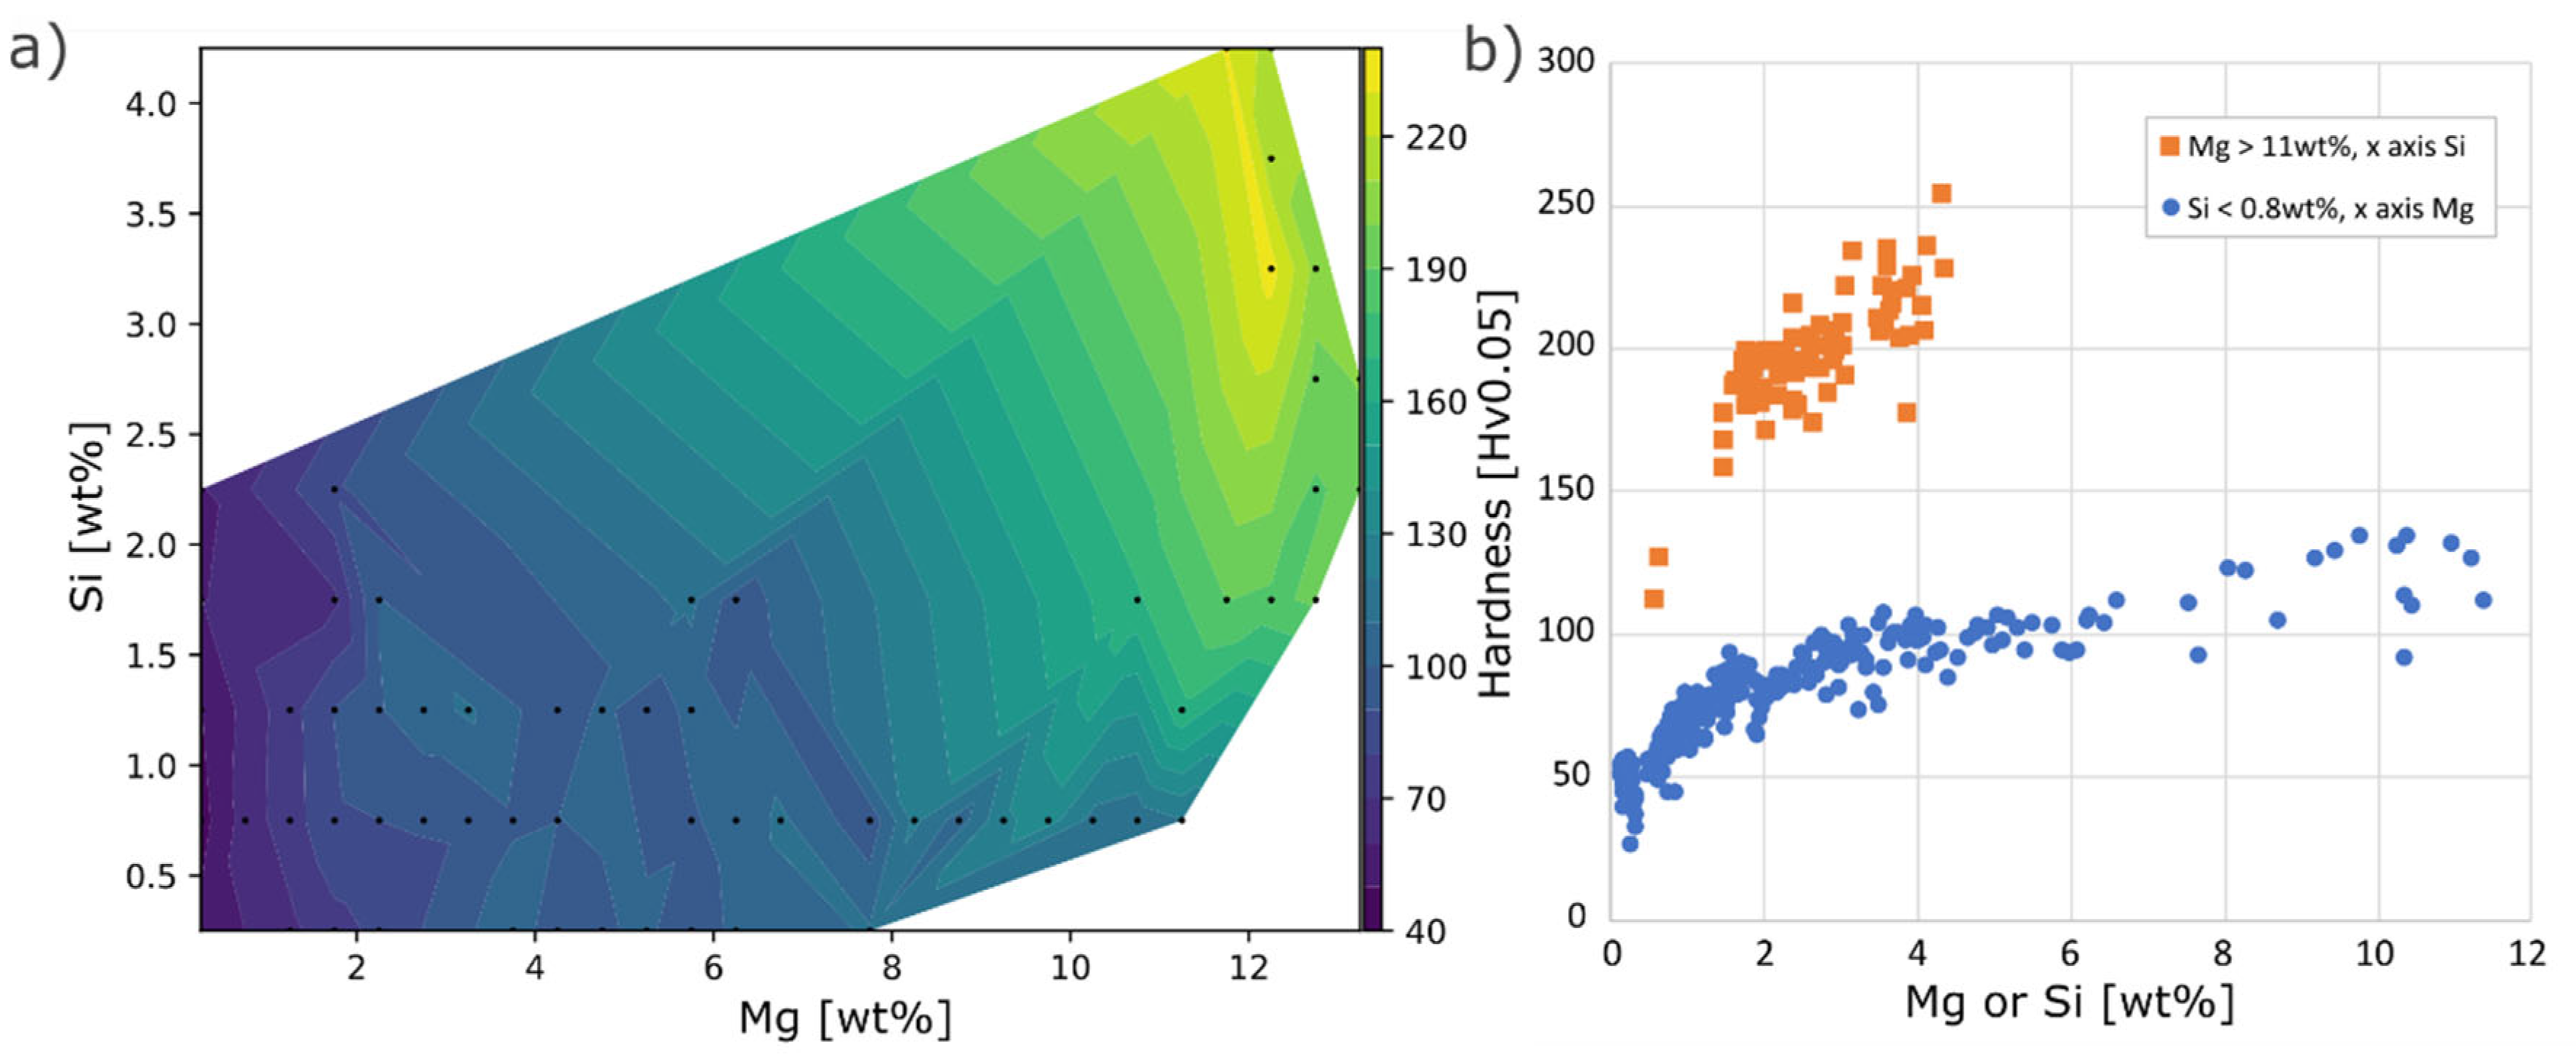
Figure 10.
a) XRD spectrums for all points, b) lattice parameter a mapped out in Mg Si composition space, black dots indicate XRD measurement position in composition space. c) Mg content against estimated Mg in SS.
Figure 10.
a) XRD spectrums for all points, b) lattice parameter a mapped out in Mg Si composition space, black dots indicate XRD measurement position in composition space. c) Mg content against estimated Mg in SS.
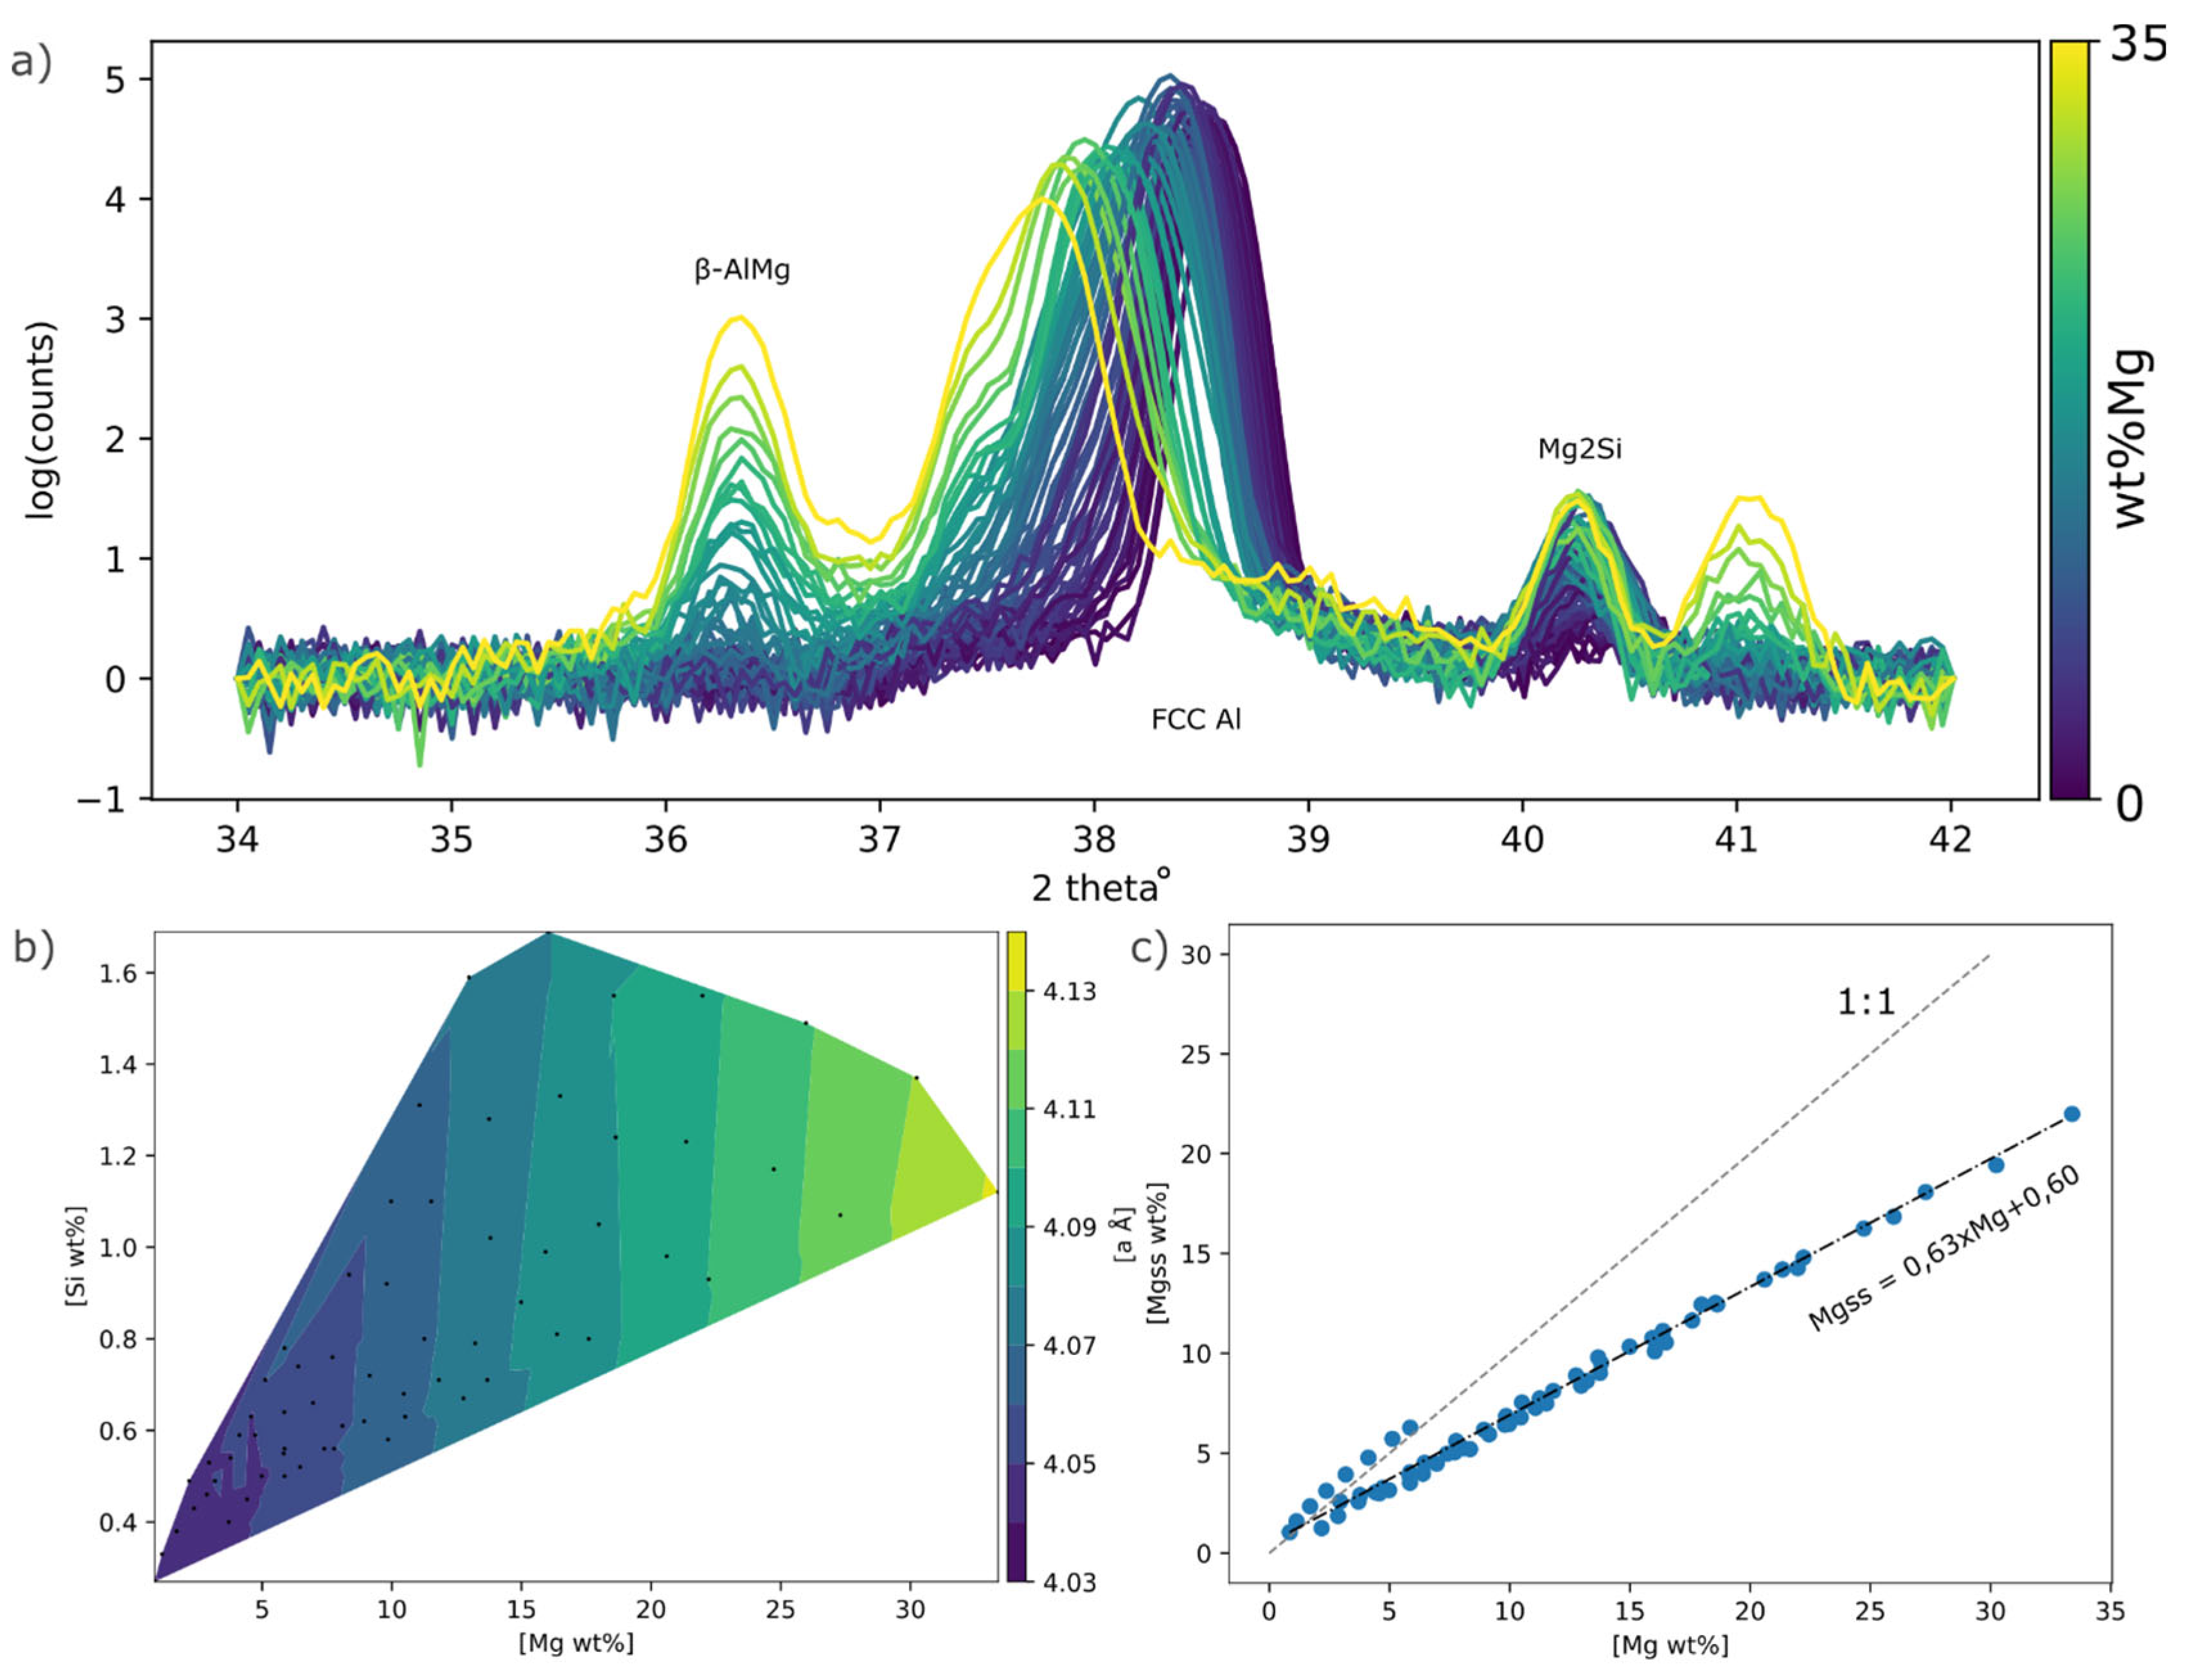

Table 1.
Grain size at different Mg and Si content.
| Mg [wt%] | Si [wt%] | Grain size [µm] | Std [µm] |
|---|---|---|---|
| 0,2 | 0,5 | 13,0 | 15,2 |
| 0,2 | 2,4 | 10,4 | 13,6 |
| 3,4 | 1,5 | 10,7 | 12,2 |
| 7,8 | 2,4 | 5,9 | 8,9 |
Disclaimer/Publisher’s Note: The statements, opinions and data contained in all publications are solely those of the individual author(s) and contributor(s) and not of MDPI and/or the editor(s). MDPI and/or the editor(s) disclaim responsibility for any injury to people or property resulting from any ideas, methods, instructions or products referred to in the content. |
© 2023 by the authors. Licensee MDPI, Basel, Switzerland. This article is an open access article distributed under the terms and conditions of the Creative Commons Attribution (CC BY) license (http://creativecommons.org/licenses/by/4.0/).
Copyright: This open access article is published under a Creative Commons CC BY 4.0 license, which permit the free download, distribution, and reuse, provided that the author and preprint are cited in any reuse.


