1. Introduction
All living bodies organize their lives via homeostasis, in which natural cell death plays a key role as an immune response. In a model of ageing without cell death, at 80 years of age, 2 tons of bone marrow and lymph nodes and a 16-km intestine would be generated in the human body [
1,
2]. Melino also commented that the rate of cell death was over 20 times faster than that of cell generation by mitosis [
1]. However, dying cells are rarely seen in a living body. A review article [
3] on cell death coincidentally reported that dead cells were rarely found despite the constant turnover of cells via natural cell death. Moreover, the authors of that review concretely presented the case for such a curious phenomenon in which even in the thymus, which is where cells die at a high rate, 80% of the thymus did not show any dead cells. Given these observations, where have the many dead cells in living bodies gone?
Despite the mystery of the disappearance of dead cells, new evidence that the failure to clear dead cells could give rise to various pathological conditions, from inflammation to cancer, has emerged [
4,
5,
6]. A systematic review on the metastasis of ovarian cancers demonstrated that cancer cells under metastasis disseminated to the visceral fascia on the liver and bowel serosa, the omentum, and the mesentery and parietal fascia on the diaphragm [
7]. On the other hand, the corresponding anatomical structures through which traditional and alternative medicines exert their effects are closely associated with the fascia system [
8,
9]. Nevertheless, in modern medicine, the fascia, which consists of collagen and elastin fibres with glycosaminoglycan [
10,
11], has long been regarded as a supporting matrix for internal organs. However, recent works for biologists and clinicians at a Boston meeting on the fascia system [
12] provided some insight into its new role in cancer therapy. Moreover, a current work showed that this intramuscular connective fascia is associated with aging [
13].
In the 1960s, a theory for a system of novel anatomical channels, the Bonghan duct (BHD) system, was presented by Kim, Bonghan as the 3rd circulatory system, adding to the blood and the lymphatic circulatory systems [
14,
15,
16]. Based on experimental data on the BHD system since 2002, Lee and Soh first proposed that the BHD system was closely related with the fascia system, and in 2009, they presented the “Bonghan-Fascia Model” of particular ducts in the fascia system [
17]. However, even though the primo vascular system (the new name for the BHD system) has been receiving international recognition, practitioners of orthodox biology and medicine are unfortunately still reluctant to accept the BHD system with fascia, owing to what they consider to be a lack of repeatability.
Thus, for the purpose of scientifically verifying the association of the BHD with the fascia (visceral and parietal) on internal organs in research on cell death, we designed a new vital staining method that stains with Janus Green B (JGB). With this new staining method, we were able, with high repeatability, to reveal corpuscle-connected filiform structures (CCFSs = Bonghan corpuscles and BHD) that were entangled on the visceral fascia (VF) and parietal fascia (PF) of the internal organs of rats. To characterize the CCFSs, we performed diverse examinations: in situ and in vivo examinations with stereomicroscopy, with serial sections of CCFSs being stained with haematoxylin and eosin using light microscopy and Mattson trichrome staining, with differential immunohistochemistry from lymph and blood vessels, with terminal deoxynucleotidyl transferase dUTP (2′-depxyuridine 5′-triphosphate) nick end labelling staining, with confocal laser scanning microscopy for whole specimens, with scanning electron microscopy on the CCFSs of the liver serosa and transmission electron microscopy on the CCFSs, with fluorescence-activated cell sorting, and with time-of-flight secondary ion mass spectrometry. From these various investigations, we were able to obtain significant data for the CCFSs that demonstrated their anatomical and histological origins with the implication of cell death within them. Thus, based on these data, we report our finding that CCFSs entangled on the fascia of the internal organs of rats are implicated in cell death and also discuss the potential biological significance of CCFSs.
3. Discussion
Using staining with Janus Green B (JGB), we were able to visualize reticular CCFSs entangled on the fascia system covering internal organs in the peritoneal and thoracic cavities of rats with high repeatability, and to the best of our knowledge, this is the first time that this has been done. The anatomical and histological novelties of these CCFSs were identified through imaging studies. Concomitant with such novel characteristics, the CCFSs in different fascia of internal organs shared a common characteristic, i.e., the envelopment of JGB-stained granules inside them. We have also found that the CCFSs were closely implicated in cell death using diverse microscopic investigations and TOF-SIMS.
The above mentioned findings reminded us of the mysterious work by Bonghan Kim in the 1960s (
Figure S8), in which he had insisted that the network system on the internal organs is part of a 3rd circulatory system that is independent of the cardiovascular and the lymphatic systems [
14,
15,
16]. Since Kim’s report, several articles have been published describing the mysterious structures, which are named Bonghan ducts (BHDs) and Bonghan corpuscles (BHCs), on internal organs that had been identified using various methods [
18,
19,
20,
21]. When comparing our new findings with those in the articles, we recognized that the previous articles could be classified into two categories based on the sampling procedure. The first category is based on Fujiwara’s work in the 1970s, which was research on Bonghan Kim’s original claim (Fujiwara and Yu 1967). Based on Fujiwara’s approach, the first result from Soh’s team on the mysterious structures on the internal organs of rabbits was produced in 2005 [
18]. The second category is based on the chemical dyes used to visualize the new anatomical structures on the internal organs of animals [
23,
24].
Even though some findings imply the existence of such new anatomical structures on the internal organs, skepticism has remained in the major sciences, which is mainly owed to the lack of scientific repeatability. Moreover, we found that one of the most important limitations in previous works was the lack of a heparinized condition before the visualization was performed. So that we would be able to specifically visualize only the CCFSs, we removed even the slightest chance of blood clotting by treatment with heparin via intravenous injection and intraperitoneal injection. In one rat among the 15 rats, we failed to visualize the CCFS clearly enough to provide statistical data. This was probably the result of us using a low concentration of JGB with a short peritoneal incubation. However, as summarized in
Table S1, with high repeatability (93%), we were able to visualize CCFSs on various internal organs. They were specifically revealed in the loose connective tissues and fascia, covering internal organs in the peritoneal and thoracic cavities of rats.
More importantly, in order to realistically and immediately verify the existence of CCFS without further examination, we developed an impromptu coupling method to compare the SM and LM of the same CCFS on an internal organ, such as the intestine or the diaphragm (
Figure 2). This impromptu coupling of the SM and LM for the same specimen made possible a connection between the CCFS revealed in the SM and that revealed in the LM of the JGB-stained granules in the CCFS. This direct comparison allowed us to be certain that novel anatomical structures were entangled on the fascia of internal organs before we conducted further examinations. By using this coupling method, we found that the CCFSs had a reticular form and were as dense as nearby blood capillaries on the same tissue, as shown in
Figure 1 and
Figure 2. Such findings suggest that CCFSs are novel anatomical structures distinctly different from those previous reported on the same internal organs. In addition, we recognized that owing to the fluorescence (λmax = 660 nm) of JGB [
25], the JGB-stained structures in the CCFSs could be sorted and distributed, as shown in
Figure 2. Their distributions were different from those of the control tissue in terms of granularity and relative size, indicating that the CCFSs and nearby control tissues were different not only in morphology but also in content. Moreover, the widely scattered distribution in the test CCFS compared with that in control tissue implies that CCFSs consist of many disintegrating cells, as well as normal cells.
Thus, by coupling the results of the SM and LM examinations with pilot FACS data for JGB-stained structures, we postulate that the reason JGB incubation selectively revealed the CCFSs may be JGB’s selective staining target in the granules of the CCFSs. Unfortunately, with these FACS data, we were unable to correlate the distributions and images in all of the areas, P1~P3, of the CCFS via a re-collection process. However, in future work, this FACS approach using the auto fluorescence of JGB-stained granules will play an important role in developing specific markers or antibodies for the CCFSs.
JGB molecules were first reported by Michaelis for supra vital staining of mitochondria [
26]. However, as a vital staining dye in living bodies, Yack first used JGB to visualize nerves [
27]. However, its binding to sites in the nervous system was not clear enough for further application. Furthermore, Lee et al. injected JGB dissolved in ethyl alcohol into the lymphatic vessels of rabbits for visualization of the BHDs and BHCs. However, the solvent for JGB, ethanol, turned out to be harmful to the inner walls of the lymphatic vessels [
28]. Lazaro and Cooperstein described the specific proteins in the mitochondria that might be the binding sites for JGB molecules [
29]. However, the target molecules in the mitochondria or nerves that are stained by JGB still require investigation. Thus, even though JGB incubation could specifically reveal the novel CCFS on the internal organs of rats, as shown in our data, the precise mechanism for JGB’s ability to preferentially stain the novel anatomical structures, CCFSs, in situ and in vivo needs to be elucidated.
Based on these results, we can summarize the biological characteristics of the CCFS as follows: a CCFS reticular network entangled on the fascia of internal organs (
Figure 1,
Figure 2 and
Figure 3), a differential immunohistochemistry different from those of lymph and blood vessels (
Figure 4C), the presence of dead cells, as revealed by TUNEL staining (
Figure 4D), and the co-existence of approximately 1-μm-sized DNA particles, extracellular DNA signals (DAPI), and signals for fragmented F-actin in the CCFSs (
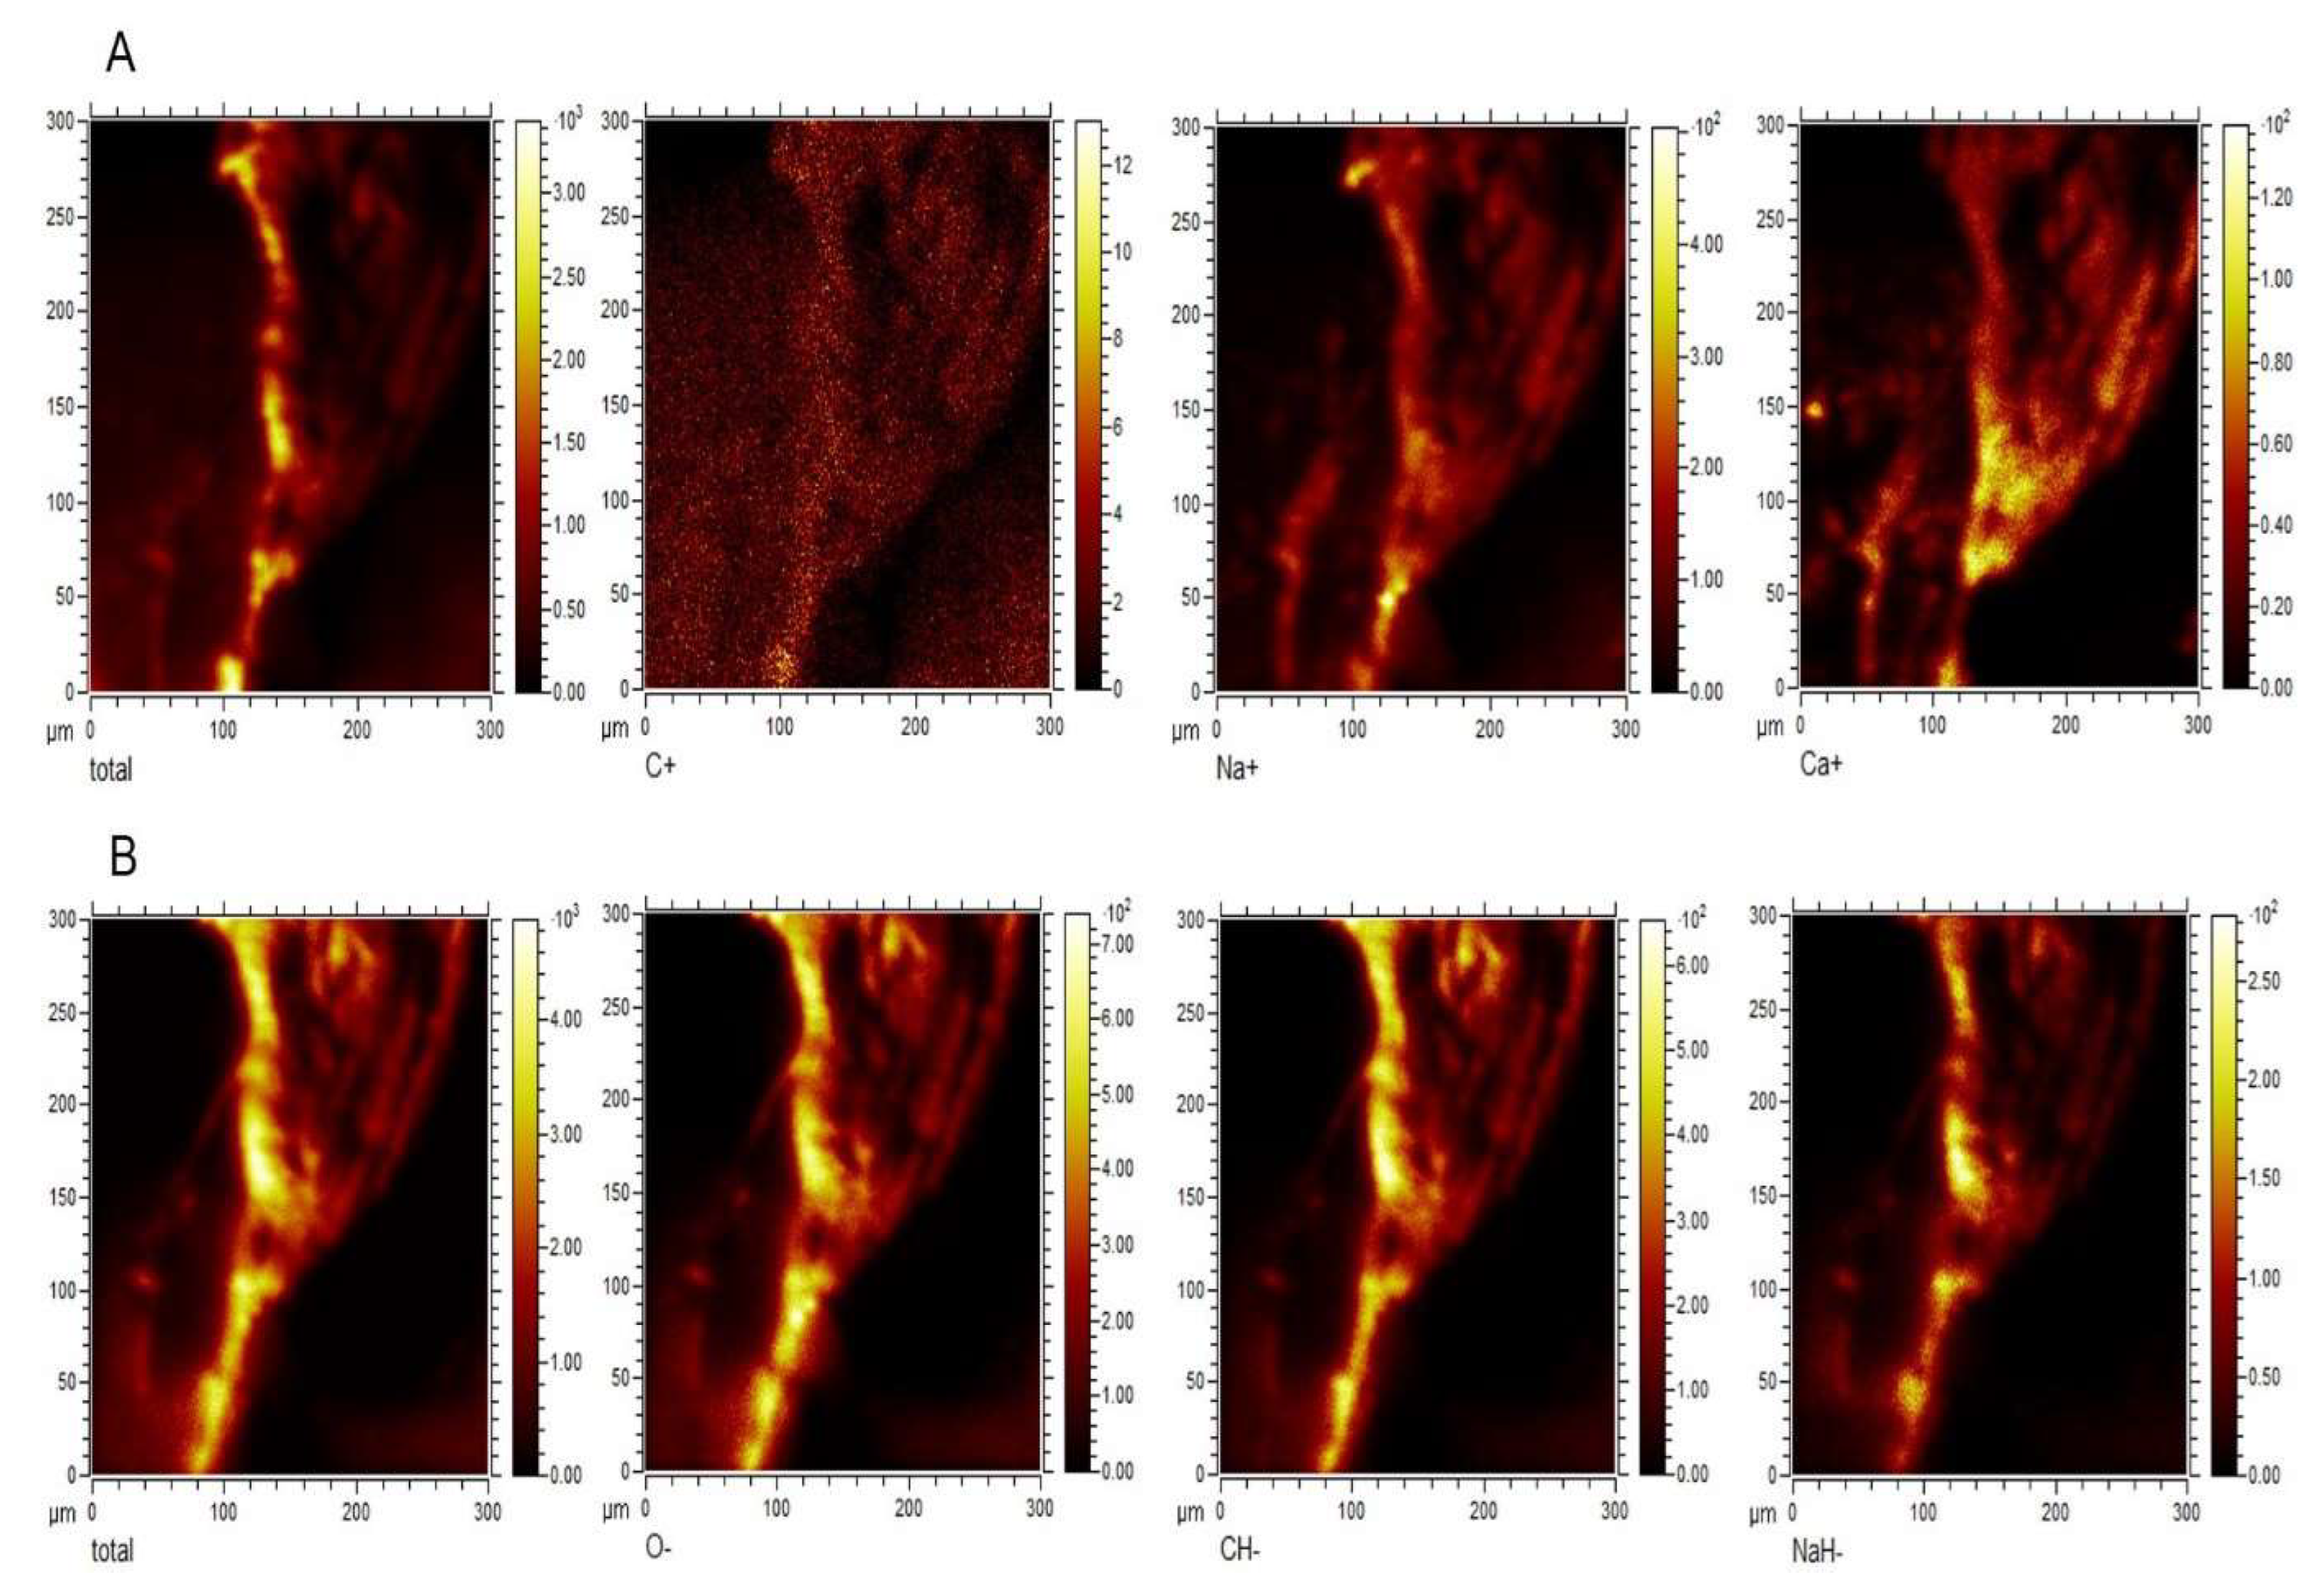
Figure 5), a comparatively high 2D concentration of calcium ions in the CCFSs, as determined using TOF-SIMS (
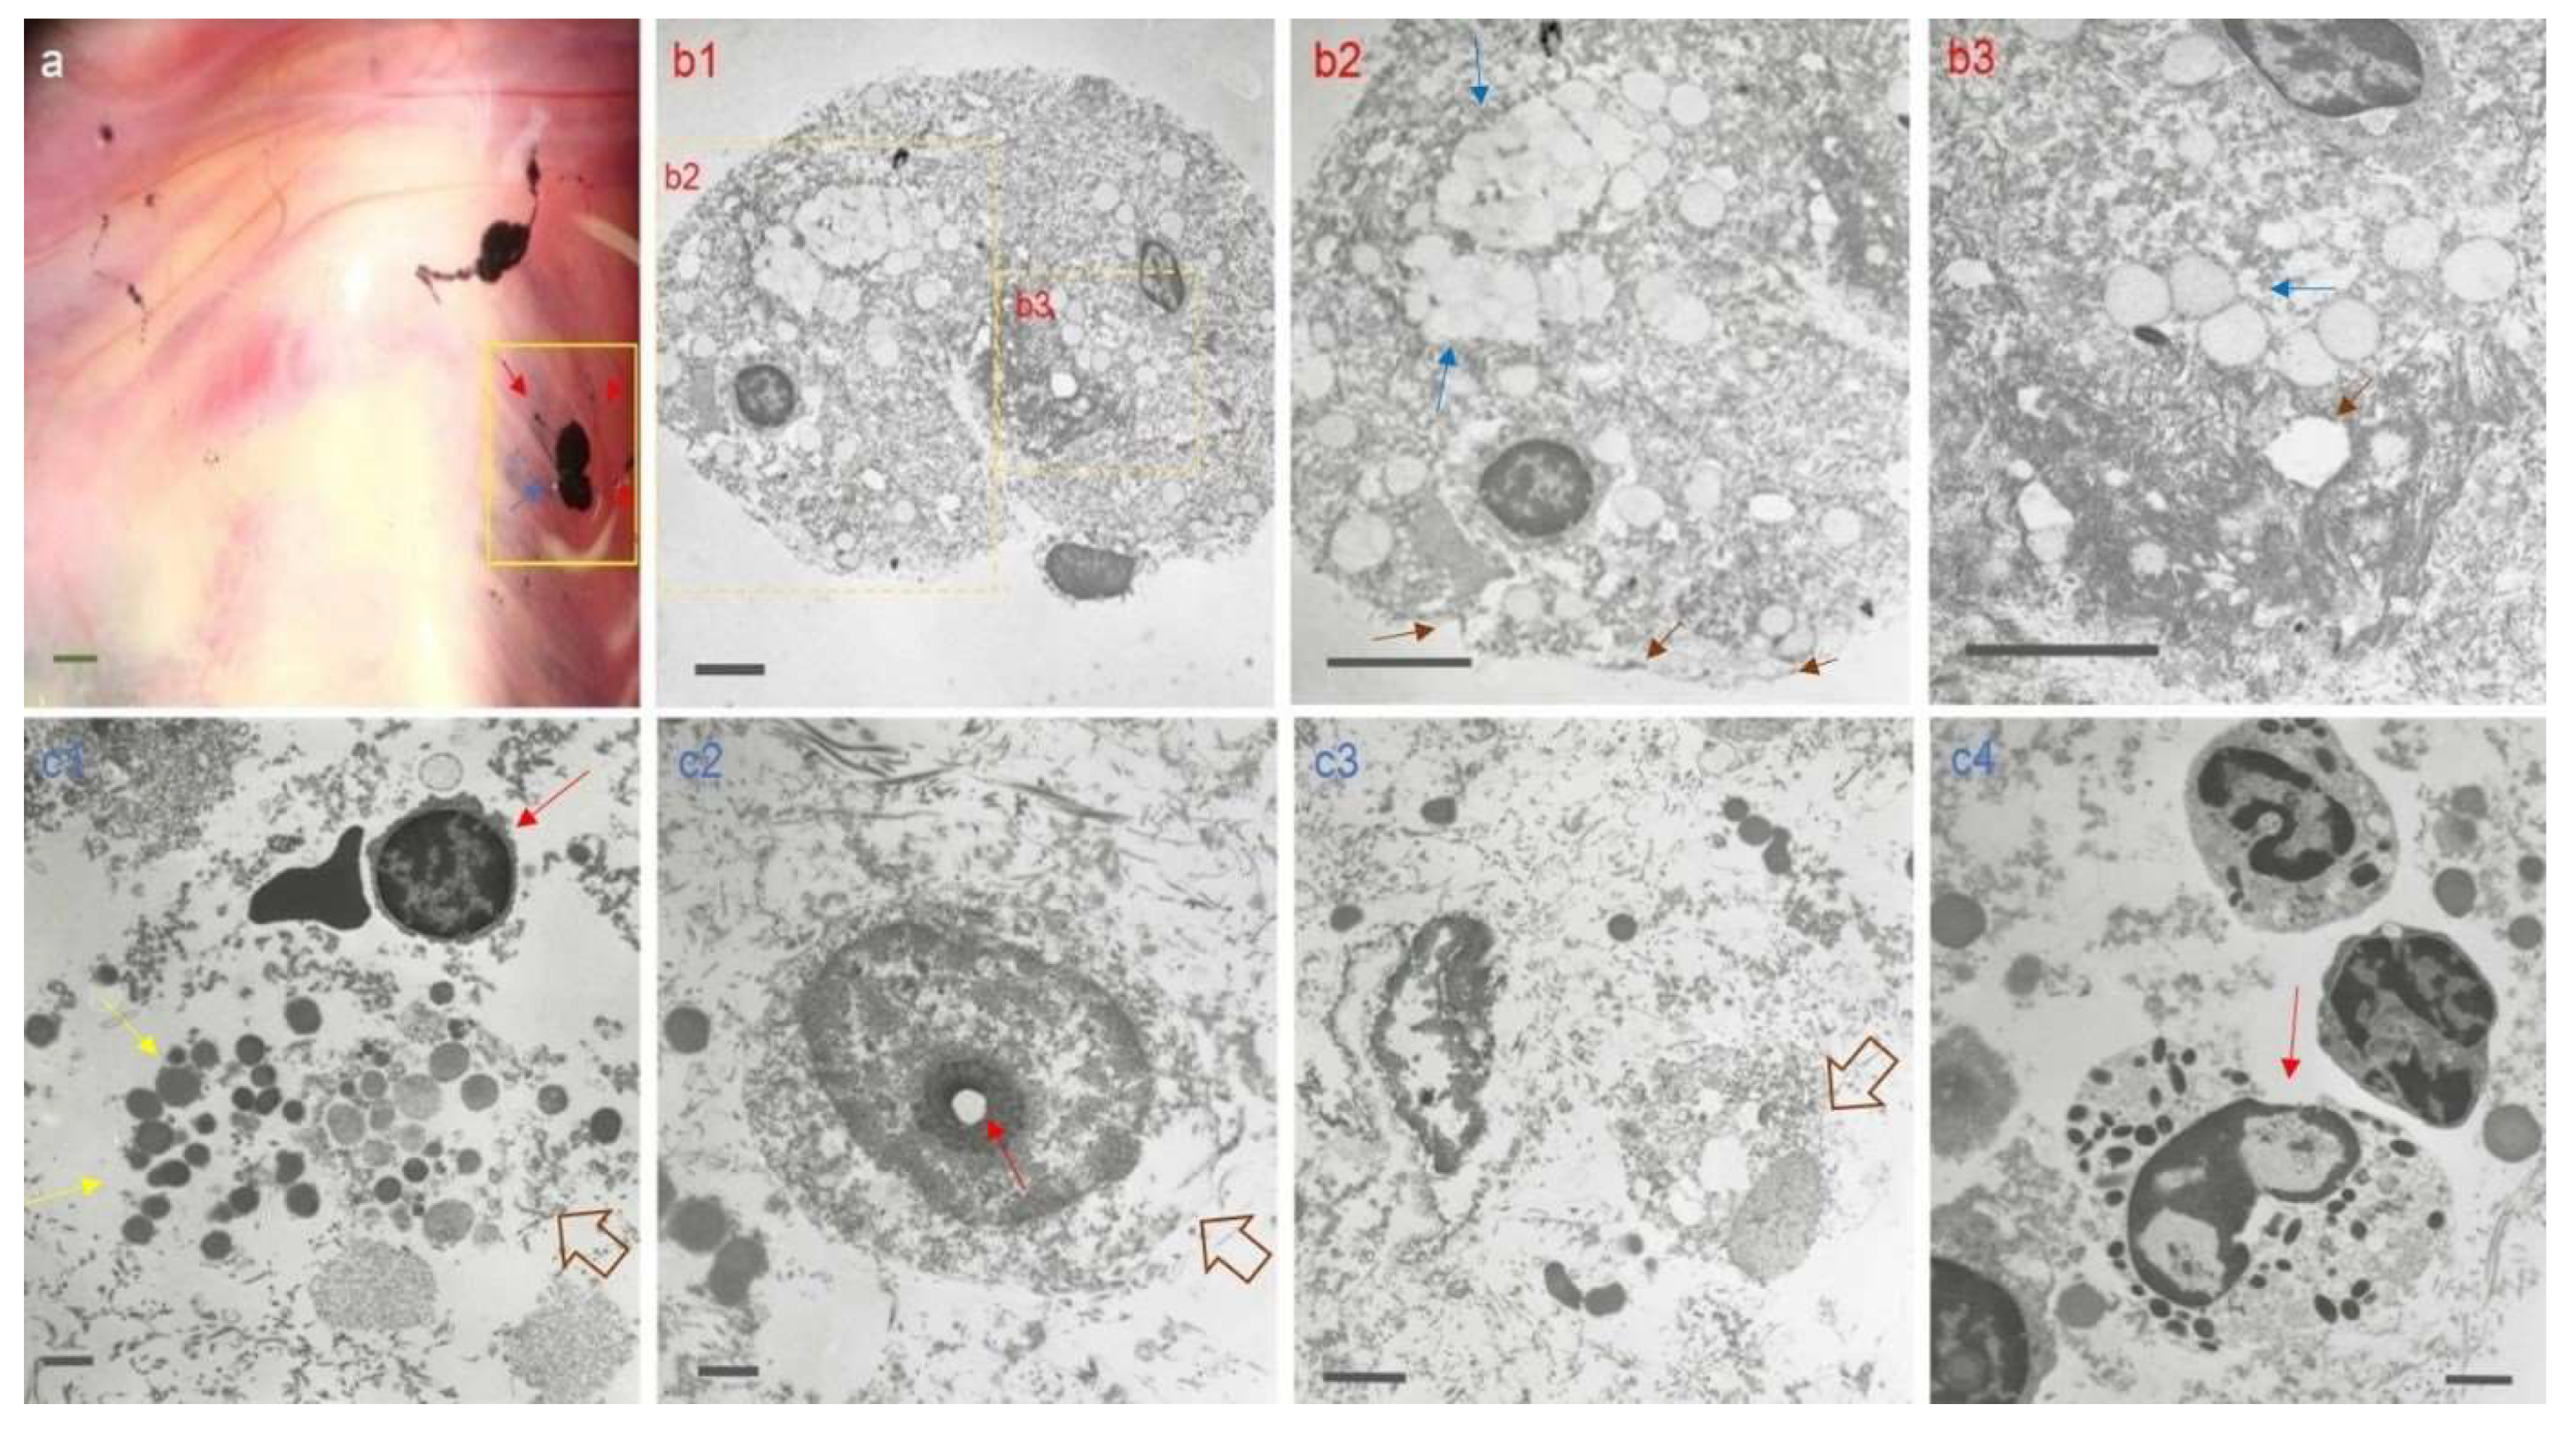
Figure 6), and the presences of disintegrating cells, many cytoplasmic vacuoles, and ruptured plasma membranes, as shown in the TEM images (
Figure 7).
Under apoptosis, DNA fragmentation and blebbing of plasma membranes and apoptotic bodies are observed, and fragmented actin molecules play a key role in apoptosis of cancer cells [
30]. Choi et al. reported that eDNA was released in vitro via apoptosis and necrosis in cells [
31]. In ophthalmology, eDNA was also investigated, and the images of DAPI-stained eDNA were unique [
32], which is in agreement with our eDNA images. Moreover, TUNEL has been widely used for detecting fragmented DNA molecules by labelling the 3′-hydroxyl terminals in double-stranded DNA molecules broken under apoptosis [
33]. Notably, according to recent applications of TOF-SIMS to biological tissues, a relatively high concentration of calcium in a tissue is thought to be an indication of dying cells [
34]. And at present we do not understand why the concentration of oxygen in CCFS is relatively higher than that of other anion elements. However, we pay attention to the role of oxygen in regeneration, stem cell and cell death as some works reported on the role of oxygen for wound healing [
35], neural stem cells and apoptosis [
36]. The TEM images in this study provided evidence for the existence of dead cells. Thus, a summary of the biological characteristics for CCFSs, as found in this study, leads to the conclusion that cell death is associated with the physiological functions of the CCFSs among the internal organs.
The first concept of natural cell death has its basis in Kerr et al.’s “apoptosis,” which was published in 1972 [
37]. In general, cell death in living bodies can be understood by two main streams, apoptosis and necrosis [
38]. Between these two types, we hypothesize that CCFSs may contain necrosis-like cells based on the above necrosis characteristics, many vacuoles, ruptured plasma membranes, and disintegrating cells, which were found in this study. Furthermore, given that dead cell-containing CCFSs were in situ and in vivo visualized without damaging serous membranes near the CCFSs, as shown using TUNEL staining (
Figure 4), the process of cell death in the CCFSs might be very specific in terms of anatomical location. Recent data have shown that this TUNEL process could stain not only apoptotic dead cells but also necroptosis-evoked dead cells, which are necrosis-like but are programmed for cell death [
39].
TEM has been used to clearly describe the morphological characteristics of dead cells. In TEM images showing apoptosis and necroptosis, apoptotic cell death is characterized by a condensed cytosol, marginalized chromatin, and fragmented nuclei. However, the characteristics of necroptosis are a permeabilized plasma membrane and the translucence of the cytoplasm [
40]. As shown in
Figure 7, TEM images of the CCFSs showed necroptosis-like features such as ruptured plasma membranes with granules and cytoplasmic translucence. Based on these TEM images and the TUNEL-positive images, we conjecture that cell death in the CCFSs may resemble a naturally programmed necrosis, named “necroptosis,” rather than only necrosis. However, these TEM images did not show every kind of dead cell in the CCFSs. Recently, cross-talk among different types of cell death, apoptosis, autophagy, necrosis and necroptosis, have been reported [
41,
42]. Based on the data with implications of cell death in the CCFSs, we assume that these novel CCFSs could be venues for dynamic cell death with cross-talk depending on the physiological and pathologic conditions. Furthermore, given that the CCFSs are widely and densely located in the loose connective tissue of the fascia system, as shown in our results, the CCFSs may serve as hiding places for dead cells, possibly answering the question as to where the numerous dead cells in living bodies have gone [
1,
2,
3].
On the other hand, medical evidence that a lack of the clearance of dead cells in a living body could be a trigger for tissue inflammation and cancer has been accumulating [
4,
5,
6]. The specific genes and proteins that modulate cell death as signals have been investigated [
43,
44]. In addition to such molecular approaches, alternative and comprehensive applications have been considered in order to reduce cancerous symptoms via modulating the fascia system. For example, Langevin and colleagues insisted that cancer patients, as well as many others, might be helped by a proper manipulation of the connective tissues of the fascia system [
45]. However, basic studies that explain the clinical effects of the fascia systems in the treatment of patients with cancer have been too limited to determine the role of the connective fascia tissues in ameliorating cancerous clinical findings. Nonetheless, a systematic review on the metastasis of ovarian cancers in the peritoneal cavities made clear that the pattern for the metastasis of cancer cells was closely related with the fascia systems [
7]. Even in 1964, a clinical study involving 500 patients showed that the removal of the fascia causes more frequent metastases of malignant skin melanomas [
46]. Such reviews and clinical studies on the fascia and metastasis have given us insight into the close inter-relationship between the therapeutic role of the fascia in clinics and the pattern of cancer metastasis with the fascia.
Figure 1.
Representative stereoscopic images of the reticular network of corpuscle-connected filiform structures (CCFSs). (A) Representative images of the CCFSs on the outermost membranes of internal organs, the visceral fascia (VF), the diaphragm and abdominal walls, the parietal fascia (PF), the VF of the lung, and the PF of the diaphragm are shown. In the VF panel, a1 indicates a low-magnification view of the CCFSs, in which the blue arrows indicate the corpuscles on the VF of the lung. a2 shows a magnified view of the yellow rectangle in a1 where several corpuscle-connected filiform structures are seen, with the locations of the filiform structures and the corpuscles indicated by the red and blue arrows, respectively. In the PF panel, a1 shows a low-magnification image of the CCFSs, in which most of the CCFSs are (blue arrows) corpuscles that are stained black. However, only one filiform structure connecting the corpuscles, which is indicated by the red arrow, is observed. However, a2, which shows a magnified image of the rectangle amid the area in a1, distinctively shows several corpuscle-connected (blue arrows) filiform structures (red arrows). Scale bars: in the VF, a1: 500 μm and a2: 250 μm; in the PF, a1: 500 μm and b2: 200 μm. As further demonstrations, some other SMs of the CCFSs are uploaded in the Figures S10, S11, and S12). (B) In situ and in vivo direct holding technique: CCFSs slightly elevated using micro forceps. The arrows indicate the CCFS (b1) on the VF of fat tissue around the vena cava in a deep area of the abdomen. The open arrow points to a corpuscle that is heavily stained with JGB. Notably, the blood vessel beneath the filiform structures is not stained. The inset (b2) shows an original image of the CCFS before it was lifted with micro forceps. Both scale bars are 500 μm.
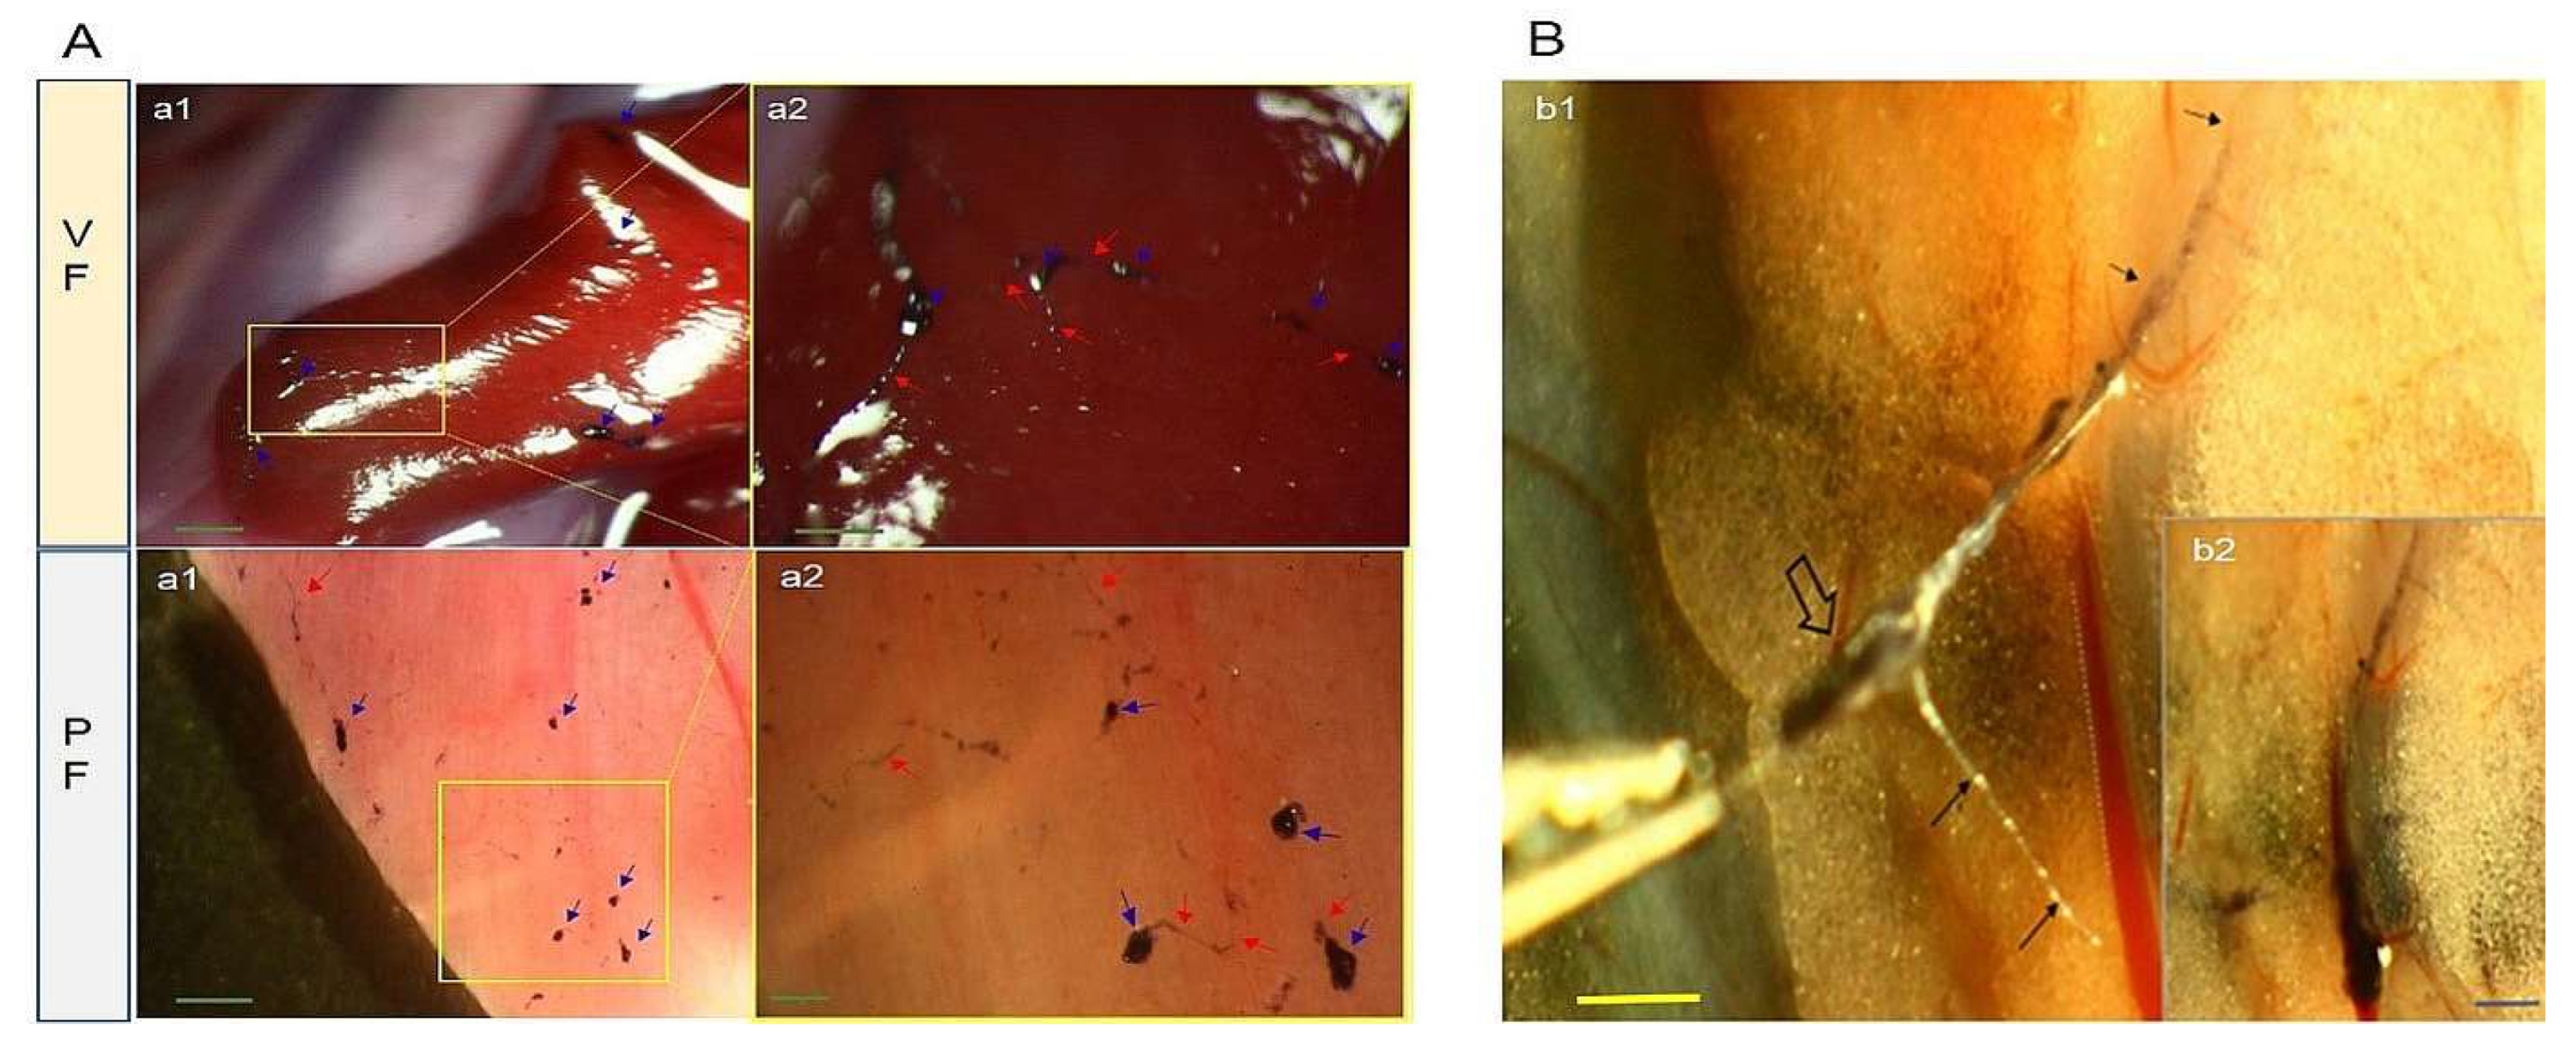
Figure 2.
Impromptu coupling examination using stereomicroscopy and light microscopy of corpuscle-connected filiform structures (CCFSs) on the small intestine (visceral fascia, VF) and diaphragm (parietal fascia, PF), as well as fluorescence-activated cell sorting (FACS). (A) The VF panel shows stereoscopic images (SMs) of CCFSs on the serosa membrane of the small intestine. (a1) Low-magnification SM for the distribution of CCFSs visualized on the small intestine. Among the blackish CCFSs in a1, the area inside the dotted rectangle is magnified, and the image is shown in a2. The corpuscles are distinctively visualized. The corpuscles in a2 are clearly revealed in vitro under a light microscope (a3, a4 and a5). The rectangle in a3 is magnified into a4, where the filiform structures (red arrows) between the corpuscles (blue arrows) are clearly visualized. At this magnification, a4, the JGB-stained granules (green arrows) are noticed. The granules (green arrows) are revealed in a5. Scale bars: a1: 500 μm; a2: 150 μm; a3: 100 μm; a4: 50 μm; and a5: 50 μm. The PF panel shows the SMs of CCFSs on the outermost membrane (PF) covering the diaphragm. (a1) Low-magnification SM for the distribution of CCFSs on the diaphragm of a rat is shown. The rectangle in a1 is magnified into a2, in which corpuscles (blue arrows) are clearly revealed with some filiform structures (red arrows). The SMs of a2 are clearly visualized in vitro under a light microscope (a3, a4 and a5). The rectangle of a3 is magnified into a4, in which filiform structures (red arrows) between corpuscles (blue arrows) are revealed by the JGB-stained granules (green arrows). Many of the granules (green arrows) are clustered into a corpuscle in a5. Scale bars: in the VF, a1: 500 μm and a2: 500 μm; in the PF, a3: 200 μm, a4: 50 μm, and a5: 50 μm. (B) Distributions of the components of the CCFSs (b1) and controls (b2) via FACS. In (b1), the P1, P2, and P3 are 57.3%, 30% and 26%, respectively, and in (b2), they are 59.3%, 17.4% and 12%, respectively. The x-axis: FSC-A and y-axis: SSC-A represent the relative sizes of the components (cells and granules, respectively) and their granularities.
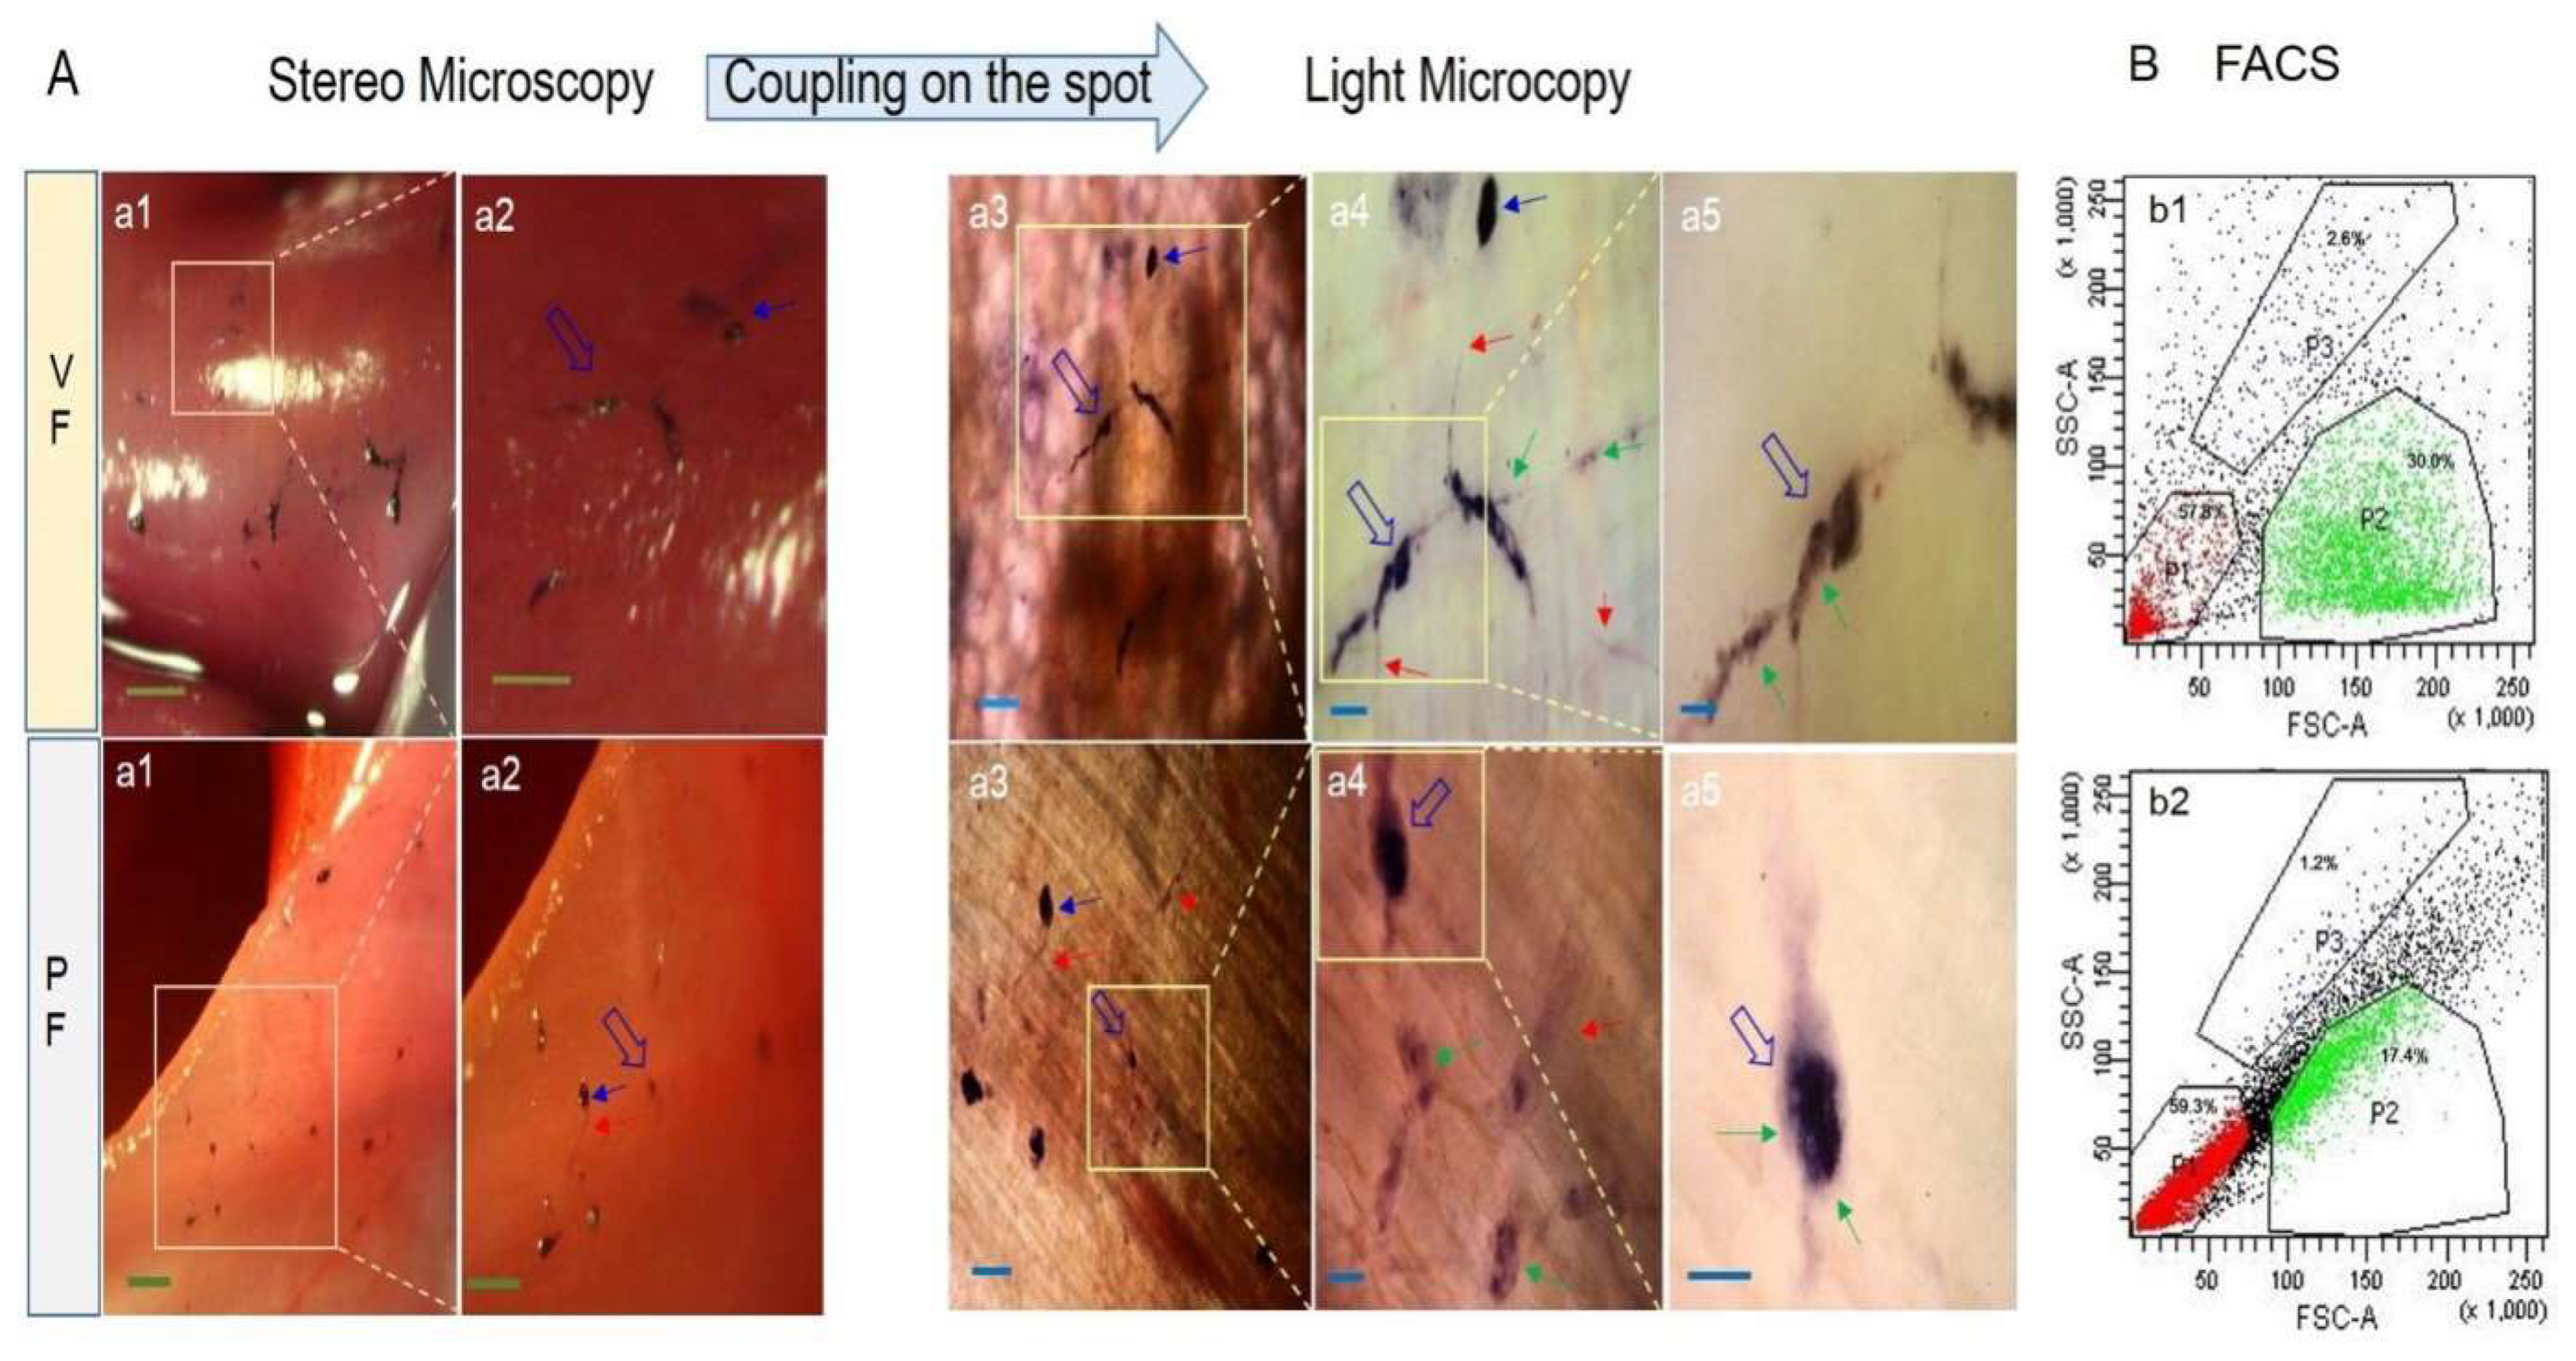
Figure 3.
Scanning electron microscopy (SEM) images (b1 ~ b7) of the corpuscle-connected filiform structures (CCFSs) on the outermost membrane, the serous visceral fascia (VF), of the liver based on light microscopy images (LM, a1, and a2). In a1, some CCFSs (blue arrows) are visualized on the liver; the CCFS in the rectangle is magnified into a2. In a2, two corpuscles (two blue arrows) are seen with distinctive filiform structures (red arrows). However, the open blue arrow indicates a small corpuscle, which is not seen in a1. The yellow dotted rectangle in a2 shows the CCFS entangled with the outermost membrane of the liver, which shows the same pattern as those in the SEM images (yellow-dotted rectangles) in b6 and b7. Scale bars: a1: 100 μm and a2: 50 μm. Under SEM, b1 shows the lowest magnification image of a CCFS on the liver. The blue rectangle in b1 was magnified into b3. The yellow one in b1 was magnified into b2 and b4, where the blue arrow indicates the same corpuscle. Clear filiform structures (red arrows) are revealed in b2 and b4. The white and red rectangles in b3 are magnified into b5 and b6, respectively. The green rectangle in b2 is magnified into b7. Notably, the images of the CCFSs (yellow dotted rectangles) in b6 and b7 show that they are entangled on the outermost membranes, the serosa, of the liver, as shown in the yellow-dotted rectangle in a2.
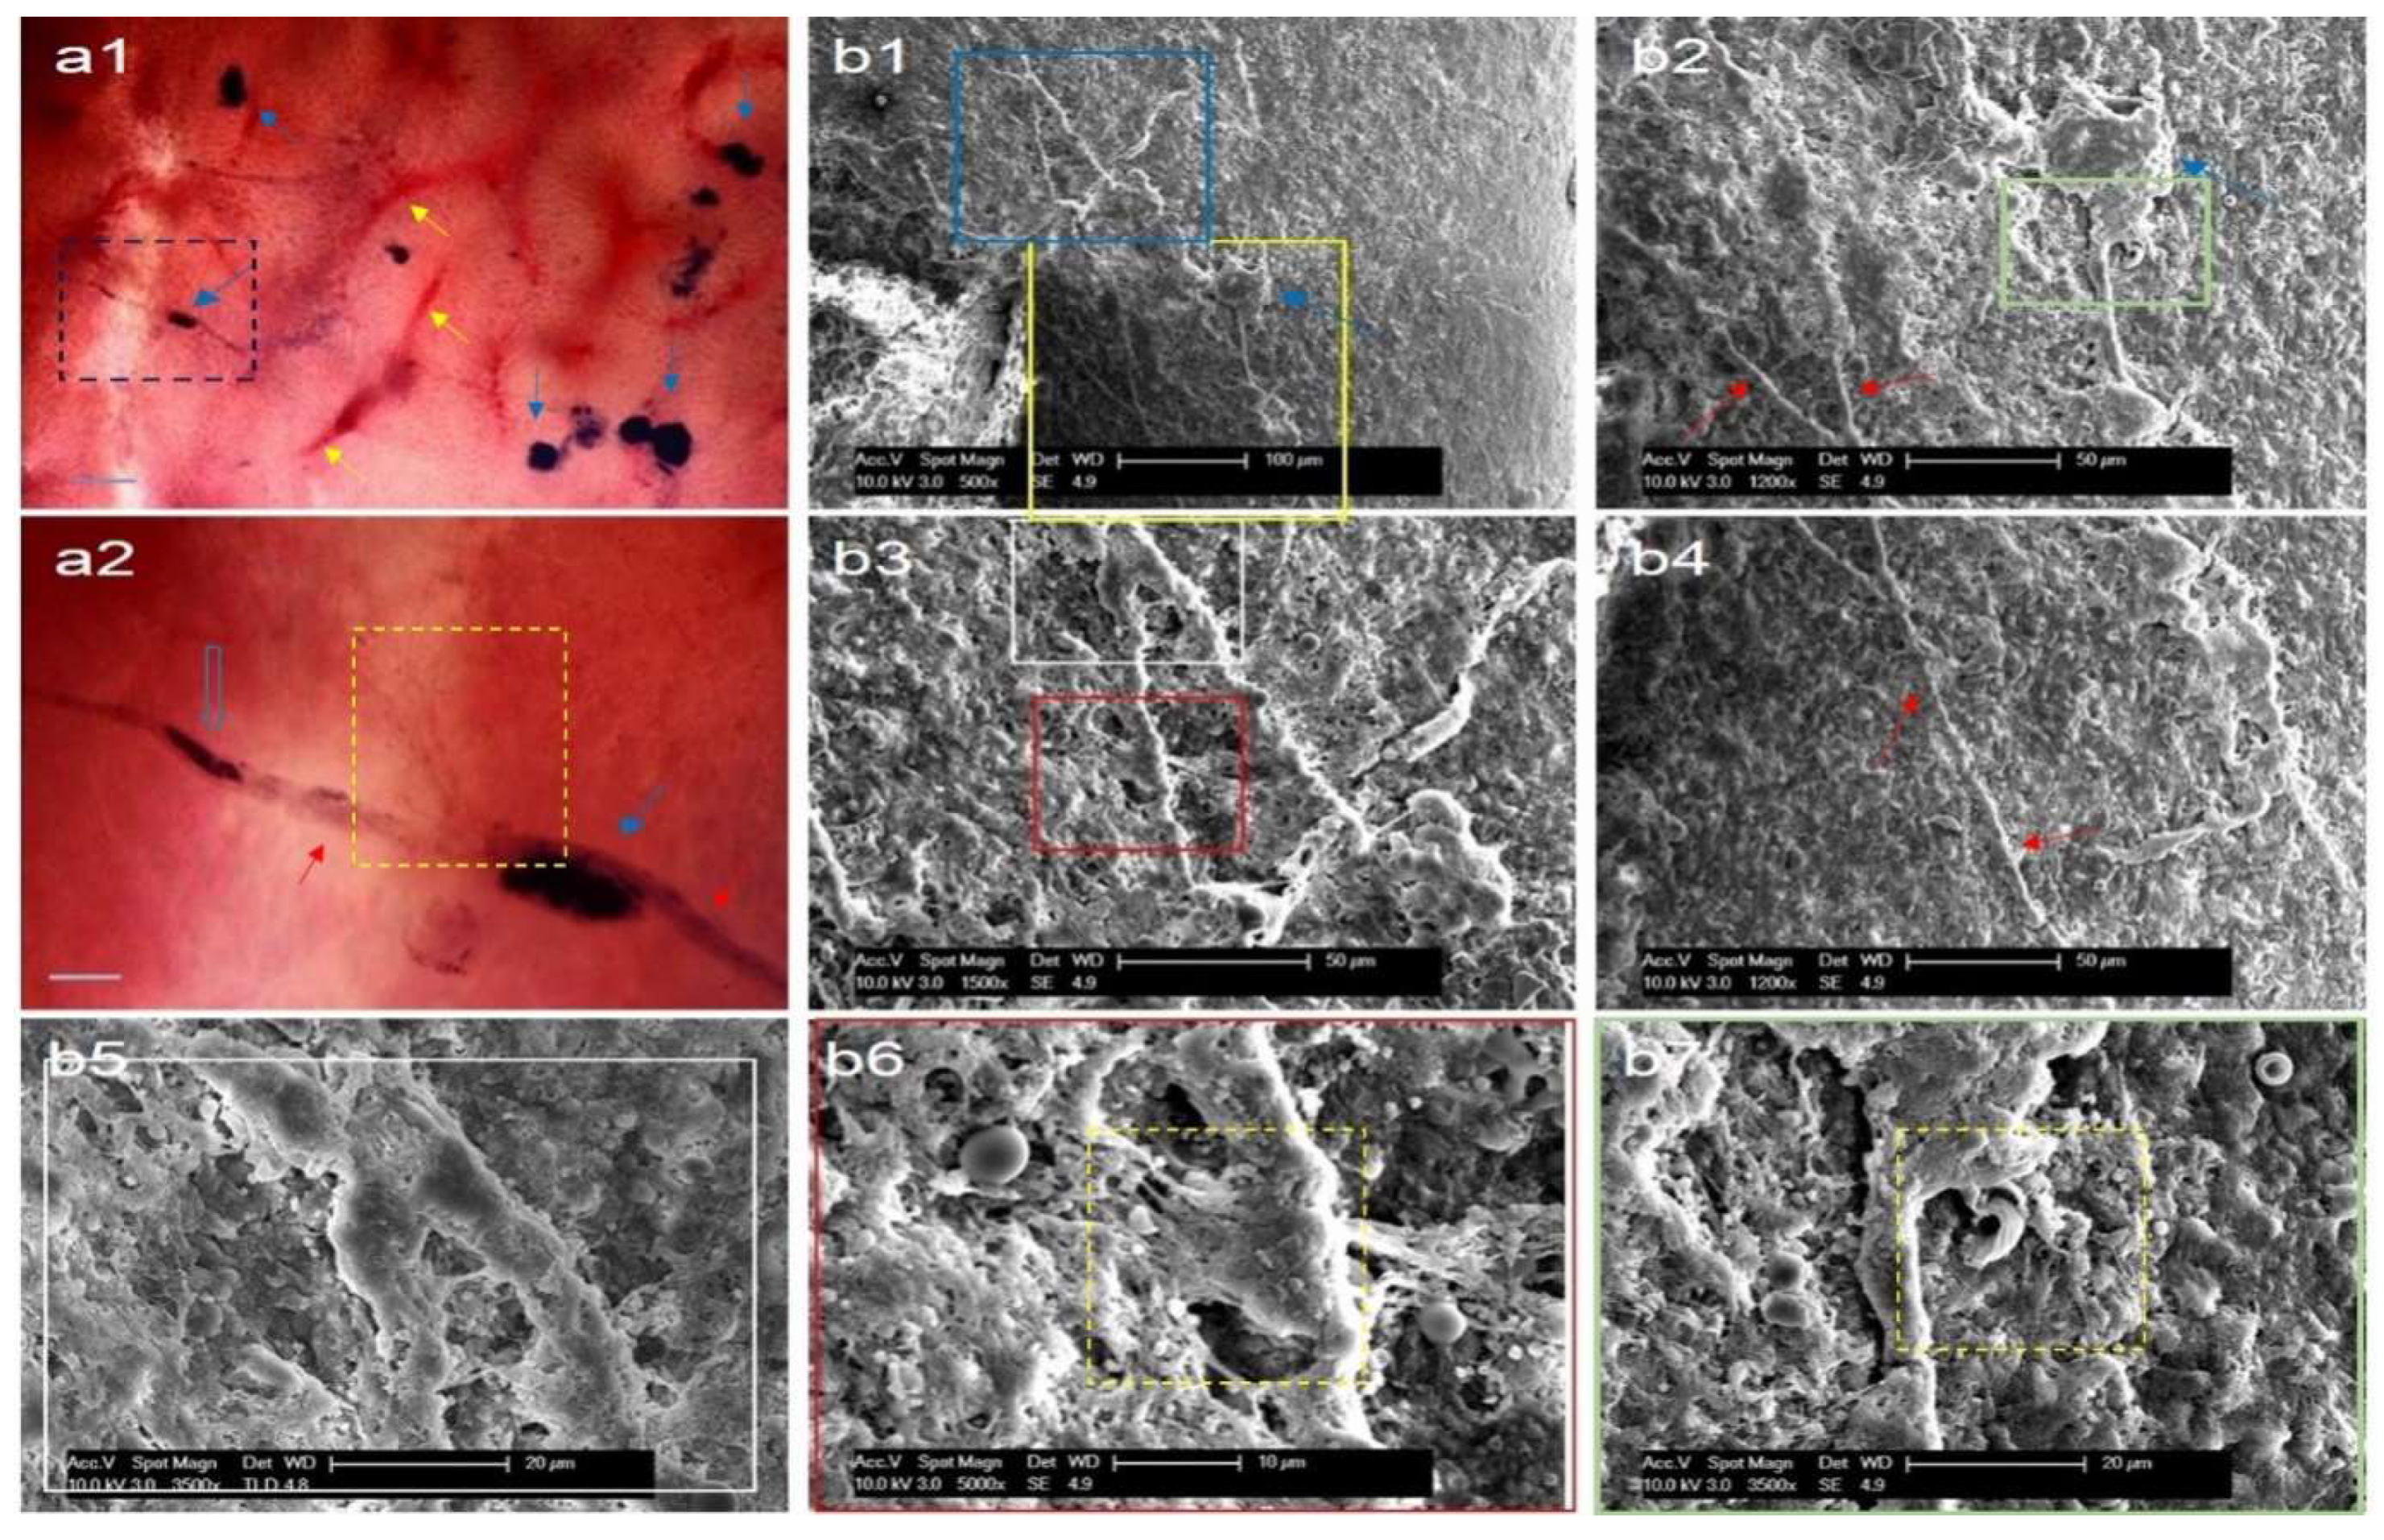
Figure 4.
Histological characteristics of corpuscle-connected filiform structures (CCFSs) on the outermost membrane of the serially sectioned small intestine. Each number shows a gradual magnification (200´, 400´ and 1,000´) of the same specimen from left to right in A, B and D. For C, two magnifications, 200´ and 400´, are seen. (A) Haematoxylin and eosin staining. The blue arrows show nearby CCFSs in the same area with the filiform structure (FS), which is indicated by the red arrow. In the magnified view of the CCFS (1000´), basophilic granules (green arrows) and a pale cytoplasmic cell (open arrow) are observed. Scale bars: 50 μm (200´), 40 μm (400´), and 10 μm (1,000´). (B) Mattson trichrome staining. The red arrows indicate the CCFSs, and the blue arrows show other nearby CCFSs in the same area as the FS, which is indicated by the red arrow. Image number 2 is divided into two parts in both the upper and lower panels. Notably, in the magnified (1000´) view of the CCFS in slide number 8, some outermost blue-coloured collagen fibres (yellow arrows) and heavily stained nuclei (green arrows) with thin-sectioned white-brown FS are observed. Scale bars: 50 μm (200´), 40 μm (400´), and 10 μm (1,000´). (C) Immunohistochemistry with LYVE-1 (a1, a2) and CD31 (b1, b2). The lymphatic vessel (open blue arrow) was stained in a bright brown colour using LYVE-1. However, the CCFS (red arrow) was negative against LYVE-1, as shown by the dark grey colour with blue. For the CD31 staining, the CCFSs (red arrows) were stained in dark grey. However, the blood vessels (open arrow and inset) show a bright brown colour. Scale bars: a1: 20 μm (200´), a2: 20 μm (400´), b1: 40 μm (200´), b2: 20 μm (400´), and inset: 20 μm (200´). (D) Terminal deoxynucleotidyl transferase dUTP nick end labelling (TUNEL). The cells positive against TUNEL, the dead cells, are seen at 1000´ magnification (red arrows). However, the cells negative against TUNEL, the live cells, are seen as blue-coloured ones. Scale bars: 50 μm (200´), 40 μm (400´) and 10 μm (1,000´).
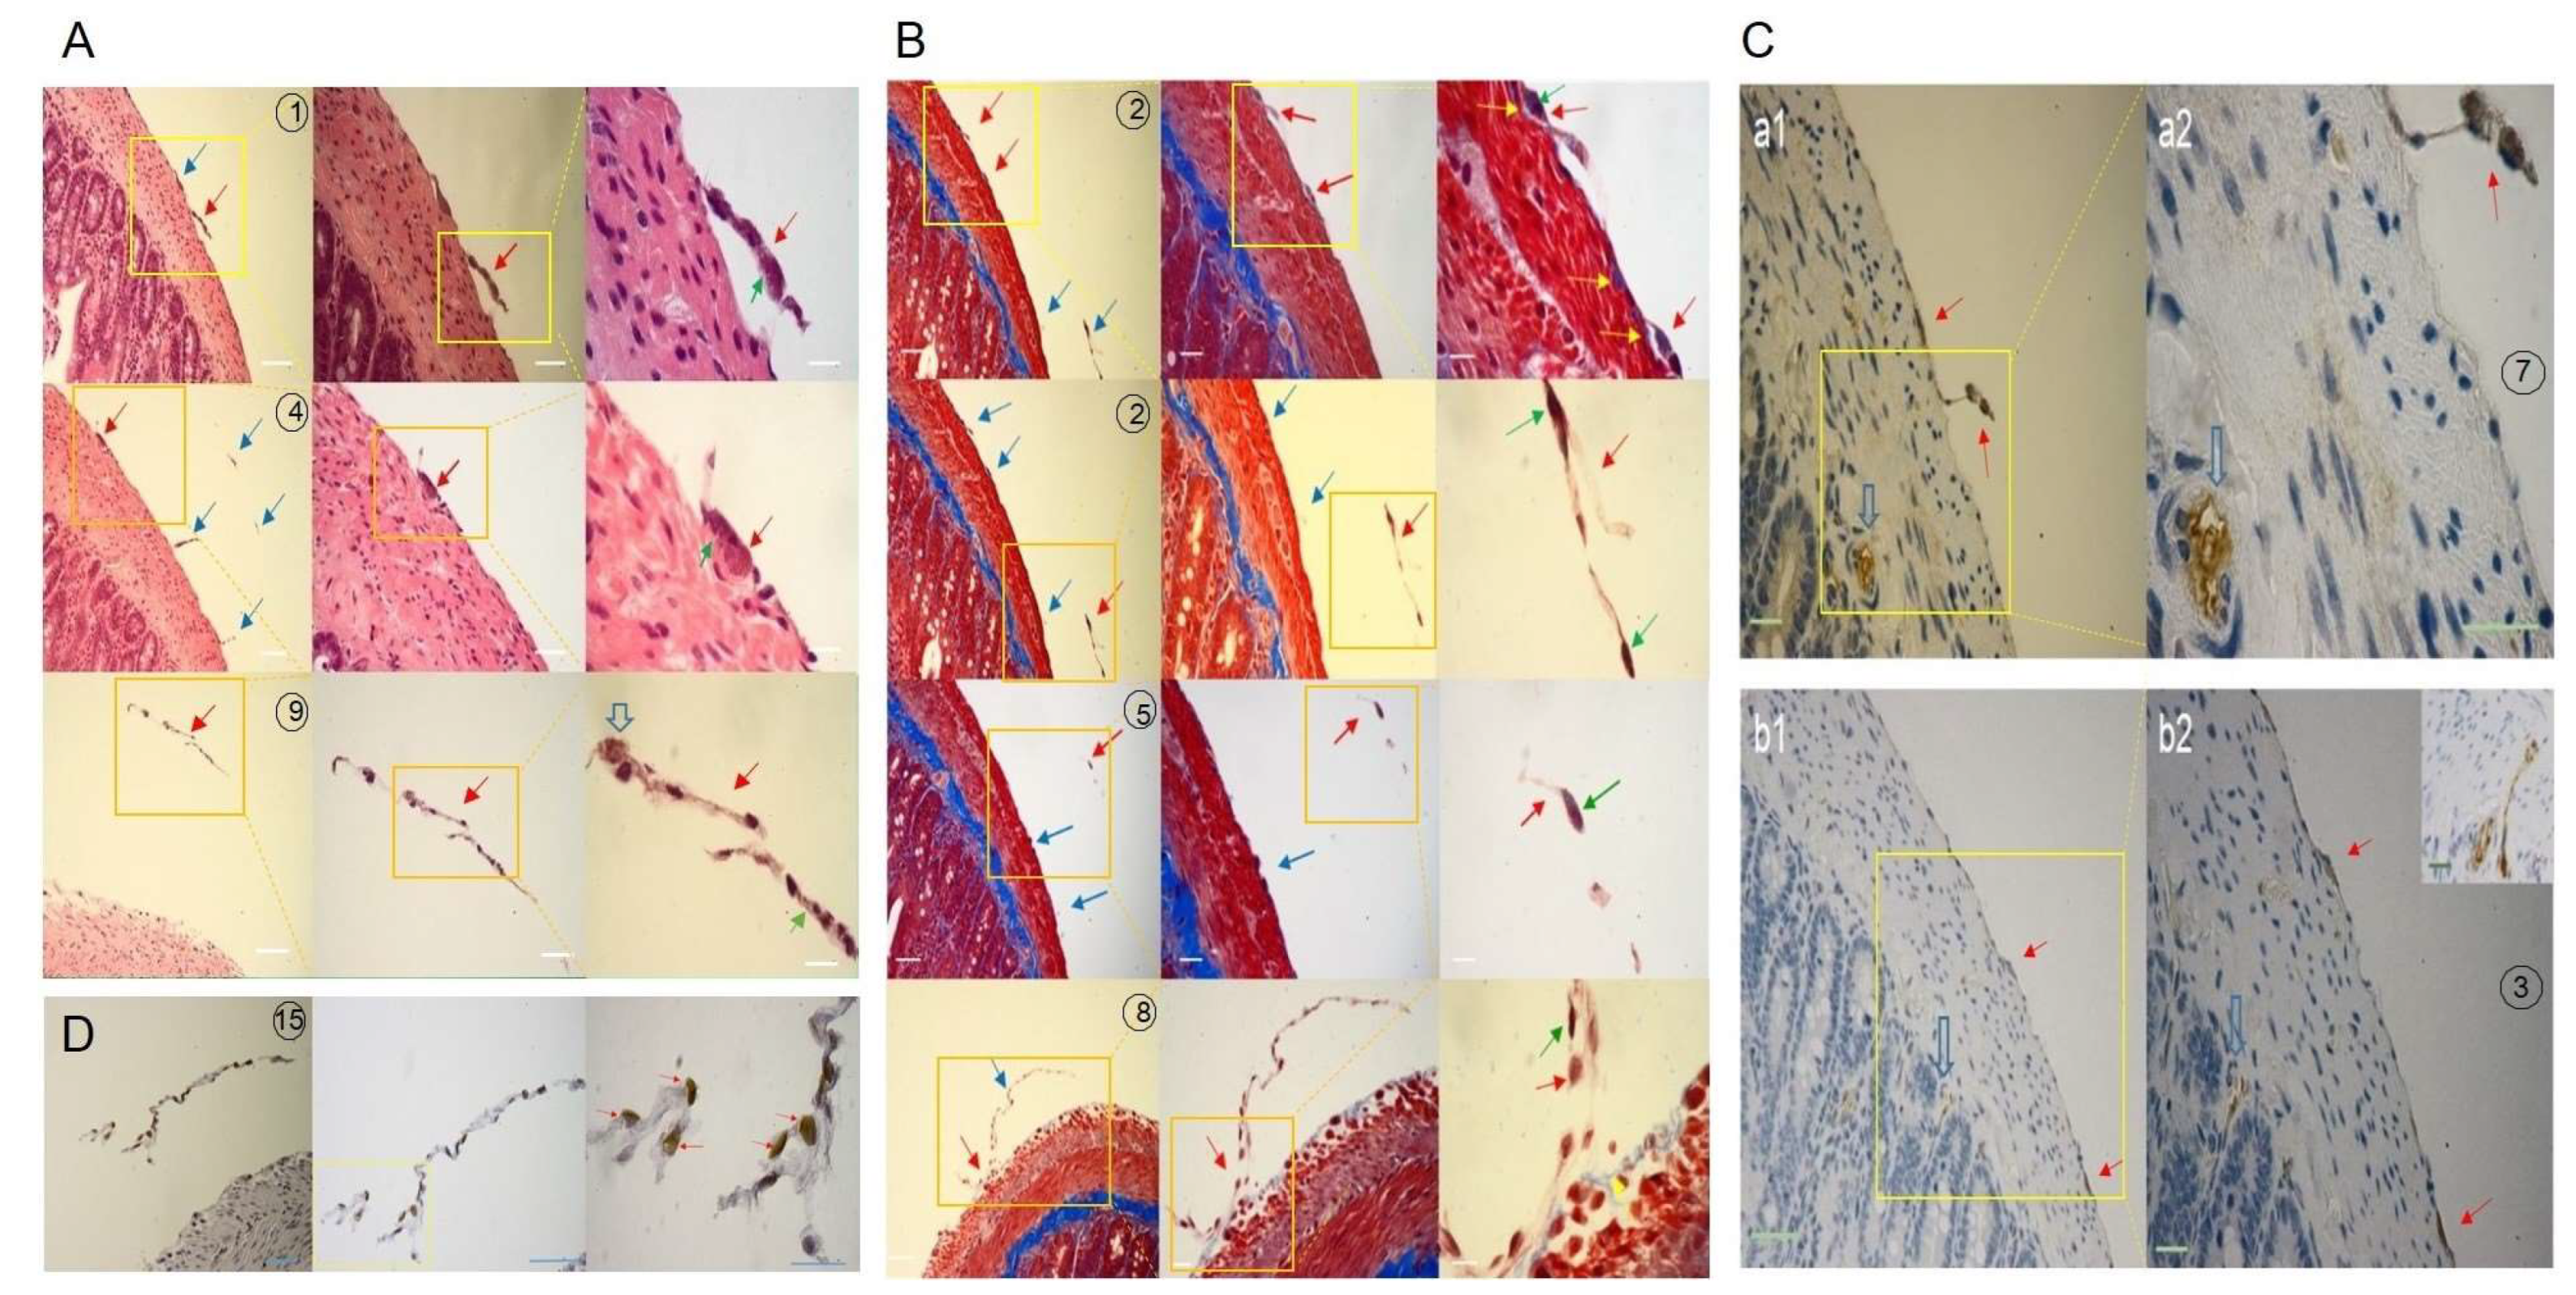
Figure 5.
Light and fluorescence microscope (LFM,
A) and confocal laser scanning microscopy (CLSM,
B) images of isolated corpuscle-connected filiform structures (CCFSs). (
A) For the visceral fascia (VF),
a1 is a light microscopy (LM) image of a CCFS in which clear corpuscles (blue arrows) with filiform structures (red arrows) are seen. The rectangle in
a1 is magnified into
a2 with F-actin (green colour). The rectangle in
a2 is magnified into
a3 with fragmented F-actins (red arrows). The DAPI image of
a4 corresponds to the LM image shown in
a1. The rectangle in
a4 is magnified into
a5, which shows a merged image between the DAPI and the bright-field images. In
a5, the yellow arrow indicates extracellular DNA (eDNA) on a JGB-stained corpuscle. The DAPI image in
a6 shows weakly dotted signals for DNA (original raw data:
Figure S6). In the parietal fascia (PF),
a1 is a merged image of the light and the DAPI images of a CCFS in which the four blue arrows indicate corpuscular structures. Between the corpuscles are FSs (red arrows).
a2 and
a3 present an image of the DAPI-stained CCFS and an image of the F-actin in the CCFS, respectively. Scale bars: in the VF,
a1: 100 μm,
a2: 50 μm,
a3: 25 μm,
a4: 100 μm,
a5: 25 μm, and
a6: 25 μm; in the PF,
a1,
a2 and
a3: 40 μm. (
B) CLSM images of the CCFS stained using DAPI optically sectioned by 2 μm and arranged from
b1 to
b4 in 12-μm intervals. Rod-shaped nuclei are arranged in the rectangular portion (corpuscle), which is magnified and optically sectioned (by 1 μm) into
b5 to
b8 (6-μm intervals). The yellow arrows in
b5 to
b8 show JGB-stained granules, not DAPI-stained granules. The images from
b9 to
b12 show fragmented F-actin molecules (red arrows) with DAPI-stained DNA molecules. These were also optically sectioned by 1 μm and arranged in 6-μm intervals. eDNA images (yellow arrows) are noticed. CLSM images for fragmented DNA and F-actin are uploaded as
Figures S3–S5. Scale bars:
b1 ~
b4: 50 μm,
b5 ~
b8: 20 μm, and
b9 ~
b12: 20 μm.
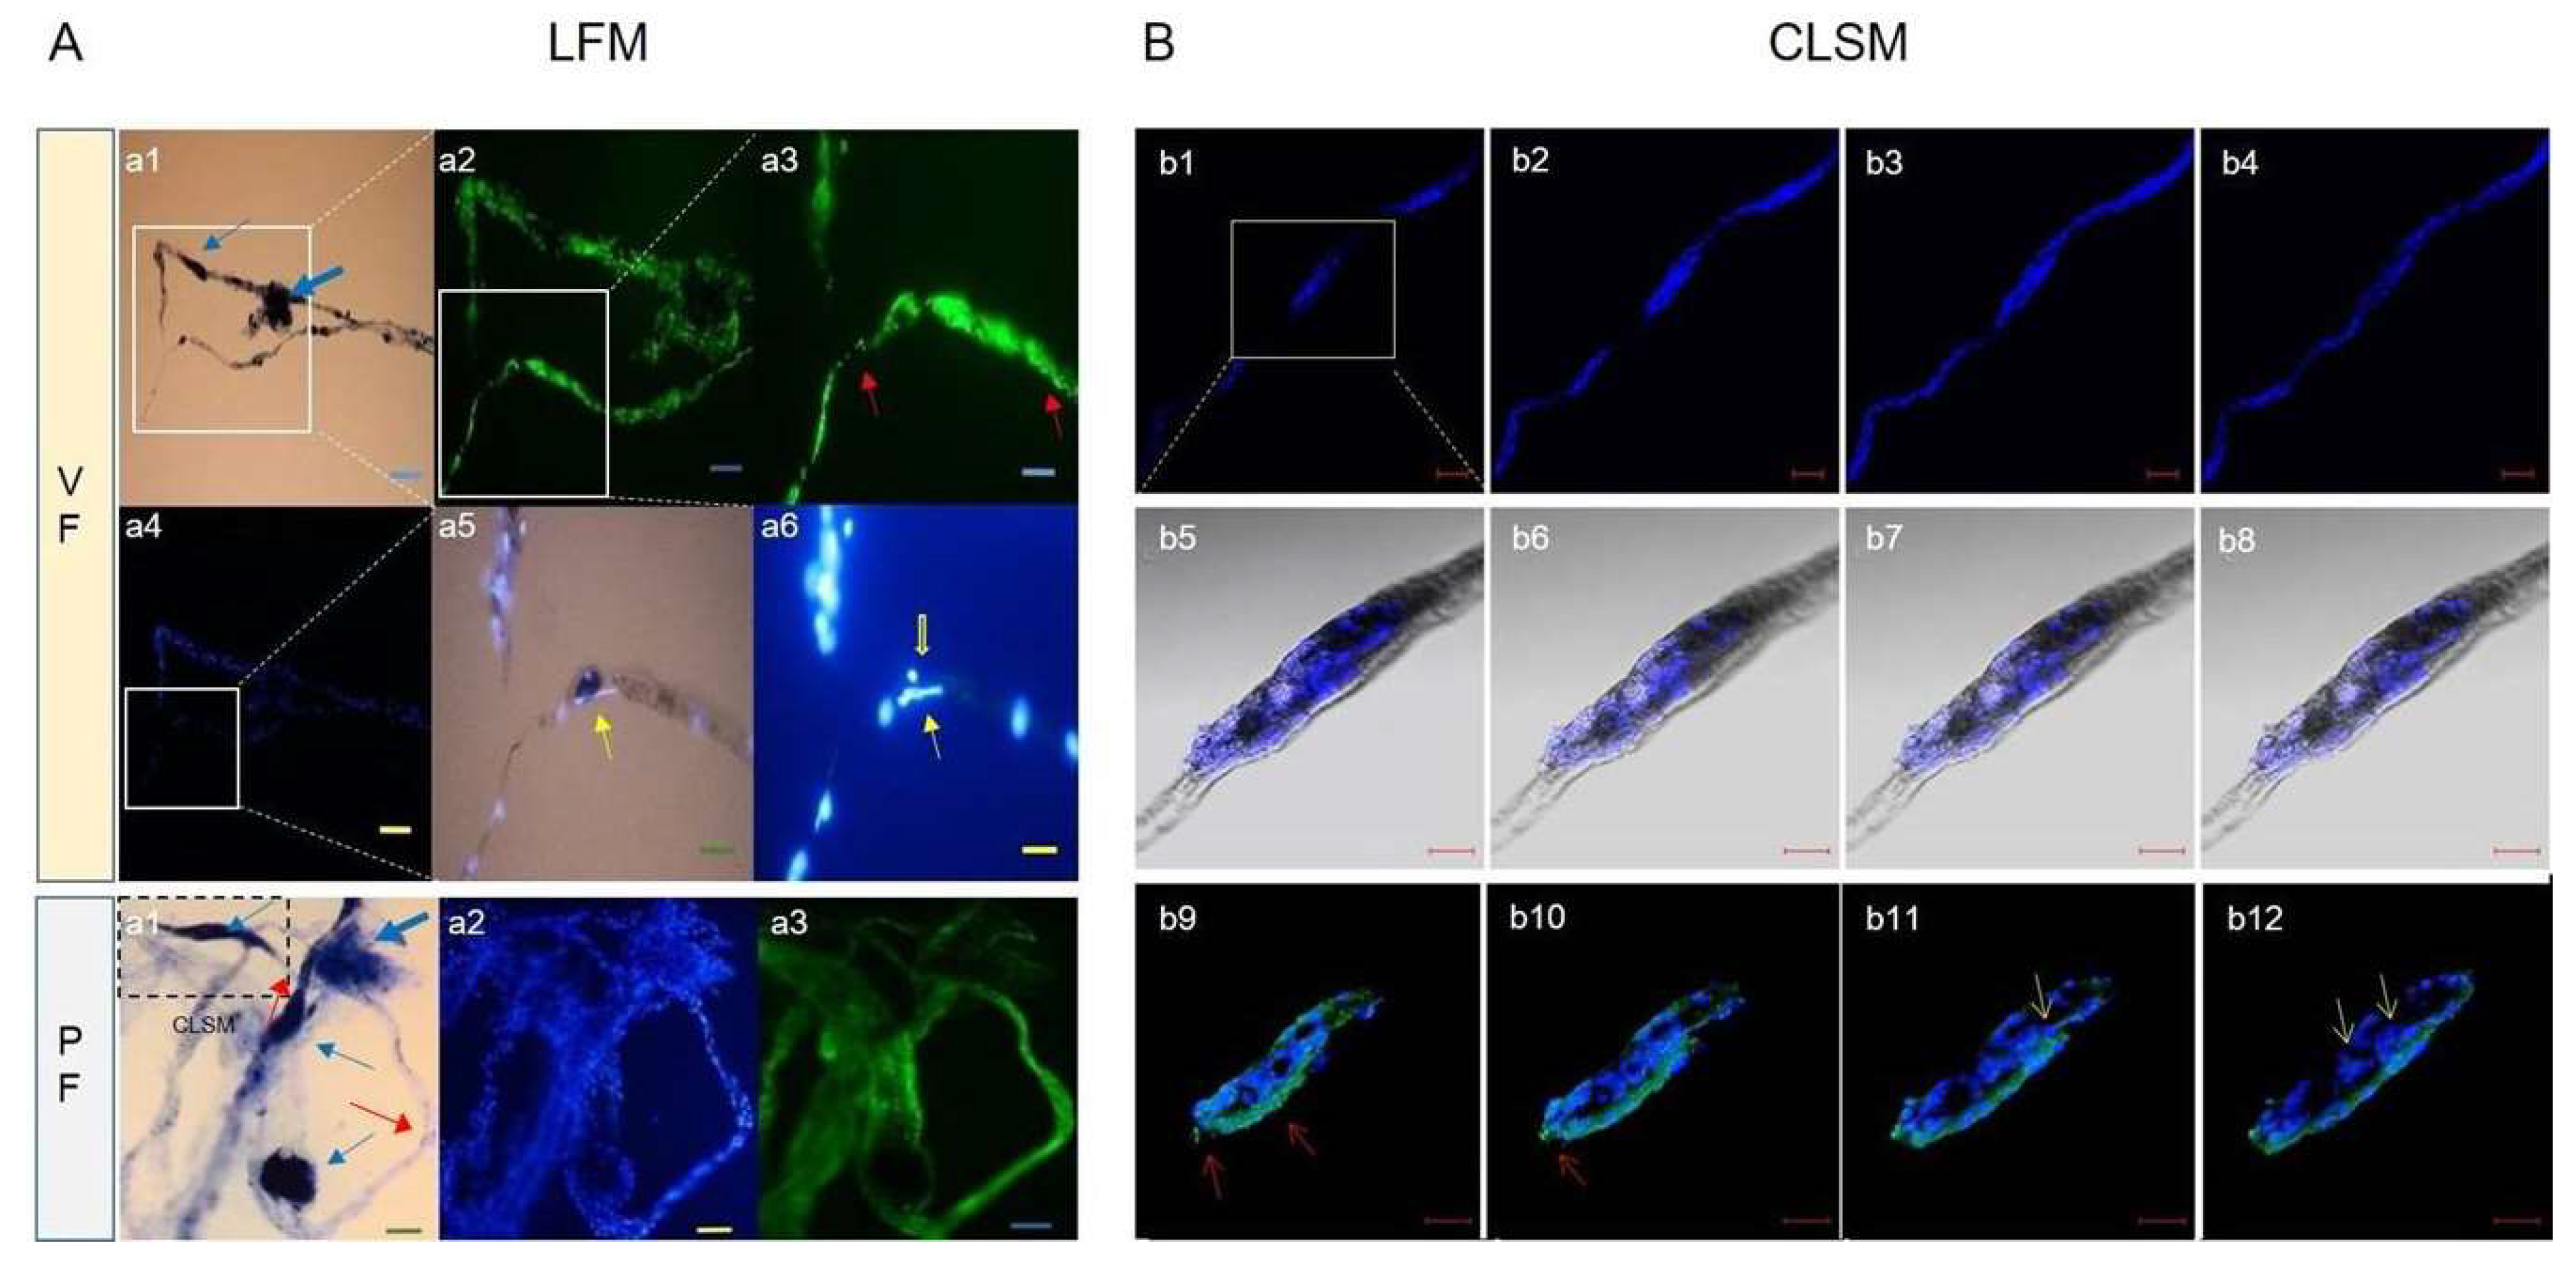
Figure 6.
The distribution of major elements in the corpuscle-connected filiform structure (CCFS) (2D) image2-dimensionally d by time-of-flight secondary ion mass spectrometry (TOF-SIMS). The x-axis and y-axis show a 300 μm ⅹ 300 μm area of the CCFS scanned by using TOF-SIMS, and each coloured bar indicates the relative concentration of the element. (
A) 2D images for the major cations (C, Na, and Ca) in the CCFS and the total image of the CCFS. (
B) 2D image for the major anions (O, CH, and NaH) in the CCFS and the total image of the CCFS. The most abundant elements in the cations and anions of CCFS are silicone and oxygen molecules, respectively. Additionally, a relatively high concentration of calcium ions is present in the cations of the CCFS. However, single carbon molecules are rarely seen. The raw data are uploaded in
Figure S7.
Figure 7.
Transmission electron microscopy (TEM) images of corpuscle-connected filiform structures (CCFSs). The ‘a’ picture is a stereoscopic image immediately after visualization of CCFSs on the abdominal wall of a rat. Among the CCFSs in ‘a’, we took the CCFS in the yellow rectangle for TEM examination. The filiform structures (red arrows) examined via TEM are presented as cross-sectioned images in b1, b2 and b3. In b1, a filiform structure with a roundish shape is seen. The yellow rectangles in b1 were magnified into b2 and b3, respectively. In b2, confluent vacuoles (blue arrows) were seen inside the outermost membrane, which is indicated by three dark brown arrows. In b3, a clear pore surrounded by fibrous structures (dark brown arrows) and confluent vacuoles (blue arrows) are seen. The images (c1 ~ c4) shown in the second panel were obtained from a TEM examination of the corpuscle (blue arrow) in the stereoscopic image in ‘a’. In c1, many granules (yellow arrows) from a completely disintegrated cell (open arrow) are seen. In c2, a disintegrated nucleolus (red arrow) and a disrupted cytoplasmic membrane (open arrow) are seen. The image in c3 shows translucent cytoplasm with pores (open arrow). The c4 image shows the moment of cell disintegration from the cytoplasmic membrane (red arrow). Among the TEM images of the corpuscle in c1, a polychromatic erythroblast-like cell (red arrow) with erythrocytes was detected. Scale bars: a: 500 μm; b1, b2, and b3: 5 μm; c1 and c2: 1 μm; c3: 2 μm; c4: 1 μm.
