
Submitted:
27 March 2023
Posted:
28 March 2023
You are already at the latest version
Abstract
Accurate measurement of low-level thoron gas and high-accuracy calibration of thoron measurement devices are essential for assessing and preventing thoron radiological risks. This study aimed to develop a thoron gas measurement technique using an airflow-through scintillation cell for both low-level measurement and high-accuracy calibration. To achieve this, a compartment model was developed to estimate the influence of progeny deposition and accumulation on the wall of the scintillation cell to prevent overestimation of thoron. A self-developed scintillation cell was utilized to implement and validate this technique. The lower detection limit and measurement uncertainty were then evaluated to assess the feasibility of the technique for low-level measurement and high-accuracy calibration. The results showed that the compartment model effectively addressed the influence of the progeny deposition. The measurement technique achieved a lower detection limit below 100 Bq m-3 even with the coexistence of 100 Bq m-3 of radon and attained a measurement uncertainty (k = 2) below 10% when the concentration of thoron exceeded 1,000 Bq m-3. In summary, this study developed a reliable and practical thoron gas measurement technique using an airflow-through scintillation cell with consideration for progeny deposition, and is expected to contribute to the assessment and prevention of thoron radiological risk.
Keywords:
thoron measurement
; airflow-through scintillation cell
; progeny accumulation effect
; compartment model
; low-level measurement
; calibration
1. Introduction
As reported by the United Nations Scientific Committee on the Effects of Atomic Radiation [1], radon (222Rn) and thoron (220Rn) contribute to more than half of the annual effective dose among all sources of natural radiation worldwide. While the World Health Organization has confirmed radon as the second leading cause of lung cancer after tobacco smoking [2], there is currently insufficient data on lung cancer risk caused by thoron due to a paucity of surveys [3]. This situation can be mainly attributed to two reasons: first, the extensive low-level of thoron due to its short half-life (55.6 s); and second, the difficulty in measurement of thoron and calibration of thoron measurement devices [1,3,4,5]. Nevertheless, exposure to even low-level of thoron can result in a considerable effective dose to the respiratory tract due to the high dose conversion factor of thoron progenies compared to that of radon progenies [1,6]. Additionally, numerous surveys have revealed that the indoor levels of thoron and its progenies are comparable to, or even higher than, those of radon and its progenies in many regions [7,8,9,10,11,12,13]. Therefore, the radiological risk associated with thoron warrants significant attention. Consequently, thoron measurement methods, particularly those applied to low-level measurement and high-accuracy calibration, play fundamental roles in the assessment and prevention of thoron radiological risk.
Thoron measurements can be performed using various types of detectors, such as scintillation cells, ionization chambers, semiconductor detectors, passivated implanted planar silicon (PIPS) detectors, and solid-state nuclear track detectors. Among these detectors, scintillation cells have gained widespread popularity owing to their high sensitivity and simplicity of use [14,15,16,17]. The thoron measurement methods employing scintillation cells can be classified into three types: (1) the grab-sample method initially developed by Hutter [15] and subsequently improved by others [16,17,18,19,20]; (2) the delayed coincidence method proposed by Giffin et al. [21] and further developed by others [22,23,24,25]; and (3) the airflow-through method, which is commonly used for radon measurement but less studied for thoron measurement [26,27,28]. Although the grab-sample method and the delayed coincidence method offer an advantage over the airflow-through method as they can distinguish between thoron and radon, this disadvantage of the airflow-through method could be overcome as further elaborated in the Discussion section. Moreover, the airflow-through method makes maximum use of the high sensitivity and simplicity of the scintillation cells, permitting it a potential promising option for low-level thoron measurements and high-accuracy calibrations.
During thoron measurements using scintillation cells, the progenies of thoron can accumulate on the walls of the scintillation cell due to deposition, resulting in additional alpha counts and overestimation of thoron [29]. This phenomenon was referred to as the "progeny accumulation effect" in this paper. While the progeny accumulation effect has been addressed in the grab-sample method [29,30], research to date has not yet addressed this effect in the airflow-through method. This knowledge gap might be one of the primary reasons why this method was not commonly used for thoron measurements. A potential tool to address this problem was the compartment model. In 1972, Jacobi developed a compartment model to estimate the activity balance between 222Rn/220Rn and their progenies in the atmospheres of uranium and fluorspar mines [31]. Later, similar models were adapted and enhanced for indoor atmospheres [32,33]. Sakoda et al. further developed a numerical model derived from a compartment model to predict the behaviour of radon and its progenies in the airflow-through cell [34]. These studies suggest that the progeny accumulation effect in the airflow-through method could potentially be estimated and corrected using a compartment model.
This study aimed to develop a thoron gas measurement method using an airflow-through scintillation cell that accounts for the progeny accumulation effect. To achieve this, a compartment model was established to estimate the progeny accumulation effect, and a correction algorithm was derived from the model. Subsequently, a self-developed scintillation cell was used to validate and test the feasibility and accuracy of the proposed measurement method. Additionally, the performance of the airflow-through scintillation cell was compared with a grab-sample scintillation cell and a PIPS detector-based device in terms of their lower detection limit and measurement uncertainty. This research will promote the field of thoron gas measurement and calibration, thereby contributing to the assessment and prevention of thoron radiological risk.
2. Materials and Methods
2.1. Compartment model
In this study, a compartment model was established to evaluate the progeny accumulation effect in an airflow-through cell (Figure 1). The model consists of the thoron at the inlet of the cell as the root compartment, followed by the thoron and individual progenies in two states as the subsequent compartments: suspended in the cell volume and deposited on the cell walls. Transfers between the compartments involve radioactive decay, wall deposition, and ventilation due to airflow. This model simplifies the radioactive decay of suspended 212Bi as it can be neglected in comparison to wall deposition and ventilation, given the extremely long half-life of 212Pb (10.6 h).
The activity of thoron and its progeny in different compartments can be described by Eq. (1) as a system of differential equations.
where Ax denotes the activity of thoron or its progenies (Bq), and the subscript x refers to the specific isotope and state (s for suspended in the cell volume, d for deposited on the cell walls); t denotes the measurement time (s); Cin denotes the activity concentration of thoron at the inlet of the cell (Bq m-3); V denotes the volume of the cell (m-3); rv denotes the ventilation rate (s-1); rd denotes the deposition rate (s-1); and λi denotes the decay constant of isotope i (s-1); fPo-212 is the branching ratio of 212Bi decay to 212Po (dimensionless).
Under the assumption that Cin is constant, and the activity of thoron and its progeny equal to 0 at time t = 0, Eq. (2) provides an approximate analytic solution to Eq. (1). In Eq. (2), the change of activity over time of 220Rn and 216Po, and suspended 212Pb were omitted, as they reach the equilibrium rapidly due to the speedy ventilation rate of the cell during thoron measurement. For instance, the equilibrium time will be less than 30 seconds, given a common ventilation rate of 0.17 s-1 (cell volume = 0.27 L, airflow rate = 2.7 L min-1).
where o(t) denotes a function as shown in Eq. (3), which was referred to as the "normalized accumulation function " in this paper. This function is a pivotal concept in understanding the progeny accumulation effect, since it characterizes the growth process of the effect over time during thoron measurement. Specifically, this function takes on a value of 0 at the start of the measurement and gradually approaches a value of 1 as time increases.
The alpha counting rate recorded by the scintillation cell n(t) consists of three components: 1) the counting rate contributed from 220Rn and 216Po (including suspended and deposited state) nt; 2) the counting rate contributed from deposited 212Bi and 212Po np, namely the counting rate resulting from the progeny accumulation effect; 3) intrinsic background of the measurement device nbg. Then,
where nt(t) and np(t) satisfy Eq. (5),
where εx represents the detection efficiency of the scintillation cell for thoron or its progenies (dimensionless), and the subscript x refers to the specific isotope and state.
Define,
where the parameter η0 represents the counting rate contributed by 220Rn and 216Po due to a continuous inflow of thoron at unit concentration; the parameter η1 represents the counting rate resulting from the progeny accumulation effect due to the same inflow at equilibrium (i.e., when o(t) = 1); the parameter K is the ratio of η1 and η0, which was referred to as the "accumulation effect coefficient" in this paper. This parameter is another pivotal concept in understanding the progeny accumulation effect, along with the normalized accumulation function, as it represents the relative intensity of the progeny accumulation effect at equilibrium.
Substituting Eq. (2) and Eq. (6) into Eq. (5),
Eq. (7) revealed a linear relationship between the alpha counting rate nt(t) and the concentration of thoron in the ambient atmosphere. As a result, it is possible to indirectly measure thoron gas by calculating nt(t) through subtracting np(t) and nbg from the measured counting rate n(t), with η0 serving as the response factor for this method.
2.2 Calibration procedure
A calibration procedure was designed to obtain the indispensable parameters of the airflow-through scintillation cell for thoron measurement, including the intrinsic background nbg, the response factor η0, and the accumulation effect coefficient K. Prior to the calibration experiments, the scintillation cell was left unoccupied for a minimum of three days to avoid any contamination from progenies of thoron or radon. Subsequently, the scintillation cell was purged and filled with nitrogen, following a calibration trial to determine the intrinsic background. Finally, the scintillation cell was connected to a homemade thoron chamber with fixed thoron concentration [35], following another calibration trial to determine the response factor for thoron gas η0 and the accumulation effect coefficient K.
The response factor η0 and the accumulation effect coefficient K can be solved from the measurement result based on Eq. (4) and Eq. (7). By substituting Eq. (7), Eq. (4) yields Eq. (8), which reveals a linear relationship between the net counting rate nnet(t) and the normalized accumulation function o(t):
By integrating for a measurement cycle i, Eq. (8) can be written as:
where nnet,i denotes the average net counting rate in the measurement cycle i; ti,s and ti,e denote the starting time and ending time of the measurement cycle i respectively; denotes the average value of o(t) during the measurement cycle i., which could be calculated by integrating Eq. (3):
A linear regression plot of the average net counting rate nnet,i versus average normalized accumulation function will determine the intercept as and the slope as . Therefore, the response factor could be estimated by dividing the intercept by the known thoron concentration Cin, as well as the accumulation effect coefficient K can be estimated by dividing the slope by the intercept.
A note of caution should be offered here: the data of the first several minutes should be discarded in the linear regression, since 220Rn and 216Po might not reach equilibrium at that time, and there is a discrepancy between the theoretical equations and the actual situation.
2.3 Algorithm for correcting progeny accumulation effect and estimating thoron concentration
To estimate the progeny accumulation effect during a measurement, the contribution of the inflow of thoron gas in each measurement cycle was separately considered. Specifically, the counting rate resulting from the progeny accumulation effect in the measurement cycle i due to the inflow of thoron gas in measurement cycle j, np,i,j, was estimated separately using Eq. (11).
where Cin,j denotes the average concentration of thoron at the inlet of the cell in the measurment cycle j.
Therefore, the counting rate resulting from the progeny accumulation effect in the measurement cycle i, np,i,was estimated using Eq. (12).
By combining Eq. (4), Eq. (7) and Eq. (12), Eq. (13) is obtained, which provides a correction algorithm for the progeny accumulation effect, as well as an estimation algorithm of thoron concentration in each measurement cycle.
2.4 Laboratory validation and test
To verify the feasibility and accuracy of the measurement method proposed in this study, laboratory experiments were conducted in the thoron chamber at the Shanghai Institute of Measurement and Testing Technology (SIMT) [35]. The proposed method was applied using a self-developed scintillation cell [36], and the thoron concentration was simultaneously measured using a PIPS detector-based device (referred to as "PIPS device" throughout the latter part of this article) for comparison purposes.
The thoron chamber used in the study has an inner size of 60×90×55 cm3 and a total volume of about 300 L [35]. It contains four sets of replaceable ion-exchanged solid thoron sources [37], allowing for rapid switching of the activity concentration of thoron gas in the range of 1,000 Bq m-3 to 50,000 Bq m-3 by changing thoron sources. Since the thoron sources contain almost no 226Ra, the radon concentration in the chamber is negligible (<1%) [36]. The thoron gas has satisfactory stability (<3%) and uniformity (<8%) within the chamber according to our previous study [36].
The scintillation cell used in this study is a cylindrical vessel (Figure 2), 53.0 mm in diameter and 122.4 mm in height (V = 270 L), which is very similar to the scintillation cell used in several previous studies [16,18,20]. Its inner lateral wall is coated with ZnS(Ag) scintillator to detect alpha particles. To reduce the influence of thoron decay during measurement, which has been systematically discussed in our previous study [27], a relatively higher airflow rate of 2.7 L min-1 was used for this scintillation cell.
The detection chamber of the PIPS device is a cylindrical volume with a diameter of 50.0 mm and a height of 11.3 mm (V = 22.2 mL). The airflow rate of this device is 2 L min-1. Since this device also works in airflow-through mode, the behaviour of thoron progeny in the detection chamber can be described by the proposed compartmental model. Additionally, this device can distinguish thoron and its progeny from the measured energy spectrum, allowing it to directly measure the thoron progeny. Therefore, the compartmental model could be rigorously validated by comparing the theoretical predictions with experimental results of the counting rate contributed by thoron progeny using this device.
2.5 Evaluation of lower detection limit and measurement uncertainty
To illustrate the comparative advantages of the airflow-through scintillation cell method in terms of its lower detection limit and measurement uncertainty, the scintillation cell and the PIPS device used in this study were selected as representative measurement devices to assess these characteristics. For the scintillation cell, both the airflow-through method and the grab-sample method were evaluated.
The lower detection limit (LD) of a given thoron measurement device can be calculated using Eq. (14) with the assumption that the risk of type I and type II errors are both 0.05 [38,39].
where STn denotes the sensitivity coefficient which converts the activity concentration of thoron into counting rate for the given device, M denotes the background counts, and T denotes the sample measurement time. In case radon co-exists with thoron in general, alpha count contributed by radon should be deducted from the total counts (as further detailed in the Discussion section) and taken into account as a component of background counts M:
where nbg denotes the intrinsic background counting rate of the given device, CRn denotes the activity concentration of radon which interferes with thoron measurement, and SRn denotes the sensitivity coefficient which converts interfering radon activity concentration into counting rate of for the given device.
In the case of the airflow-through scintillation cell, the sensitivity coefficient STn is simply the response factor :
In the case of the grab-sample scintillation cell, the decay of thoron during measurement should be considered, therefore:
In the case of the PIPS device, the value of the sensitivity coefficient STn and the background counting rate nbg were experimentally determined to be 1.07×10⁻³ min-1 (Bq m-3)-1 and 0.1 h-1, respectively.
As regards the evaluation of measurement uncertainty, the uncertainty components contributed by the calibrated parameters (e.g. the intrinsic background nbg, the sensitivity coefficient STn, and the accumulation effect coefficient K) were disregarded, since these uncertainty components can vary in practice and independent of the measurement method. Therefore, only the statistical fluctuations of the total counts, which conform to the Poisson distribution, were considered in the uncertainty evaluation.
In the case of the airflow-through scintillation cell, the deposited progeny also contributes to the total counting. However, it is impossible to determine the contribution of the deposited progeny as it is not determined by the current thoron concentration, but by the unknown historical thoron concentration and the measurement time. To overcome this difficulty, we simply assumed that the thoron concentration is constant, and the progeny accumulation effect has reached equilibrium. With this assumption, the expanded relative uncertainty of measurement value (Urel) was estimated according to Eq. (18).
where k is the coverage factor.
In the case of the grab-sample scintillation cell, the expanded relative uncertainty of measurement value (Urel) was estimated according to Eq. (19) considering the decay of thoron during measurement.
In the case of the PIPS detector, the expanded relative uncertainty of measurement value (Urel) of the PIPS detector method was estimated according to Eq. (20).
3. Results
3.1 Calibration results of the scintillation cell
The intrinsic background of the scintillation cell was determined to be 1.02 min-1 in a background calibration trial with the scintillation cell purged and filled with nitrogen. Following the background calibration trial, a calibration trial with a fixed thoron concentration of 5480 Bq was conducted. The direct measurement results (Figure 3 (a)) depicted a growth in the net counting rate with measurement time, despite the constant thoron concentration, thereby indicating the progeny accumulation effect. This result highlighted that the measurement results would need to be corrected for the progeny accumulation effect to ensure accuracy.
The linear regression plot of the net counting rate nnet,i versus average normalized accumulation function (Figure 3 (b)) presented satisfactory linear relation between them. According to the linear regression, the response factor for thoron gas of the scintillation cell was determined to be 0.0236 min-1 (Bq m-3)-1, and the accumulation effect coefficient K of the scintillation cell was determined to be 0.314.
3.2 Validation of the compartment model using PIPS detector
A comparison of the counting rates of the 212Bi deposited in the PIPS device was performed between the theoretical prediction calculated by the compartment model and experimental results obtained from the measured spectrum (Figure 4). As shown in Figure 4, the increasing trend of the theoretical prediction was consistent with the experimental results. This result presented compelling and comprehensive evidence supporting the accuracy of the compartment model in predicting the behavior of thoron progeny within an airflow-through cell.
3.3 Laboratory test results
A laboratory test lasting for 160 hours was conducted in the thoron chamber at SIMT, which consisted of five stages. The thoron concentration in the chamber was switched by changing the ion-exchanged solid thoron sources between the different stages of the test, and remained constant within each individual stage. Both the scintillation cell and the PIPS device were used to measure the thoron concentration, and the measurement results are shown in Figure 5.
As shown in Figure 5, the measurement results of the scintillation cell that implemented the progeny accumulation correction, exhibited consistency with those obtained from the PIPS device, despite the reciprocating changes in thoron concentration. This finding provides convincing evidence that the correction method effectively addressed the progeny accumulation effect. Conversely, Figure 5 also presented the measurement results of the scintillation cell without the progeny accumulation correction, which exhibited an obvious change during each stage with constant thoron concentration (e.g.: 0 h to 60 h), and were notably greater than the results of the PIPS device. This emphasized the significance of the progeny accumulation correction once again.
Additionally, Figure 5 demonstrated that the measurement results of the scintillation cell exhibited significantly less fluctuation than those of the PIPS device, indicating that the measurement results of the scintillation cell were more precise. This observation will be further discussed in the subsequent section.
3.4 Comparison on lower detection limit and measurement uncertainty
Table 1 provided the essential parameters of the airflow-through scintillation cell, the grab-sample scintillation cell and the PIPS device, which were utilized to evaluate their respective lower detection limit and measurement uncertainty. The parameters of the airflow-through scintillation cell and the PIPS device were determined experimentally, while the STn and SRn of the grab-sample scintillation cell were calculated based on the detection efficiency of the scintillation cell and the law of radioactive decay [18]. For the grab-sample scintillation cell, thoron measurement times of 1 min and 10 min were chosen as representatives for evaluation purposes. The former was selected since a short thoron measurement time was commonly used in the grab-sample method limited by the short half-life of thoron, and 1 min is a typical value of it [15,18]. Meanwhile, the latter was selected to demonstrate the inconsistency of a relatively long thoron measurement time in the grab-sample method and to allow for comparison with other techniques using the same measurement time. It can be seen from Table 1 that the sensitivity coefficient of thoron decreased by one order of magnitude with a thoron measurement time of 10 min for the grab-sample scintillation cell, highlighting the unsuitability of a long thoron measurement time. It should be noted that, the airflow-through scintillation cell was assumed to be capable of measuring thoron with the coexistence of radon, which was supported by the use of an ancillary measurement device that is sensitive only to radon, as further elaborated in the Discussion section.
Table 2 presented the lower detection limit of the airflow-through scintillation cell, the grab-sample scintillation cell, and the PIPS device, respectively. As shown in Table 2, the lower detection limits of all devices grew with the increasing concentration of coexisting radon. Moreover, the lower detection limits of the grab-sample scintillation cell degraded as the thoron measurement time increased, which is in contrast to the behaviour of the other devices. This further emphasized the unsuitability of long thoron measurement time for the grab-sample scintillation cell. Notably, Table 2 highlighted that the airflow-through scintillation cell exhibited the most outstanding lower detection limits regardless of the concentration of coexisting radon, and could attain a lower detection limit below 100 Bq m-3 even with the presence of 100 Bq m-3 of radon, which is an essential prerequisite for conducting low-level thoron surveys.
Table 3 presented the expanded relative measurement uncertainty (k=2) of the thoron measurement devices evaluated in this study. As displayed in Table 3, the measurement uncertainty of all devices decreased with the concentration of thoron increased, and increased with the concentration of coexisting radon increased. Similar to Table 2, Table 3 stressed that the airflow-through scintillation cell exhibited the most favourable measurement uncertainties regardless of the concentration of thoron and coexisting radon, and could achieve a measurement uncertainty below 10% when the concentration of thoron was higher than 1,000 Bq m-3, which is foundational in ensuring an acceptable level of uncertainty in calibration as a measurement standard device.
4. Discussion
An important contribution of this study is the use of a compartment model to address the progeny accumulation effect. Numerous studies have taken advantage of the compartment model to calculate the behaviour of radon/thoron and their progenies in various scenarios. Sakoda et al. developed a numerical model to predict the behaviour of radon and its progenies in the airflow-through cell and suggested implementing a similar study on thoron in the future research [34]. This study further developed this methodology and provided the complete derivation procedure from the conception of the compartment model to the final algorithm for correcting the progeny accumulation effect and estimating thoron concentration. The normalized accumulation function and accumulation effect coefficient was raised and found as the pivotal concepts for understanding and estimating the progeny accumulation effect. All the formulas were derived analytically, making them broadly applicable to all kinds of the airflow-through cell for thoron measurement, as demonstrated on a PIPS device in this study. This methodology would also be helpful for spectrum-type devices as the energy peak of 220Rn and 212Bi commonly overlaps due to their adjacent energy (6.29 MeV and 6.05 MeV), and the effect of overlaps could be estimated using the proposed theoretical approach. Furthermore, in the radon measurement, there is generally an equilibrium process of three hours, which is led by the change of radon progeny. This study has demonstrated estimating the change of thoron progeny using a compartment model. Therefore, it is possible to correct the non-equilibrium state and improve the response speed of radon measurement devices using the same methodology. Further research is recommended to explore the feasibility and potential benefits of using compartment models in radon measurements.
As noted in the Introduction section, the airflow-through scintillation cell is incapable of distinguishing between thoron and radon, which is a significant limitation in practical applications, as radon coexists with thoron in most cases. However, this limitation can be overcome by simultaneously measuring radon in the environment using an ancillary measurement device and deducting the radon signal from the measurement result of the scintillation cell as background. Numerous commercial and research-oriented devices meet this requirement. Here, we proposed a specific ancillary measurement device that uses a similar scintillation cell, as shown in Figure 6. This ancillary measurement device contained an additional gas storage chamber of 2.0 L between the inlet and the scintillation cell and appiled a low flow rate of 0.2 L min-1. As a result, the thoron would almost completely decay in the storage chamber due to its short half-life (55.6 s). Additionally, the decay products would be prevented from entering the scintillation cell by a filter. Therefore, this ancillary measurement device would only be sensitive to radon, and it would be easy to estimate the radon signal of the scintillation cell from the measurement result of the ancillary measurement device and the sensitivity coefficient of the two devices obtained from the calibration. In conclusion, both the thoron and radon concentration in the environment could be determined using an airflow-through scintillation cell and an ancillary measurement device (a similar airflow-through scintillation cell with a large gas storage chamber which operates at a low flow rate).
This study compared the performance of the airflow-through scintillation cell, grab-sample scintillation cell, and PIPS device in terms of their lower detection limit and measurement uncertainty, which offered valuable insights into the comparative advantages of the airflow-through scintillation cell method. Previous studies have estimated the lower detection limit and measurement uncertainty of the grab-sample scintillation cell using similar devices [18,20]. Zhang et al. reported a lower detection limit (at the 95% confidence interval) of 303 Bq m-3, 404 Bq m-3, 584 Bq m-3 and 1074 Bq m-3 for the grab-sample scintillation cell when the interfering radon concentration was 0 Bq m-3, 50 Bq m-3, 200 Bq m-3, 1,000 Bq m-3 respectively [18]. Our results presented in Table 2 indicated a very similar performance of the scintillation cell used in our study due to the similarity between the devices. Our previous study estimated the relative standard uncertainty of the grab-sample scintillation cell to be around 24% when the concentration of 220Rn was 1,000 Bq m-3 and the concentration of 222Rn was 50 Bq m-3 [20], which was in accordance with the findings presented in Table 3. Those consistent findings suggested the reliability of the result presented in Table 2 and Table 3. These results presented in Table 2 and Table 3 suggested that the airflow-through scintillation cell technique realized in this study had the most prominent lower detection limit and measurement uncertainty over other techniques evaluated, and was competent in low-level thoron survey and used as a standard device for calibration. The outstanding performance of the airflow-through scintillation cell can be mainly attributed to its high sensitivity and disengaged measurement time. However, the intrinsic background also influences its performance, especially in terms of lower detection limit. Although the grab-sample scintillation cell had similar sensitivity and intrinsic background, its lower detection limit and measurement uncertainty were limited by its short measurement times, which was dictated by its principle. On the other hand, although the PIPS device had a much lower intrinsic background, it had a considerable distance to cover compared to the airflow-through scintillation cell, since its sensitivity is one order of magnitude lower. Moreover, as the level of coexisting radon increased, the background due to radon negated this advantage, thus its detection limit degraded faster than the scintillation cell. It is important to note that the devices tested in this study are not exhaustive and do not be representative of all available devices. Therefore, the results should not be used to make broad conclusions about all thoron measurement devices. However, based on the above analysis, we believed that the prominent lower detection limit and measurement uncertainty of the airflow-through scintillation cell are universally valid due to its generally high sensitivity.
5. Conclusions
The present study established a reliable and practice method for thoron gas measurement using an airflow-through scintillation cell, with a correction for the progeny accumulation effect. The normalized accumulation function and accumulation effect coefficient was raised in this study, and was found as the pivotal concepts for understanding and estimating the progeny accumulation effect. The results indicated that this measurement technique achieved a lower detection limit below 100 Bq m-3 even with the presence of 100 Bq m-3 of radon, and attained a measurement uncertainty (k = 2) below 10% when the concentration of thoron exceeded 1,000 Bq m-3. These results demonstrate the exceptional performance of the airflow-through scintillation cell technique for thoron gas measurement, making it a suitable method for low-level thoron surveys and as a standard device for calibration. The technique described in this study has been applied in the measurement standard device at SIMT for nearly 10 years, and an international comparison has shown its favourable precision among the measurement standard devices of four institutes [40].
A significant strength of the present study is that a systemic theoretical approach was proposed to estimate and correct the progeny accumulation effect in an airflow-through scintillation cell based on a compartment model. This methodology might also be helpful for spectrum-type devices to deal with the overlaps of the energy peak of 220Rn and 212Bi. Moreover, It is expected to improve the response speed of radon measurement devices. Consequently, further research is recommended to explore the feasibility and potential benefits of using compartment models in thoron and radon measurements.
Overall, this research will promote the field of thoron gas measurement and calibration, and is expected to facilitate the assessment and prevention of thoron radiological risks, helping to ensure the safety of the public who may be exposed to thoron.
6. Patents
The technique of correcting the progeny accumulation effect described in this paper is the subject of a patent application (Patent No. 201911163161.1) in China filed by the authors. The patent application has not yet been granted, but if it is approved, the authors could potentially benefit financially from its commercialization.
Supplementary Materials
The following supporting information can be downloaded at the website of this paper posted on Preprints.org.
Author Contributions
Conceptualization, C.Z., D.T. and W.Z.; methodology, C.Z. and W.Z.; software, C.Z.; formal analysis, J.L.; investigation, C.Z., J.L., Y.C. and L.H.; data curation, C.Z.; writing—original draft preparation, C.Z.; writing—review and editing, W.Z.; supervision, F.T.; funding acquisition, C.Z. All authors have read and agreed to the published version of the manuscript.
Funding
This research was funded by the National Natural Science Foundation of China, grant number 12175146, Science and Technology Program of the Shanghai Municipal Administration for Market Regulation, grant number 2021-06, and the Science and Technology Plan Project of the State General Administration of Quality Supervision, Inspection and Quarantine, P. R. China, grant number 2009QK099. This work was partially carried out at the Shanghai Key Laboratory of Online Test and Control Technology, Shanghai Institute of Measurement and Testing Technology.
Institutional Review Board Statement
Not applicable.
Informed Consent Statement
Not applicable.
Data Availability Statement
The data that support the findings of this study are available from the corresponding author upon reasonable request.
Acknowledgments
All the authors would like to express their gratitude to Dr. He Chunyu from Peking University and Dr. Zhang Lei from the State Key Laboratory of NBC Protection for Civilian for providing the PIPS device [2].
Conflicts of Interest
The authors declare no conflict of interest.
References
- United Nations Scientific Committee on the Effects of Atomic Radiation. Report of the United Nations Scientific Committee on the Effects of Atomic Radiation to the General Assembly: ANNEX B Exposures from Natural Radiation Sources; New York, USA, 2000; pp. 107-108 & 112.
- Zeeb, H.; Shannoun, F. WHO Handbook on Indoor Radon: A Public Health Perspective; WHO Press: Geneva, Switzerland, 2009; p. 3. ISBN 978-92-4-154767-3. [Google Scholar]
- Tokonami, S. Characteristics of Thoron (220Rn) and Its Progeny in the Indoor Environment. Int. J. Environ. Res. Public. Health 2020, 17, 8769. [Google Scholar] [CrossRef] [PubMed]
- Tokonami, S. Why Is 220Rn (Thoron) Measurement Important? Radiat. Prot. Dosimetry 2010, 141, 335–339. [Google Scholar] [CrossRef] [PubMed]
- Janik, M. Environmental Radioactivity Monitoring and Measurements: Radon and Thoron. Int. J. Environ. Res. Public. Health 2022, 19, 9276. [Google Scholar] [CrossRef] [PubMed]
- International Commission on Radiological Protection. Occupational Intakes of Radionuclides: Part 3. ICRP Publication 137; Ann. ICRP 46(3/4); 2017; ISBN 978-1-5264-4016-7. pp. 315.
- Steinhäusler, F. Environmental 220Rn: A Review. Environ. Int. 1996, 22, 1111–1123. [Google Scholar] [CrossRef]
- Nuccetelli, C.; Bochicchio, F. The Thoron Issue: Monitoring Activities, Measuring Techniques and Dose Conversion Factors. Radiat. Prot. Dosimetry 1998, 78, 59–64. [Google Scholar] [CrossRef]
- Shang, B.; Chen, B.; Gao, Y.; Wang, Y.; Cui, H.; Li, Z. Thoron Levels in Traditional Chinese Residential Dwellings. Radiat. Environ. Biophys. 2005, 44, 193–199. [Google Scholar] [CrossRef]
- Zunic, Z.S.; Stojanovska, Z.; Veselinovic, N.; Mishra, R.; Yarmoshenko, I.V.; Sapra, B.K.; Ishikawa, T.; Omori, Y.; Curguz, Z.; Bossew, P.; et al. Indoor Radon, Thoron and Their Progeny Concentrations in High Thoron Rural Serbia Environments. Radiat. Prot. Dosimetry 2017, 177, 36–39. [Google Scholar] [CrossRef]
- Nyambura, C.; Tokonami, S.; Hashim, N.O.; Chege, M.W.; Suzuki, T.; Kudo, H.; Hosoda, M. Annual Effective Dose Assessment Due to Radon and Thoron Progenies in Dwellings of Kilimambogo, Kenya. Radiat. Prot. Dosimetry 2019, 184, 430–434. [Google Scholar] [CrossRef]
- Sanada, T. Measurement of Indoor Thoron Gas Concentrations Using a Radon-Thoron Discriminative Passive Type Monitor: Nationwide Survey in Japan. Int. J. Environ. Res. Public. Health 2021, 18, 1299. [Google Scholar] [CrossRef]
- Chen, J. Assessment of Thoron Contribution to Indoor Radon Exposure in Canada. Radiat. Environ. Biophys. 2022, 61, 161–167. [Google Scholar] [CrossRef]
- Lucas, H.F. Improved Low-Level Alpha-Scintillation Counter for Radon. Rev. Sci. Instrum. 1957, 28, 680–683. [Google Scholar] [CrossRef]
- Hutter, A.R. A Method for Determining Soil Gas 220Rn (Thoron) Concentrations. Health Phys. 1995, 68, 835–839. [Google Scholar] [CrossRef] [PubMed]
- Tokonami, S.; Yang, M.; Yonehara, H.; Yamada, Y. Simple, Discriminative Measurement Technique for Radon and Thoron Concentrations with a Single Scintillation Cell. Rev. Sci. Instrum. 2002, 73, 69–72. [Google Scholar] [CrossRef]
- Eappen, K.P.; Nair, R.N.; Mayya, Y.S. Simultaneous Measurement of Radon and Thoron Using Lucas Scintillation Cell. Radiat. Meas. 2008, 43, 91–97. [Google Scholar] [CrossRef]
- Zhang, L.; Wu, J.; Guo, Q.; Zhuo, W. Measurement of Thoron Gas in the Environment Using a Lucas Scintillation Cell. J. Radiol. Prot. 2010, 30, 597–605. [Google Scholar] [CrossRef] [PubMed]
- Sumesh, C.G.; Kumar, A.V.; Nair, R.N.; Tripathi, R.M.; Puranik, V.D. Estimation of Thoron Concentration Using Scintillation Cell. Radiat. Prot. Dosimetry 2012, 150, 536–540. [Google Scholar] [CrossRef]
- Zhao, C.; Zhuo, W.; Chen, B. An Optimal Measuring Timetable for Thoron Measurements by Using Lucas Scintillation Cell. Radiat. Prot. Dosimetry 2012, 152, 125–129. [Google Scholar] [CrossRef] [PubMed]
- Giffin, C.; Kaufman, A.; Broecker, W. Delayed Coincidence Counter for the Assay of Actinon and Thoron. J. Geophys. Res. 1963, 68, 1749–1757. [Google Scholar] [CrossRef]
- Hashimoto, T.; Sakai, Y. Selective Determination of Extremely Low-Levels of the Thorium Series in Environmental Samples by a New Delayed Coincidence Method. J. Radioanal. Nucl. Chem. Artic. 1990, 138, 195–206. [Google Scholar] [CrossRef]
- Falk, R.; Moere, H.; Nyblom, L. Measuring Techniques for Environmental Levels of Radon-220 in Air Using Flow-through Lucas Cell and Multiple Time Analysis of Recorded Pulse Events. Appl. Radiat. Isot. 1992, 43, 111–118. [Google Scholar] [CrossRef]
- Iimoto, T.; Kurosawa, R. A Pulse-Coincidence 220Rn Monitor with Three Time-Gates. Environ. Int. 1996, 22, 1139–1145. [Google Scholar] [CrossRef]
- Irlinger, J.; Wielunski, M.; Rühm, W. Thoron Detection with an Active Radon Exposure Meter—First Results. Rev. Sci. Instrum. 2014, 85, 022106. [Google Scholar] [CrossRef]
- Qiu, S. Calibration of Thoron Monitors. Chin. J. Nucl. Tech. 2003, 26, 561–563. [Google Scholar]
- Tang, F.; Zhuo, W.; Zhao, C.; Chen, B.; Xu, Y.; He, L. A Theoretical Study on Accurate Measurements of Thoron with Airflow-through Scintillation Cell Method. Radiat. Prot. Dosimetry 2010, 141, 448–451. [Google Scholar] [CrossRef] [PubMed]
- Sathyabama, N.; Datta, D.; Gaware, J.J.; Mayya, Y.S.; Tripathi, R.M. A Study of Disequilibrium between 220Rn and 216Po for 220Rn Measurements Using a Flow-through Lucas Scintillation Cell. Radiat. Prot. Dosimetry 2014, 158, 187–194. [Google Scholar] [CrossRef] [PubMed]
- Eappen, K.P.; Sapra, B.K.; Mayya, Y.S. A Novel Methodology for Online Measurement of Thoron Using Lucas Scintillation Cell. Nucl. Instrum. Methods Phys. Res. Sect. Accel. Spectrometers Detect. Assoc. Equip. 2007, 572, 922–925. [Google Scholar] [CrossRef]
- Sumesh, C.G.; Ashokkumar, P.; Vinod Kumar, A.; Ratheesh, M.P.; Ravi, P.M.; Tripathi, R.M.; Mitra, A.K. Continuous Thoron Gas Measurement Using Single Scintillation Cell – Correction for 212Pb Deposition. Radiat. Meas. 2014, 67, 1–4. [Google Scholar] [CrossRef]
- Jacobi, W. Activity and Potential Alpha-Energy of 222Radon and 220Radon-Daughters in Different Air Atmospheres. Health Phys. 1972, 22, 441. [Google Scholar] [CrossRef] [PubMed]
- Porstendörfer, J.; Wicke, A.; Schraub, A. The Influence of Exhalation, Ventilation and Deposition Processes Upon the Concentration of Radon (222Rn), Thoron (220Rn) and Their Decay Products in Room Air. Health Phys. 1978, 34, 465–437. [Google Scholar] [CrossRef]
- Meisenberg, O.; Tschiersch, J. Specific Properties of a Model of Thoron and Its Decay Products in Indoor Atmospheres. Nukleonika 2010, 55, 463–469. [Google Scholar]
- Sakoda, A.; Meisenberg, O.; Tschiersch, J. Behavior of Radon Progeny Produced in a Scintillation Cell in the Flow-through Condition. Radiat. Meas. 2015, 77, 41–45. [Google Scholar] [CrossRef]
- Zhao, C.; Zhuo, W.; Chen, B.; Zhang, H. Characteristic and Performance of a Simple Thoron Chamber. Radiat. Prot. Dosimetry 2010, 141, 444–447. [Google Scholar] [CrossRef] [PubMed]
- Zhao, C. Methods for the Calibration and Measurements of Thoron Concentrations. Doctoral dissertation, Fudan University, 2014.
- Tang, F.; Zhuo, W.; He, L.; Zhao, C.; Xu, Y. Preparation and Emanation Properties of an Ion-Exchanged Solid Thoron Source. Radiat. Prot. Dosimetry 2012, 152, 66–70. [Google Scholar] [CrossRef] [PubMed]
- Altshuler, B.; Pasternack, B. Statistical Measures of the Lower Limit of Detection of a Radioactivity Counter. Health Phys. 1963, 9, 293. [Google Scholar] [CrossRef] [PubMed]
- Herranz, M.; Idoeta, R.; Legarda, F. Evaluation of Uncertainty and Detection Limits in Radioactivity Measurements. Nucl. Instrum. Methods Phys. Res. Sect. Accel. Spectrometers Detect. Assoc. Equip. 2008, 595, 526–534. [Google Scholar] [CrossRef]
- Janik, M.; Tokonami, S.; Iwaoka, K.; Karunakara, N.; Trilochana, S.; Mohan, M.P.; Kumara, S.; Yashodhara, I.; Zhuo, W.; Zhao, C.; et al. Comparison of Radon and Thoron Concentration Measuring Systems Among Asian Countries. Int. J. Environ. Res. Public. Health 2019, 16, 5019. [Google Scholar] [CrossRef]
Figure 1.
Structure of a compartment model for thoron and its progenies in an airflow-through cell.
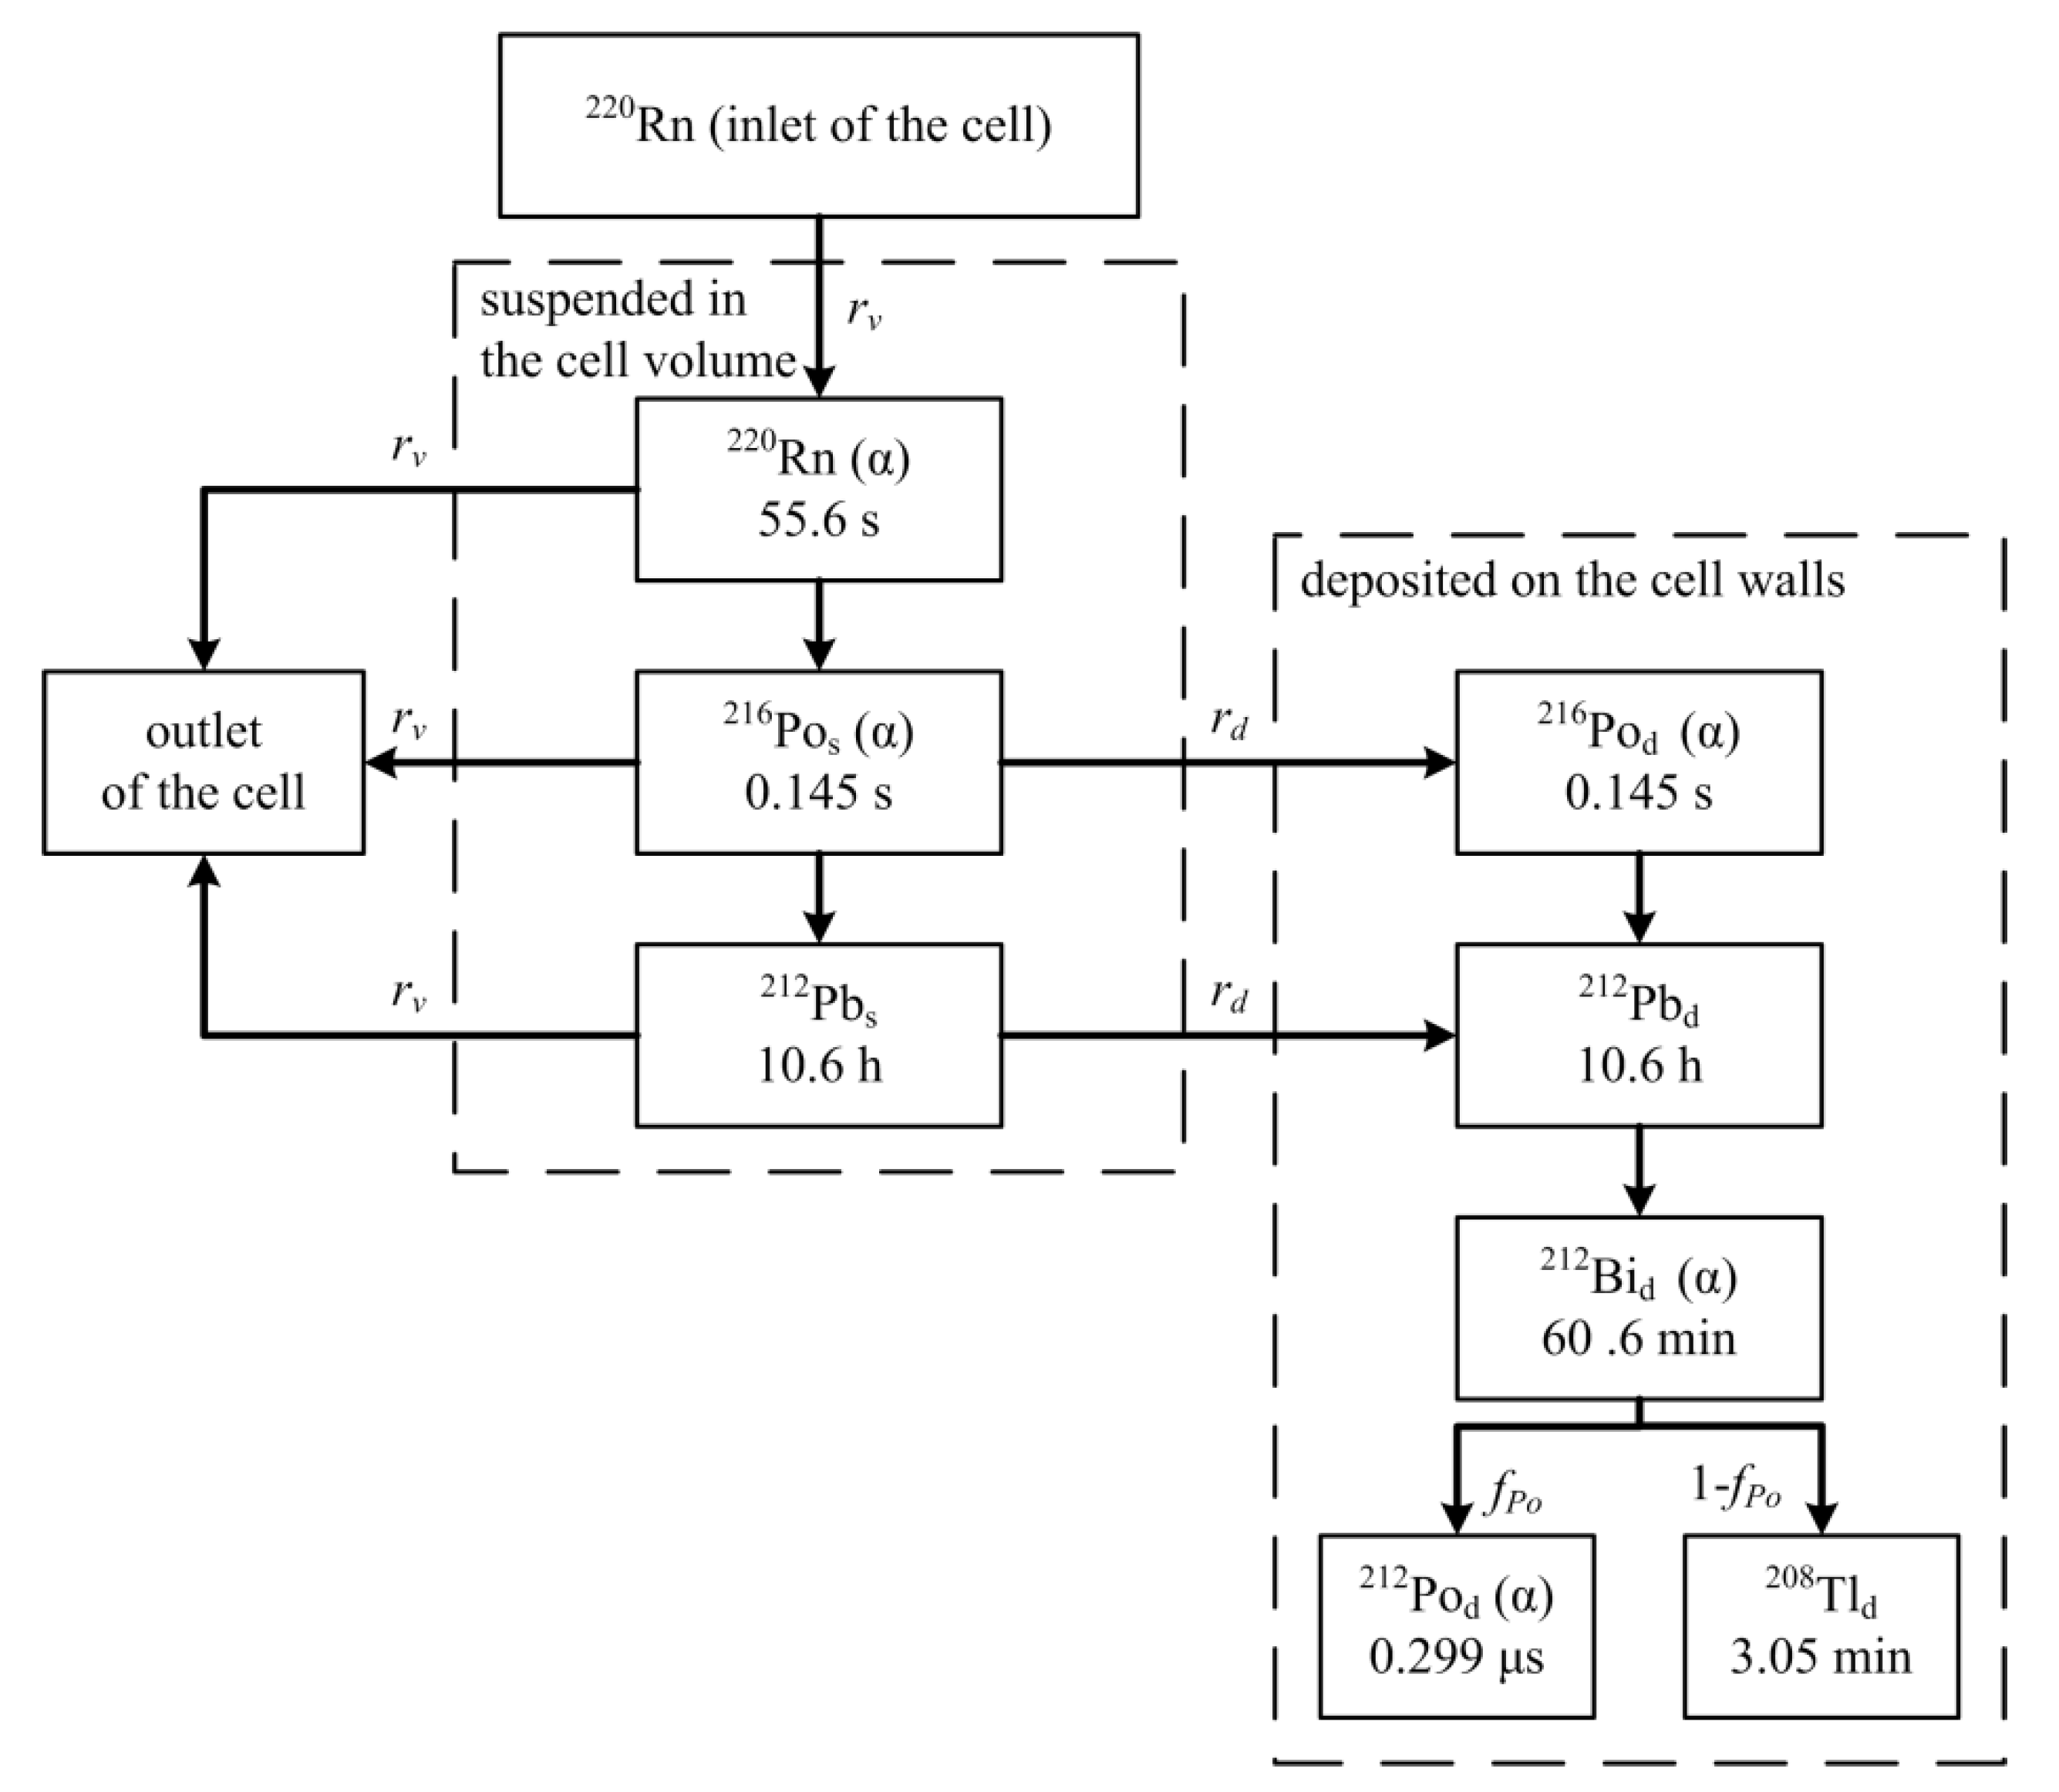
Figure 2.
Schematic diagram of the scintillation cell.
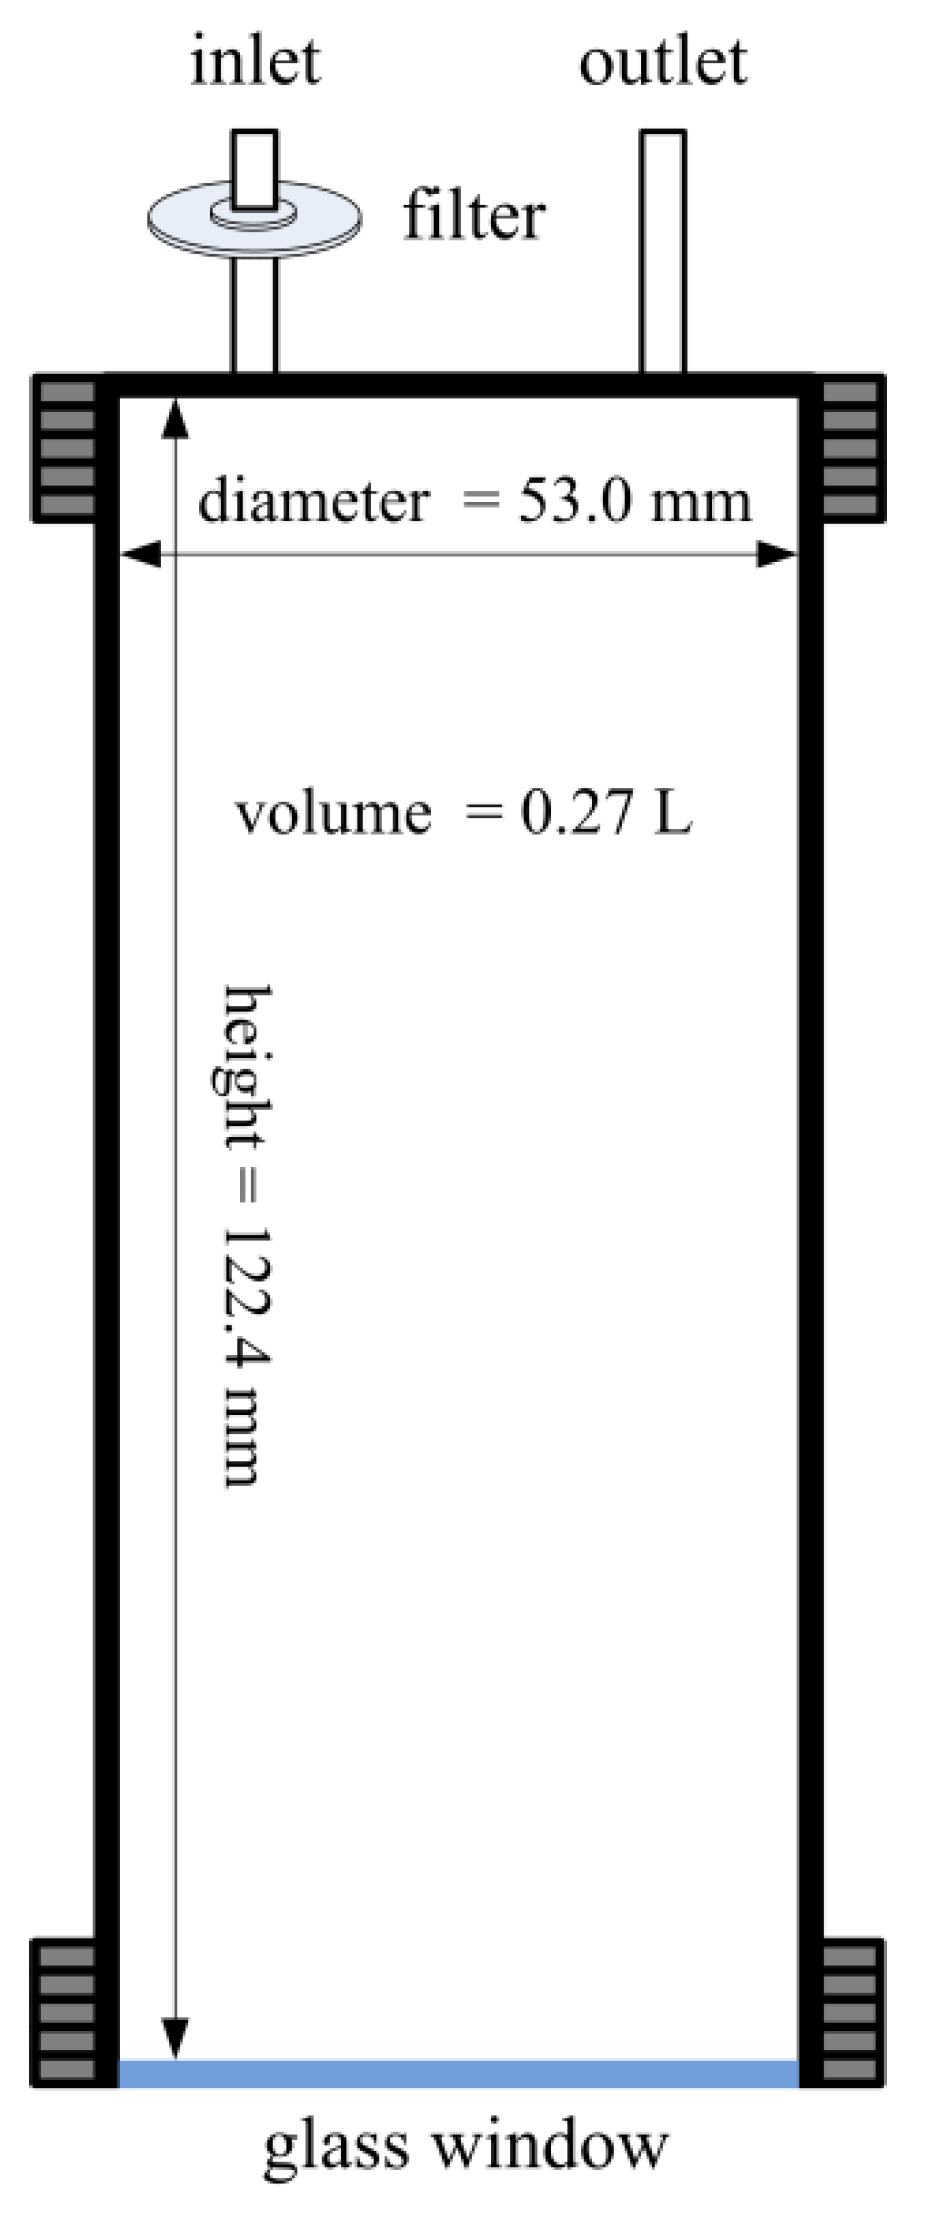
Figure 3.
Calibration trial results of the scintillation cell.
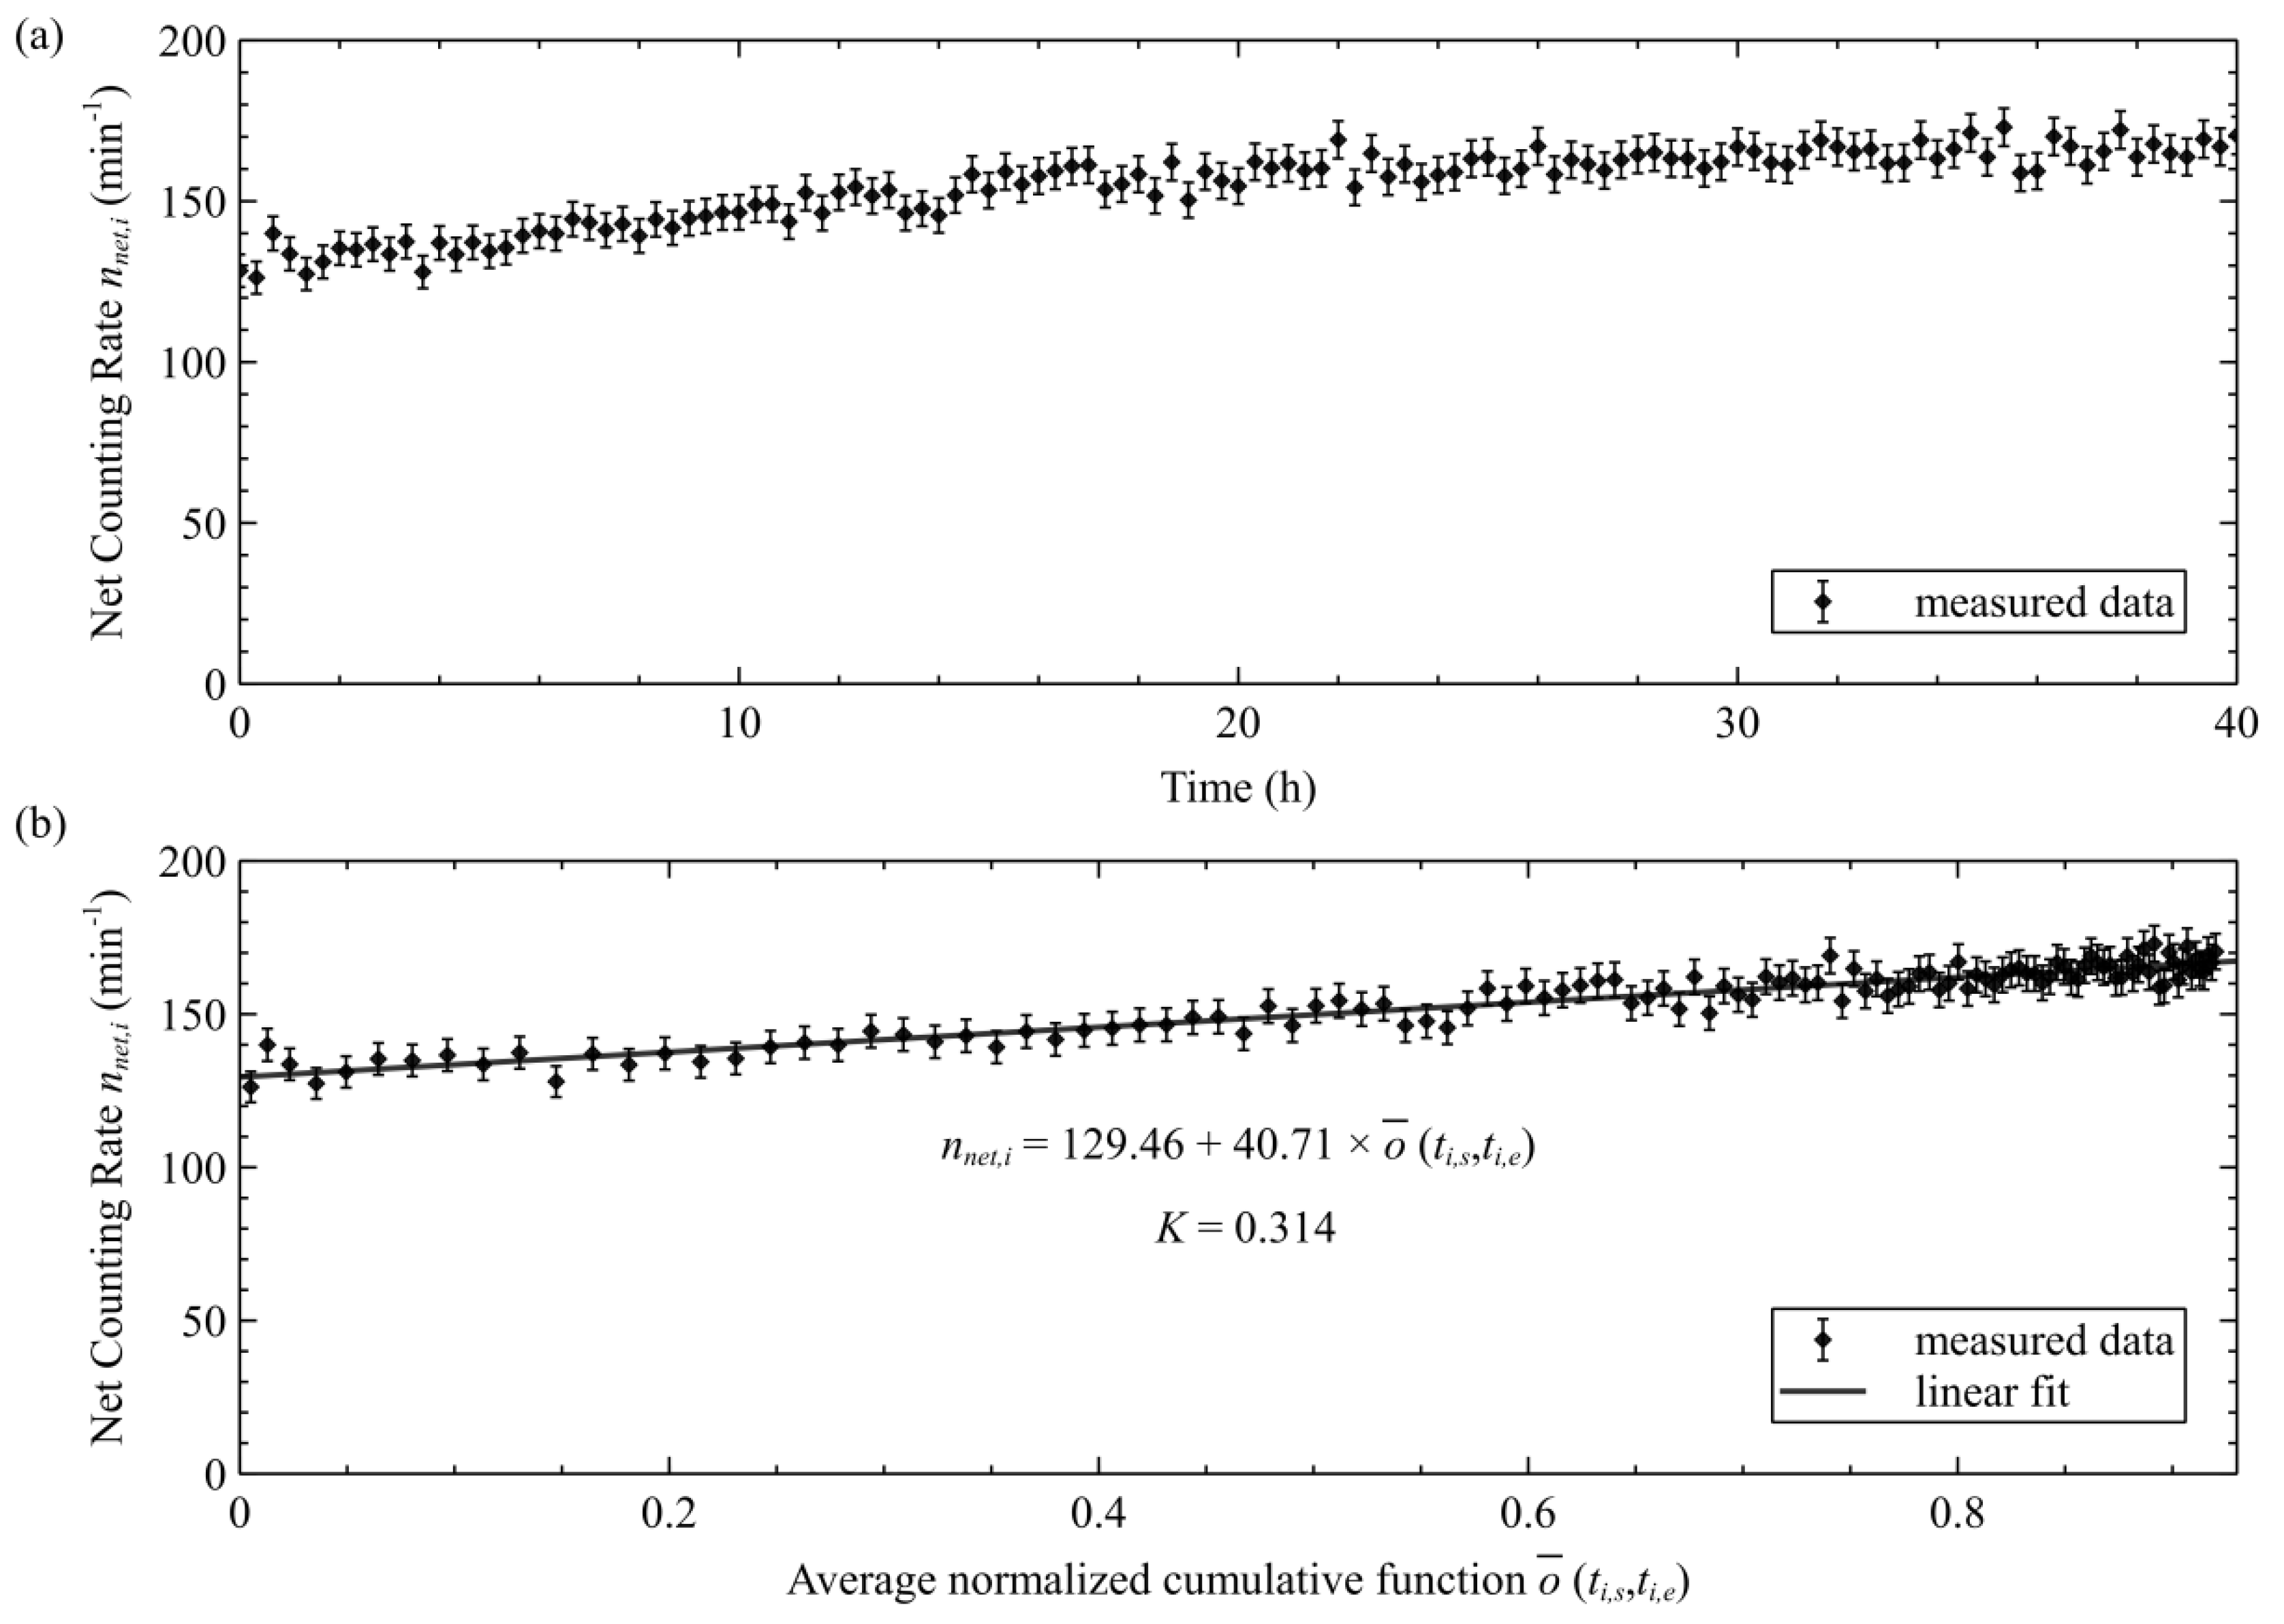
Figure 4.
Comparison of theoretical prediction and experimental results for 212Bi counting rates in the PIPS device.
Figure 4.
Comparison of theoretical prediction and experimental results for 212Bi counting rates in the PIPS device.
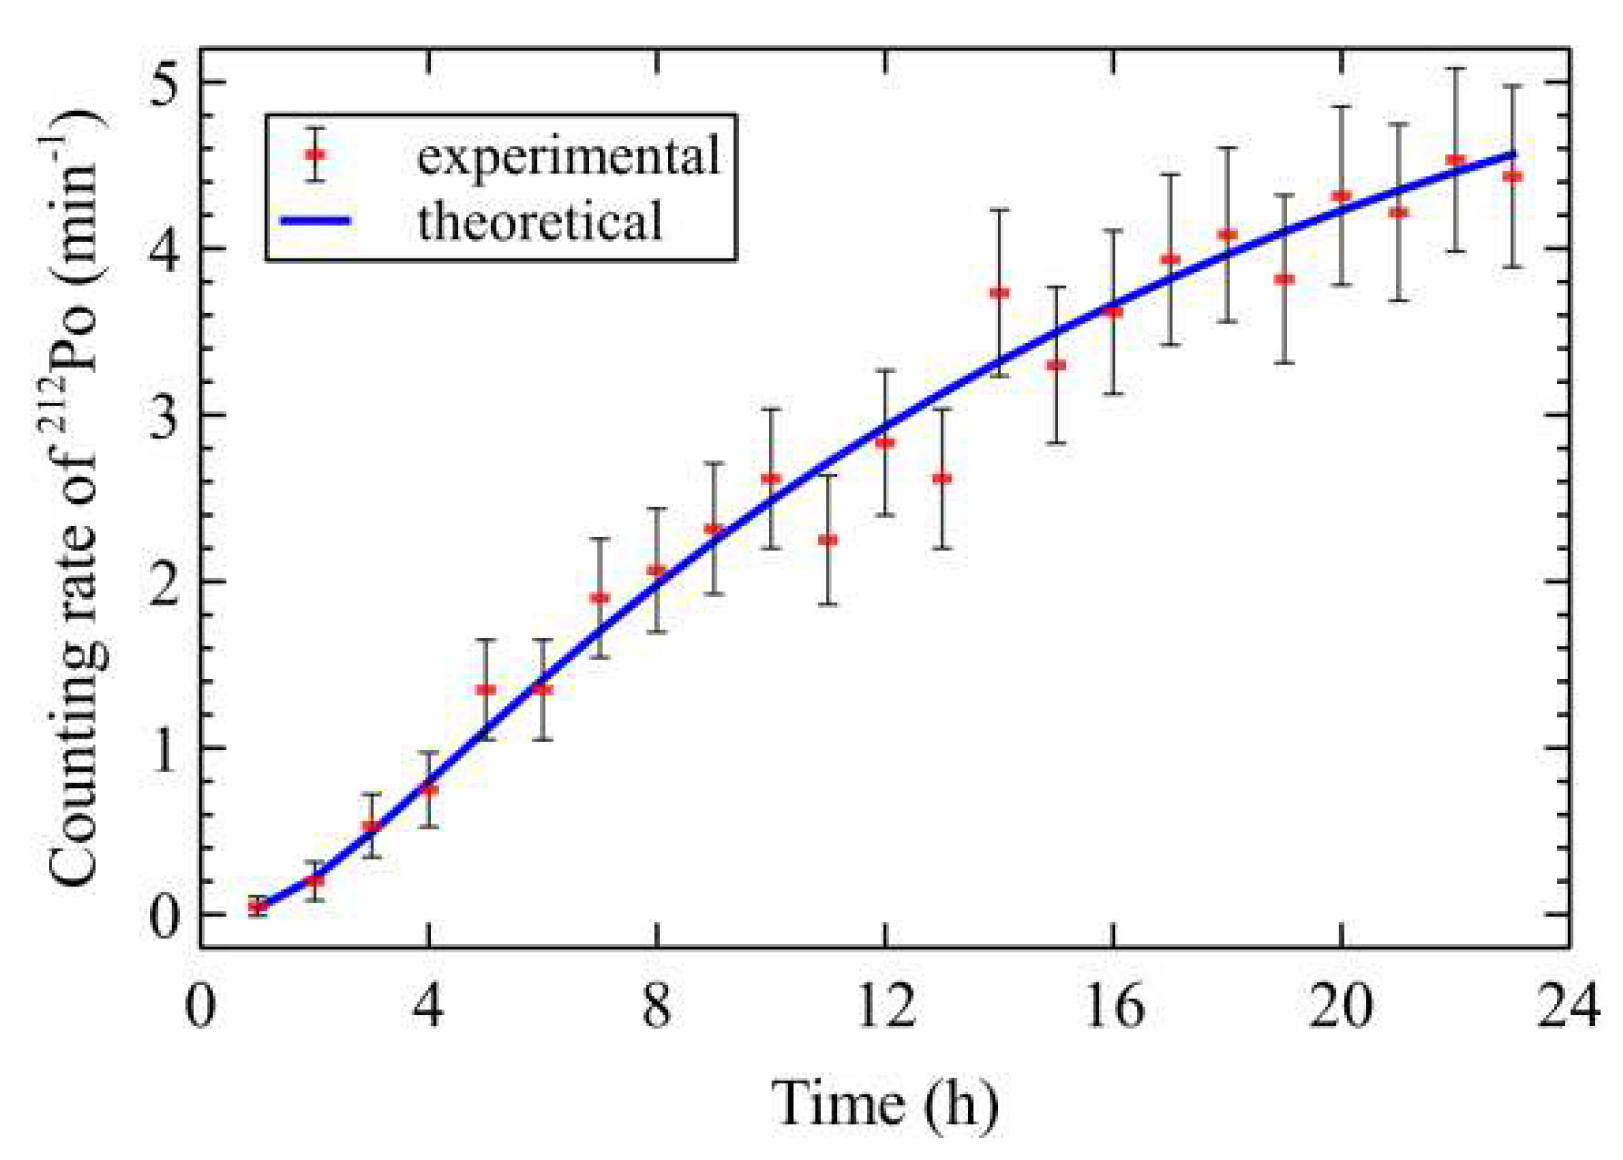
Figure 5.
Comparison of thoron concentration measurement results using scintillation cell with and without progeny accumulation correction and PIPS device.
Figure 5.
Comparison of thoron concentration measurement results using scintillation cell with and without progeny accumulation correction and PIPS device.
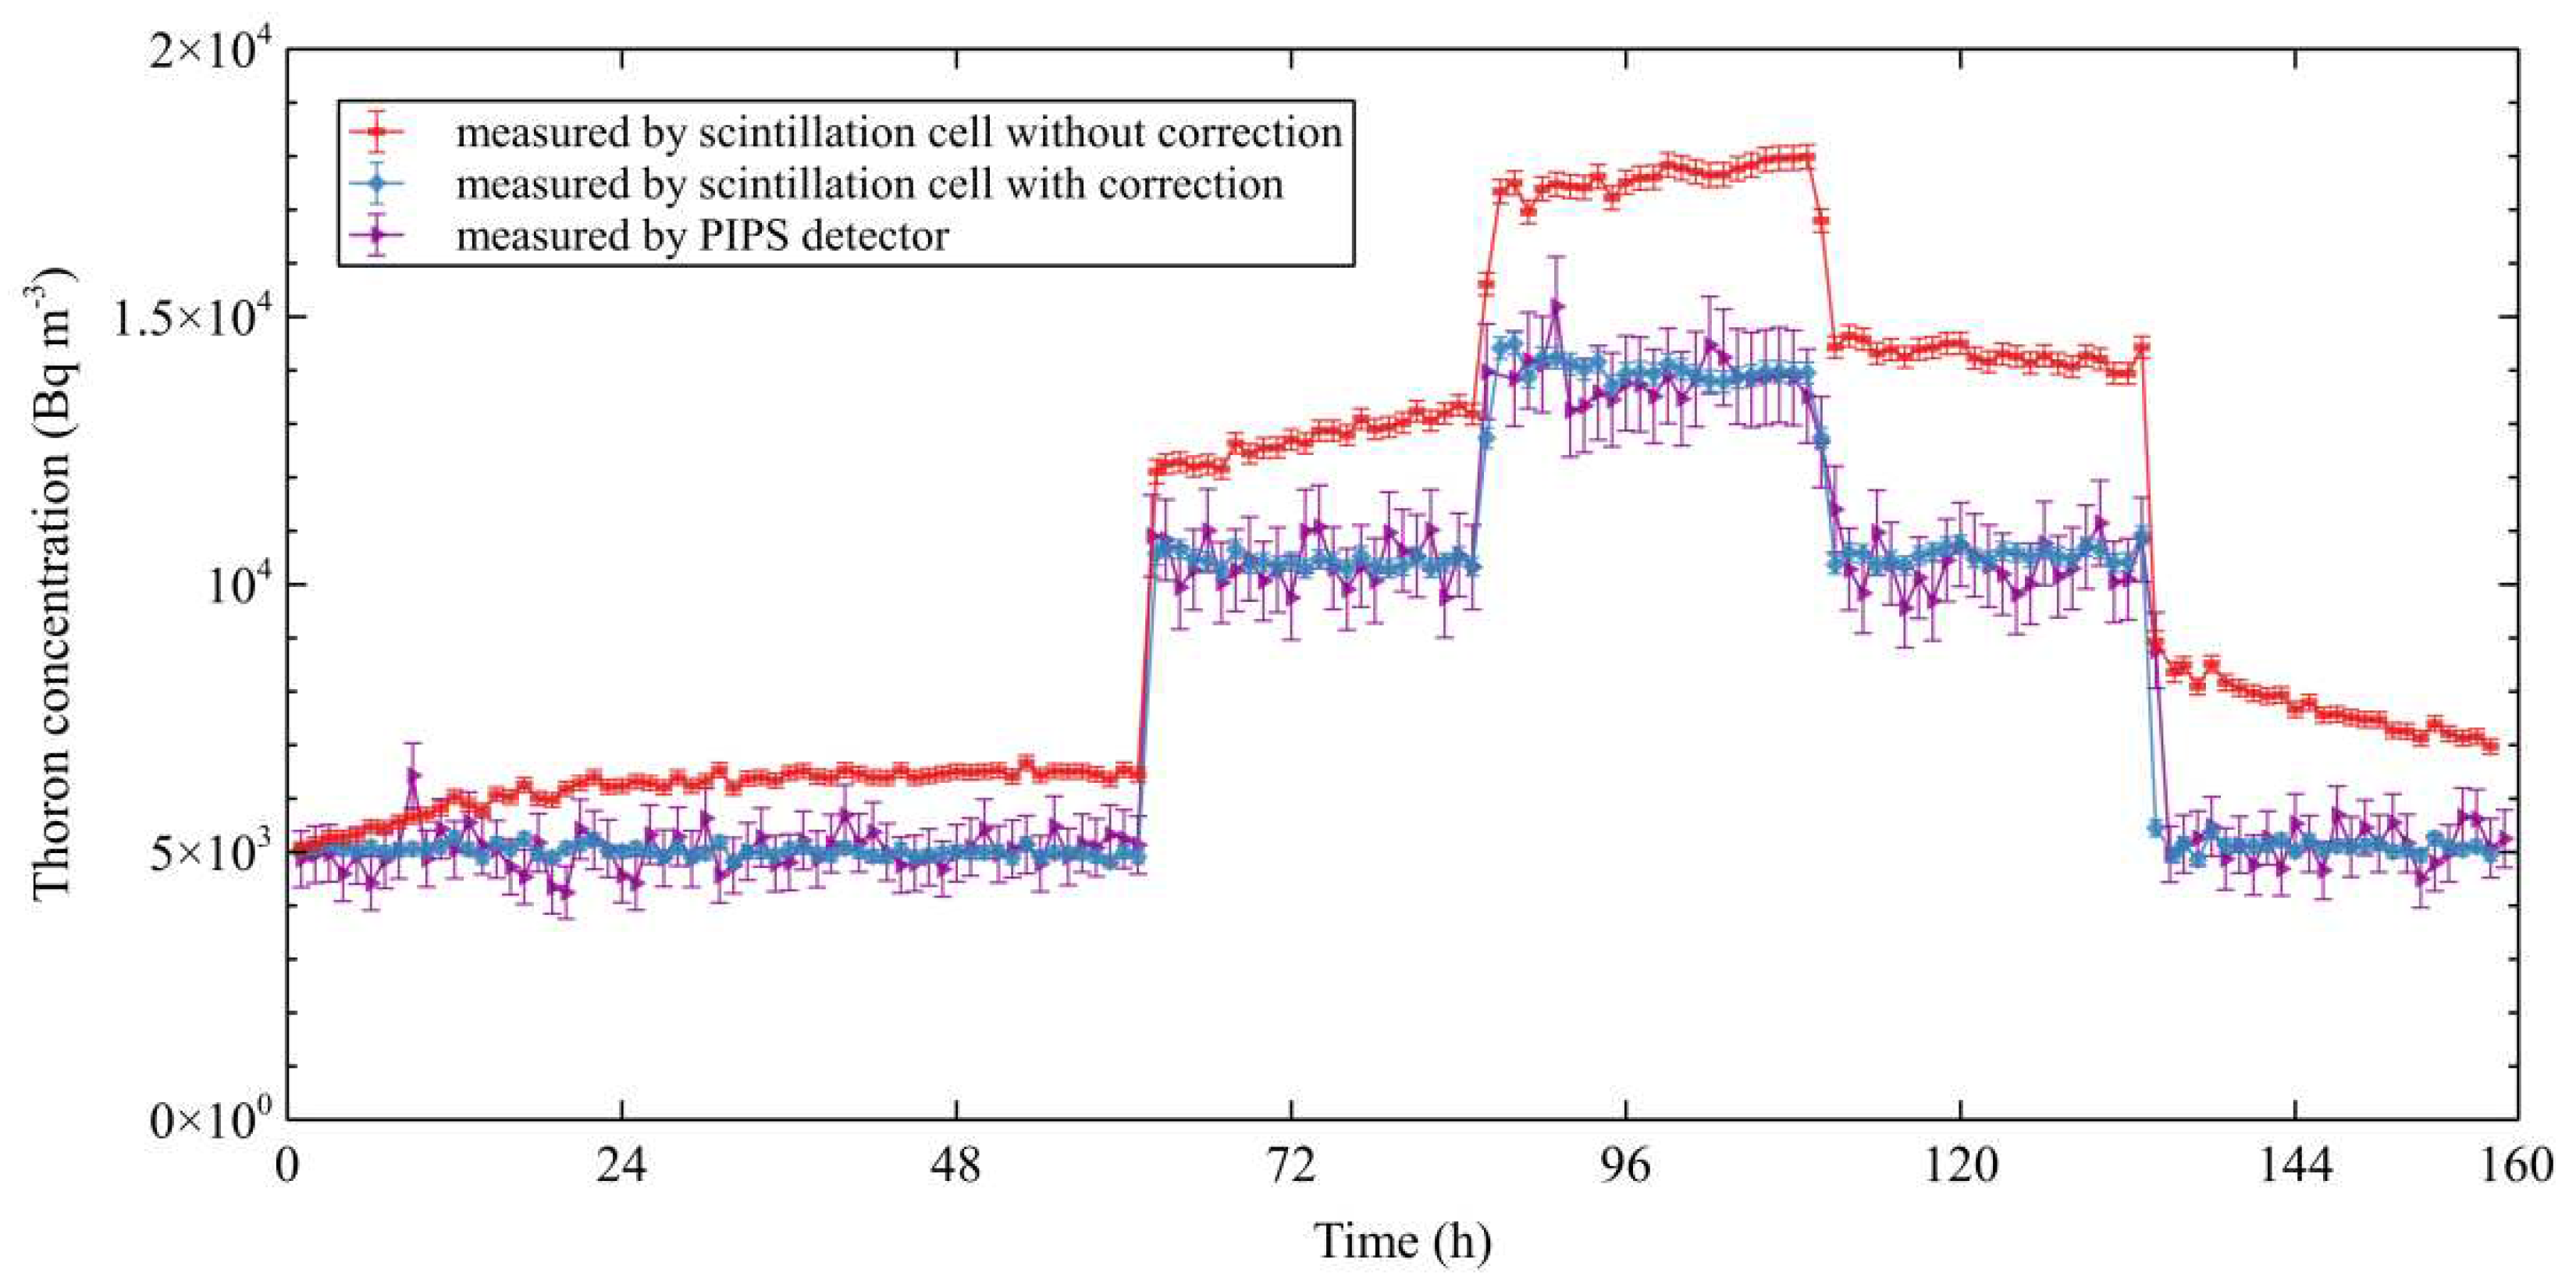
Figure 6.
Schematic diagram of an ancillary measurement device using a scintillation cell for radon measurement.
Figure 6.
Schematic diagram of an ancillary measurement device using a scintillation cell for radon measurement.
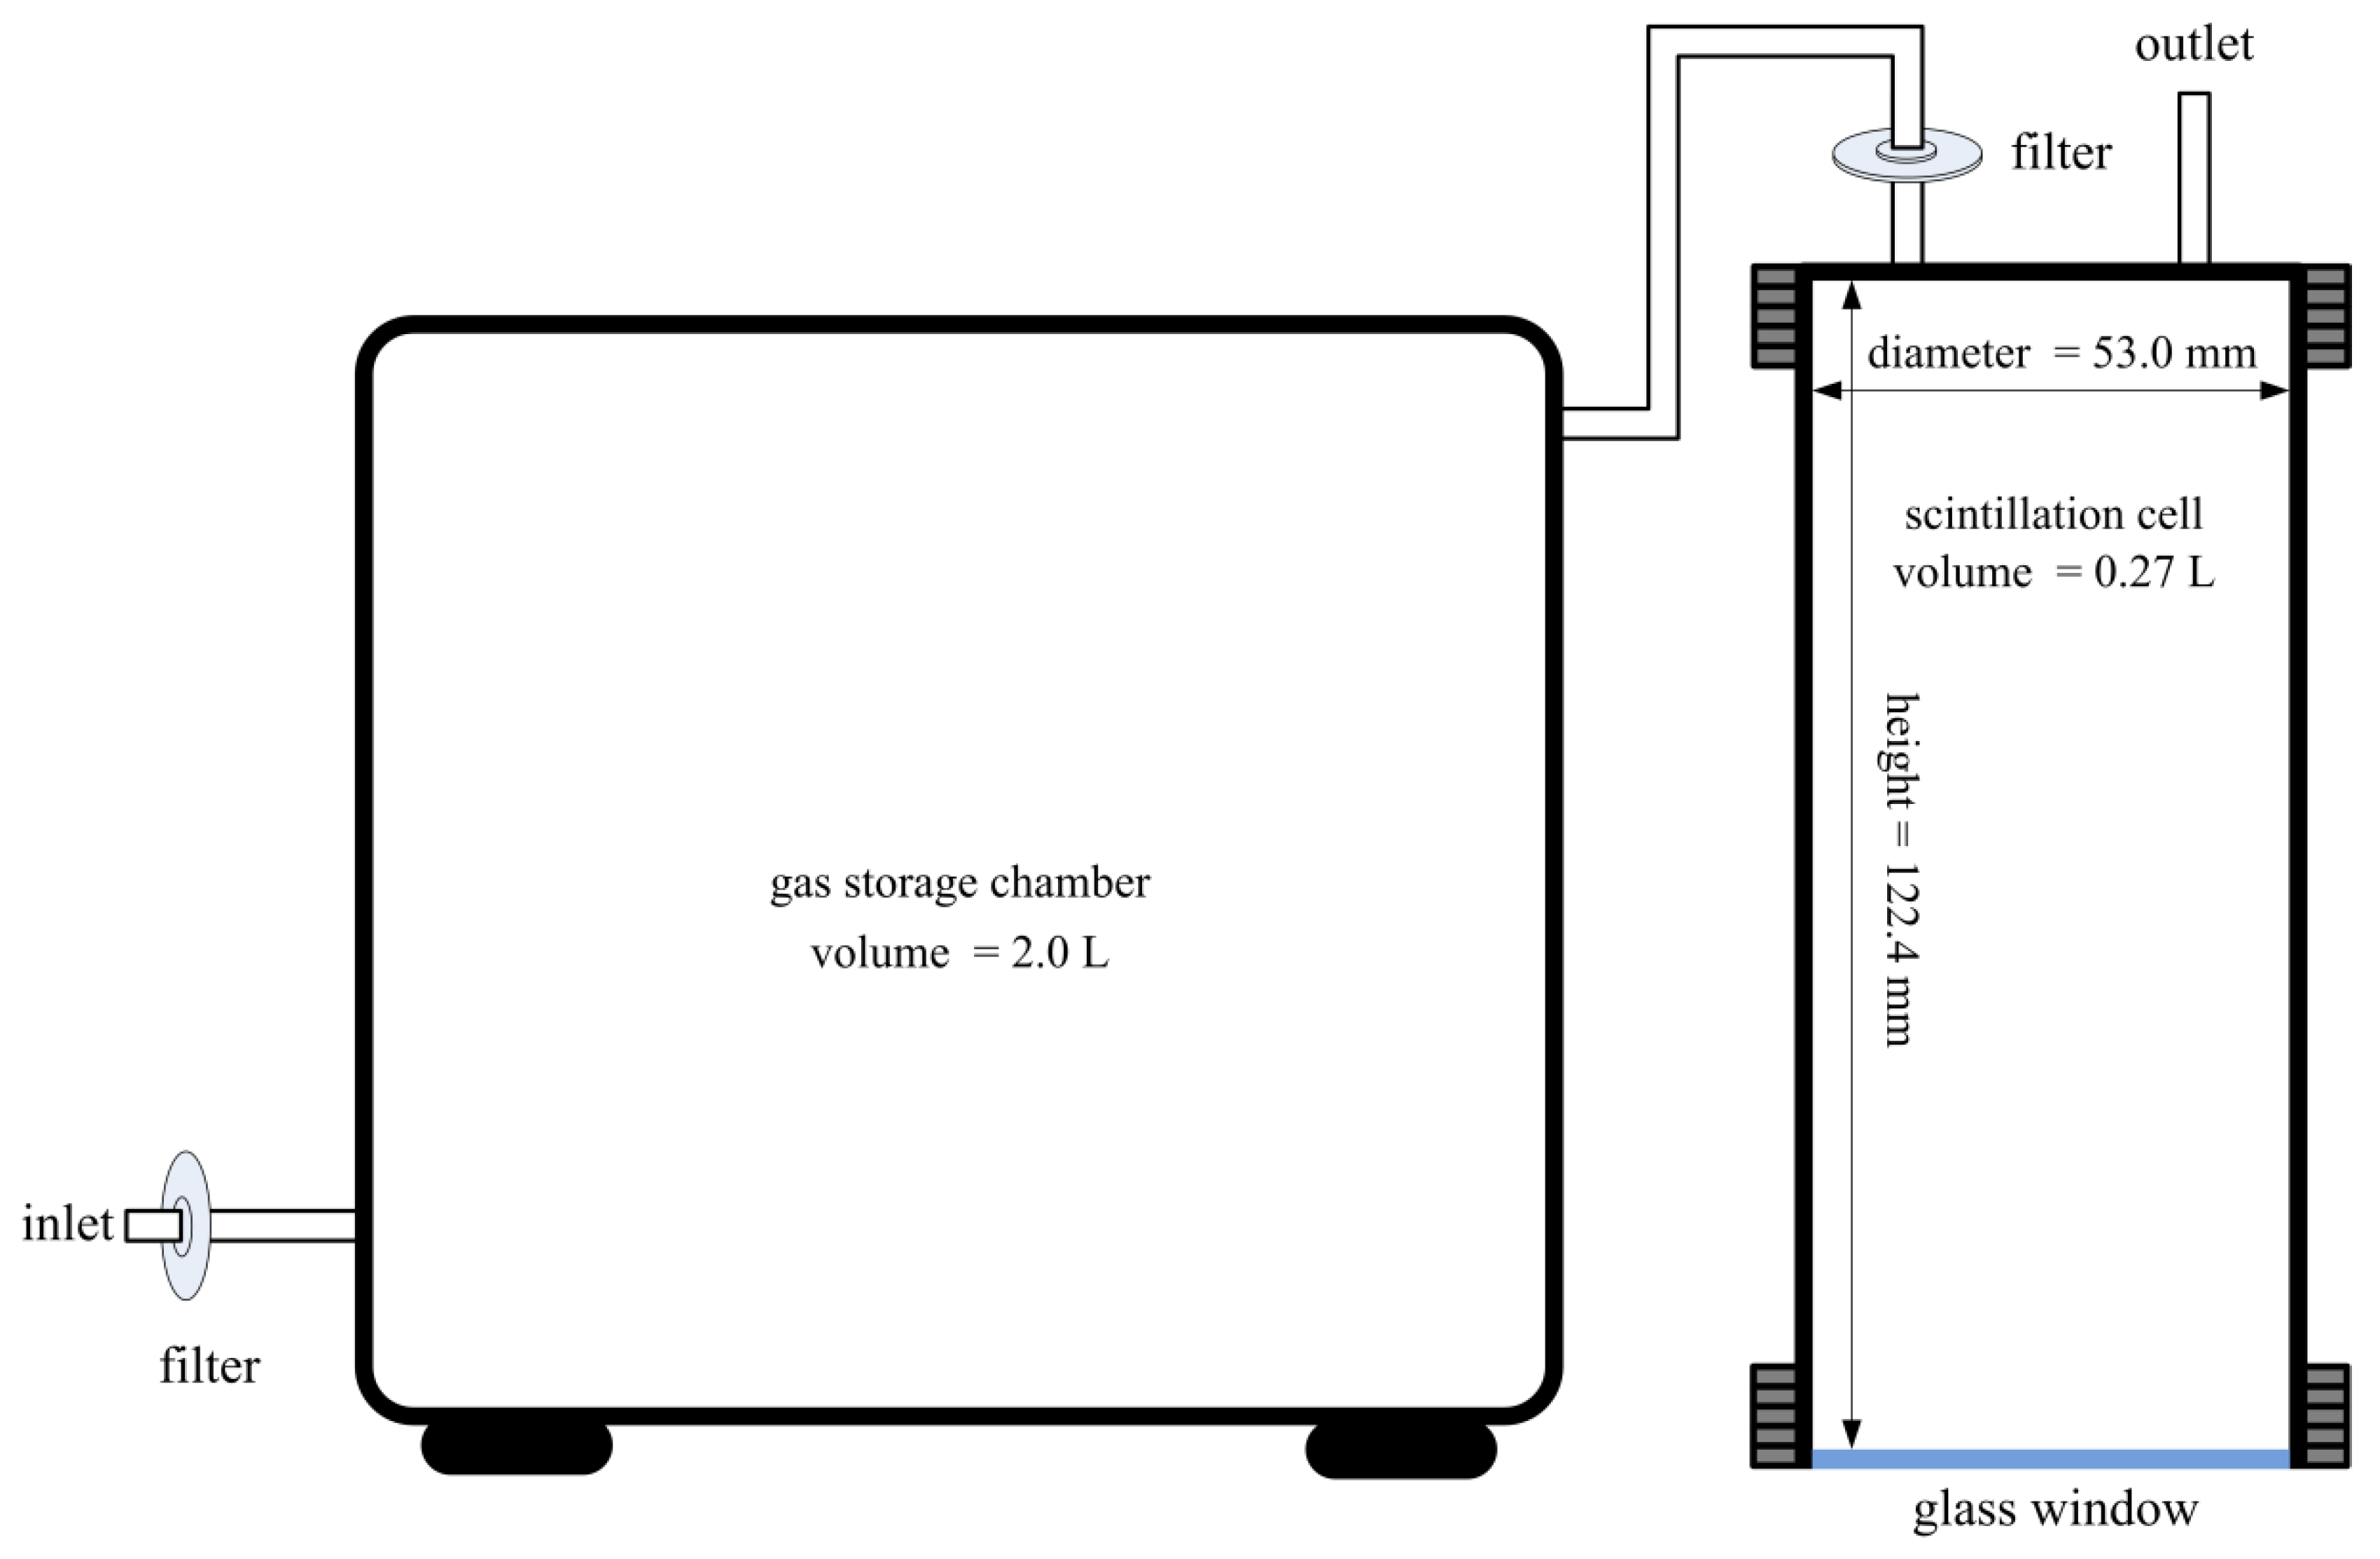

Table 1.
The parameters of the airflow-through scintillation cell, the grab-sample scintillation cell, and the PIPS device.
Table 1.
The parameters of the airflow-through scintillation cell, the grab-sample scintillation cell, and the PIPS device.
| Parameters | Airflow-through scintillation cell |
Grab-sample scintillation cell |
PIPS device | |
|---|---|---|---|---|
| T =1 min | T = 10 min | |||
| STn (min-1 (Bq m-3)-1) | 2.36×10⁻² | 1.94×10⁻² | 3.67×10⁻³ | 1.07×10⁻³ |
| SRn (min-1 (Bq m-3)-1) | 2.70×10⁻² | 1.17×10⁻² | 1.74×10⁻² | 0.85×10⁻³ |
| nbg (min-1) | 1.02 | 1.02 | 1.02 | 1.67×10⁻³ |
| K* | 0.314 | / | / | / |
* Not applicable for the grab-sample scintillation cell and the PIPS device.
Table 2.
The lower detection limit (Bq m-3) of the airflow-through scintillation cell, the grab-sample scintillation cell, and the PIPS device.
Table 2.
The lower detection limit (Bq m-3) of the airflow-through scintillation cell, the grab-sample scintillation cell, and the PIPS device.
| Concentration of radon (Bq m-3) |
Airflow-through scintillation cell |
Grab-sample scintillation cell |
PIPS device | |||
|---|---|---|---|---|---|---|
| T = 10 min | T = 60 min | T =1 min | T = 10 min | T = 10 min | T = 60 min | |
| 0 | 74 | 28 | 383 | 478 | 309 | 65 |
| 50 | 107 | 41 | 444 | 624 | 542 | 160 |
| 100 | 132 | 51 | 495 | 739 | 658 | 207 |
| 200 | 167 | 66 | 580 | 925 | 823 | 275 |
| 1,000 | 341 | 137 | 996 | 1,793 | 1,522 | 560 |
Table 3.
The expanded relative measurement uncertainty (k=2) of the airflow-through scintillation cell, the grab-sample scintillation cell, and the PIPS device*.
Table 3.
The expanded relative measurement uncertainty (k=2) of the airflow-through scintillation cell, the grab-sample scintillation cell, and the PIPS device*.
| Concentration of thoron (Bq m-3) |
Concentration of radon (Bq m-3) |
Airflow-through scintillation cell |
Grab-sample scintillation cell |
PIPS device | |||
|---|---|---|---|---|---|---|---|
| T = 10 min | T = 60 min | T =1 min | T = 10 min | T = 10 min | T = 60 min | ||
| 100 | 0 | 54% | 22% | / | / | / | 80% |
| 100 | 100 | / | 29% | / | / | / | / |
| 500 | 0 | 22% | 9% | 68% | 58% | 87% | 35% |
| 500 | 100 | 24% | 10% | 71% | / | / | 38% |
| 500 | 1,000 | 35% | 14% | / | / | / | / |
| 1,000 | 0 | 15% | 6% | 47% | 37% | 61% | 25% |
| 1,000 | 100 | 16% | 6% | 48% | 44% | 64% | 26% |
| 1,000 | 1,000 | 21% | 8% | 59% | / | / | 33% |
| 10,000 | 0 | 5% | 2% | 14% | 11% | 19% | 8% |
| 10,000 | 100 | 5% | 2% | 14% | 11% | 19% | 8% |
| 10,000 | 1,000 | 5% | 2% | 15% | 13% | 20% | 8% |
| 10,000 | 10,000 | 6% | 3% | 18% | 25% | 26% | 11% |
* The uncertainty was not provided when the thoron concentration was below the lower detection limit, which might not able to be accurately estimated through Eq. (18) – (20).
Disclaimer/Publisher’s Note: The statements, opinions and data contained in all publications are solely those of the individual author(s) and contributor(s) and not of MDPI and/or the editor(s). MDPI and/or the editor(s) disclaim responsibility for any injury to people or property resulting from any ideas, methods, instructions or products referred to in the content. |
© 2023 by the authors. Licensee MDPI, Basel, Switzerland. This article is an open access article distributed under the terms and conditions of the Creative Commons Attribution (CC BY) license (http://creativecommons.org/licenses/by/4.0/).
Copyright: This open access article is published under a Creative Commons CC BY 4.0 license, which permit the free download, distribution, and reuse, provided that the author and preprint are cited in any reuse.


