
Submitted:
15 March 2023
Posted:
15 March 2023
You are already at the latest version
Abstract
Aerosol Optical Thickness (AOT) is one of the critical factors for global atmospheric conditions, climate change, and air pollution. AOT has been exposed as a major component of air pollution in Bangladesh. This paper aims to map the seasonal distribution of AOT from 2002-2022 and to explore the internal relationship between AOT and ten air pollutants using remote sensing and machine learning tools. These ten air pollutants are Particulate matter (PM2.5), Methane (CH4), Carbon monoxide (CO), Nitrogen dioxide (NO2), Formaldehyde (HCHO), Ozone (O3), Sulfur dioxide (SO2), Aerosol Particulate Radius (APR), Nitrogen oxide (NOx) and Black carbon (BC). The results show that the concentrations of AOT were higher in December-January-February (mean value 0.50) and March-April-May (mean value 0.50) seasons, mostly in the central, western, and southern parts of Dhaka, Narayanganj, and Munshiganj districts. AOT was a bit less in June-July-August (mean value 0.33) and September-October-November (mean value 0.37). This paper also revealed that the AOT was correlated positively with PM2.5 (0.60), CH4 (0.80), NO (0.76), and BC (0.83) while correlated negatively with CO (-0.66), HCHO (-0.16), SO2 (-0.41), APR (-0.48), and NOx (-0.20). From the machine learning, the Rational quadratic GPR (RME-0.0024, MAE-0.0015, R2-0.96), Matern 5/2 GPR (RMSE-0.0023, MAE-0.0015, R2-0.96), and Squared Exponential GPR (RMSE-0.0015, MAE-0.0015, R2-0.96) were found good classifiers to predict AOT. UN agencies, government line departments, and local and regional development councils for air pollution mitigation and long-term protective measures may use the paper's key results.
Keywords:
AOT
; Bangladesh
; Air pollution
; Machine Learning
; Remote Sensing
1. Introduction
The earth's atmosphere is a complex fusion of various liquid, solid and gaseous substances [1,2,3]. Aerosol Optical Thickness (AOT) is the quantitative measure of the aerosol particles present in the earth's atmosphere, which represents the extinction of solar radiation by scattering and absorbing it when it passes through the atmosphere [4,5,6]. In the climate system, AOT exhibits significant influence by reflecting, scattering, and absorbing both the incident and reflected radiation. In different parts of the world, spatial and temporal variations of AOT have been observed due to natural and anthropogenic emissions, primarily associated with the heavy concentration of particulate matter in the air [7,8]. Seasonal and temporal variations of atmospheric aerosol have also been observed over Bangladesh. Observations of atmospheric aerosol indicate that the pre-monsoon season exhibits maximum AOT values, while the minimum AOT is observed in the post-monsoon period [9]. Heavy particulate matter concentration is observed in Dhaka, the capital of Bangladesh, one of the highest heavily polluted cities in the world [10,11,12,13]. Unplanned infrastructural development, brickfields, and unfit vehicles contribute significantly to aerosol concentration [14,15,16,17].
According to a study in Kanpur, India, anthropogenic sources are dominant producers of fine aerosols during winter and post-monsoon seasons. In contrast, pre-monsoon and monsoon seasons observe coarse aerosol loading [18]. A forest fire in Sumatra, Indonesia, increased the PM2.5 concentration in the air which is highly correlated with increased AOT concentration [19]. According to [18], dust storms significantly affect aerosols' seasonal and temporal variation over the Indo-Gangetic basin, followed by the enhanced value of AOT immediately after the sand storms from the Thar desert. Thus, it is evident that aerosol loading has global spatial and temporal variability. Air pollution is not a regional issue nowadays; it has become a global phenomenon. However, most of the previous studies looked into either spatiotemporal variations or the seasonal effect of AOT, where the remote sensing-based seasonal variation and its relationship with other key air pollutants need to be included and discovered. Therefore, this research has filled this knowledge gap by aiming for two objectives: (1) mapping the seasonal distribution of AOT from 2002-2022 and (2) exploring the internal relationship between AOT and ten air pollutants using remote sensing and machine learning tools.
2. Materials and Methods
2.1. Study Location
Dhaka, Narayanganj, Munshiganj, Narshingdi, and Gazipur districts were considered as the study location for this paper (Figure 1). The entire study location lies between latitudes 23°20'N - 24°20'N and longitudes 90°00'E- 91°00'E, which covers approximately 7,036 km2. According to [20], roughly 15 million people live there, with a population density of 2,170 persons per km2 [21]. Mainly four climatic circumstances are predominant in the area: summer, pre-monsoon, monsoon, and winter [22].
2.2. Datasets Used
As the independent variables, ten different types of air pollutants were used in this paper. These pollutants were collected and extracted from several satellite sensors (Table 1). Aerosol optical thickness (AOT), Particulate matter (PM2.5), Methane (CH4), Carbon monoxide (CO), Nitrogen dioxide (NO2), Formaldehyde (HCHO), Ozone (O3), Sulphur dioxide (SO2), Aerosol Particulate Radius (APR), Nitrogen oxide (NOx) and Black carbon (BC) were downloaded in November 2022 due to high signature of their properties in the study area’s air [16,23,24,25,26]. On the other hand, Aerosol Optical Thickness (AOT), as the dependent variable, was collected from 2002-2022. The monthly average data of December-January-February, March-April-May, June-July-August, and September-October-November from 2002-2022 was used as seasonal variation information. The scientific characteristics of both dependent and independent variables are described in Table 1.
2.3. Sample Collection
This paper collected 190 sample points from different areas of the study locations using a random sampling method [27,28,29]. Each district contained a minimum of 37 sample points, which were uniformly distributed across the study location (Figure 1). The on-screen point data collection method was applied to extract these points and then a database was prepared for geographic information system and statistical analyses. These data points were used in machine learning tools.
2.4. Pre-processing
2.5. Seasonal Analysis
Understanding the spatial and seasonal variations and the load of AOT is crucial for local climate and air pollution [32,33]. The winter, pre-monsoon, and monsoon seasons were considered to find out the seasonal variability [8]. GIS mapping and statistical analysis were used to delve into the seasonal characteristics of AOT.
2.6. Correlation Analysis
Pearson's correlation was used in this paper to find out the internal relationships among different variables. A correlation is the most helpful tool in understanding the positive and negative correlated variables among air pollutants and other factors [6,34,35,36]. The calculation of a correlation is below:
where r = correlation coefficient, = values of each point (x variable), = values of the mean (x), = values of each point (y), and = values of the mean (y).
2.7. Point Interpolation
The 190 sample points collected from the study area were interpolated using the Inverse Distance Weighted (IDW) method due to close distance and uniform data distribution [37,38,39]. The seasonal variations of AOT were mapped using this interpolation method, which has been used widely in air pollution mapping and modelling [39,40,41,42]. The IDW calculation is in the equation below:
where is the value of a known data point, is the distance of a known point, is the value at the unknown point.
2.8. Machine Learning (ML) for Prediction
This paper used machine learning algorithms to predict the internal relationship between AOT (dependent variable) and ten air pollutants (independent variables). The annual average data from 2002-2022 was used with no seasonal variation in this prediction modelling. The standard process of a machine learning system, such as data collection, preparation, feature selection, training data generation, data testing, and evaluation, were followed to execute the Rational quadratic GPR, Exponential GPR, Matern 5/2 GPR, and Squared Exponential GPR classifiers [43,44,45,46]. Finally, the Mean Absolute Error (MAE), Root Mean Square Error (RMSE), Mean Square Error (MSE), and Coefficient of Determination (R2) were used to evaluate the model performance of these classifiers. The equations of these performances are given below:
where n is the number of sample data points (190), Pi is the predicted data point, and is the mean of the observed data.
3. Results and Discussion
3.1. Descriptive Statistics of All Parameters
The basic descriptive information of all parameters is shown in Table 2. This analysis revealed that all of the variables' mean concentration ranges from 0.005 to 82.11, while the standard deviation ranges between 0.002 and12.49. Among all the variables, the mean concentration was very high for CO (82.11), PM2.5 (65.29), NO (56.15), and O3 (23.28). On the other hand, standard deviation was the highest for NO (12.49), ARP (3.83), and PM2.5 (1.23) (Table 2). The minimum and maximum values variations were also observed in NO (28.58 - 74.26) and APR (10.64 - 28.14).
3.2. Seasonal Analysis of AOT
The seasonal and spatial variations of AOT are presented in Figure 2. The mean concentration of AOT was higher in December-January-February (0.50) and March-April-May (0.50), while it was a bit less in June-July-August (0.33) and September-October-November (0.37). The standard deviations of December-January-February (0.01) and March-April-May were the same (0.01) (Table 3). During the December-January-February seasons, the most concentrated areas were found in the central, western, and southern parts of Dhaka, Narayanganj, and Munshiganj districts (Figure 2). Eastern and Southern parts of Narayanganj and Narshingdi were highly concentrated. On the other hand, a similar concentration pattern was found in June-July-August and September-October-November seasons (Figure 2).
Among the most populated nations, Bangladesh and other countries had the highest aerosol loadings [47]. Numerous types of research have been done on the effects of AOT and their seasonal patterns in various regions of the world, mainly to explore why AOT is so high and the seasonal variance found throughout Bangladesh. Research in Dhaka indicated that biomass burning contributed to 40.2% of all pollutants and that the annual increase in AOD was mainly caused by biomass burning during the winter [48]. Anthropogenic factors such as emissions from vehicular transportation, burning of biomass, industrial activities, and activities for urban growth, and natural sources of aerosols include forest fires, burning of crop waste, marine aerosols, and mineral dust and the adjacent maritime areas of Asia are the key reasons for occurring AOT in Bangladesh [47,48,49]. Over the Indian subcontinent, AOT patterns are significantly increasing [47]. Bangladesh experiences very high yearly aerosol loading, and because of its location, its seasonal AOT pattern is comparable to the neighbouring country, India [9,50,51].
An array of quality research papers has also reported that AOT has a seasonal variation, which explains why it is happening in Dhaka and other parts of the globe. AOT's seasonality exhibits higher values during pre-monsoon & monsoon seasons whereas lower values during post-monsoon & winter seasons [9,47,48]. During the DJF (December, January, February) season, high AOD values are the manifestations of anthropogenic activities (coal fire plants, vehicle emissions, biomass burning) and meteorological conditions that concentrate the aerosol load in the East Indo Gangetic Plains [47]. In the summer season, MAM (March, April, May) AOT is seen to increase, which is expected to occur because of high temperature, high wind velocities, and higher concentrations of water vapour in pre-monsoon, which has been shown to have a relationship with increasing AOT [9]. The minimum AOT values are recorded during SON (September, October, November) season when the meteorological conditions favour an increasing AOT pattern [47,51]; this is similar to reducing AOT concentration in Dhaka, Bangladesh.
3.3. Correlation Analysis among Parameters
A heat map was generated to show the results of Pearson’s correlation (Figure 3). The correlation results reveal that AOT correlated positively with four air pollutants which were statistically significant to PM2.5 (0.60), CH4 (0.80), NO (0.76), and BC (0.83). On the other hand, AOT was correlated negatively with CO (-0.66), HCHO (-0.16), SO2 (-0.41), APR (-0.48), and NOx (-0.20).
Worldwide, the total aerosol optical thickness appears to be equally influenced by sulphate, dust, and carbonaceous particles (organic carbon, black carbon) and sea salt to overall AOT [50,52]. Black and organic carbon aerosol emissions, including mineral ash, are mainly brought on by forest fires [53]. Aerosols can be divided into two categories based on their origin: terrestrial (from sources like industrial smoke, bushfires, sandstorms, volcanic eruptions, and crop burning) or marine (from sources like salt crystals, ocean spray, and hygroscopic salt nuclei) [54,55]. Biomass burning significantly increases monthly loading and order of magnitude daily spikes for tropical sites [56]. A study conducted by [57] in the Netherlands on determining a relationship between AOT and PM2.5 found that the correlation between AOD and PM2.5 is reasonably high in the more polluted areas. The paper’s study area has found that vehicular transportation, burning biomass and crops, wildfires, and mineral dust contribute to the AOT in Bangladesh [47,48,49].
CH4 has risen gradually from 2018-2021 in several districts within Bangladesh, such as Dhaka, Gazipur, and Munshiganj. Furthermore, a positive correlation has been established between CH4 and different air pollutants such as black carbon, dust, NO2, PM2.5, O3, and AOT [58]. Previous research revealed in Alabama, USA, that a significant positive relationship was found between AOT and PM2.5 [5,59]. A positive correlation between AOT and surface PM2.5 has been shown in this investigation [60]. A study done in Thailand found that the PM2.5-AOD association was comparable to research conducted elsewhere in the world [61]. During the spring and fall seasons, higher correlation coefficients between PM2.5 mass and AOD were seen, and they appeared to be caused by the transfer of Asian dust (desert crustal material) particles from outside the region [62]. In a study to assess the relationship between simulated carbon monoxide (CO) and aerosol optical depth (AOD), it was discovered that over eastern and central Africa, at the transition between forest and savannah environments, there was a strong relationship between CO and aerosols from biomass burning [63]. Despite being spatially associated with the AOT field and one another, each trace gas field exhibits its unique characteristics [60]. The northeast of China has high NO2, SO2, HCHO, and AOT concentrations, and the spatial patterns exhibit strong spatial connections [64]. According to a study by [65], aerosol loading is positively connected with ozone concentrations in big cities like Shanghai, especially during the summer. [60] examined the relationship between AOT and trace gasses, it was discovered that NO2 was present over heavily populated and industrialized areas such as the German Ruhr, the Rotterdam-Antwerp region in the Netherlands and Belgium, and the Po Valley in Italy. Furthermore, because AOT was similarly high in Poland and the Mediterranean basin, the study concluded that there is a strong spatial association between AOT and NO. The concentrations of NO2, SO2, HCHO, and AOT are high in the northeast of China, and the spatial patterns exhibit strong spatial correlation [52,55,66].
3.4. Machine Learning for Predictive Analysis
This paper used four classifiers of supervised machine learning tools to predict the internal relationship between AOT and ten air pollutants. The evaluation of four classifiers revealed that the R2 values were from 0.94 to 0.96, which found a strong relationship (Figure 4). The Rational quadratic GPR (RMSE-0.0024, MAE-0.0015, R2-0.96), Matern 5/2 GPR (RMSE-0.0023, MAE-0.0015, R2-0.96), and Squared Exponential GPR (RMSE-0.0015, MAE-0.0015, R2-0.96) were found good prediction with the AOT (Figure 4)
Machine learning techniques are used to analyse data from AOT measurements to improve understanding of aerosols and their effects on climate and air quality [45,67]. For example, machine learning algorithms classify different types of aerosols based on their optical properties or to predict AOT values from other atmospheric data [68,69]. Along with air pollutant data [70], different meteorological data such as temperature, relative humidity, wind speed, and wind direction have influential contributions to AOT in the State of Nuevo León, in Northeast Mexico. The overall R2 values were from 0.68-0.71, which is very close to the paper.
Satellite-based AOT measurement and its prediction are essential in local and regional planning. [71] used multi-sensor satellite data, meteorological information, and ground-based parameters to predict AOT in the eastern part of China and Japan using machine learning classifiers. The R2 value of their results (0.82 to 0.89) was similar to the values found in this study. This is perhaps due to the lower number of sample points that were used. Vegetation coverage was a suitable variable for predicting AOT because it controls dust, rainfall, and particulate matter [72]. However, they suggested that the sample points close to dusty areas are the key reasons for the difference between observed and predicted values of AOT in the ground. The seasonal variations of climate, environment, social, and development variables change the patterns of the AOT's concentrations. Deep machine learning is also a proven technique to predict the AOT using different sets of variables [73,74]. [74] found higher R2 values (0.77 to 0.89) in observed and predicted AOT when the model uses a three-fold cross-validation process, which was not followed in this paper. Satellite-derived AOT data matches and predicts climatic and environmental data [73]. However, this paper used only the air pollutant parameters with good evaluation performances.
4. Conclusions
The key objective of this paper was to understand the seasonal concentration of AOT and its relationship with ten air pollutants, which were analyzed and mapped using temporal remote sensing, GIS, and machine learning tools. This study has opened a new decision-making window to protect current and future air pollution mitigation in Bangladesh. The seasonal variations of AOT have a significant role in air pollution in the study area. On the other hand, different air pollutants are also responsible for increasing AOT and its spatial concentration in Bangladesh. However, the critical summary of the paper can be described as follows:
- The mean concentrations were higher in CO (82.11), PM2.5 (65.29), NO (56.15), and O3 (23.28).
- The most AOT concentrated areas were found in the central, western, and southern parts of Dhaka, Narayanganj, and Munshiganj districts.
- The concentrations of AOT were higher in December-January-February (.50) and March-April-May (0.50), while it was a bit less in June-July-August (0.33) and September-October-November (0.37).
- The AOT was correlated positively with PM2.5 (0.60), CH4 (0.80), NO (0.76), and BC (0.83), while correlated negatively with CO (-0.66), HCHO (-0.16), SO2 (-0.41), APR (-0.48), and NOx (-0.20).
- In machine learning, the Rational quadratic GPR (RMSE-0.0024, MAE-0.0015, R2-0.96%), Matern 5/2 GPR (RMSE-0.0023, MAE-0.0015, R2-0.96%), and Squared Exponential GPR (RMSE-0.0015, MAE-0.0015, R2-0.96%) were found good prediction with the AOT.
Along with these factors, more environmental, climatic, development, social, and high-resolution air pollutants data are suggested to make such analysis for deeper understanding. The paper’s results may be used by UN agencies, government line departments, and local and regional councils for air pollution mitigation and long-term protective measures. The methodology used in the paper may be used in similar global geographical settings.
Author Contributions
Conceptualization, S.H; methodology, S.H; software; S.H; writing—original draft preparation; M.A.H.B.; review and editing, supervision; R.F.L.G; M.T.R; review and editing. All authors have read and agreed to the published version of the manuscript.
Funding
This research received no external funding.
Institutional Review Board Statement
Not applicable.
Informed Consent Statement
Not applicable.
Data Availability Statement
All data generated or analyzed during the current study are presented in this article. However, the raw data will be also accessible from the corresponding author.
Acknowledgments
The authors also deeply acknowledge NASA and ESA for their freely available datasets.
Conflicts of Interest
The authors declare no conflict of interest.
References
- Shen, Y.; Zhang, L.; Fang, X.; Zhao, Z.; Li, X.; Wang, J.; Chai, Q. Long-Term Analysis of Aerosol Optical Depth over the Huaihai Economic Region (HER): Possible Causes and Implications. Atmosphere (Basel). 2018, 9, 1–20. [Google Scholar] [CrossRef]
- Bhattarai, B. C.; Burkhart, J. F.; Stordal, F.; Xu, C. Y. Aerosol Optical Depth over the Nepalese Cryosphere Derived from an Empirical Model. Front. Earth Sci. 2019, 7, 1–17. [Google Scholar] [CrossRef]
- Plakhina, I. N.; Pankratova, N. V. Temporal Variability of Atmospheric Aerosol Optical Depth over European Territory of Russia According to Data of the Ground-Based and Satellite Observations: Tendency of Aerosol “Enlightenment”. IOP Conf. Ser. Earth Environ. Sci. 2019, 231. [Google Scholar] [CrossRef]
- Nakata, M.; Ohshima, T.; Fujito, T.; Sano, I.; Mukai, S. Relationship between Aerosol Characteristics and Altitude Based on Multi-Measurements and Model Simulations. Remote Sens. Atmos. Clouds III 2010, 7859, 78590D. [Google Scholar] [CrossRef]
- Just, A. C.; De Carli, M. M.; Shtein, A.; Dorman, M.; Lyapustin, A.; Kloog, I. Correcting Measurement Error in Satellite Aerosol Optical Depth with Machine Learning for Modeling PM2.5 in the Northeastern USA. Remote Sens. 2018, 10. [Google Scholar] [CrossRef] [PubMed]
- Tang, Y.; Xu, R.; Xie, M.; Wang, Y.; Li, J.; Zhou, Y. Spatiotemporal Evolution and Prediction of AOT in Coal Resource Cities: A Case Study of Shanxi Province, China. Sustain. 2022, 14. [Google Scholar] [CrossRef]
- Li, L.; Che, H.; Derimian, Y.; Dubovik, O.; Luan, Q.; Li, Q.; Huang, X.; Zhao, H.; Gui, K.; Zheng, Y.; An, L.; Sun, T.; Liang, Y. Climatology of Fine and Coarse Mode Aerosol Optical Thickness Over East and South Asia Derived From POLDER/PARASOL Satellite. J. Geophys. Res. Atmos. 2020, 125, 0–3. [Google Scholar] [CrossRef]
- Acharya, P.; Sreekesh, S. Seasonal Variability in Aerosol Optical Depth over India: A Spatio-Temporal Analysis Using the MODIS Aerosol Product. Int. J. Remote Sens. 2013, 34, 4832–4849. [Google Scholar] [CrossRef]
- Mamun, M. I. The Seasonal Variability of Aerosol Optical Depth over Bangladesh Based on Satellite Data and HYSPLIT Model. Am. J. Remote Sens. 2014, 2, 20. [Google Scholar] [CrossRef]
- Hasan, R.; Hiya, H. J.; Marzia, S. Atmospheric Content of Particulate Matter PM2.5 in Gazipur and Mymensingh City Corporation Area of Bangladesh. Int. J. Res. Environ. Sci. 2020, 6. [Google Scholar] [CrossRef]
- Tusher, T. R.; Ashraf, Z.; Akter, S. Health Effects of Brick Kiln Operations: A Study on Largest Brick Kiln Cluster in Bangladesh. South East Asia J. Public Heal. 2019, 8, 32–36. [Google Scholar] [CrossRef]
- Kayes, I.; Shahriar, S. A.; Hasan, K.; Akhter, M.; Kabir, M. M.; Salam, M. A. The Relationships between Meteorological Parameters and Air Pollutants in an Urban Environment. Glob. J. Environ. Sci. Manag. 2019, 5, 265–278. [Google Scholar] [CrossRef]
- Rana, M. M.; Khan, M. H. Trend Characteristics of Atmospheric Particulate Matters in Major Urban Areas of Bangladesh. Asian J. Atmos. Environ. 2020, 14, 47–61. [Google Scholar] [CrossRef]
- Hassan, M. M.; Juhász, L.; Southworth, J. Mapping Time-Space Brickfield Development Dynamics in Peri-Urban Area of Dhaka, Bangladesh Mohammad. Int. J. Geo-Information 2019, 8, 1–27. [Google Scholar] [CrossRef]
- Rahman, M. S.; Kumar, P.; Ullah, M.; Jolly, Y. N.; Akhter, S.; Kabir, J.; Begum, B. A.; Salam, A. Elemental Analysis in Surface Soil and Dust of Roadside Academic Institutions in Dhaka City, Bangladesh and Their Impact on Human Health. Environ. Chem. Ecotoxicol. 2021, 3, 197–208. [Google Scholar] [CrossRef]
- Nayeem, R. A. A.; Hossain, M. S.; Majumder, A. K. PM2.5 Concentration and Meteorological Characteristics in Dhaka, Bangladesh. Bangladesh J. Sci. Ind. Res. 2020, 55, 89–98. [Google Scholar] [CrossRef]
- Rahman, M. M.; Mahamud, S.; Thurston, G. D. Recent Spatial Gradients and Time Trends in Dhaka, Bangladesh Air Pollution and Their Human Health Implications. J. Air Waste Manage. Assoc. 2019, 69, 478–501. [Google Scholar] [CrossRef]
- Dey, S.; Tripathi, S. N.; Singh, R. P.; Holben, B. N. Influence of Dust Storms on the Aerosol Optical Properties over the Indo-Gangetic Basin. J. Geophys. Res. D Atmos. 2004, 109, 1–13. [Google Scholar] [CrossRef]
- Syafrijon; Marzuki; Emriadi; Pratama, R. Relationship between Modis-Based Aerosol Optical Depth and Pm10 over Sumatra to Overcome the Limitations of Air Quality Monitoring Data Availability. Orient. J. Chem. 2018, 34, 2163–2169. [Google Scholar] [CrossRef]
- BBS. Population and Housing Cencus-2011. http://www.bbs.gov.bd/site/page/2888a55d-d686-4736-bad0-54b70462afda/District-Statistics (accessed 2022-04-20).
- BBS. Population and Housing Census-2011; Dhaka, 2015. http://203.112.218.65:8008/WebTestApplication/userfiles/Image/PopCenZilz2011/Zila_Dhaka.pdf.
- Imran, H. M.; Hossain, A.; Islam, A. K. M. S.; Rahman, A.; Bhuiyan, M. A. E.; Paul, S.; Alam, A. Impact of Land Cover Changes on Land Surface Temperature and Human Thermal Comfort in Dhaka City of Bangladesh. Earth Syst. Environ. 2021, 5, 667–693. [Google Scholar] [CrossRef]
- Rana, M. M.; Sulaiman, N.; Sivertsen, B.; Khan, M. F.; Nasreen, S. Trends in Atmospheric Particulate Matter in Dhaka, Bangladesh, and the Vicinity. Environ. Sci. Pollut. Res. 2016, 23, 17393–17403. [Google Scholar] [CrossRef] [PubMed]
- Islam, N.; Toha, T. R.; Islam, M. M.; Ahmed, T. The Association between Particulate Matter Concentration and Meteorological Parameters in Dhaka, Bangladesh. Meteorol. Atmos. Phys. 2022, 134, 1–13. [Google Scholar] [CrossRef]
- Razib; Nayeem, A. A.; Hossain, M. S.; Majumder, A. K. PM2.5 Concentration and Meteorological Characteristics in Dhaka, Bangladesh. Bangladesh J. Sci. Ind. Res. 2020, 55, 89–98. [Google Scholar] [CrossRef]
- Hoque, M. M.; Begum, B. A.; Shawan, A. M.; Ahmed, S. J. Particulate Matter Concentrations in the Air of Dhaka and Gazipur City During Winter : A Comparative Study. In P-ID 93 International Conference on Physics Sustainable Development & Technology (ICPSDT-2015); 2015; pp 140–149.
- Maduekwe, E.; de Vries, W. T. Random Spatial and Systematic Random Sampling Approach to Development Survey Data: Evidence from Field Application in Malawi. Sustainability 2019, 11. [Google Scholar] [CrossRef]
- Howell, C. R.; Su, W.; Nassel, A. F.; Agne, A. A.; Cherrington, A. L. Area Based Stratified Random Sampling Using Geospatial Technology in a Community-Based Survey. BMC Public Health 2020, 20, 1–9. [Google Scholar] [CrossRef]
- Lin, Y.; Kuwayama, D. P. Using Satellite Imagery and GPS Technology to Create Random Sampling Frames in High Risk Environments. Int. J. Surg. 2016, 32, 123–128. [Google Scholar] [CrossRef]
- Hassan, S.; Bhuiyan, M. A. H. Probable Nexus between Methane and Air Pollution in Bangladesh Using Machine Learning and Geographically Weighted Regression Modeling. J. Hyperspectral Remote Sens. 2021, 11, 136–145. [Google Scholar] [CrossRef]
- Adães, J.; Pires, J. C. M. Analysis and Modelling of PM2.5 Temporal and Spatial Behaviors in European Cities. Sustain. 2019, 11, 2–26. [Google Scholar] [CrossRef]
- Sarkar, S.; Chokngamwong, R.; Cervone, G.; Singh, R. P.; Kafatos, M. Variability of Aerosol Optical Depth and Aerosol Forcing over India. Adv. Sp. Res. 2006, 37, 2153–2159. [Google Scholar] [CrossRef]
- Dey, S.; Tripathi, S. N.; Singh, R. P.; Holben, B. N. Seasonal Variability of the Aerosol Parameters over Kanpur, an Urban Site in Indo-Gangetic Basin. Adv. Sp. Res. 2005, 36, 778–782. [Google Scholar] [CrossRef]
- Lin, C. A.; Chen, Y. C.; Liu, C. Y.; Chen, W. T.; Seinfeld, J. H.; Chou, C. C. K. Satellite-Derived Correlation of SO2, NO2, and Aerosol Optical Depth with Meteorological Conditions over East Asia from 2005 to 2015. Remote Sens. 2019, 11, 1–21. [Google Scholar] [CrossRef]
- Guo, J. P.; Zhang, X. Y.; Che, H. Z.; Gong, S. L.; An, X.; Cao, C. X.; Guang, J.; Zhang, H.; Wang, Y. Q.; Zhang, X. C.; Xue, M.; Li, X. W. Correlation between PM Concentrations and Aerosol Optical Depth in Eastern China. Atmos. Environ. 2009, 43, 5876–5886. [Google Scholar] [CrossRef]
- Nabavi, S. O.; Haimberger, L.; Abbasi, R.; Samimi, C. Prediction of Aerosol Optical Depth in West Asia Using Deterministic Models and Machine Learning Algorithms. Aeolian Res. 2018, 35, 69–84. [Google Scholar] [CrossRef]
- Gholizadeh, A.; Neshat, A. A.; Conti, G. O.; Ghaffari, H. R.; Aval, H. E.; Almodarresi, S. A.; Aval, M. Y.; Zuccarello, P.; Taghavi, M.; Mohammadi, A.; Ferrante, M.; Miri, M. PM2.5 Concentration Modeling and Mapping in the Urban Areas. Model. Earth Syst. Environ. 2019, 5, 897–906. [Google Scholar] [CrossRef]
- ESRI. How IDW works. https://desktop.arcgis.com/en/arcmap/10.3/tools/3d-analyst-toolbox/how-idw-works.htm.
- Habibi, R.; Alesheikh, A. A.; Mohammadinia, A.; Sharif, M. An Assessment of Spatial Pattern Characterization of Air Pollution: A Case Study of CO and PM2.5 in Tehran, Iran. ISPRS Int. J. Geo-Information 2017, 6. [Google Scholar] [CrossRef]
- Chen, F. W.; Liu, C. W. Estimation of the Spatial Rainfall Distribution Using Inverse Distance Weighting (IDW) in the Middle of Taiwan. Paddy Water Environ. 2012, 10, 209–222. [Google Scholar] [CrossRef]
- Huang, F.; Li, X.; Wang, C.; Xu, Q.; Wang, W.; Luo, Y.; Tao, L.; Gao, Q.; Guo, J.; Chen, S.; Cao, K.; Liu, L.; Gao, N.; Liu, X.; Yang, K.; Yan, A.; Guo, X. PM2.5 Spatiotemporal Variations and the Relationship with Meteorological Factors during 2013-2014 in Beijing, China. PLoS One 2015, 10, 1–17. [Google Scholar] [CrossRef] [PubMed]
- Hassan, M. S.; Bhuiyan, M. A. H.; Islam, T. Effects of PM2.5, Black Carbon and Ozone on Aerosol Optical Depth in Dhaka Division, Bangladesh Using Temporal Satellite Data. In EO WEEK 2021 VIRTUAL CONFERENCE -Supporting Climate and Environmental Sustainability through Earth Observation Science; RSPSoc- Remote Sensing and Photogrammetry Society: UK, 2021.
- Ma, J.; Yu, Z.; Qu, Y.; Xu, J.; Cao, Y. Application of the Xgboost Machine Learning Method in PM2.5 Prediction: A Case Study of Shanghai. Aerosol Air Qual. Res. 2020, 20, 128–138. [Google Scholar] [CrossRef]
- Deters, J. K.; Zalakeviciute, R.; Gonzalez, M.; Rybarczyk, Y. Modeling PM2.5 Urban Pollution Using Machine Learning and Selected Meteorological Parameters. 2017, 2017. [Google Scholar]
- Doreswamy; Harishkumar, K.S.; Km, Y.; Gad, I. Forecasting Air Pollution Particulate Matter (PM2.5) Using Machine Learning Regression Models. Procedia Comput. Sci. 2020, 171, 2057–2066. [Google Scholar] [CrossRef]
- Chen, C.; Ye, W.; Zuo, Y.; Zheng, C.; Ong, S. P. Graph Networks as a Universal Machine Learning Framework for Molecules and Crystals. Chem. Mater. 2019, 31, 3564–3572. [Google Scholar] [CrossRef]
- Mehta, M.; Singh, R.; Singh, A.; Singh, N.; Anshumali. Recent Global Aerosol Optical Depth Variations and Trends - A Comparative Study Using MODIS and MISR Level 3 Datasets. Remote Sens. Environ. 2016, 181, 137–150. [Google Scholar] [CrossRef]
- Zaman, S. U.; Pavel, M. R. S.; Joy, K. S.; Jeba, F.; Islam, M. S.; Paul, S.; Bari, M. A.; Salam, A. Spatial and Temporal Variation of Aerosol Optical Depths over Six Major Cities in Bangladesh. Atmos. Res. 2021, 262. [Google Scholar] [CrossRef]
- Begum, B. A.; Biswas, S. K.; Markwitz, A.; Hopke, P. K. Identification of Sources of Fine and Coarse Particulate Matter in Dhaka, Bangladesh. Aerosol Air Qual. Res. 2010, 10, 345–353. [Google Scholar] [CrossRef]
- Rawat, P.; Sarkar, S.; Jia, S.; Khillare, P. S.; Sharma, B. Regional Sulfate Drives Long-Term Rise in AOD over Megacity Kolkata, India. Atmos. Environ. 2019, 209, 167–181. [Google Scholar] [CrossRef]
- Singh, S.; Tiwari, S.; Hopke, P. K.; Zhou, C.; Turner, J. R.; Panicker, A. S.; Singh, P. K. Ambient Black Carbon Particulate Matter in the Coal Region of Dhanbad, India. Sci. Total Environ. 2018, 615, 955–963. [Google Scholar] [CrossRef] [PubMed]
- Tegen, I.; Hollrig, P.; Chin, M.; Fung, I.; Jacob, D.; Penner, J. Contribution of Different Aerosol Species to the Global Aerosol Extinction Optical Thickness: Estimates from Model Results. J. Geophys. Res. Atmos. 1997, 102, 23895–23915. [Google Scholar] [CrossRef]
- Le, T. H.; Thanh Nguyen, T. N.; Lasko, K.; Ilavajhala, S.; Vadrevu, K. P.; Justice, C. Vegetation Fires and Air Pollution in Vietnam. Environ. Pollut. 2014, 195, 267–275. [Google Scholar] [CrossRef]
- Falaiye, O. A.; Davidson, A. O. Single Scattering Albedo Derived from Aerosol Optical Thickness Measurement at Ilorin. Ilorin J. Sci. 2014, 1, 347–362. [Google Scholar] [CrossRef]
- Streets, D. G.; Yan, F.; Chin, M.; Diehl, T.; Mahowald, N.; Schultz, M.; Wild, M.; Wu, Y.; Yu, C. Anthropogenic and Natural Contributions to Regional Trends in Aerosol Optical Depth, 1980-2006. J. Geophys. Res. Atmos. 2009, 114, 1–16. [Google Scholar] [CrossRef]
- Holben, B. N.; Tanré, D.; Smirnov, A.; Eck, T. F.; Slutsker, I.; Abuhassan, N.; Newcomb, W. W.; Schafer, J. S.; Chatenet, B.; Lavenu, F.; Kaufman, Y. J.; Vande Castle, J.; Setzer, A.; Markham, B.; Clark, D.; Frouin, R.; Halthore, R.; Karneli, A.; O’Neill, N. T.; Pietras, C.; Pinker, R. T.; Voss, K.; Zibordi, G. An Emerging Ground-Based Aerosol Climatology: Aerosol Optical Depth from AERONET. J. Geophys. Res. Atmos. 2001, 106, 12067–12097. [Google Scholar] [CrossRef]
- Schaap, M.; Apituley, A.; Timmermans, R. M. A.; Koelemeijer, R. B. A.; De Leeuw, G. Atmospheric Chemistry and Physics Exploring the Relation between Aerosol Optical Depth and PM 2.5 at Cabauw, the Netherlands. Atmos. Chem. Phys 2009, 9, 909–925. [Google Scholar] [CrossRef]
- Shareful, H.; Bhuiyan, M. A. H. Probable Nexus between Methane and Air Pollution in Bangladesh Using Machine Learning and Geographically Weighted Regression Modeling. J. Hyperspectral Remote Sens. 2021, 11, 136. [Google Scholar] [CrossRef]
- Wang, J.; Christopher, S. A. Intercomparison between Satellite-Derived Aerosol Optical Thickness and PM2.5 Mass: Implications for Air Quality Studies. Geophys. Res. Lett. 2003, 30, 2–5. [Google Scholar] [CrossRef]
- Cholianawati, N.; Cahyono, W. E.; Indrawati, A.; Indrajad, A. Linear Regression Model for Predicting Daily PM2.5 Using VIIRS-SNPP and MODIS-Aqua AOT. IOP Conf. Ser. Earth Environ. Sci. 2019, 303. [Google Scholar] [CrossRef]
- Zeeshan, M.; Kim Oanh, N. T. Assessment of the Relationship between Satellite AOD and Ground PM10 Measurement Data Considering Synoptic Meteorological Patterns and Lidar Data. Sci. Total Environ. 2014, 473–474, 609–618. [Google Scholar] [CrossRef]
- Chen, B. B.; Sverdlik, L. G.; Imashev, S. A.; Solomon, P. A.; Lantz, J.; Schauer, J. J.; Shafer, M. M.; Artamonova, M. S.; Carmichael, G. Empirical Relationship between Particulate Matter and Aerosol Optical Depth over Northern Tien-Shan, Central Asia. Air Qual. Atmos. Heal. 2013, 6, 385–396. [Google Scholar] [CrossRef]
- Alvim, D. S.; Chiquetto, J. B.; D’amelio, M. T. S.; Khalid, B.; Herdies, D. L.; Pendharkar, J.; Corrêa, S. M.; Figueroa, S. N.; Frassoni, A.; Capistrano, V. B.; Boian, C.; Kubota, P. Y.; Nobre, P. Evaluating Carbon Monoxide and Aerosol Optical Depth Simulations from Cam-Chem Using Satellite Observations. Remote Sens. 2021, 13, 1–36. [Google Scholar] [CrossRef]
- Veefkind, J. P.; Boersma, K. F.; Wang, J.; Kurosu, T. P.; Krotkov, N.; Chance, K.; Levelt, P. F. Global Satellite Analysis of the Relation between Aerosols and Short-Lived Trace Gases; 2011; Vol. 11. [CrossRef]
- Liu, Q.; Liu, T.; Chen, Y.; Xu, J.; Gao, W.; Zhang, H.; Yao, Y. Effects of Aerosols on the Surface Ozone Generation via a Study of the Interaction of Ozone and Its Precursors during the Summer in Shanghai, China. Sci. Total Environ. 2019, 675, 235–246. [Google Scholar] [CrossRef] [PubMed]
- Qiu, Z.; Ali, M. A.; Nichol, J. E.; Bilal, M.; Tiwari, P.; Habtemicheal, B. A.; Almazroui, M.; Mondal, S. K.; Mazhar, U.; Wang, Y.; Sarker, S.; Mustafa, F.; Rahman, M. A. Spatiotemporal Investigations of Multi-Sensor Air Pollution Data over Bangladesh during COVID-19 Lockdown. Remote Sens. 2021, 13, 1–29. [Google Scholar] [CrossRef]
- Madhuri, M.; Samyama Gunjal, G. H.; Kamalapurkar, S. Air Pollution Prediction Using Machine Learning Supervised Learning Approach. Int. J. Sci. Technol. Res. 2020, 9, 118–123. [Google Scholar]
- Shahriar, S. A.; Kayes, I.; Hasan, K.; Salam, M. A.; Chowdhury, S. Applicability of Machine Learning in Modeling of Atmospheric Particle Pollution in Bangladesh. Air Qual. Atmos. Heal. 2020, 13, 1247–1256. [Google Scholar] [CrossRef] [PubMed]
- Deters, J. K.; Zalakeviciute, R.; Gonzalez, M.; Rybarczyk, Y. Modeling PM 2 . 5 Urban Pollution Using Machine Learning and Selected Meteorological Parameters. 2017, 2017. [Google Scholar]
- Carmona, J. M.; Gupta, P.; Lozano-García, D. F.; Vanoye, A. Y.; Hernández-Paniagua, I. Y.; Mendoza, A. Evaluation of Modis Aerosol Optical Depth and Surface Data Using an Ensemble Modeling Approach to Assess Pm2.5 Temporal and Spatial Distributions. Remote Sens. 2021, 13. [Google Scholar] [CrossRef]
- Kang, Y.; Kim, M.; Kang, E.; Cho, D.; Im, J. Improved Retrievals of Aerosol Optical Depth and Fine Mode Fraction from GOCI Geostationary Satellite Data Using Machine Learning over East Asia. ISPRS J. Photogramm. Remote Sens. 2022, 183, 253–268. [Google Scholar] [CrossRef]
- Nabavi, S. O.; Haimberger, L.; Abbasi, R.; Samimi, C. Prediction of Aerosol Optical Depth in West Asia Using Deterministic Models and Machine Learning Algorithms. Aeolian Res. 2018, 35, 69–84. [Google Scholar] [CrossRef]
- Lanzaco, B. L.; Olcese, L. E.; Palancar, G. G.; Toselli, B. M. An Improved Aerosol Optical Depth Map Based on Machine-Learning and Modis Data: Development and Application in South America. Aerosol Air Qual. Res. 2017, 17, 1523–1536. [Google Scholar] [CrossRef]
Figure 1.
Map of the study area, along with the topographic height and sample points of all parameters used in the paper.
Figure 1.
Map of the study area, along with the topographic height and sample points of all parameters used in the paper.
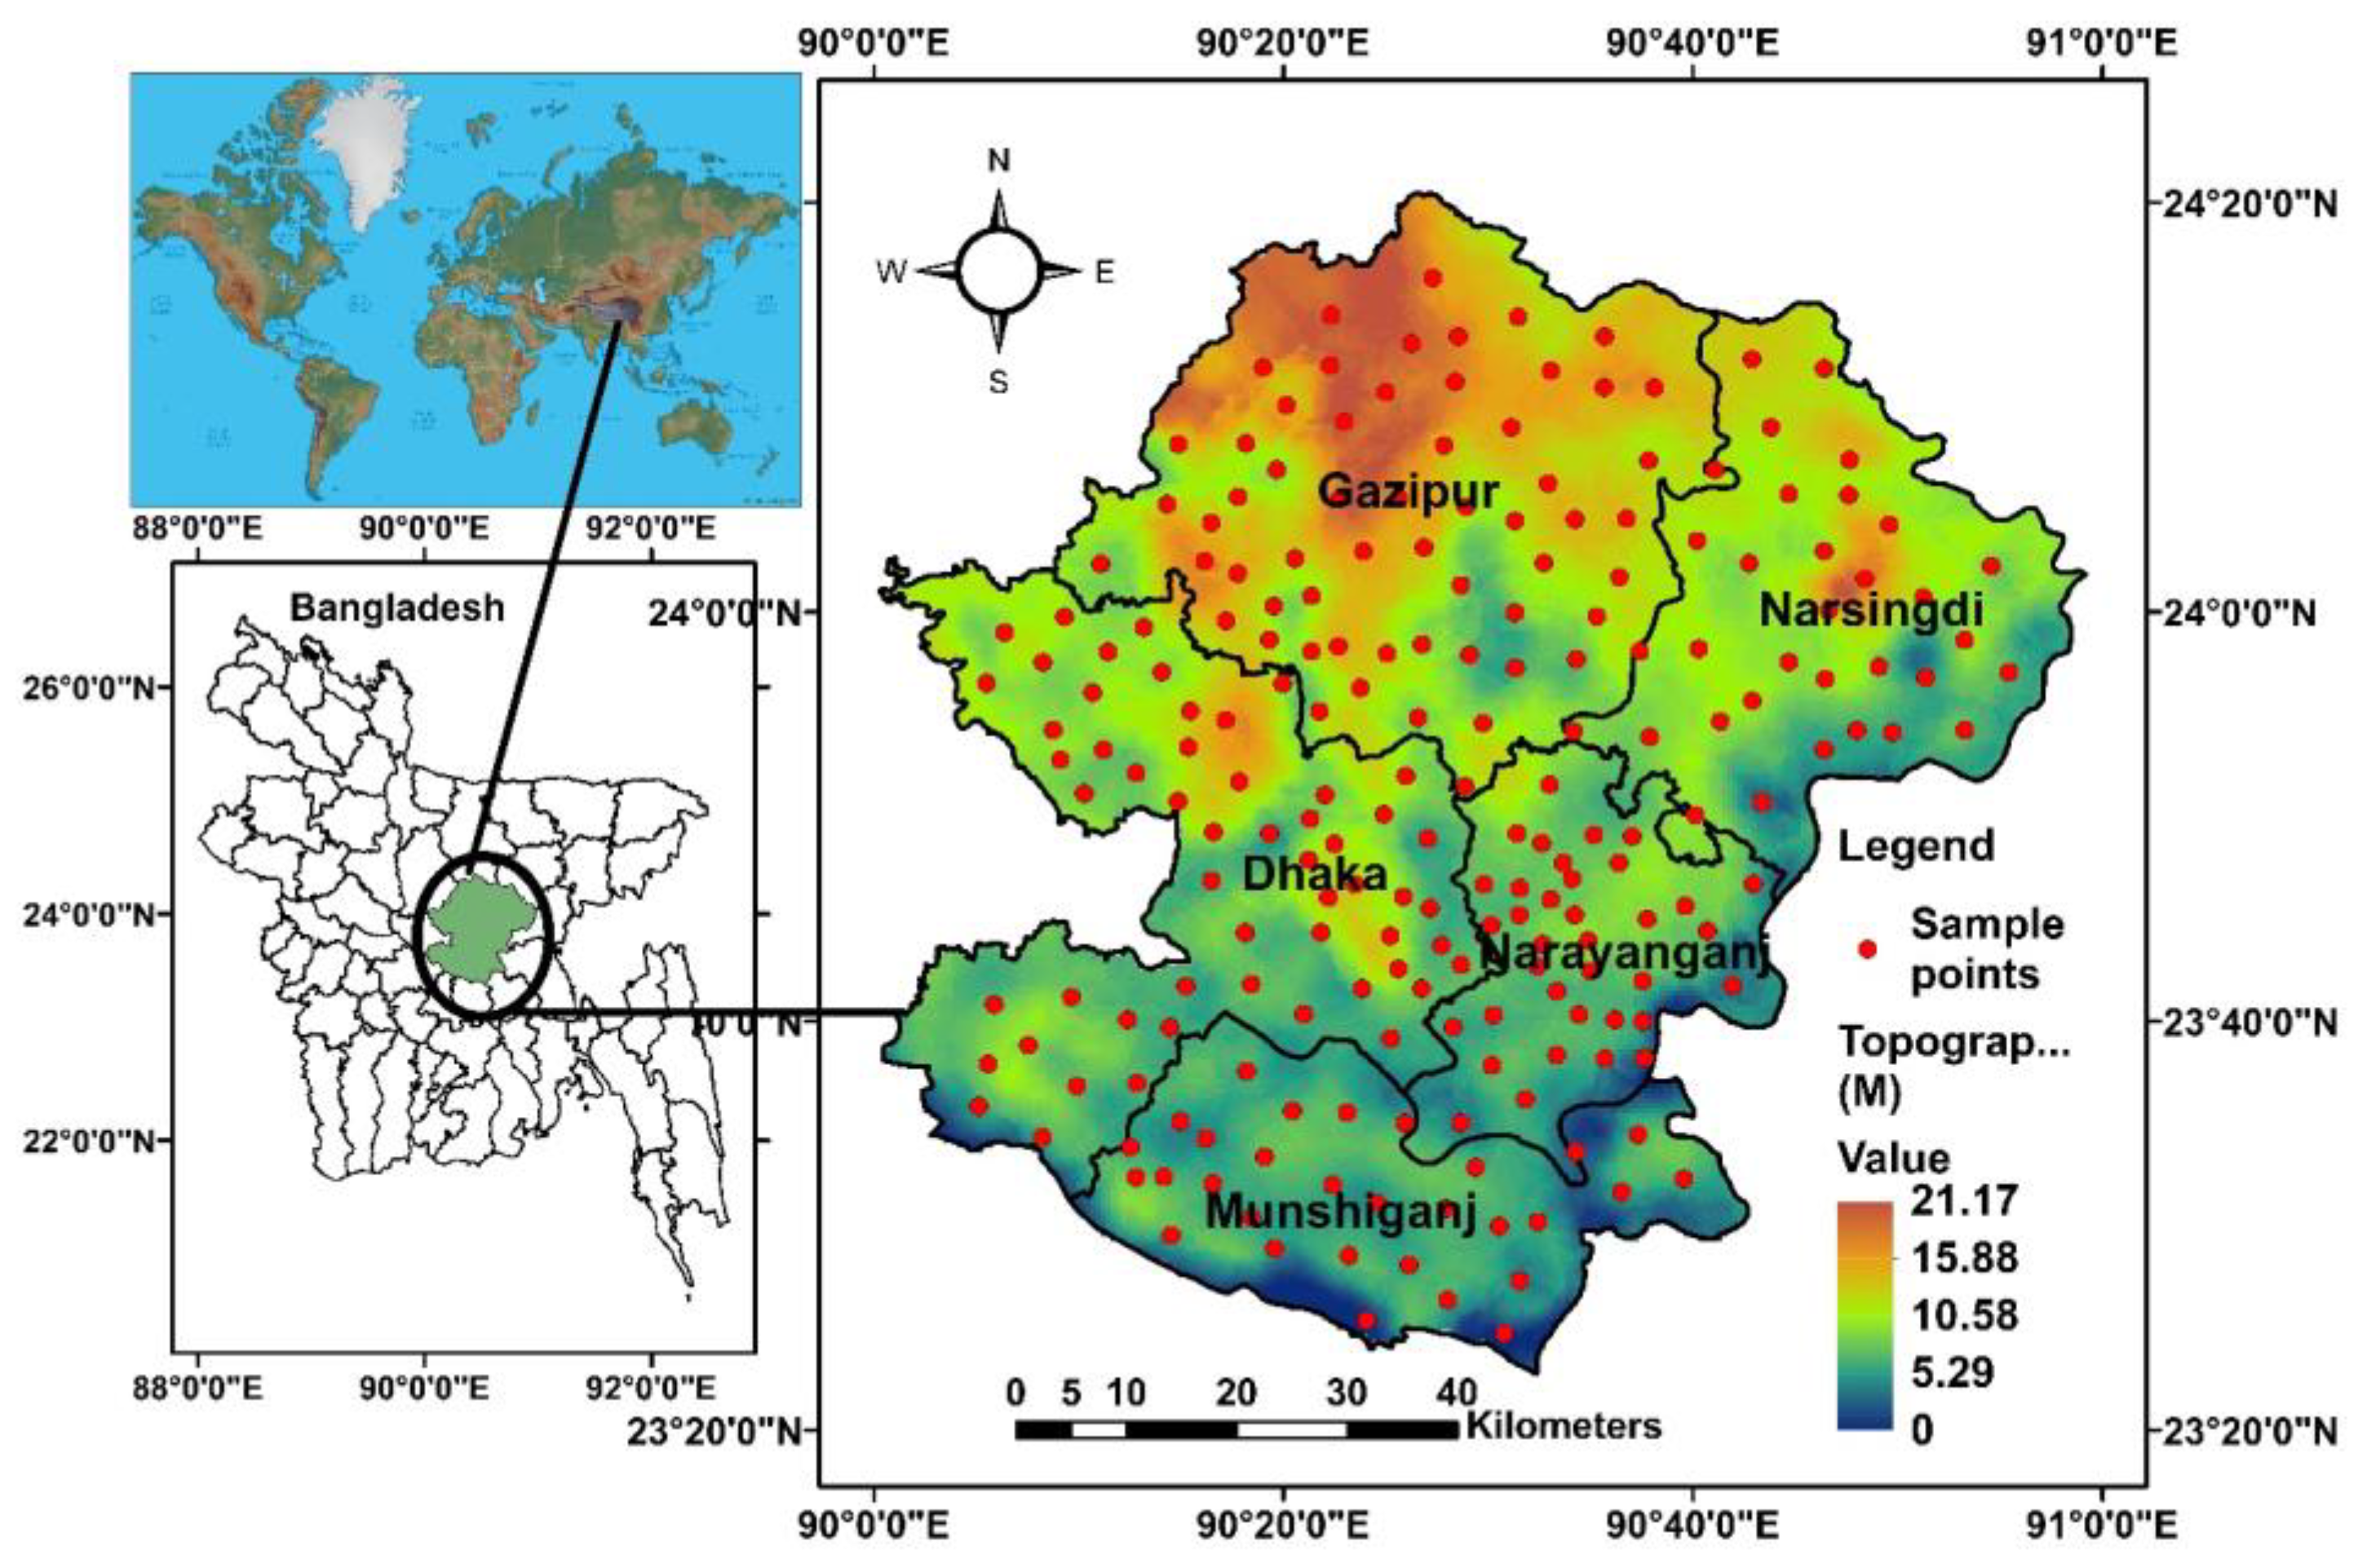
Figure 2.
The spatial and seasonal variations of AOT in the study area, showing (a) December-January-February, (b) March-April-May, (c) June-July-August, (d) September-October-November, and (e) graphical presentation of AOT pattern.
Figure 2.
The spatial and seasonal variations of AOT in the study area, showing (a) December-January-February, (b) March-April-May, (c) June-July-August, (d) September-October-November, and (e) graphical presentation of AOT pattern.
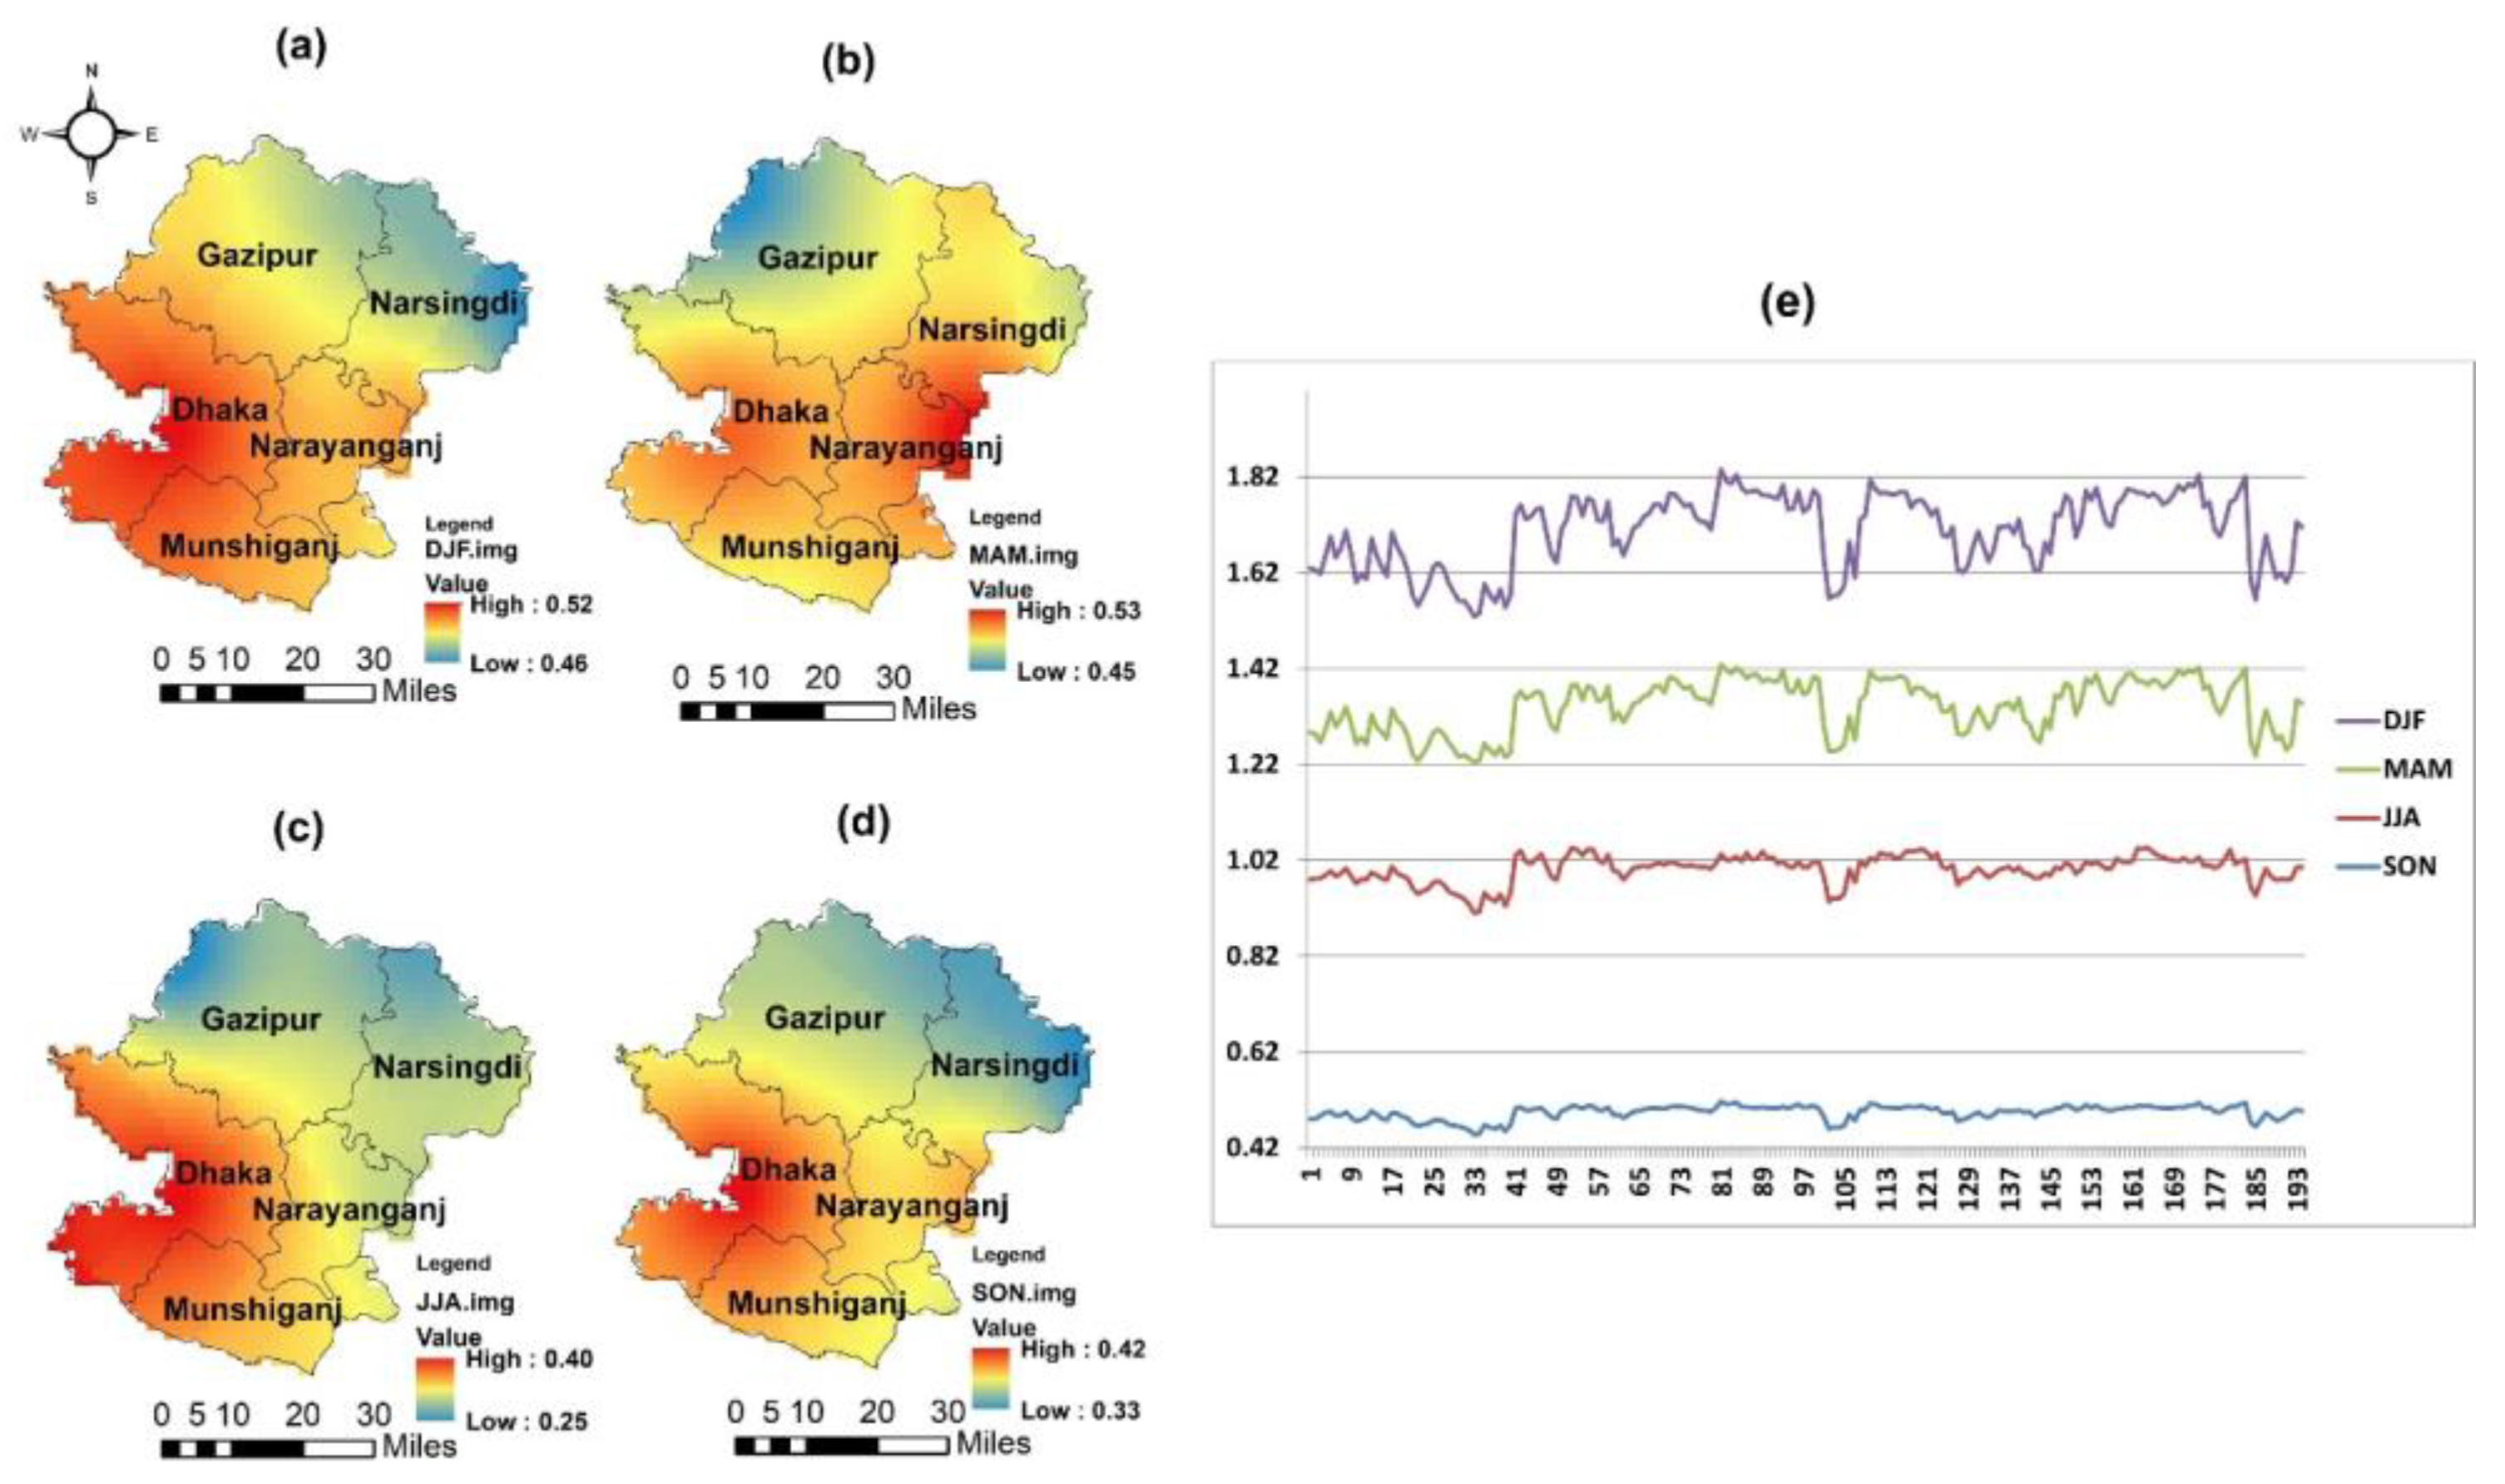
Figure 3.
The correlation between dependent (AOT) and independent factors (ten air pollutants).
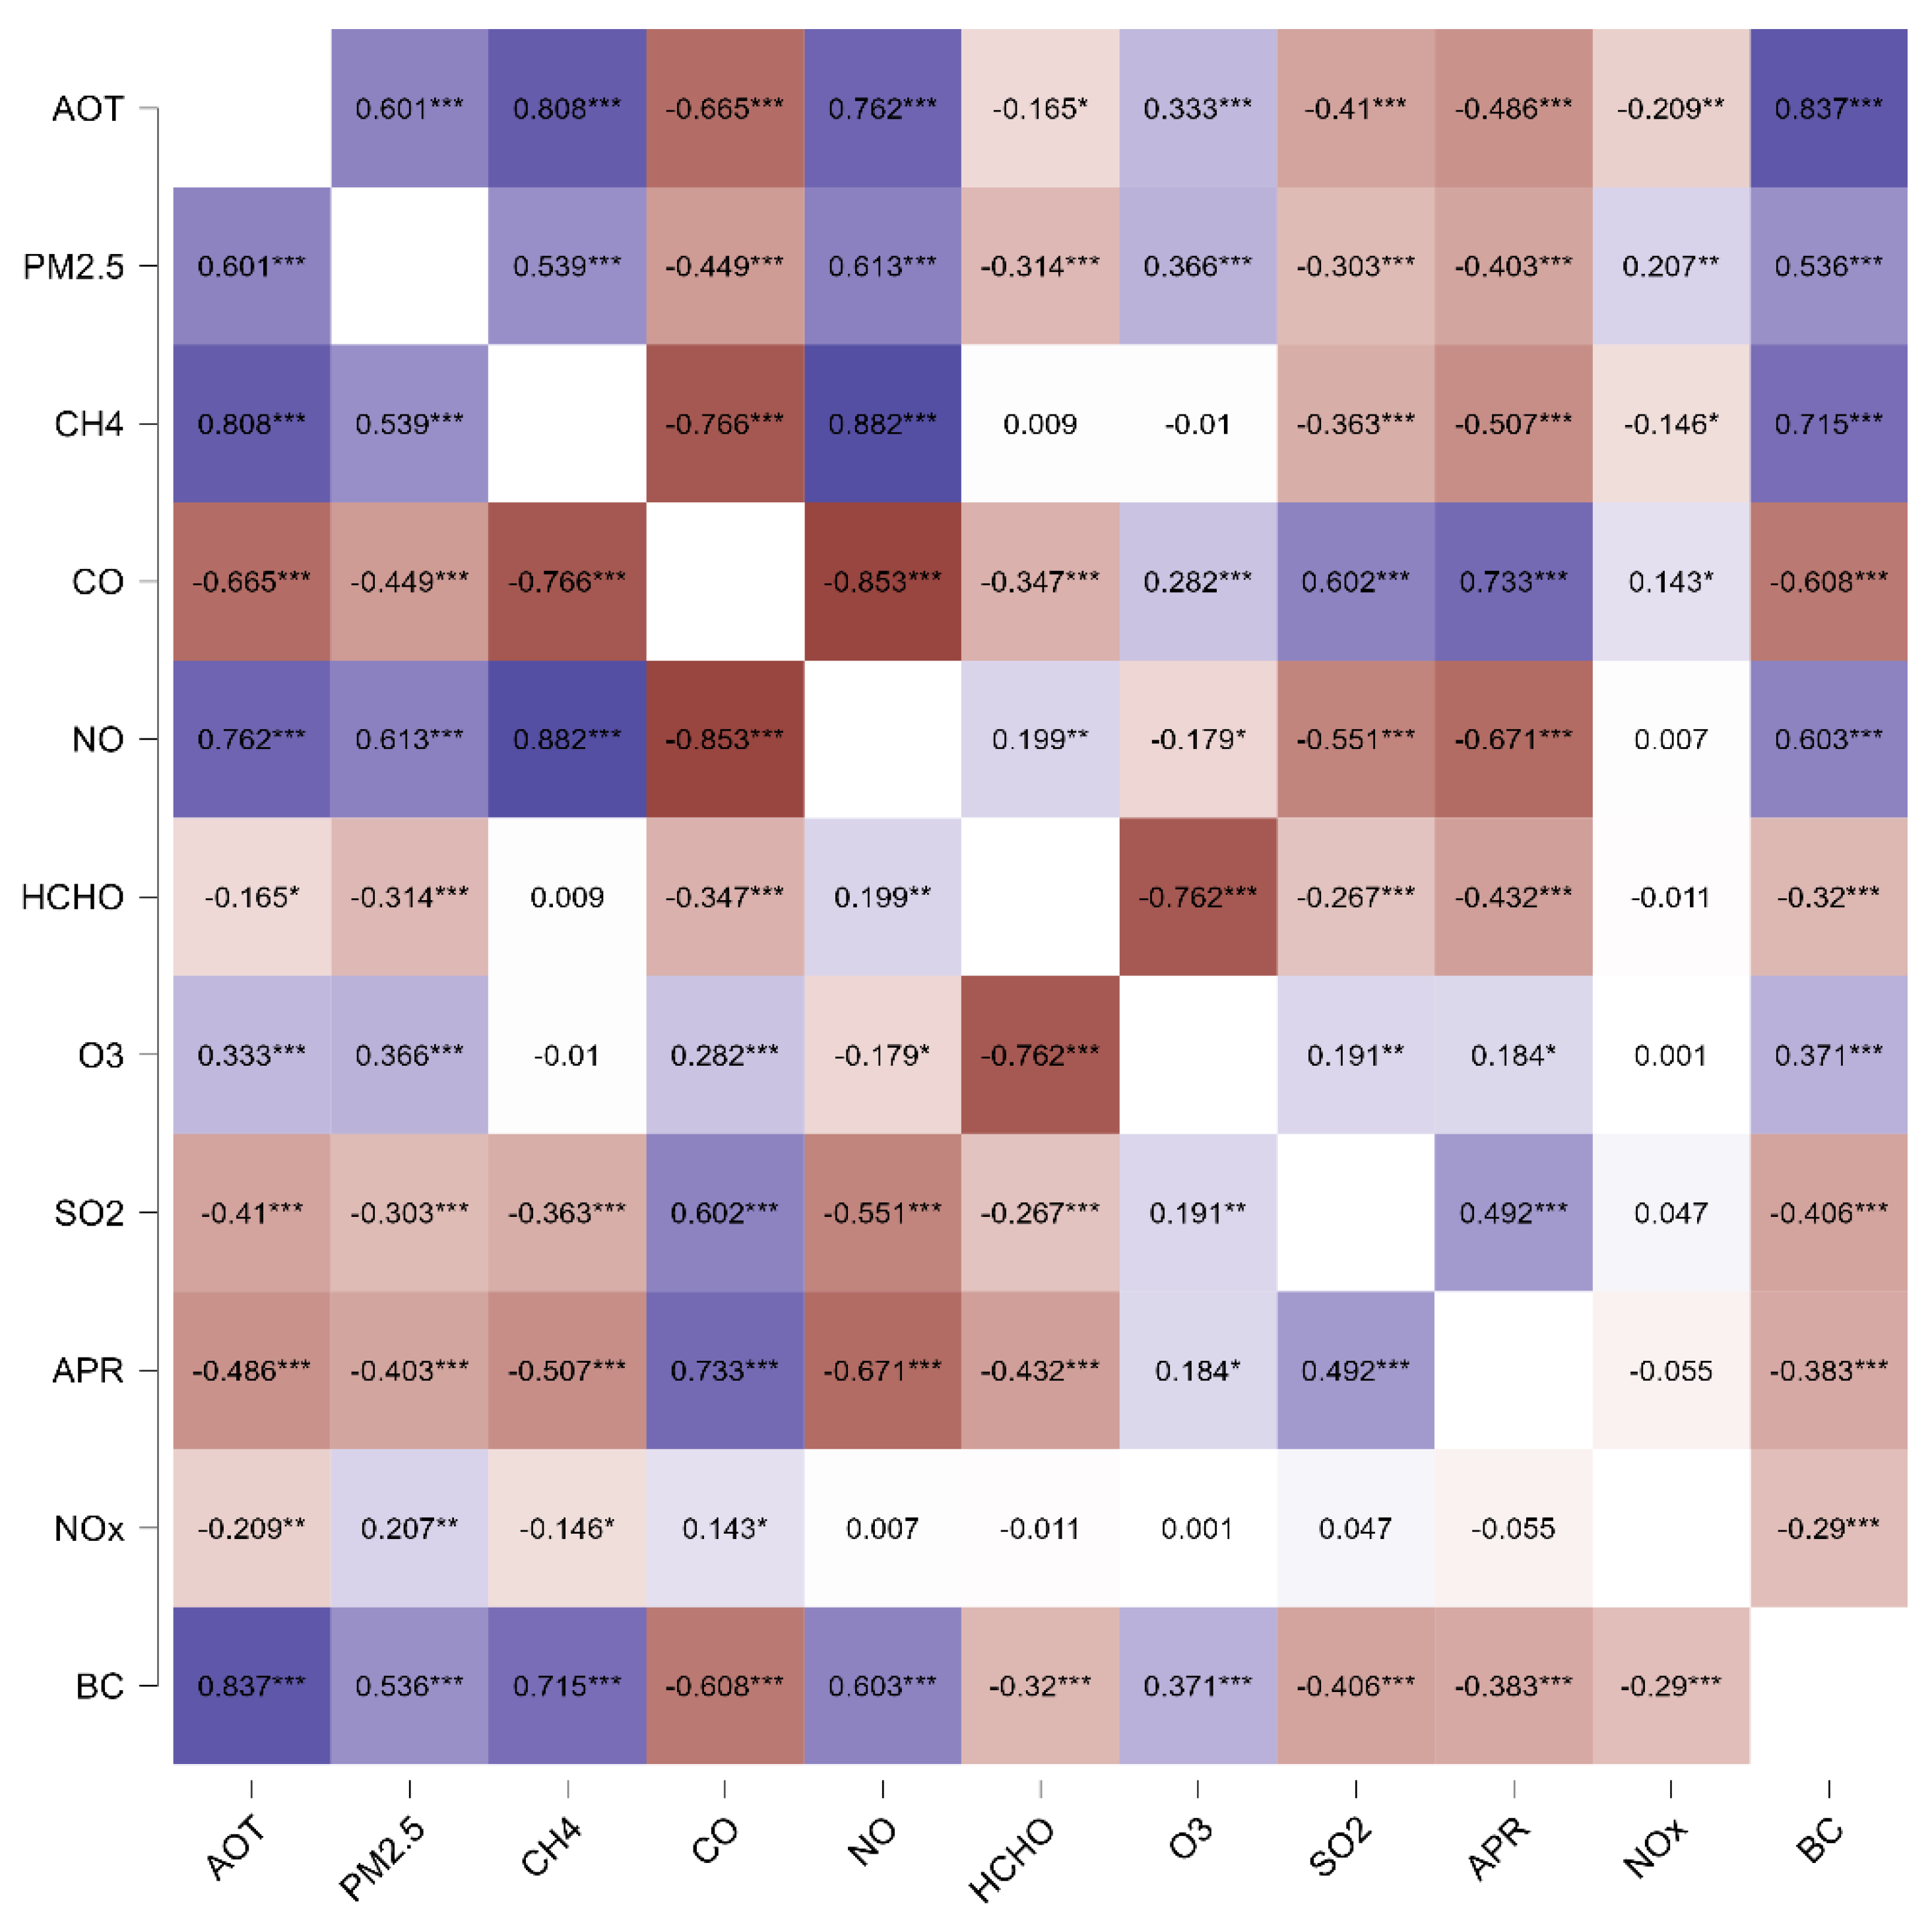
Figure 4.
Major machine learning results: (a) Rational quadratic GPR, (b) Exponential GPR, (c) Matern 5/2 GPR, (d) Squared Exponential GPR, and (e) evaluation performance table.
Figure 4.
Major machine learning results: (a) Rational quadratic GPR, (b) Exponential GPR, (c) Matern 5/2 GPR, (d) Squared Exponential GPR, and (e) evaluation performance table.
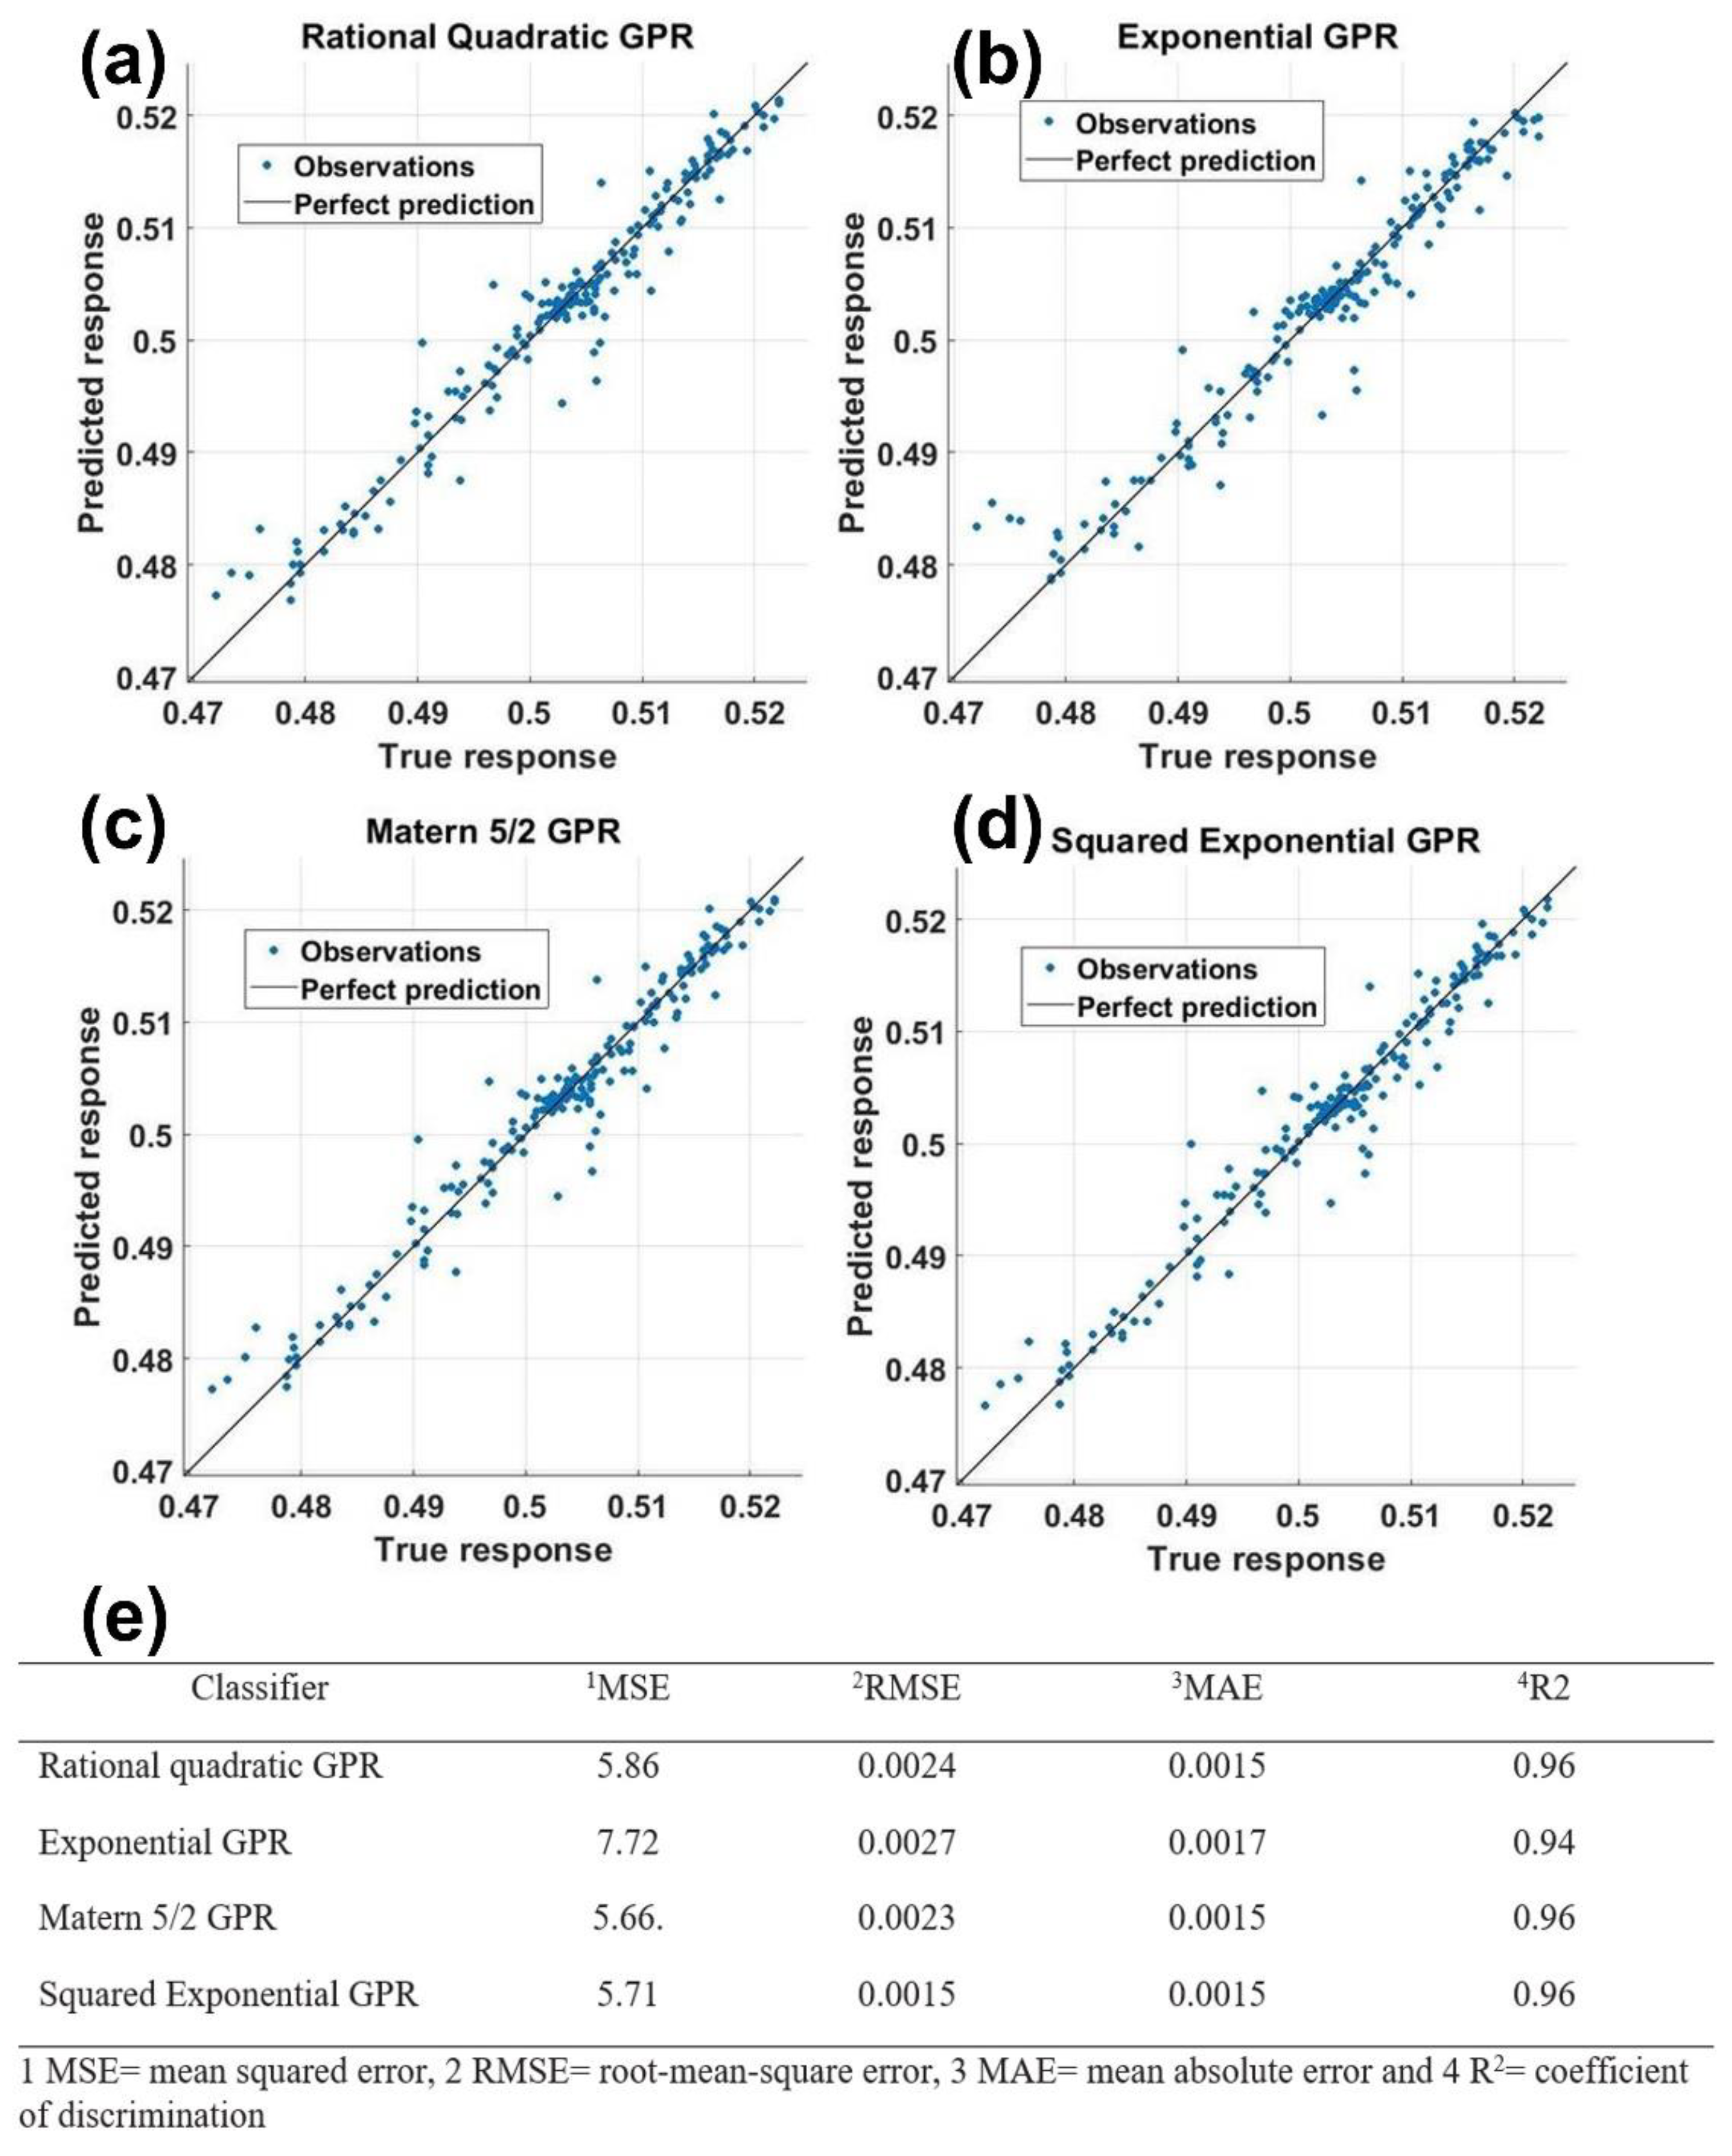

Table 1.
Name, sources, and characteristics of independent and dependent variables used in the paper.
Table 1.
Name, sources, and characteristics of independent and dependent variables used in the paper.
| Theme | Name | Unit | Resolution(deg) | Source | Collection Time |
|---|---|---|---|---|---|
| Independent Variables (Air pollutants) |
PM2.5 | mg m-3 | 0.01x0.01 | https://ads.atmosphere.copernicus.eu/ | Nov. 2022 |
| CH4 | ppb | 0.01x0.01 | https://ads.atmosphere.copernicus.eu/ | ||
| CO | mol m-2 | 0.01x0.01 | https://search.earthdata.nasa.gov/search | ||
| NO2 | mol m-2 | 0.01x0.01 | https://aura.gsfc.nasa.gov/ | ||
| HCHO | mol m-2 | 0.01x0.01 | https://ads.atmosphere.copernicus.eu/ | ||
| O3 | mol m-2 | 0.01x0.01 | https://ads.atmosphere.copernicus.eu/ | ||
| SO2 | mol m-2 | 0.01x0.01 | https://ads.atmosphere.copernicus.eu/ | ||
| ARP | % | 0.01x0.01 | https://neo.sci.gsfc.nasa.gov/ | ||
| NOx | kg m-3 | 0.01x0.01 | https://giovanni.gsfc.nasa.gov/giovanni/ | ||
| BC | kg m-3 | 0.01x0.01 | https://giovanni.gsfc.nasa.gov/giovanni/ | ||
| Dependent Variables | AOT | N/A | 0.01x0.01 | https://neo.sci.gsfc.nasa.gov/ | 2002-2022 |
Table 2.
Basic statistical parameters of all variables.
| Parameters | Mean | Std. Deviation | Minimum | Maximum |
|---|---|---|---|---|
| AOT | 0.503 | 0.011 | 0.472 | 0.522 |
| PM2.5 | 65.29 | 1.233 | 62.30 | 67.47 |
| CH4 | 6.331 | 0.034 | 6.240 | 6.382 |
| CO | 82.11 | 0.089 | 81.94 | 82.33 |
| NO | 56.15 | 12.49 | 28.58 | 74.26 |
| HCHO | 0.893 | 0.043 | 0.802 | 0.966 |
| O3 | 23.28 | 0.785 | 23.96 | 24.14 |
| SO2 | 1.026 | 0.385 | 0.467 | 1.855 |
| APR | 16.46 | 3.831 | 10.64 | 28.14 |
| NOx | 0.005 | 0.002 | 0.001 | 0.010 |
| BC | 0.673 | 0.020 | 0.638 | 0.694 |
Table 3.
Seasonal variations of AOT in the study area.
| Seasons | Min | Max | Mean | Std. Deviation |
|---|---|---|---|---|
| December-January-February | 0.46 | 0.52 | 0.50 | 0.01 |
| March-April-May | 0.45 | 0.53 | 0.50 | 0.01 |
| June-July-August | 0.25 | 0.40 | 0.33 | 0.03 |
| September-October-November | 0.33 | 0.42 | 0.37 | 0.02 |
Disclaimer/Publisher’s Note: The statements, opinions and data contained in all publications are solely those of the individual author(s) and contributor(s) and not of MDPI and/or the editor(s). MDPI and/or the editor(s) disclaim responsibility for any injury to people or property resulting from any ideas, methods, instructions or products referred to in the content. |
© 2023 by the authors. Licensee MDPI, Basel, Switzerland. This article is an open access article distributed under the terms and conditions of the Creative Commons Attribution (CC BY) license (http://creativecommons.org/licenses/by/4.0/).
Copyright: This open access article is published under a Creative Commons CC BY 4.0 license, which permit the free download, distribution, and reuse, provided that the author and preprint are cited in any reuse.


