Submitted:
13 March 2023
Posted:
14 March 2023
You are already at the latest version
Abstract
Respiratory tract epithelium infection plays a primary role in Nipah virus (NiV) pathogenesis and transmission. Knowledge about infection dynamics and host responses to NiV infection in respir-atory tract epithelia is scarce. Studies in non-differentiated primary respiratory tract cells or cell lines indicate insufficient interferon (IFN) responses. However, studies are lacking to determin-ing complex host response patterns in differentiated respiratory tract epithelia to understand NiV replication and spread in swine. Here we characterized infection and spread of NiV in differenti-ated primary porcine bronchial epithelial cells (PBEC) cultivated at the air-liquid-interface (ALI). After the initial infection of only a few apical cells, lateral spread for 12 days with epithelium disruption was observed without releasing substantial amounts of infectious virus from the api-cal or basal sides. Deep time course proteomics revealed pronounced upregulation of genes re-lated to type I/II- IFN, immunoproteasomal subunits, TAP-mediated peptide transport and MHC I antigen presentation. Spliceosomal factors were downregulated. We propose a model in which NiV replication in PBEC is slowed by a potent and broad type I/II-IFN host response with con-version from 26S proteasomes to immunoproteasomal antigen processing and improved MHC I presentation for adaptive immunity priming. NiV induced cytopathic effects could reflect the focal release of cell-associated NiV, which may contribute to efficient airborne viral spread between pigs.
Keywords:
Nipah virus
; air-liquid interface culture
; respiratory epithelium
; mass spectrometry
; immune response
1. Introduction
Bat-borne zoonotic Nipah virus (NiV) causes severe respiratory and neurological disease in pigs and humans [1-3]. Together with Hendra virus (HeV) it is eponymous for the genus henipavirus [4]. Since the first emergence in 1998 outbreaks in Bangladesh and India are happening on an almost yearly basis [5-8]. Genetic characterization of NiV revealed two distinct variants, NiV Malaysia and Bangladesh [9]. Efficient infection of the respiratory tract of pigs is considered causative for the high contagiosity in these hosts and their special role as intermediate hosts in transmission from the Pteropus bat reservoir to humans [10].
Primary human bronchial epithelial cells (HBEC) are susceptible to NiV infection and react with pro-inflammatory responses [11]. However, infection of fully differentiated HBEC cultivated at the air-liquid-interphase (ALI), as models for human airway epithelia, results in efficient virus replication and shedding, while only limited host responses are triggered. Accordingly, the trachea-bronchial tropism is considered a determinant of henipavirus contagiosity and efficient human-to-human transmission [12].
Inefficient type I interferon induction with simultaneous pro-inflammatory cytokine expression in NiV-infected, non-differentiated primary porcine bronchial epithelial cells (PBEC) may explain a high susceptibility of the swine respiratory tract to NiV infection [13]. The correlation of susceptibility and limited host responses is corroborated by similar observations in HBEC-ALI cultures [12]. In human and animal cell models, an unbalanced immune response following NiV infection has been postulated [14], which may affect antiviral responses and antigen presentation. In contrast, replication in ferret lungs induces type I interferons at early phases of infection, indicating that virus replication in the respiratory tract occurs in the context of a potent interferon response and that susceptibility of the respiratory tract tissues does not solely depend on the suppression of innate immune responses by the virus [15].
Henipaviral antagonists of innate immune responses are the phosphoprotein (P) as well as the P variants V, W, and C protein, the matrix protein (M) and the nucleoprotein (N) (reviewed in [14]). For example, main targets are the STAT-1/2 heterodimer [16,17,18], recognition of pathogen- associated molecular patterns (PAMP) [19,20], or TRIM6-mediated activation of the IKKε dependent type I interferon induction and response [21].
Since the respiratory epithelium acts as a barrier of the respiratory tract to NiV entry and at the same time as a significant determinant of virus shedding and airborne transmission, we investigated the infection, spread and host protein dynamics of NiV in PBEC-ALI cultures. Despite of the high burden of viral respiratory infections on public health and the advantages ALI cultures offer concerning modeling in vivo-like lung tissue in vitro, few articles have been published where high-resolution mass spectrometry (MS)-based proteomics was applied to virus infected ALI cultures, most of them focusing on SARS-CoV-2 infections [22,23,24,25,26,27]. In the present study, we combined confocal-based imaging with quantitative MS-based proteomics to analyse the dynamics of NiV infection in a differentiated respiratory epithelium ALI model. Virus replication and host reaction patterns were monitored over 12 days. In the context of low or incomplete innate immune responses in porcine and primary cell culture models of other hosts [12,13] and contradictory observations in animal models [15], we hypothesise that host responses to NiV infection in PBEC ALI cultures differ with respect to activation of interferon responses and expression of immunomodulatory genes to those observed in other species or non-differentiated porcine respiratory tract epithelial cells.
Based on qRT-PCR analysis of selected host factors and label-free quantitative MS-based proteomics, we demonstrate regulation of multiple host pathways over the course of the infection. We show robust type I and II interferon responses and broad up-regulation of antigen processing and presentation pathways. The finding of strong cytopathic effects in the respiratory epithelium may translate into transmission of cell-associated virus by exhalation or coughing in vivo.
2. Materials and Methods
2.1. PBECs
PBECs were isolated from two distinct pigs with an age around 6 to 12 months. Isolation and cultivation were modified from previous descriptions for other species [28]. Briefly, the cells were prepared from the bronchial epithelium of porcine lungs and 5 x 10⁴ of the cells were transferred to 0.33 cm2 cell culture inserts with PneumaCult-Ex medium (STEMCELL Technologies) in the basal and apical compartment. When confluency was reached, the apical medium was removed and the cells were cultivated at the air-liquid interface for at least four weeks. For detailed description see Supplementary Material S1.
2.2. Infection of Differentiated PBEC-ALI Cultures
The cultures were washed with PBS three-times prior to infection with 2 x 10⁶ NiV infectious units/well. 350 µl inoculum or medium (mock) was added to the apical side. After 1 h, the inoculum was removed and the apical side was washed with PBS thrice. Finally, the medium in the basal compartment was replaced by fresh medium. Cells were incubated for the respective time periods, the medium in the basal compartment was exchanged every 2-3 days. Samples for titration of apically released virus were generated by adding 200 µl of PBS to the apical side and incubating the cells for 30 min at 37 °C and 5 % CO2. Infectious virus titers in the basal compartment were determined by titration of respective samples.
2.3. Virus
NiV (NiV Malaysia, GenBank accession no AF212302) was propagated and titrated on Vero76 cells (CCLV-RIE 0929, Collection of Cell Lines in Veterinary Medicine [CCLV], Friedrich-Loeffler-Institut, Germany) by plaque assay as described previously with slight modifications [29]. Work with live NiV was performed at the BSL4-facility of the Friedrich-Loeffler-Institut.
2.4. Reverse Transcription and Real-Time PCR
RNA extraction was performed with the RNeasy kit (Qiagen, Germany) following a DNAse I digest with the TURBO DNA-free Kit (Invitrogen, USA). Reverse transcription was performed with 500 ng of RNA using the RevertAid First Strand cDNA Synthesis Kit (Thermo Fisher, USA) and Oligo (dt)18 primer. Real-time PCR was carried out with 0.7 µl cDNA product according to the protocol for the PowerUp SYBR Green Master Mix (Thermo Fisher, USA), with standard cycling mode (primer Tm ≥ 60°C). For gene specific primers see Supplementary Material S2. Ct values were normalized to α-tubulin expression (ΔCT). For relative quantification of NiV N mRNA in PBEC-ALI, the ΔCt value was subtracted from the mock control (ΔCt mock – ΔCt)
2.5. Immunofluorescence and Microscopy
PBECs were fixed for 24 h with 4 % paraformaldehyde (PFA) before transferring from the BSL-4 to the BSL-2 facility. After another 24 h fixation, the inserts were washed three times with PBS and stored in PBS + 0.02 % sodium azide at 4°C. For staining of complete membranes, samples were permeabilized with 0.2 % Triton X-100 in PBS and blocked with 10 % donkey serum/0.3 M glycine/PBST (PBST: 0.1 % Tween 20 in PBS). Primary antibodies were incubated for 2 h at room temperature (RT) in 1 % donkey serum/PBST following, three washing steps with PBS and secondary antibody incubation for 1 h at RT in 1 % donkey serum/PBST. For cross-sections, the membranes were removed from the cell culture inserts with a scalpel, paraffin-embedded, and cut into 5 µm microtome slices (HM 430 E, Thermo Scientific). After 15 min permeabilization with 0.2 % Triton X-100 in PBS (PBS TX100) and blocking with 5 % donkey serum in PBS TX100, primary antibodies were added for 1 h at RT in 1 % donkey serum/ PBS TX100. After three washing steps, secondary antibodies were added for 1 h at RT in 1 % donkey serum/PBST. Nuclei were stained with Hoechst 33342 (1:20.000 in PBS; Invitrogen, USA). For used antibodies see Supplementary Material S2. Images were acquired with a Leica THUNDER imager DMi8 with a 10×/0.32 HC PL FLUOTAR or 20×/0.40 dry HC PL FLUOTAR L objectives and LAS X (v3.7.423463) software, and with a Leica DMI6000 TCS SP5 (Leica microsystems, Germany) confocal laser scanning microscope with a 63 x/1.40 oil immersion HCX PL APO objective and LAS AF (v2.7.3.9723) software. Images were processed with the Fiji 1.53c software [30]. Scanning electron microscopy (SEM). Cells were washed with 0.1 M sodium cacodylate buffer (pH 7.4) and prefixed with 2.5% glutaraldehyde (in 0.1 M sodium cacodylate buffer). Following three washing steps in the same buffer, the cells were post-fixed in 1% OsO4 (0.1 M sodium cacodylate buffer) for 2 h. After three additional washing steps, the cells were dehydrated in an ascending series of ethanol and dried under critical end point drying using a Leica EM CP300 (Leica Microsystem, Germany). For image acquisition, the samples were stuck to stubs, sputter-coated and analyzed using a SEM (Zeiss EVO LS10).
2.6. Preparation and Measurement of MS Samples
Preparation and measurement of MS samples. Protein extracts from TriFast peqGOLD samples were prepared according to the manufacturer’s instructions and processed as described in detail in Supplementary Material S1. Samples were analyzed on a TimsTOF Pro instrument (Bruker, Bremen, Germany). The mass spectrometry proteomics data have been deposited to the ProteomeXchange Consortium via the PRIDE [31] partner repository with the dataset identifier PXD032673 and 10.6019/PXD032673. A detailed description of data processing and analysis is also provided in Supplementary Material S1.
3. Results
3.1. PBEC-ALI Cultures
Differentiated PBECs were generated by cultivation at the air-liquid interphase. Four weeks after seeding in cell culture inserts, generation of 30- to 60 µm-thick differentiated epithelia was confirmed by the appearance of markers for apical tight junctions and cilia (ZO-1 and ß-tubulin; Figure 1A), basal and mucus-secreting cells (cytokeratin 5 and Mucin-5AC; Figure 1B), and adherens junctions (β-catenin, Figure 1C). The presence of ciliated and non-ciliated cells at the apical layer were visualized by scanning electron microscopy (SEM) (Figure 1D). Susceptibility of the PBEC-ALI cultures to NiV infection was tested by inoculation with 2 x 10⁶ plaque forming units/well and immunofluorescence analysis after 2 days post-infection (dpi). Detection of individual NiV infected cells (Figure 1E) indicated a rather inefficient infection of the PBEC-ALI culture.
3.2. Time Course of NiV Infection in PBEC-ALI Cultures
To monitor the NiV infection dynamics, the PBEC-ALI cultures were infected with 2 x 10⁶ NiV plaque forming units (pfu) per well. At 0, 1, 2, 5, 7, 9, and 12 dpi, cell culture inserts were analyzed by immunofluorescence (Figure 2A). Whereas NiV N was not detected at 0 and 1 dpi, NiV N positive spots became visible after 2 dpi. The infection spread further until 12 dpi. However, a complete infection of the culture was not observed during the 12 days incubation period. Overall, limited numbers of NiV-infected cells at early time points after infection indicated a low PBEC-ALI culture specific susceptibility from the apical side.
Low amounts of infectious NiV were released at the apical side of the PBEC-ALI cultures, as infectious titres in apical PBS washes remained at input virus levels determined directly after infection (0 dpi). Even less infectious virus was detected in the basal compartment, where virus titres of 44 to 180 pfu/ml were determined from day 5 on (Figure 2B).
In contrast to the limited virus release at the basal and apical sides, virus replication and spread in the PBEC-ALI cultures was demonstrated by increasing levels of virus RNA (Figure 2B). Together, these data indicated that most of the newly synthesized NiV remained cell associated.
3.3. Lateral NiV Spread and CPE
Cross-sections of NiV-infected PBEC-ALI cultures at 12 dpi revealed large infected areas with a strong cytopathic effect (CPE), disruption of the epithelium, and apical release of virus antigen-positive cell detritus (Figure 3A, top left). Despite the abundance of NiV N protein in infected areas and supernatant cell detritus, infected areas were separated from surrounding non-infected areas (Figure 3A, top right). Moreover, even in highly infected and disrupted areas, clusters of ciliated apical and basal cell layers (Figure 3A, arrow and arrowhead, respectively) were less infected compared to middle cell layers.
Nevertheless, infection of both ciliated and non-ciliated apical and basal cells at 2 dpi (Figure 3B, arrows) confirmed general susceptibility of these cell types for NiV infection. Lateral spread of the virus infection was observed for time points from 5 to 12 dpi in between the apical and basal cell layer. While increasing cell destruction and cell debris accumulation were observed for the intermediate cell layer, apical and basal cells in these hotspots were either not infected (Figure 3B, asterisks) or not destroyed by infection (Figure 3B, diamonds). Of note, areas with fragmented cell nuclei were framed by infected or non-infected ciliated apical cell layers and basal cells even at 9 and 12 dpi. These data indicated a mainly lateral cell-to-cell spread of the virus in the PBEC-ALI middle cell layers and that apical and basal cell layers exhibit less CPE.
The structural integrity of the apical and basal cell layers was demonstrated by immunostaining for cytokeratin 5, ZO-1, β-catenin, and Mucin-5AC at 12 dpi. A continuous cytokeratin 5 positive layer of infected and non-infected cells below a largely destroyed middle cell layer with condensed chromatin confirmed the integrity of the basal cell layer during NiV infection (Figure 4A). The integrity of the apical tight junctions was demonstrated by ZO-1 stain (Figure 4B). Intact adherens junctions in both apical and basal cell layers were indicated by the β-catenin stain (Figure 4C). Mucin-5AC was detected in apical parts of the epithelium (Figure 4D). Notably, and in contrast to non-infected PBEC-ALI (see Figure 1), beyond areas of strong CPE, ZO-1 appeared at double layered cell packages with tight-junctions at both sides (Figure 4C). Also, β-catenin revealed a double-cell layer organization with intact lateral adherens junctions and intact cell nuclei on top of accumulating cell detritus. For comparison, non-infected regions from the same 12 dpi samples were stained for cytokeratin 5 (Figure 4E) and ZO-1 (Figure 4F).
3.4. Upregulation of Type I Interferons and Inflammatory Cytokines
NiV induced cytokine expression was assessed at 0, 1, 2, 5, 7, 9, and 12 dpi by qRT-PCRs for interferon beta (IFN-β), interferon lambda (IFN-λ), interleukin 6 (IL-6), interleukin 8 (IL-8), oligoadenylatsynthetase (OAS-1), and IFN-stimulated gene 56 (ISG-56) (Figure 5). Whereas cytokine expression was low at early time points of infection (days 1 and 2), increased type I (IFN-β) and III interferon (IFN-λ) induction was observed starting at 5 dpi. In contrast to the interferon mRNAs, those of the interferon-stimulated genes OAS-1 and ISG-56 remained low. Notably, increased levels of IL-6 and IL-8 mRNAs at 0 dpi indicate upregulation of host responses directly after infection. Since these responses returned to basal levels at day 1, these either represented a direct response to the addition of NiV or indicated that the initial rise could be a short-term effect induced by the transport of the cultures to the BSL-4 facility.
3.5. NiV Protein Dynamics–Increasing Virus Protein Accumulation until 12 dpi
To monitor the virus protein levels and modulations of the host proteomes, protein samples from all time points were subjected to quantitative high-resolution MS based on label-free quantification (LFQ). Given the low initial number of infected cells at 1 dpi (Figure 2), levels of virus proteins at that time point remained closely to the level of input proteins detected at 0 dpi (Figure 6). Slightly increased NiV N and P levels at 2 dpi, together with an increasing number of unique N and P peptides (Figure 6B), indicated onset of NiV gene expression. Further increases in N, P, and L levels at 5 dpi together with detection of the envelope M, G and F proteins correlated with replication and spread of the virus observed by immunofluorescence microscopy and qRT-PCR detection (Figure 2). At late time points (9 and 12 dpi), all virus proteins including accessory V, W and C proteins were detected. Both replicates of the infection kinetics revealed a robust increase of structural virus protein levels over time. These data confirmed the time course of N expression by immunofluorescence (Figure 2) on the proteome level in a quantitative and reproducible manner.
3.6. Variation of the Host Cell Proteome During Infection
In both infection time course experiments, a total of 6345 host proteins were identified by MS and considered for further statistical analysis. The principal component analysis (PCA) of the quantitative data (Figure 7, left panel) indicated time-dependent clustering of samples. A dominant influence of the cell cultures from the different animals on the composition of the proteomes could be partially compensated by normalization of the quantitative data (Figure 7, right panel) resulting in a more time-dependent clustering of all samples.
In a first statistical evaluation of all time points, the expression kinetics of all identified proteins (virus and host) were subjected to a von Neumann test [32] to detect proteins showing a time dependent trend in their expression levels. Proteins with p-values < 0.05 in both replicates of the kinetic experiment were subjected to GO analysis with the gProfiler R-package. The resulting enriched GO terms (see Table S4) strongly suggested activation of the innate immune response (GO:0045087) and other pathways.
3.7. DEGs and GO Term Enrichment Analysis
For the identification of differentially expressed genes (DEG) and further statistical evaluating of the impact of NiV infection on the host proteome the early (1 dpi, 2 dpi) and late (9 dpi, 12 dpi) stages were selected for comparison. This selection was based on the clustering behavior of these samples in the PCA analysis (Figure 7), the fact that 5 dpi and 7 dpi represented a transition phase concerning the expression of viral proteins (Figure 6), and that qPCR analysis of the day 0 samples (Figure 5) suggested that these may be artificial.
Statistical testing (left or right-sided t-test, p-value < 0.05) of normalized data identified 730 upregulated and 123 downregulated genes (Table S1) at the late stage of infection when compared to the early stage of infection as DEG.
To get an overview of enriched GO and KEGG terms and their relation, enrichment analysis of DEG followed by network analysis of enriched terms was performed in Cytoscape (Figure 8, Tables S2 and S3). The analysis revealed the upregulation of multiple innate-immunity related pathways including type I and gamma interferon signaling and responses, antigen processing, MHC I protein complexes and protein processing (Figure 8A), indicating a broad upregulation of anti-viral and immune system activating factors. In contrast, downregulated pathways included metabolic and mRNA splicing processes (Figure 8B).
This result was confirmed by comparative GO term enrichment analysis of differentially regulated genes with gProfiler software. Overexpressed genes in the late phase were annotated mainly to innate immune response processes (GO:0006955, GO:0002218, GO:0002252, GO:0002253). In contrast, genes downregulated in the late phase were mainly involved in RNA splicing and mRNA processing (KEGG:03040, GO:0006397, GO:0008380, GO:0000398) (Table S5).
Cellular components (annotated in the GO:CC branch of the Gene Ontology) with increased expression included the proteasome complex (GO:0000502), MHC I peptide loading complex (GO:0042824), ER (GO:0005783) and mitochondria (GO:0005739).
Six GO/KEGG terms (Table 1) were selected for a more detailed analysis of the expression kinetics of the associated gene products. The relative expression levels of the proteins representing the respective GO terms were visualized in volcano plots in figures 9 to 11 together with ribosomal proteins as an unaffected control and NiV protein levels. For expression fold-change and p-values see table S6.
While unaffected components such as the ribosomal proteins (Figure 9A) showed no significant changes in expression levels, a clear impact of the infection phase on the expression levels was observed for others. For instance, 23 proteins of the spliceosome complex were downregulated, while only 2 were upregulated (Figure 9B).
3.8. Interferons and Antigen Pattern Recognition
Upregulation of 24 proteins, including interferon-induced GTP-binding protein Mx proteins (MX1, MX2), 2'-5'-oligoadenylate synthases (OAS2, OASL), signal transducers and activators of transcription (STAT1, STAT2), and interferon-induced protein with tetratricopeptide repeats 2 (IFIT2) revealed strong induction of type I IFN signaling and response (Figure 10A). Elevated expression levels were detected for 16 proteins involved in type II IFN-gamma signaling, including beta-2-microglobulin (B2M), protein tyrosine phosphatase non-receptor type 1 (PTPN1), and E3 ubiquitin-protein ligases (TRIM22, TRIM22). These data indicated broad upregulation of type I and II interferon-related signaling over the course of the NiV infection.
Accordingly, also 12 genes annotated within the pattern recognition signaling pathway (GO:0002221), including CD14, CTSS, MAP2K1, MAP2K3, NFKB2, RIPK1, and TLR3, were upregulated, whereas only the ubiquitin-conjugating factors UBE2D2 and UBE2V1 were decreased.
3.9. Antigen Processing and Presentation
Enrichment of proteins annotated with antigen processing and presentation of peptide antigen (GO:0048002), and proteasome complex (GO:0000502) also indicated potent upregulation of antigen processing and presentation upon virus infection (Figure 11). Of note, immunoproteasome subunit beta types PSMB8, PSMB9, and PSMB10, together with the PSME2 subunit of the immunoproteasome specific regulatory 11S cap structure, strongly indicated increased levels of immunoproteasomes with progressing virus infection. Concurrently decreased levels of PSMC1, PSMC3, PSMD4, and PSMD11, all part of the 19S regulatory subunit of constitutive proteasomes, further indicated conversion from conventional 26S proteasomes to immunoproteasomes.
Further, TAP-transporters (TAP1, TAP2), MHC I components B2M and HLAs, together with the ER chaperons Calreticulin (CALR) and Calnexin (CALN), and aminopeptidases ERAP1 and ERAP2 indicated upregulation of MHC I dependent antigen presentation with progressing infection. Of note, cathepsin S and V (CTSS, CTSV) levels also increased, indicating endosomal antigen processing and MHC I cross-presentation by the vacuolar pathway.
Overall, our data show that NiV infection in differentiated PBEC induce a robust immune response upon infection. We observed a strong interferon type I and II response together with upregulated antigen presentation.
4. Discussion
We analyzed the NiV infection and host reaction dynamics in differentiated primary PBEC-ALI cultures. By visualization of the infection course for 12 days after apical infection and correlation with quantitative high-resolution MS data, we provide insight into the dynamic and complex molecular virus-host interplay in an in vitro model for swine respiratory epithelia. In contrast to non-differentiated primary PBEC [13] and HBEC-ALI cultures [12], in the PBEC-ALI cultures the NiV infection progressed slowly, was limited to laterally expanding foci (Figure 3) and robustly induced multiple factors involved in type I and II interferon responses and other infection related pathways (Figure 9).
Previously described lack of efficient type I IFN response in NiV-infected HBEC-ALI cultures or in non-differentiated PBECs suggested a negligible role of type I IFN in NiV pathogenesis. Thus, low type I IFN levels was considered a prerequisite for efficient replication in respiratory epithelia and airborne virus spread [12,13]. However, our data show robust induction of anti-viral responses in fully differentiated PBEC-ALI with long term virus replication, virus spread, and strong CPE in the late phase of the infection. This is in line with interferon responses and subsequent expression of inflammation-related genes in henipavirus infected ferret lungs [15].
The low initial infection of PBEC-ALI cultures by NiV was not due to an immediate and broad type I interferon upregulation of host pathways identified in later phases, as IFN-β and IFN-λ mRNA levels increased later at 5 dpi (Figure 5). However, a rapid inhibitory response either directly by virus recognition or by ALI culture handling cannot be excluded, as mRNA levels of pro-inflammatory cytokines IL-6 and IL-8 were elevated directly after infection. Downregulation of both cytokines at 1 and 2 dpi and increased IFN-β, IFN-λ, IL-6, and IL-8 mRNA levels starting at 5 dpi correlated with the level of virus replication and protein expression (virus spread and RNA levels in Figure 2; NiV protein levels in Figure 6).
Although levels of viral proteins N, P, V, W, C and M, involved in virus recognition and host response escape (reviewed in [14]), increased at 5 dpi, they were not sufficient to negate type I and II interferon and related host responses. Continuous spread in the PBEC-ALI cultures revealed the capability of the virus to replicate in the context of the observed host response, including ISGs inhibitory to multiple RNA viruses [33], such as BST2, ADAR, IFIT2/3, ISG15, ISG20, MX1, MX2, OAS2, and OASL (Figure 9B).
Both, type I and II interferons induce immunoproteasomes [34,35]. Immunoproteasomes are rapidly induced by IFN-γ treatment in respiratory cells in vitro and murine gammaherpesvirus-68 (MHV-68) lung infection [36]. IFN-γ and NF-κB dependent immunoproteasome upregulation was also observed for an NS1-deficient influenza A virus variant [37]. Induction of immunoproteasomes in PBEC-ALI cultures by NiV infection, as indicated by the increased expression of the 20S/11S subunits PSMB8, PSMB 9, PSMB 10, PSME2 and downregulation of the 19S subunits PSMC1, PSMC2, PSMC3, PSMD4, and PSMD11 (Figure 11) most likely was interferon-driven. Concerted upregulation of immunoproteasomes, TAP1/2, MHC I subunits, related chaperones, endopeptidases ERAP1 and ERAP2, and lysosomal/endosomal cathepsins S and V proteases (Figure 11) pointed towards improved antigen processing and presentation of endogenous proteins.
Cathepsin S is expressed in antigen-presenting cells (APCs) and plays a critical role in the presentation of exogenous antigens by MHC II [38]. Since presence of APCs is excluded due to selection conditions for epithelial cells during PBEC preparation and culture [28] and lack of MHC II-related factors in the MS analysis, the cathepsins indicated increased protein degradation in endosomal compartments of epithelial cells. Indeed, cathepsin S is expressed in airway epithelial cells in an IFN-γ dependent manner [39,40] and higher cathepsin S levels might be a direct response to NiV related IFN-γ induction in the PBECs. Cathepsin S plays a vital role in the generation of TAP-independent cross-presentation [41]of MHC I in the vacuolar recycling pathway [42]. We demonstrate MHC I upregulation and hypothesize that NiV infection of bronchial epithelia leads to a potent MHC I presentation of TAP-dependent intracellular antigens and also contributes to the MHC I cross-presentation of lysosomal/endosomal NiV antigens in the absence of APCs [43].
Upregulation of components of the proteasome and peptide loading complex (PLC) after NiV infection have been described before. However, selective upregulation of TAP1 and PSMB9 without PSMB8 and PSMB10 in endothelial cells was considered imbalanced [44]. Whereas our findings on type I and II interferon responses (Figure 10) are in line with interferon induction in endothelial cells [45], differences in the level of immunoproteasome and MHC-I upregulation suggest different capacities of endothelial cells and PBEC-ALI cultures to upregulate MHC I antigen presentation after NiV infection.
Overall, the host response pattern in the PBEC-ALI cultures with type I and II interferon signaling and downstream immunoproteasomal-meditated MHC I antigen presentation suggests that infection of porcine bronchial epithelia not only leads to efficient NiV replication but also plays a crucial role in MHC I priming of adaptive immune responses to the virus. In the NiV infected pig, MHC I presentation may lead to both efficient CD8+ cytotoxic T cell (CTL) mediated elimination of infected cells and CTL-mediated immunopathogenesis in the lung. Notably, after aerosol infection of the African green monkey model, severe respiratory disease went along with changes in cytokine response and activated CD8+ T cell numbers, but not with apparent neutralizing antibody titers over an 8-10 days course of disease [46].
Downregulation of RNA processing and metabolic pathways (Table S5) could be due to a general increase in CPE (Figure 2) or direct inhibition of cellular gene expression by the virus. Host manipulation by HeV and NiV are often discussed in the context of nuclear accumulation of the matrix protein M [47-51]. For example, binding of M to the treacle protein results in silencing of rRNA biogenesis [52]. We did not observe an impact on rRNA biosynthesis, and thus could not confirm NiV M induced silencing of rRNA biogenesis. Homeostasis of most ribosomal proteins suggested constant levels of cellular protein synthesis over the 12 days infection period. Whether downregulation of spliceosome components (Figure 9) was related to host manipulatory M or other NiV protein functions, or whether it was an indirect outcome of antiviral responses and their effects on spliceosomal mRNA modification remains to be clarified.
Marginal release of infectious virus at the apical and basal sides was observed. However, both virus RNA and protein levels were elevated in the cell samples, strongly indicating that the bulk of newly produced NiV remained cell-associated. Cell-associated measles virus (MeV) in human ALI cultures was recently shown to infect monocyte-derived macrophages as a first stage of infection in a new host. Moreover, dislodged infected epithelial patches and expulsion through coughing and sneezing were discussed to contribute to the high contagiosity of MeV by increasing the virus survival time and delivery of high infectious doses to the next host [53]. In contrast to MeV-infected human ALI cultures, where apical, ciliated cell patches were infected without signs of cell death, we observed strong cytopathic effects in middle cell layers of the PBEC-ALI cultures. Together with the observed preservation of the apical cell layers as demonstrated by the integrity of cilia, tight-, and cell adherens junctions, this strongly suggests substantial differences in tropism and spread of MeV and NiV in differentiated ALI-cultures. However, we speculate that similar to the MeV model airborne NiV spread is supported by the expulsion of cell debris and that inhalation of such material increases the local infectious dose after inhalation by the next host. Indeed, the bigger the exhaled particles are, the higher is the chance to contain infectious virus [54].
Based on the upregulation of the innate immune response and subsequent antigen proliferation and presentation pathways we propose a model in which NiV infection and spread in differentiated PBECs is slowed by potent innate immune responses to the virus infection (Figure 12). In contrast to previous reports in non-differentiated PBEC or endothelial cells, by combining immunofluorescence, qRT-PCR and quantitative MS data, we here exclude limitations in interferon responses and incomplete immunoproteasome formation after NiV infection in fully differentiated PBEC. Altogether, our findings not only highlight the respiratory epithelium as a barrier to virus infections but also indicate its role as a prime site of adaptive immune induction through NiV-induced antigen processing and MHC I presentation.
Supplementary Materials
The following supporting information can be downloaded at the website of this paper posted on Preprints.org, Supplemetary Material S1: methods; Supplementary Material S2: primers and antibodies; List S1: MQ parameters; Table S1: Gene list used for enrichment analysis; Table S2: CytoScape_ClueGO Parameters & Results downregulated; Table S3: CytoScape_ClueGO Parameters & Results upregulated; Table S4: Enrichment analysis_gProfiler_Neumann; Table S5: Enrichment analysis_gProfiler; Table S6: Summary_DEGs.
Author Contributions
Conceptualization, S.F., M.M. and S.D.; methodology, L.Z., M.M., E.W., and C.P.; investigation, M.M., K.F., and S.D.; writing—original draft preparation, S.F., M.M. and E.W.; writing—review and editing, L.Z., M.K. A.K., S.D. and K.F.; visualization, M.M., E.W. and C.P.; supervision, S.F. and A.K.; All authors have read and agreed to the published version of the manuscript.
Funding
This work was funded by an intramural collaborative research grants on Henipaviruses at the Friedrich-Loeffler-Institute to S.F. and S.D. Partial support was obtained by the Federal Excellence Initiative of Mecklenburg Western Pomerania and European Social Fund (ESF) Grant KoInfekt (ESF/14-BM-A55-0002/16).
Institutional Review Board Statement
Not applicable.
Acknowledgments
We thank Andrea Aebischer and Sven Reiche for the generation of NiV P specific polyclonal serum, Gabriele Czerwinski for support in sample preparation and Angela Hillner and Carolin Rüdiger for technical assistance.
Conflicts of Interest
The authors declare no conflict of interest.
References
- Chua, K.B.; Goh, K.J.; Wong, K.T.; Kamarulzaman, A.; Tan, P.S.; Ksiazek, T.G.; Zaki, S.R.; Paul, G.; Lam, S.K.; Tan, C.T. Fatal encephalitis due to Nipah virus among pig-farmers in Malaysia. Lancet 1999, 354, 1257–1259. [Google Scholar] [CrossRef] [PubMed]
- Lee, K.E.; Umapathi, T.; Tan, C.B.; Tjia, H.T.; Chua, T.S.; Oh, H.M.; Fock, K.M.; Kurup, A.; Das, A.; Tan, A.K.; et al. The neurological manifestations of Nipah virus encephalitis, a novel paramyxovirus. Ann Neurol 1999, 46, 428–432. [Google Scholar] [CrossRef] [PubMed]
- Yob, J.M.; Field, H.; Rashdi, A.M.; Morrissy, C.; van der Heide, B.; Rota, P.; bin Adzhar, A.; White, J.; Daniels, P.; Jamaluddin, A.; et al. Nipah virus infection in bats (order Chiroptera) in peninsular Malaysia. Emerg Infect Dis 2001, 7, 439–441. [Google Scholar] [CrossRef]
- Wang, L.F.; Yu, M.; Hansson, E.; Pritchard, L.I.; Shiell, B.; Michalski, W.P.; Eaton, B.T. The exceptionally large genome of Hendra virus: support for creation of a new genus within the family Paramyxoviridae. J Virol 2000, 74, 9972–9979. [Google Scholar] [CrossRef] [PubMed]
- Chadha, M.S.; Comer, J.A.; Lowe, L.; Rota, P.A.; Rollin, P.E.; Bellini, W.J.; Ksiazek, T.G.; Mishra, A. Nipah virus-associated encephalitis outbreak, Siliguri, India. Emerg Infect Dis 2006, 12, 235–240. [Google Scholar] [CrossRef]
- Harit, A.K.; Ichhpujani, R.L.; Gupta, S.; Gill, K.S.; Lal, S.; Ganguly, N.K.; Agarwal, S.P. Nipah/Hendra virus outbreak in Siliguri, West Bengal, India in 2001. Indian J Med Res 2006, 123, 553–560. [Google Scholar]
- Hossain, M.J.; Gurley, E.S.; Montgomery, J.M.; Bell, M.; Carroll, D.S.; Hsu, V.P.; Formenty, P.; Croisier, A.; Bertherat, E.; Faiz, M.A.; et al. Clinical presentation of nipah virus infection in Bangladesh. Clin Infect Dis 2008, 46, 977–984. [Google Scholar] [CrossRef]
- Sharma, V.; Kaushik, S.; Kumar, R.; Yadav, J.P.; Kaushik, S. Emerging trends of Nipah virus: A review. Rev Med Virol 2019, 29, e2010. [Google Scholar] [CrossRef]
- Harcourt, B.H.; Lowe, L.; Tamin, A.; Liu, X.; Bankamp, B.; Bowden, N.; Rollin, P.E.; Comer, J.A.; Ksiazek, T.G.; Hossain, M.J.; et al. Genetic characterization of Nipah virus, Bangladesh, 2004. Emerg Infect Dis 2005, 11, 1594–1597. [Google Scholar] [CrossRef]
- Hooper, P.; Zaki, S.; Daniels, P.; Middleton, D. Comparative pathology of the diseases caused by Hendra and Nipah viruses. Microbes Infect 2001, 3, 315–322. [Google Scholar] [CrossRef]
- Escaffre, O.; Borisevich, V.; Carmical, J.R.; Prusak, D.; Prescott, J.; Feldmann, H.; Rockx, B. Henipavirus pathogenesis in human respiratory epithelial cells. J Virol 2013, 87, 3284–3294. [Google Scholar] [CrossRef] [PubMed]
- Escaffre, O.; Borisevich, V.; Vergara, L.A.; Wen, J.W.; Long, D.; Rockx, B. Characterization of Nipah virus infection in a model of human airway epithelial cells cultured at an air-liquid interface. J Gen Virol 2016, 97, 1077–1086. [Google Scholar] [CrossRef] [PubMed]
- Elvert, M.; Sauerhering, L.; Maisner, A. Cytokine Induction in Nipah Virus-Infected Primary Human and Porcine Bronchial Epithelial Cells. Journal of Infectious Diseases 2020, 221, S395–S400. [Google Scholar] [CrossRef] [PubMed]
- Pelissier, R.; Iampietro, M.; Horvat, B. Recent advances in the understanding of Nipah virus immunopathogenesis and anti-viral approaches. F1000Res 2019, 8. [Google Scholar] [CrossRef] [PubMed]
- Leon, A.J.; Borisevich, V.; Boroumand, N.; Seymour, R.; Nusbaum, R.; Escaffre, O.; Xu, L.; Kelvin, D.J.; Rockx, B. Host gene expression profiles in ferrets infected with genetically distinct henipavirus strains. PLoS Negl Trop Dis 2018, 12, e0006343. [Google Scholar] [CrossRef] [PubMed]
- Sugai, A.; Sato, H.; Takayama, I.; Yoneda, M.; Kai, C. Nipah and Hendra Virus Nucleoproteins Inhibit Nuclear Accumulation of Signal Transducer and Activator of Transcription 1 (STAT1) and STAT2 by Interfering with Their Complex Formation. J Virol 2017, 91. [Google Scholar] [CrossRef] [PubMed]
- Rodriguez, J.J.; Cruz, C.D.; Horvath, C.M. Identification of the nuclear export signal and STAT-binding domains of the Nipah virus V protein reveals mechanisms underlying interferon evasion. J Virol 2004, 78, 5358–5367. [Google Scholar] [CrossRef] [PubMed]
- Ciancanelli, M.J.; Volchkova, V.A.; Shaw, M.L.; Volchkov, V.E.; Basler, C.F. Nipah virus sequesters inactive STAT1 in the nucleus via a P gene-encoded mechanism. J Virol 2009, 83, 7828–7841. [Google Scholar] [CrossRef] [PubMed]
- Sanchez-Aparicio, M.T.; Feinman, L.J.; Garcia-Sastre, A.; Shaw, M.L. Paramyxovirus V Proteins Interact with the RIG-I/TRIM25 Regulatory Complex and Inhibit RIG-I Signaling. J Virol 2018, 92. [Google Scholar] [CrossRef]
- Rodriguez, K.R.; Horvath, C.M. Amino acid requirements for MDA5 and LGP2 recognition by paramyxovirus V proteins: a single arginine distinguishes MDA5 from RIG-I. J Virol 2013, 87, 2974–2978. [Google Scholar] [CrossRef]
- Bharaj, P.; Wang, Y.E.; Dawes, B.E.; Yun, T.E.; Park, A.; Yen, B.; Basler, C.F.; Freiberg, A.N.; Lee, B.; Rajsbaum, R. The Matrix Protein of Nipah Virus Targets the E3-Ubiquitin Ligase TRIM6 to Inhibit the IKKepsilon Kinase-Mediated Type-I IFN Antiviral Response. PLoS Pathog 2016, 12, e1005880. [Google Scholar] [CrossRef]
- Bojkova, D.; Bechtel, M.; McLaughlin, K.M.; McGreig, J.E.; Klann, K.; Bellinghausen, C.; Rohde, G.; Jonigk, D.; Braubach, P.; Ciesek, S.; et al. Aprotinin Inhibits SARS-CoV-2 Replication. Cells 2020, 9. [Google Scholar] [CrossRef]
- Hatton, C.F.; Botting, R.A.; Dueñas, M.E.; Haq, I.J.; Verdon, B.; Thompson, B.J.; Spegarova, J.S.; Gothe, F.; Stephenson, E.; Gardner, A.I.; et al. Delayed induction of type I and III interferons mediates nasal epithelial cell permissiveness to SARS-CoV-2. Nat Commun 2021, 12, 7092. [Google Scholar] [CrossRef] [PubMed]
- Hekman, R.M.; Hume, A.J.; Goel, R.K.; Abo, K.M.; Huang, J.; Blum, B.C.; Werder, R.B.; Suder, E.L.; Paul, I.; Phanse, S.; et al. Actionable Cytopathogenic Host Responses of Human Alveolar Type 2 Cells to SARS-CoV-2. Mol Cell 2020, 80, 1104–1122 e1109. [Google Scholar] [CrossRef]
- Lamers, M.M.; van der Vaart, J.; Knoops, K.; Riesebosch, S.; Breugem, T.I.; Mykytyn, A.Z.; Beumer, J.; Schipper, D.; Bezstarosti, K.; Koopman, C.D.; et al. An organoid-derived bronchioalveolar model for SARS-CoV-2 infection of human alveolar type II-like cells. Embo j 2021, 40, e105912. [Google Scholar] [CrossRef] [PubMed]
- Liou, T.G.; Adler, F.R.; Cahill, B.C.; Cox, D.R.; Cox, J.E.; Grant, G.J.; Hanson, K.E.; Hartsell, S.C.; Hatton, N.D.; Helms, M.N.; et al. SARS-CoV-2 innate effector associations and viral load in early nasopharyngeal infection. Physiol Rep 2021, 9, e14761. [Google Scholar] [CrossRef]
- Grossegesse, M.; Bourquain, D.; Neumann, M.; Schaade, L.; Schulze, J.; Mache, C.; Wolff, T.; Nitsche, A.; Doellinger, J. Deep Time Course Proteomics of SARS-CoV- and SARS-CoV-2-Infected Human Lung Epithelial Cells (Calu-3) Reveals Strong Induction of Interferon-Stimulated Gene Expression by SARS-CoV-2 in Contrast to SARS-CoV. Journal of Proteome Research 2022. [Google Scholar] [CrossRef] [PubMed]
- Fulcher, M.L.; Gabriel, S.; Burns, K.A.; Yankaskas, J.R.; Randell, S.H. Well-differentiated human airway epithelial cell cultures. Methods Mol Med 2005, 107, 183–206. [Google Scholar] [CrossRef]
- Weingartl, H.M.; Berhane, Y.; Caswell, J.L.; Loosmore, S.; Audonnet, J.C.; Roth, J.A.; Czub, M. Recombinant nipah virus vaccines protect pigs against challenge. J Virol 2006, 80, 7929–7938. [Google Scholar] [CrossRef]
- Schindelin, J.; Arganda-Carreras, I.; Frise, E.; Kaynig, V.; Longair, M.; Pietzsch, T.; Preibisch, S.; Rueden, C.; Saalfeld, S.; Schmid, B.; et al. Fiji: an open-source platform for biological-image analysis. Nature Methods 2012, 9, 676–682. [Google Scholar] [CrossRef]
- Perez-Riverol, Y.; Csordas, A.; Bai, J.; Bernal-Llinares, M.; Hewapathirana, S.; Kundu, D.J.; Inuganti, A.; Griss, J.; Mayer, G.; Eisenacher, M.; et al. The PRIDE database and related tools and resources in 2019: improving support for quantification data. Nucleic Acids Research 2019, 47, D442–D450. [Google Scholar] [CrossRef] [PubMed]
- von Neumann, J. Distribution of the Ratio of the Mean Square Successive Difference to the Variance. The Annals of Mathematical Statistics 1941, 12, 367-395, 329. [Google Scholar] [CrossRef]
- Schoggins, J.W.; Rice, C.M. Interferon-stimulated genes and their antiviral effector functions. Curr Opin Virol 2011, 1, 519–525. [Google Scholar] [CrossRef]
- Aki, M.; Shimbara, N.; Takashina, M.; Akiyama, K.; Kagawa, S.; Tamura, T.; Tanahashi, N.; Yoshimura, T.; Tanaka, K.; Ichihara, A. Interferon-gamma induces different subunit organizations and functional diversity of proteasomes. J Biochem 1994, 115, 257–269. [Google Scholar] [CrossRef]
- Shin, E.C.; Seifert, U.; Kato, T.; Rice, C.M.; Feinstone, S.M.; Kloetzel, P.M.; Rehermann, B. Virus-induced type I IFN stimulates generation of immunoproteasomes at the site of infection. J Clin Invest 2006, 116, 3006–3014. [Google Scholar] [CrossRef]
- Keller, I.E.; Vosyka, O.; Takenaka, S.; Kloss, A.; Dahlmann, B.; Willems, L.I.; Verdoes, M.; Overkleeft, H.S.; Marcos, E.; Adnot, S.; et al. Regulation of immunoproteasome function in the lung. Sci Rep 2015, 5, 10230. [Google Scholar] [CrossRef] [PubMed]
- Tisoncik, J.R.; Billharz, R.; Burmakina, S.; Belisle, S.E.; Proll, S.C.; Korth, M.J.; Garcia-Sastre, A.; Katze, M.G. The NS1 protein of influenza A virus suppresses interferon-regulated activation of antigen-presentation and immune-proteasome pathways. J Gen Virol 2011, 92, 2093–2104. [Google Scholar] [CrossRef] [PubMed]
- Riese, R.J.; Wolf, P.R.; Bromme, D.; Natkin, L.R.; Villadangos, J.A.; Ploegh, H.L.; Chapman, H.A. Essential role for cathepsin S in MHC class II-associated invariant chain processing and peptide loading. Immunity 1996, 4, 357–366. [Google Scholar] [CrossRef]
- Oei, E.; Kalb, T.; Beuria, P.; Allez, M.; Nakazawa, A.; Azuma, M.; Timony, M.; Stuart, Z.; Chen, H.; Sperber, K. Accessory cell function of airway epithelial cells. Am J Physiol Lung Cell Mol Physiol 2004, 287, L318–331. [Google Scholar] [CrossRef]
- Brown, R.; Nath, S.; Lora, A.; Samaha, G.; Elgamal, Z.; Kaiser, R.; Taggart, C.; Weldon, S.; Geraghty, P. Cathepsin S: investigating an old player in lung disease pathogenesis, comorbidities, and potential therapeutics. Respir Res 2020, 21, 111. [Google Scholar] [CrossRef]
- Shen, L.; Sigal, L.J.; Boes, M.; Rock, K.L. Important role of cathepsin S in generating peptides for TAP-independent MHC class I crosspresentation in vivo. Immunity 2004, 21, 155–165. [Google Scholar] [CrossRef] [PubMed]
- Basha, G.; Lizee, G.; Reinicke, A.T.; Seipp, R.P.; Omilusik, K.D.; Jefferies, W.A. MHC class I endosomal and lysosomal trafficking coincides with exogenous antigen loading in dendritic cells. PLoS One 2008, 3, e3247. [Google Scholar] [CrossRef]
- Mehrfeld, C.; Zenner, S.; Kornek, M.; Lukacs-Kornek, V. The Contribution of Non-Professional Antigen-Presenting Cells to Immunity and Tolerance in the Liver. Front Immunol 2018, 9, 635. [Google Scholar] [CrossRef] [PubMed]
- Mathieu, C.; Legras-Lachuer, C.; Horvat, B. Transcriptome Signature of Nipah Virus Infected Endothelial Cells. In Advances in the Etiology, Pathogenesis and Pathology of Vasculitis, Amezcua-Guerra, L.M., Ed.; InTech: 2011.
- Lo, M.K.; Miller, D.; Aljofan, M.; Mungall, B.A.; Rollin, P.E.; Bellini, W.J.; Rota, P.A. Characterization of the antiviral and inflammatory responses against Nipah virus in endothelial cells and neurons. Virology 2010, 404, 78–88. [Google Scholar] [CrossRef] [PubMed]
- Cong, Y.; Lentz, M.R.; Lara, A.; Alexander, I.; Bartos, C.; Bohannon, J.K.; Hammoud, D.; Huzella, L.; Jahrling, P.B.; Janosko, K.; et al. Loss in lung volume and changes in the immune response demonstrate disease progression in African green monkeys infected by small-particle aerosol and intratracheal exposure to Nipah virus. PLoS Negl Trop Dis 2017, 11, e0005532. [Google Scholar] [CrossRef]
- Bauer, A.; Neumann, S.; Karger, A.; Henning, A.K.; Maisner, A.; Lamp, B.; Dietzel, E.; Kwasnitschka, L.; Balkema-Buschmann, A.; Keil, G.M.; et al. ANP32B is a nuclear target of henipavirus M proteins. PLoS One 2014, 9, e97233. [Google Scholar] [CrossRef]
- Gunther, M.; Bauer, A.; Muller, M.; Zaeck, L.; Finke, S. Interaction of host cellular factor ANP32B with matrix proteins of different paramyxoviruses. J Gen Virol 2020, 101, 44–58. [Google Scholar] [CrossRef]
- Wang, Y.E.; Park, A.; Lake, M.; Pentecost, M.; Torres, B.; Yun, T.E.; Wolf, M.C.; Holbrook, M.R.; Freiberg, A.N.; Lee, B. Ubiquitin-regulated nuclear-cytoplasmic trafficking of the Nipah virus matrix protein is important for viral budding. PLoS Pathog 2010, 6, e1001186. [Google Scholar] [CrossRef]
- Sun, W.; McCrory, T.S.; Khaw, W.Y.; Petzing, S.; Myers, T.; Schmitt, A.P. Matrix proteins of Nipah and Hendra viruses interact with beta subunits of AP-3 complexes. Journal of virology 2014, 88, 13099–13110. [Google Scholar] [CrossRef]
- Watkinson, R.E.; Lee, B. Nipah virus matrix protein: expert hacker of cellular machines. FEBS Lett 2016, 590, 2494–2511. [Google Scholar] [CrossRef]
- Rawlinson, S.M.; Zhao, T.; Rozario, A.M.; Rootes, C.L.; McMillan, P.J.; Purcell, A.W.; Woon, A.; Marsh, G.A.; Lieu, K.G.; Wang, L.F.; et al. Viral regulation of host cell biology by hijacking of the nucleolar DNA-damage response. Nat Commun 2018, 9, 3057. [Google Scholar] [CrossRef] [PubMed]
- Hippee, C.E.; Singh, B.K.; Thurman, A.L.; Cooney, A.L.; Pezzulo, A.A.; Cattaneo, R.; Sinn, P.L. Measles virus exits human airway epithelia within dislodged metabolically active infectious centers. PLoS Pathog 2021, 17, e1009458. [Google Scholar] [CrossRef] [PubMed]
- Alonso, C.; Raynor, P.C.; Davies, P.R.; Torremorell, M. Concentration, Size Distribution, and Infectivity of Airborne Particles Carrying Swine Viruses. PLoS One 2015, 10, e0135675. [Google Scholar] [CrossRef] [PubMed]
Figure 1.
Characterization of PBEC-ALI cultures using cell markers and electron microscopy and susceptibility to NiV infection. (A) Immunostaining of cross sections for β-tubulin (ciliated cells; green) and ZO-1 (tight junctions; magenta), (B) Mucin-5AC (mucus secreting cells; green) and Cytokeratin 5 (basal cells; magenta), and (C) β-catenin (cell adherens junctions; magenta). (D) Scanning electron microscopy visualization of fully-differentiated PBEC-ALI culture after 4 weeks of ALI cultivation. (E) Immunostaining for β-tubulin (green) and NiV nucleoprotein N (magenta) at 2 dpi. Arrow: NiV infected cell. Scale bars: 20 µm (A–C,E) and 2 µm (D).
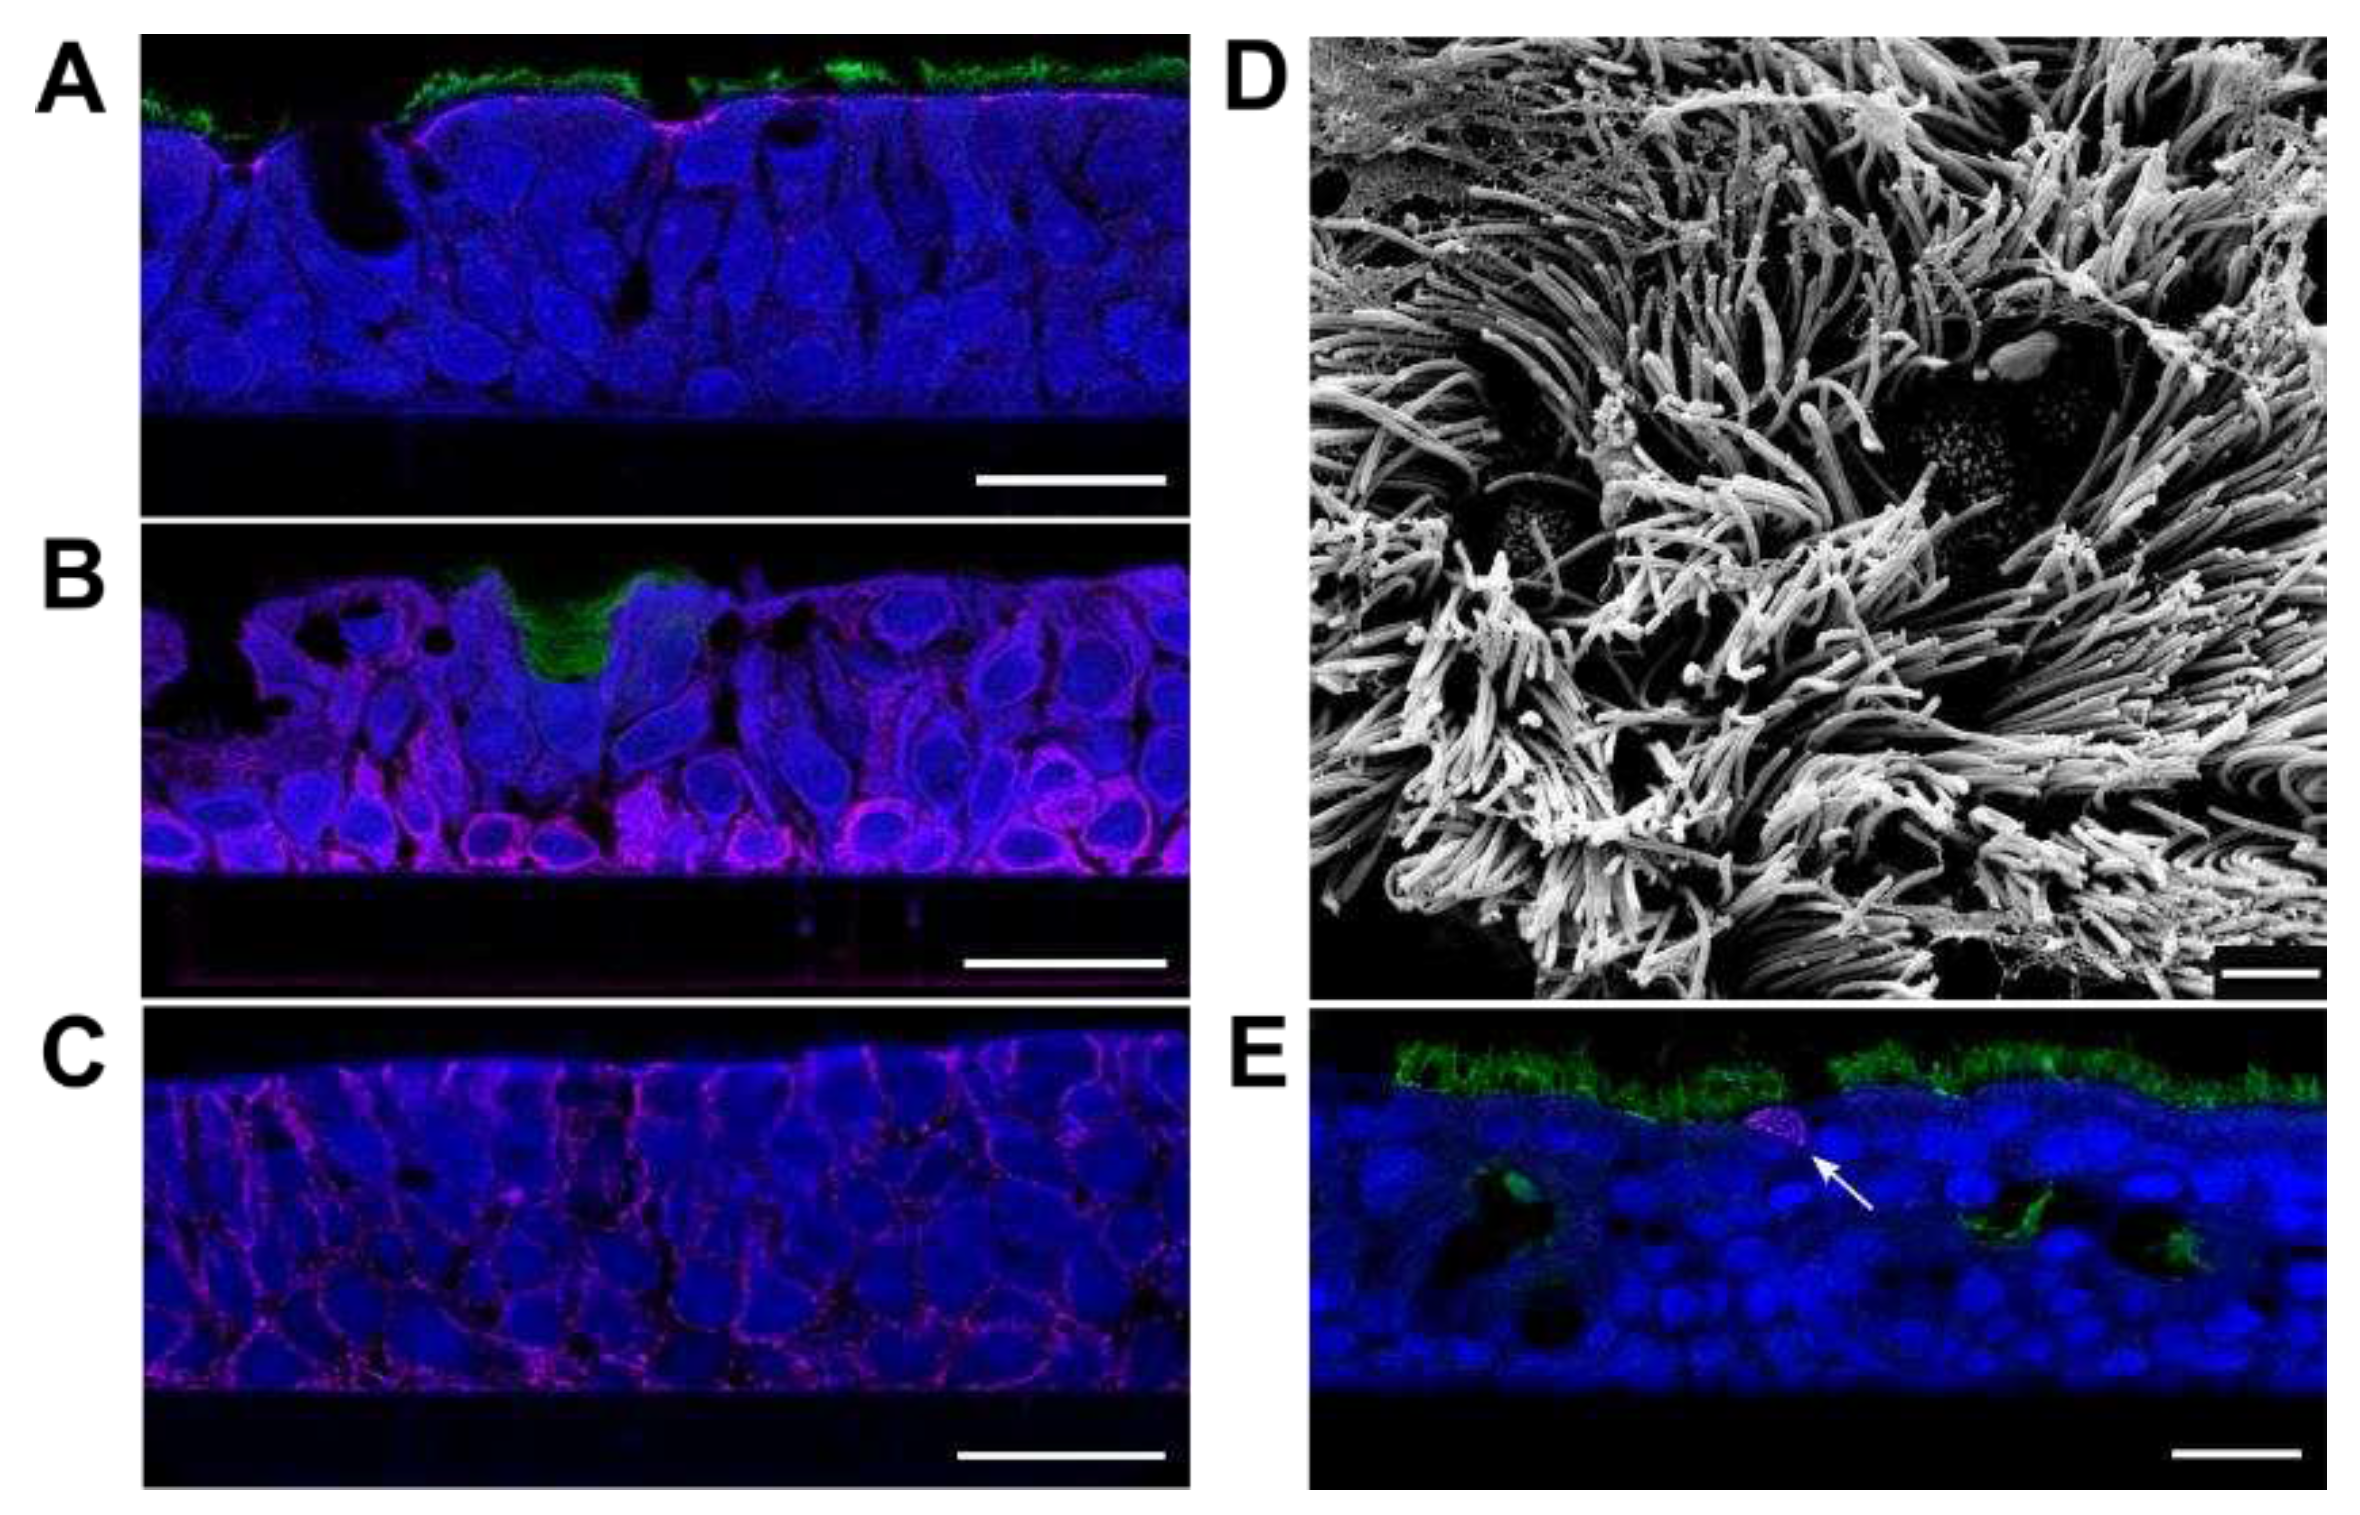
Figure 2.
Time course of infected PBEC-ALI cells and virus release. (A) Immunostaining of NiV-infected PBEC-ALI membranes against NiV N (red). Nuclei were stained with Hoechst 33342. The diameter of the membranes was approximate 0.64 cm. (B) NiV infectious titers at the apical and basal sides. Results are depicted as the mean of two replicates with the minimum and maximum value indicated by error bars. On the right, quantification of viral RNA in ALI cultures with NiV N gene primers. Shown are the relative virus RNA levels after subtracting ΔCt values from the ΔCt mock value with a sample range of n=2. Error bars indicate the value range.
Figure 3.
Time course of NiV infection and cytopathic effects. Immunostaining of NiV-infected PBEC-ALI culture cross sections against NiV N (magenta) and β-tubulin (green). (A) A large section of a membrane from 12 dpi at the top and the mock control at the bottom. Arrow and arrowhead indicate less infected and destructed areas of ciliated and basal cells, respectively. Scale bars = 100 µm. (B) Time course of NiV infection for 12 dpi with representative sections. Arrows indicate infection in ciliated and non-ciliated cells of the apical cell layer. Diamonds represent infected cells and stars non-infected cells. Nuclei were stained with Hoechst 33342.
Figure 4.
Visualization of NiV cell tropism in cross-sections of infected PBEC-ALI cultures from 12 dpi with various cell markers. (A) Immunostaining of a cross section against NiV N (magenta) and cytokeratin 5 as a basal cell marker (green), (B) ZO-1 for tight junctions (green), (C) β-catenin for adherens junctions (green), and (D) Mucin-5AC for mucus-secreting cells (green). (E) Immunostaining of 12 dpi uninfected areas against NiV N (red) and cytokeratin 5 (green) (F) and ZO-1 for tight junctions (green). Nuclei were stained with Hoechst 33342. Scale bars: 20 µm (A–F).
Figure 5.
Time course of NiV induced cytokine and interferon-stimulated-gene (ISG) upregulation. Quantification of cytokine and ISG mRNAs by qPCR for IFN-β, IFN-λ, IL-6, IL-8, OAS-1, and ISG-56. Results are depicted as fold change over mock from a mean of two replicates with the value range. Fold change over mock was calculated with the 2-ΔΔCT method.
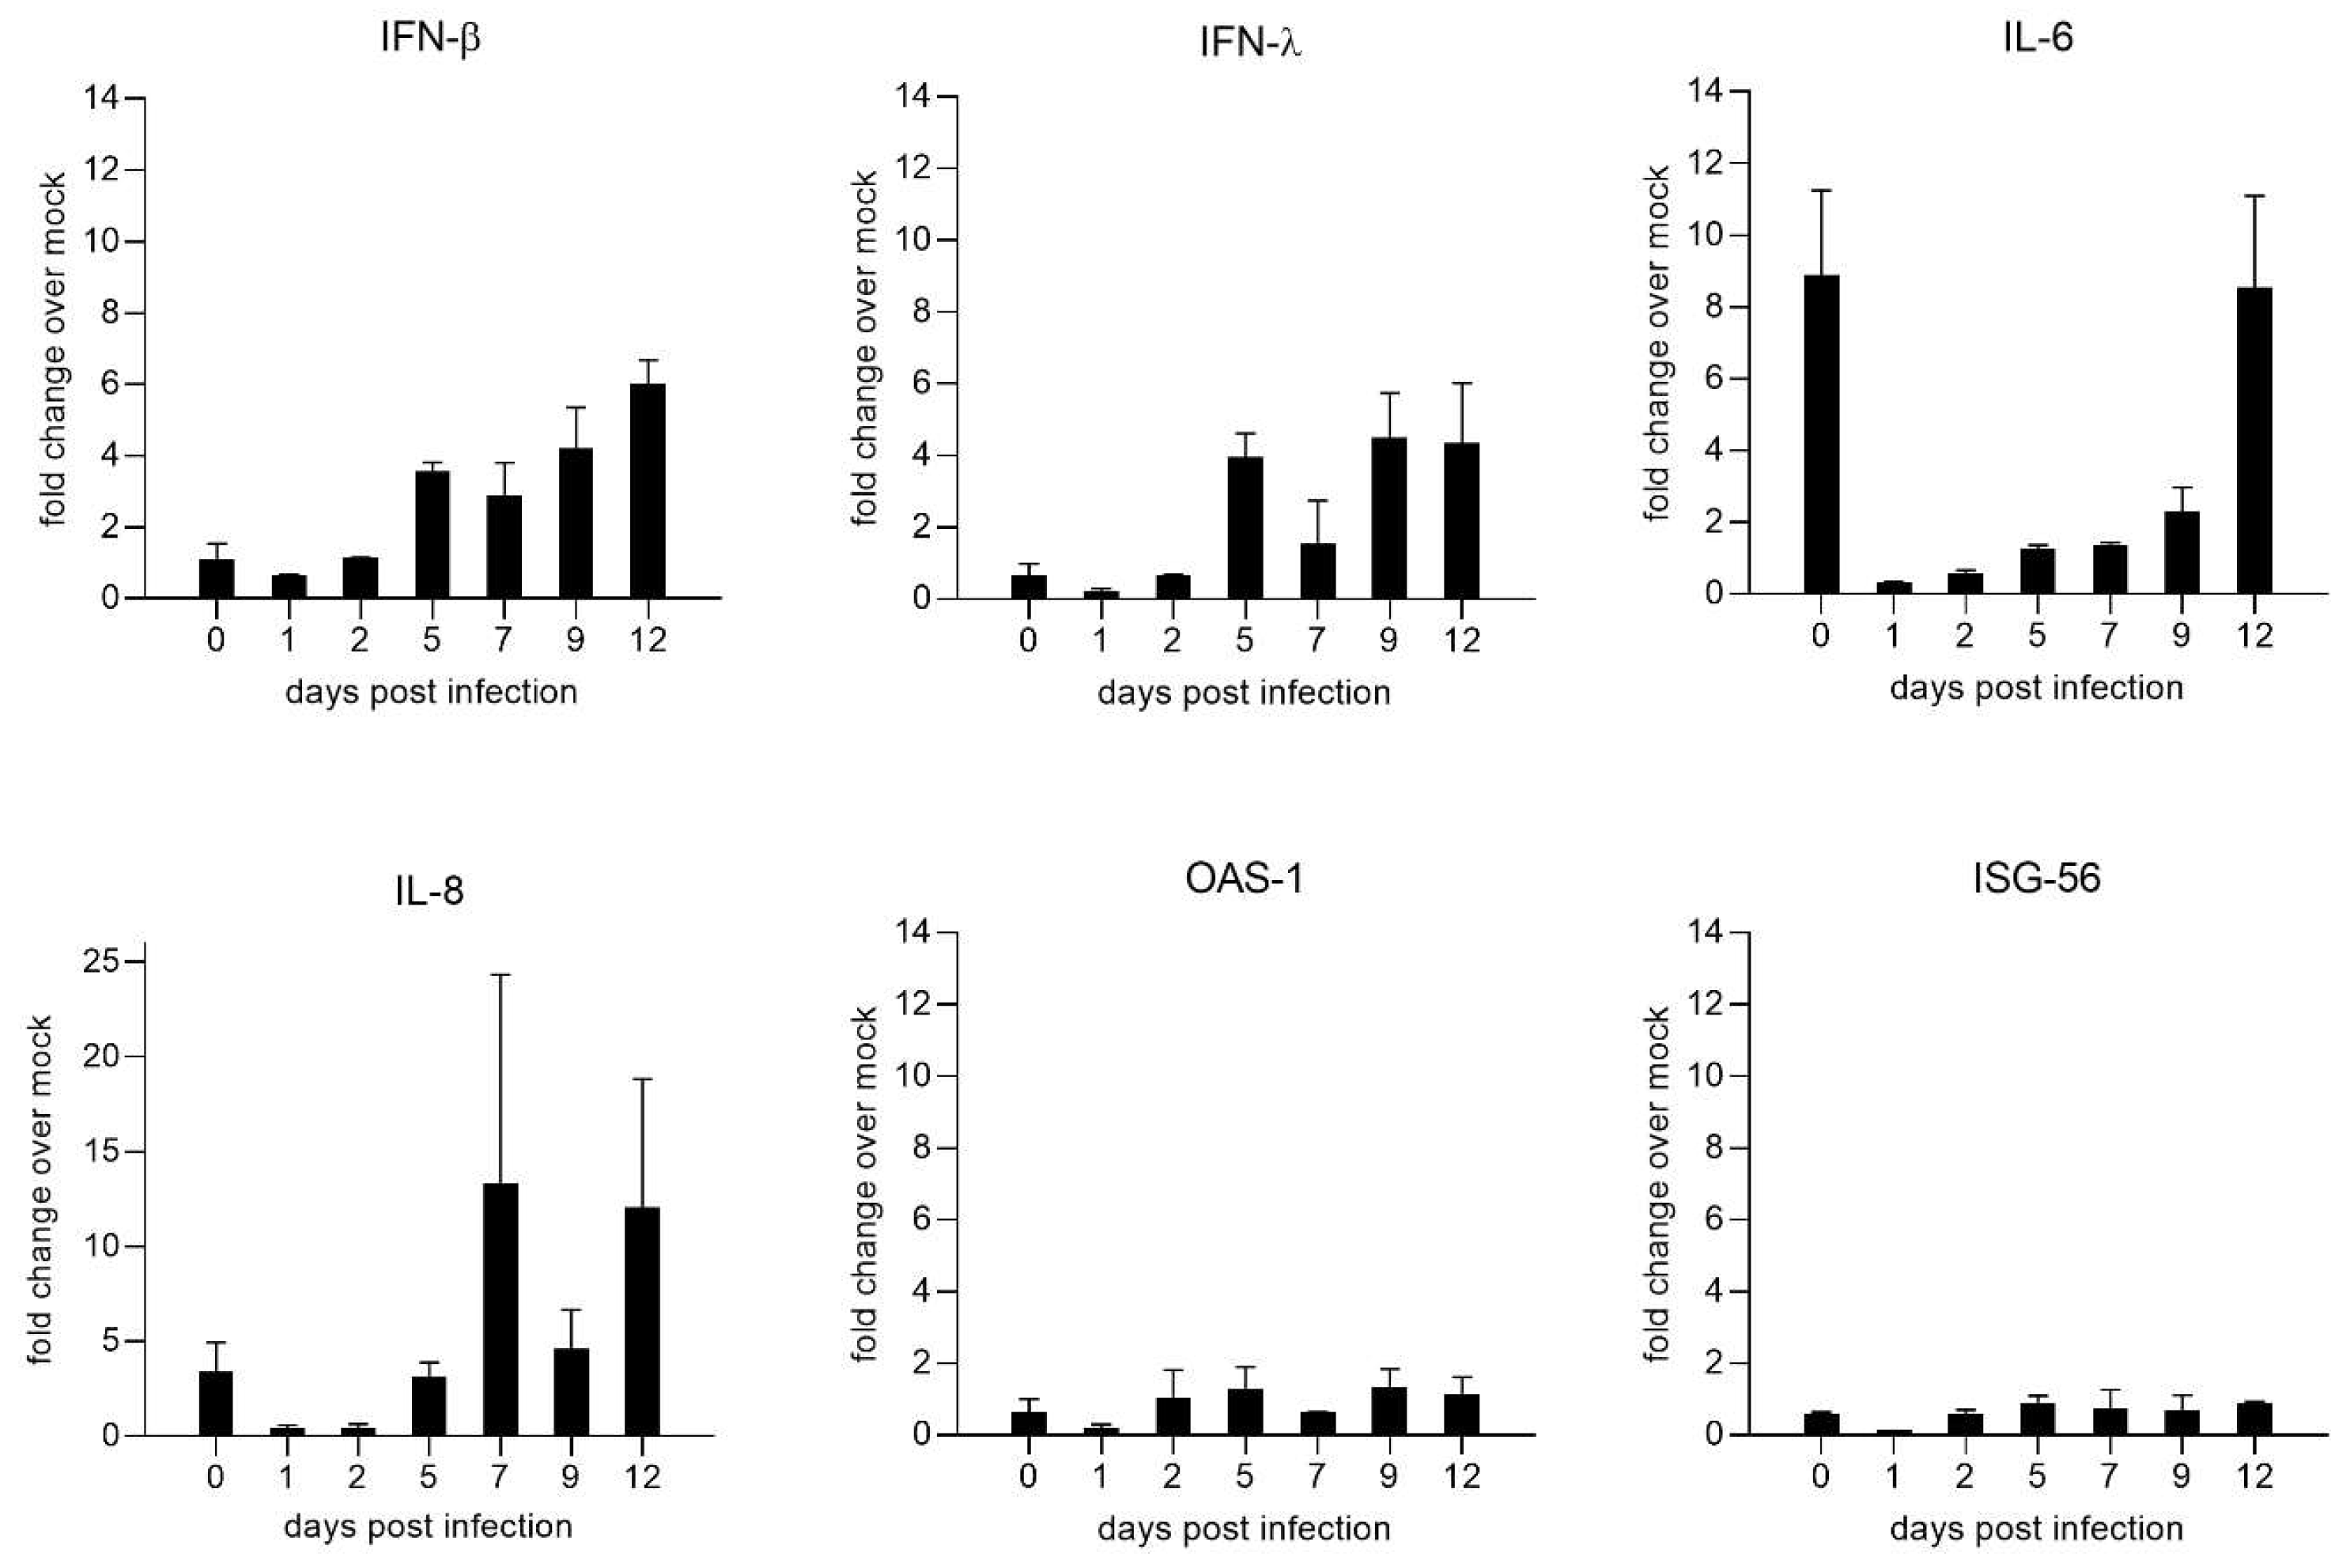
Figure 6.
Time course of NiV protein expression. NiV protein levels are shown as normalized values based on label-free quantification. For better visualization, the NiV proteins are represented as envelope proteins (M, F, and G), RNP-associated proteins (N, P, and L), and P variants (C, V, and W).
Figure 6.
Time course of NiV protein expression. NiV protein levels are shown as normalized values based on label-free quantification. For better visualization, the NiV proteins are represented as envelope proteins (M, F, and G), RNP-associated proteins (N, P, and L), and P variants (C, V, and W).
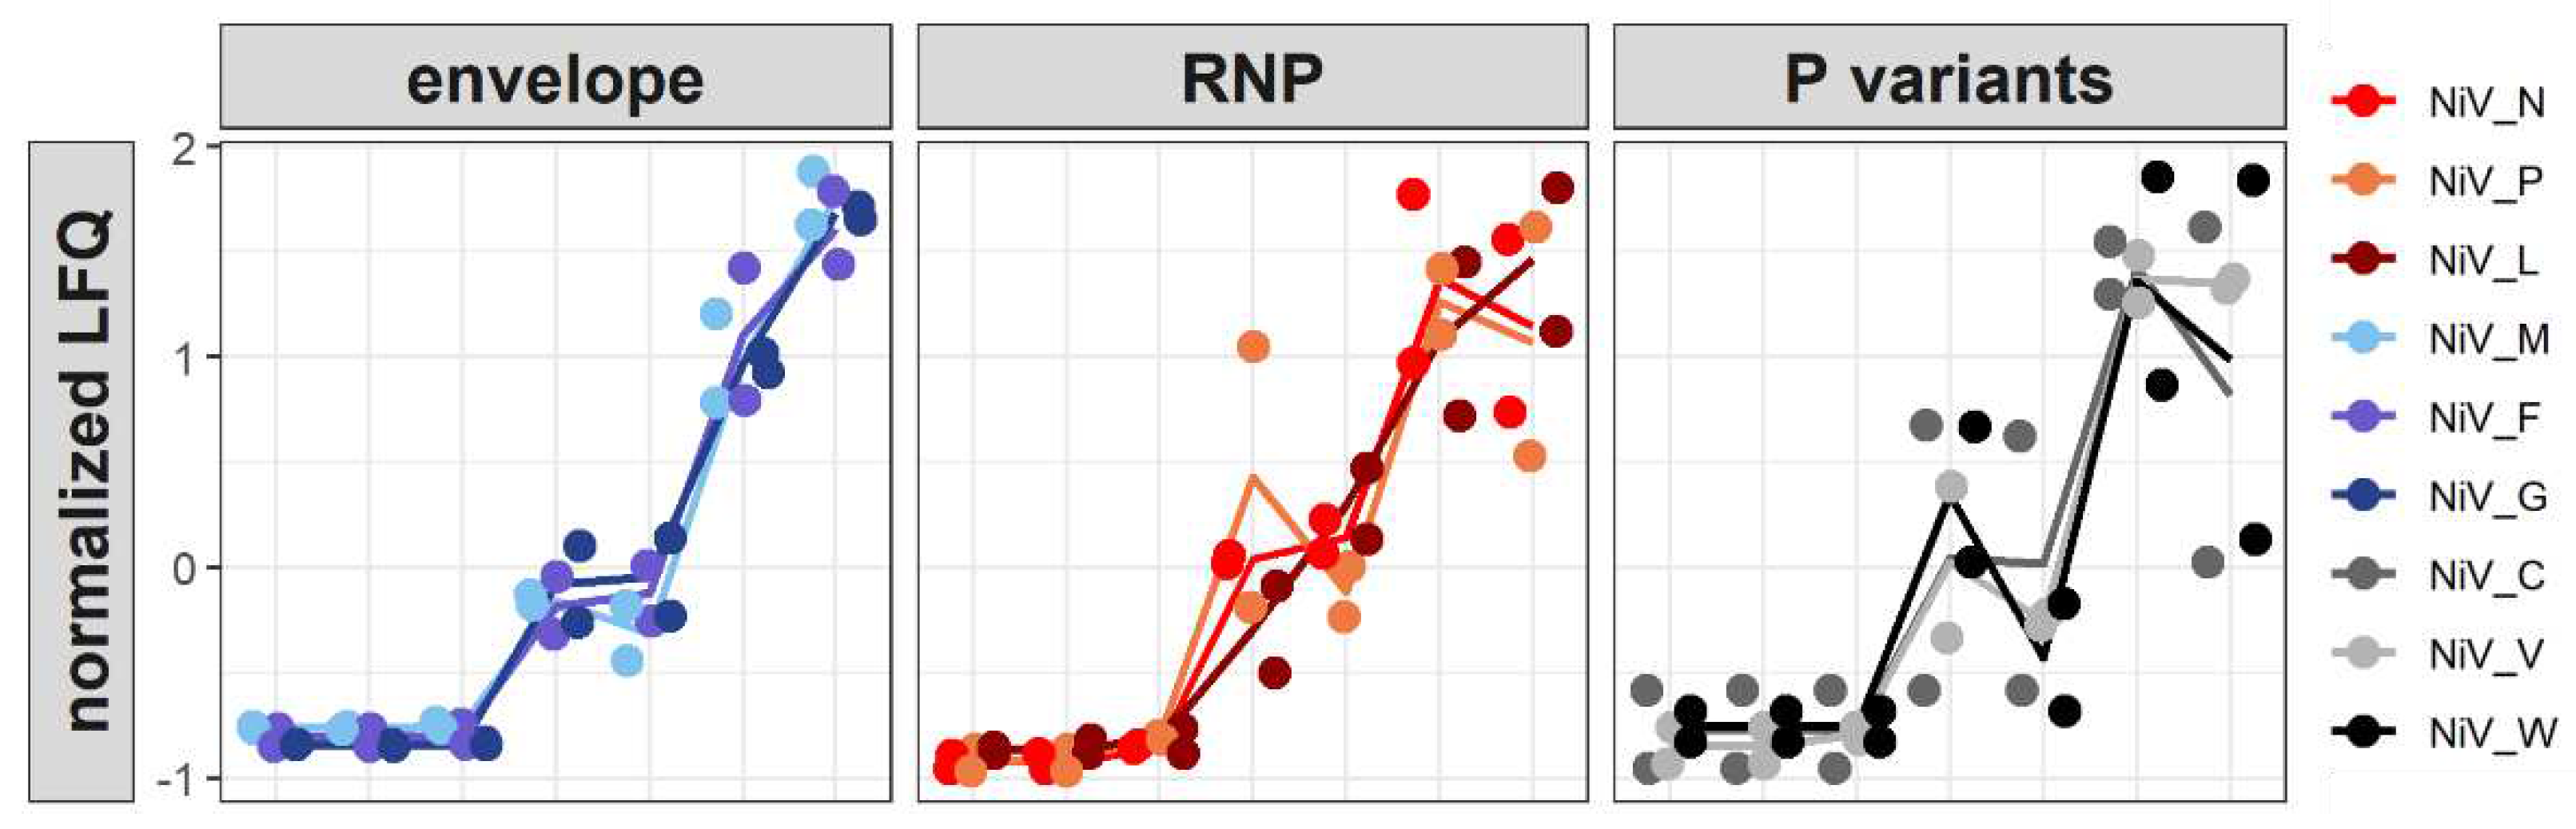
Figure 7.
Principal component analysis (PCA). Quantitative MS data of both replicates were subjected to PCA analysis before and after normalization. Before normalization, sample clustering is dominated by animal-to-animal variability. Normalization partially compensated for these effects and resulted in a more time-dependent clustering of immediate, early, intermediate and late samples from both animals.
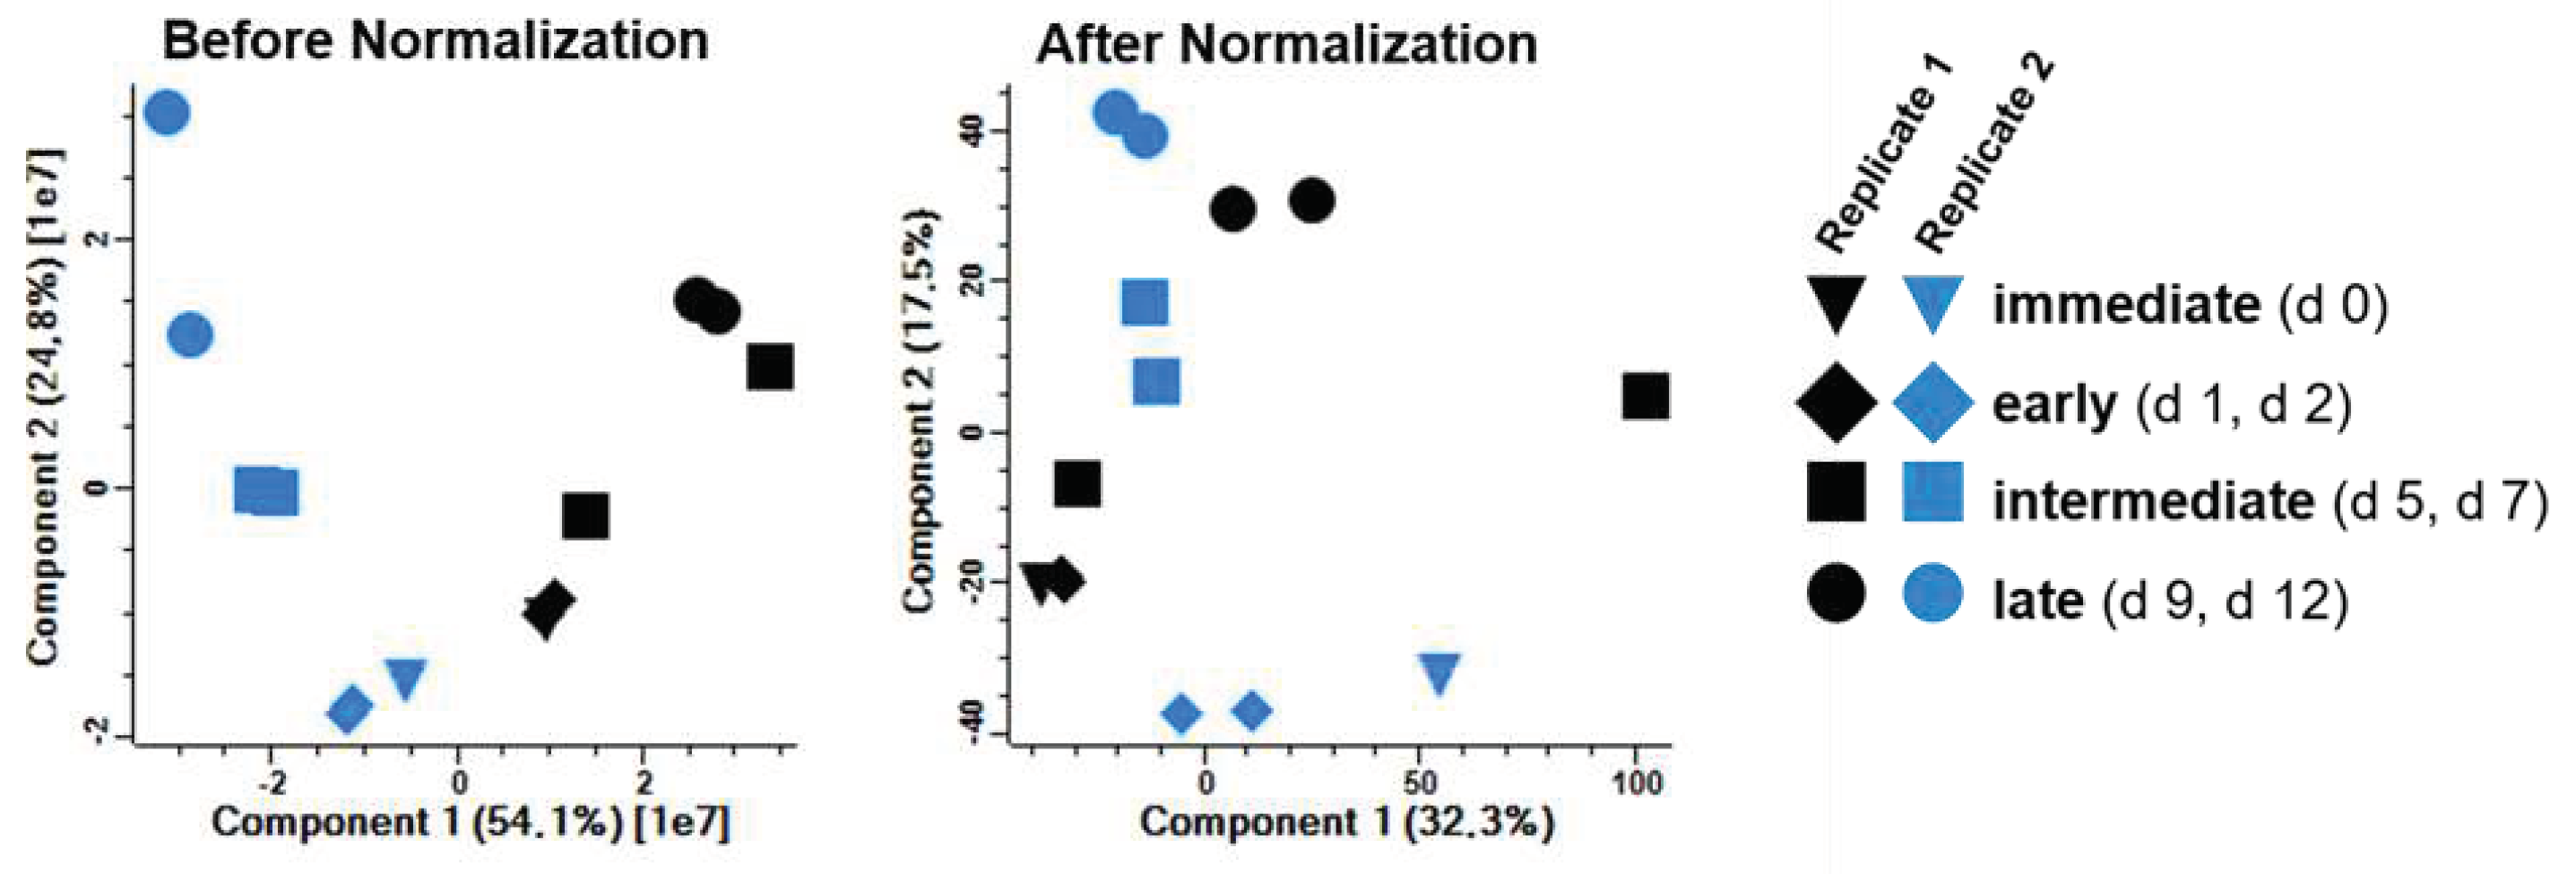
Figure 8.
GO network analysis. Early (1 dpi, 2 dpi) and late (9 dpi, 12 dpi) stages were compared and up-(A) or downregulated (B) genes were subjected to GO-term enrichment analysis followed by network analysis with the ClueGO package of Cytoscape. Related GO-terms for clusters are labeled with one representative GO-term name from the cluster. Analysis parameters and detailed results can be found in Tables S2 and S3.
Figure 9.
Differentially expressed genes in late and early phases of infection: virus proteins, ribosome (KEGG:03010), and spliceosome (KEGG:03040). Volcano plots highlighting genes annotated within GO-Terms (A) ribosome (KEGG:03010) and (A) spliceosome (KEGG:03040). NiV proteins are highlighted in red as reference for upregulated genes. (C) Regulated DEG corresponding to GO terms.
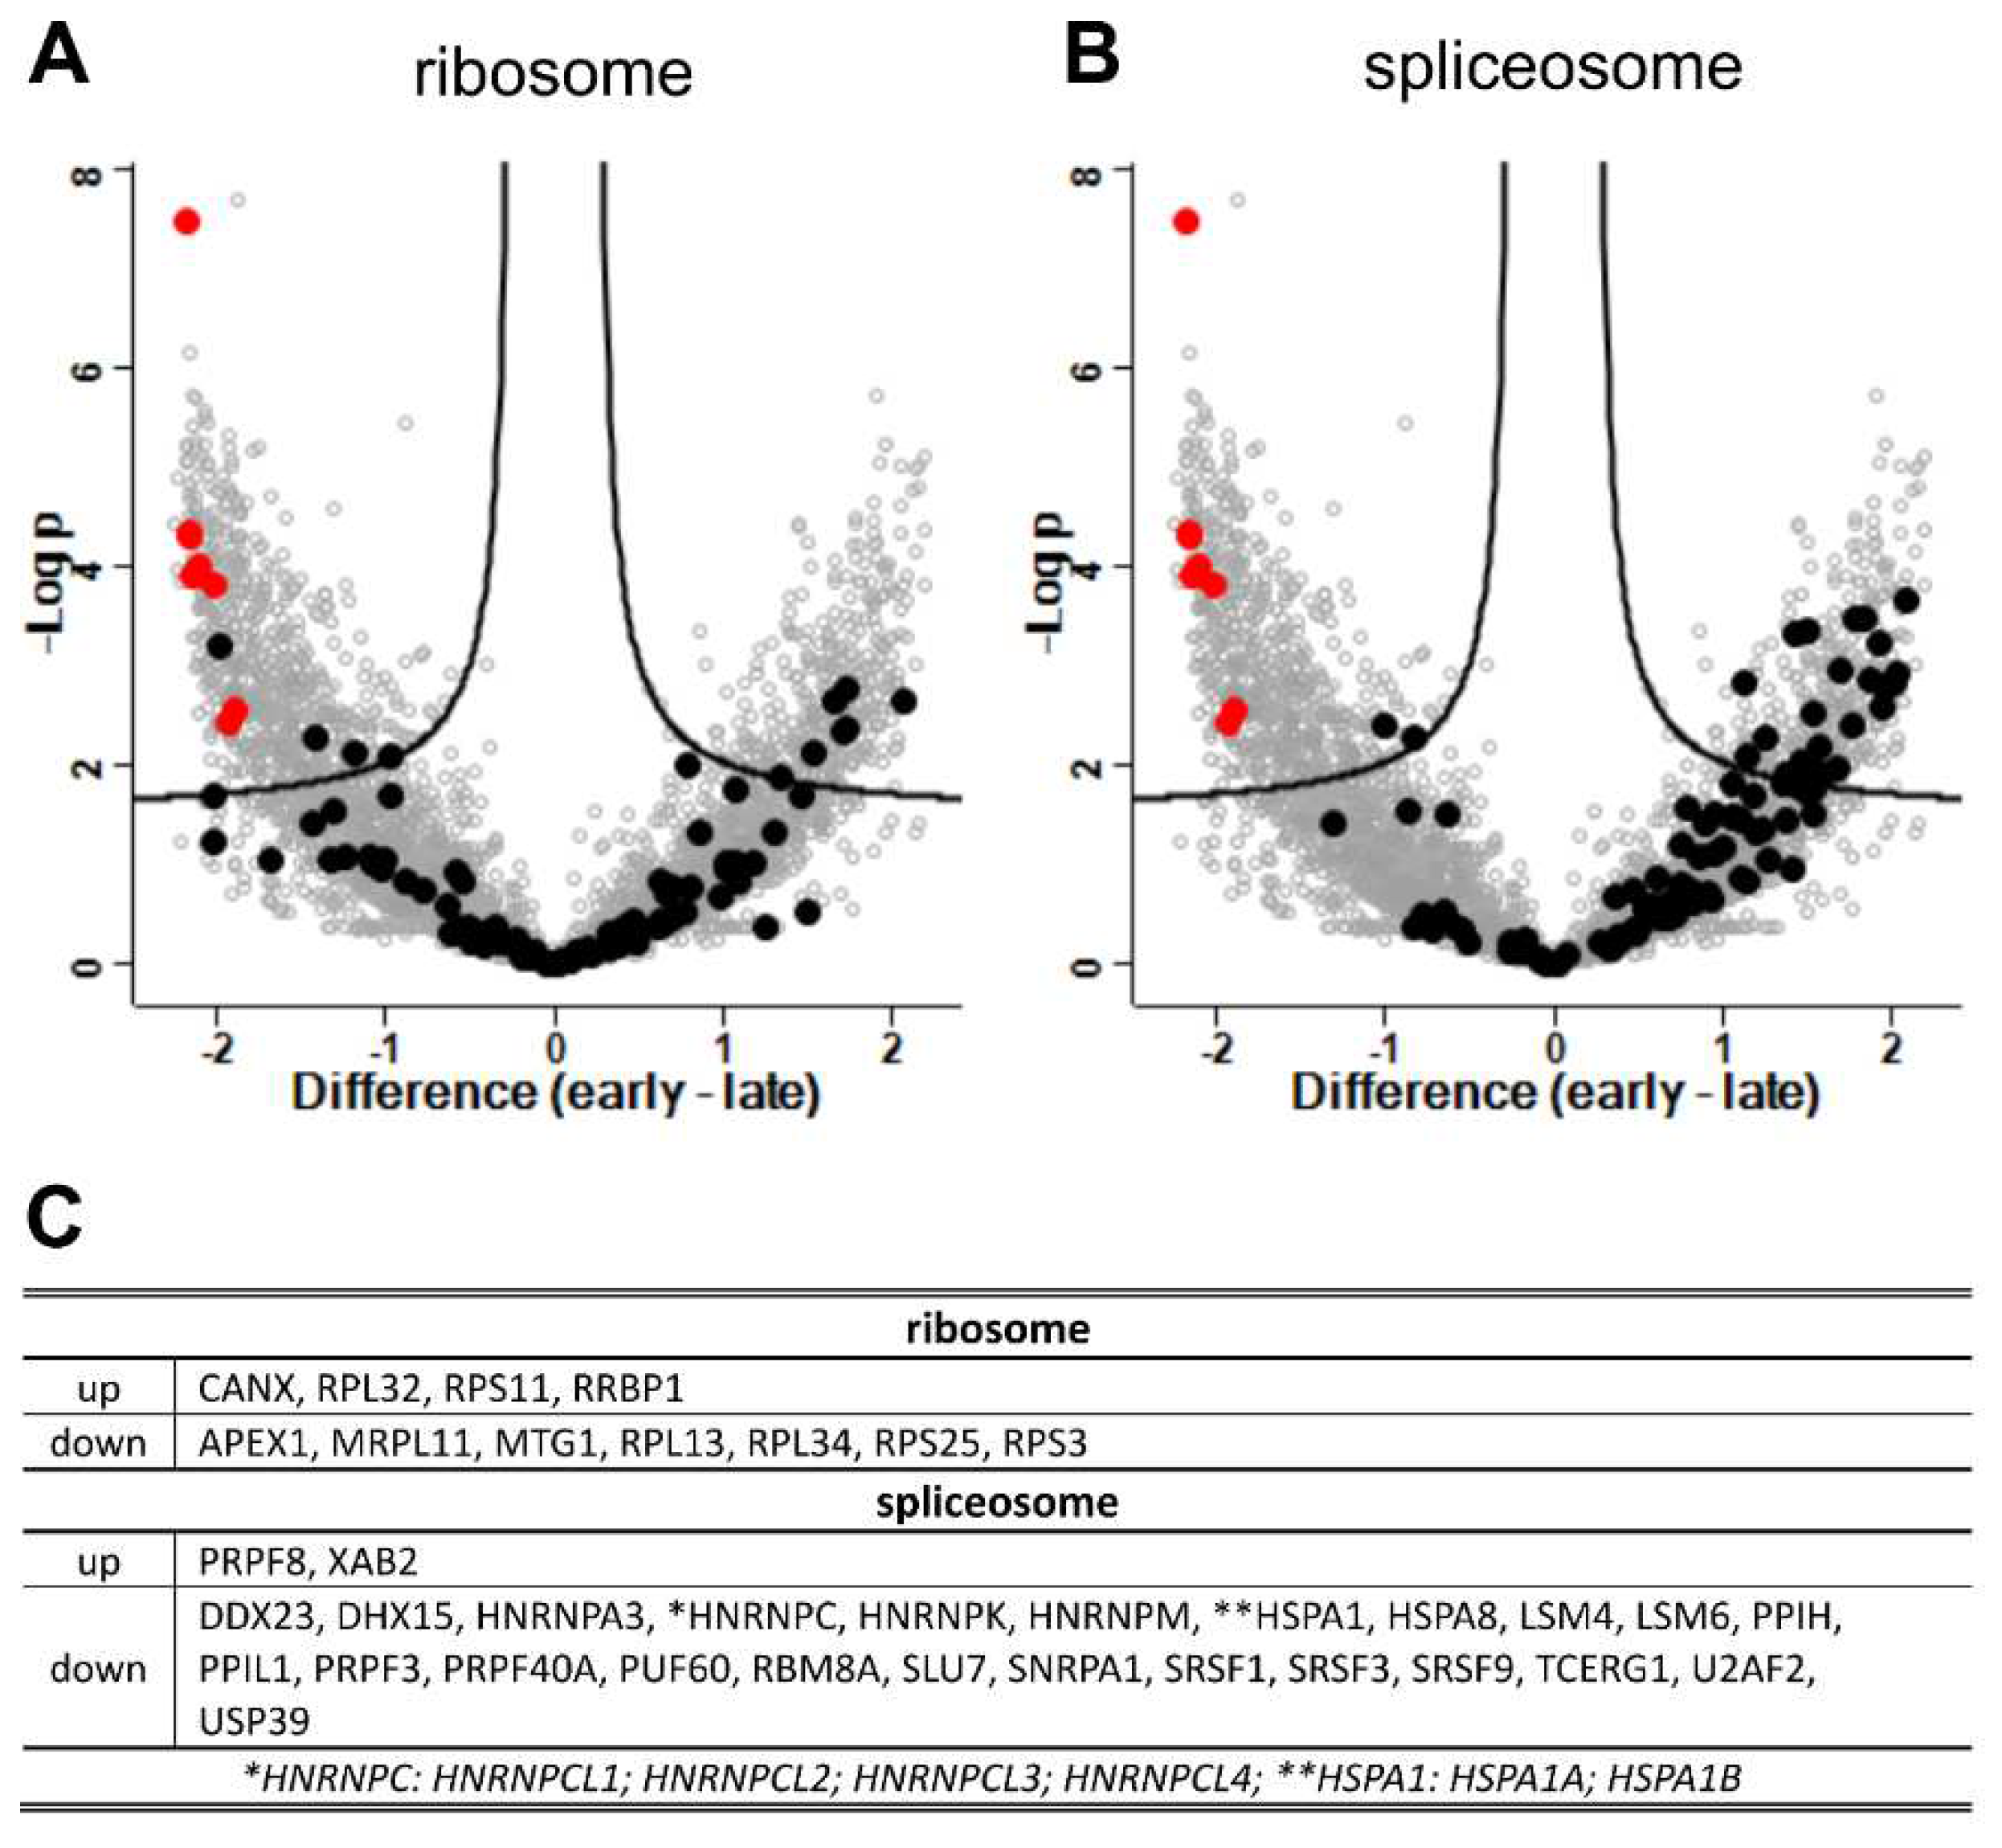
Figure 10.
Differentially expressed genes in late and early phases of infection: virus proteins, type I IFN response (GO: 0071357), and response to IFN gamma (GO:0034341). (A) Volcano plots highlighting genes annotated within GO-terms response to Type I IFN (GO: 0071357), response to IFN gamma (GO:0034341), and the pattern recognition term GO:0002221. NiV proteins are highlighted in red as reference for upregulated genes. (B) Regulated DEG corresponding to GO-Terms.
Figure 11.
Differentially expressed genes in late and early phases of infection: virus proteins, antigen processing and presentation (GO: 0048002), and proteasome (KEGG: 03050). (A) Volcano plot highlighting genes in black related to the antigen processing and presentation term GO:0048002 and (B) the proteasome term (KEGG:03050). NiV proteins are highlighted in red as reference for upregulated genes. (C) Regulated DEG corresponding to GO-Terms.

Table 1.
Overview of selected GO/KEGG terms for a more detailed analysis. Based on GO-term enrichment analysis of differentially regulated genes with the gProfiler software (Table S5).
Table 1.
Overview of selected GO/KEGG terms for a more detailed analysis. Based on GO-term enrichment analysis of differentially regulated genes with the gProfiler software (Table S5).
| regulation | term name | Go ID |
|---|---|---|
| up | antigen processing and presentation of peptide antigen | GO:0048002 |
| up | response to type I IFN | KEGG: 03050 |
| up | response to IFN gamma | GO:0071357 |
| up | pattern recognition signaling pathway | GO:0034341 |
| up | proteasome | GO:0002221 |
| down | spliceosome | KEGG:03040 |
Disclaimer/Publisher’s Note: The statements, opinions and data contained in all publications are solely those of the individual author(s) and contributor(s) and not of MDPI and/or the editor(s). MDPI and/or the editor(s) disclaim responsibility for any injury to people or property resulting from any ideas, methods, instructions or products referred to in the content. |
© 2023 by the authors. Licensee MDPI, Basel, Switzerland. This article is an open access article distributed under the terms and conditions of the Creative Commons Attribution (CC BY) license (http://creativecommons.org/licenses/by/4.0/).
Copyright: This open access article is published under a Creative Commons CC BY 4.0 license, which permit the free download, distribution, and reuse, provided that the author and preprint are cited in any reuse.


