
Submitted:
09 March 2023
Posted:
13 March 2023
You are already at the latest version
Abstract
When we discuss migration and compare national trends, the topic most commonly centers on undocumented immigrants and asylum seekers. However, there is also considerable variation in internal migration patterns, with differences found between and within nations. Many factors shape whether, why, and where people relocate. Over the last few decades, the world's two largest economies - the United States and China - have seen domestic migration changes happening in opposite directions. China has become increasingly mobile and experienced urbanization. In contrast, the U.S. has seen a steady decline in the rate at which its population relocates, with cities experiencing net migration losses as citizens leave for suburbs. This paper examines these trends using data from the last decade to compare the two nations in areas of internal migration, urbanization, housing, social mobility, and economic growth.
Keywords:
hukou
; floating population
; city growth
; intercounty moves
; labor relocation
Introduction
When people discuss migration, the conversation most commonly centers on undocumented immigrants and asylum seekers. However, there is also considerable variation in internal migration patterns, and these patterns differ between nations and the regions within them. Internal migration is defined as geographic mobility patterns within a country or political unit, and many variables factor into whether, why, and where people relocate, including financial, occupational, social, cultural, and political reasons (Chen and Rosenthal 2008, Coate et al. 2019, Frey 2017, Greenwood and Hunt 1989, Huang and Butts 2022, Mangum 2020). Similar considerations contribute to a diverse range of migration characteristics among countries, states, and municipalities.
Over the last few decades, the world’s two largest economies – the United States and China – have seen domestic migration change in opposite directions. While agriculture accounted for more than 25% of its GDP as of 1990 (World Bank 2022), China has become increasingly mobile and experienced urbanization (Textor 2022), decreasing agriculture’s GDP contribution to 16% (National Bureau of Statistics of China 2022). China’s extraordinary migration since the late 1980s culminated in 376 million internal migrants as of 2020, the most in any country (Shi et al. 2020, Chan 2021). On the other hand, the U.S., long viewed as a land of mobile fortune seekers (Mangum 2020), has seen a steady decline in the rate at which its population relocates, and most moves are short-distance with more citizens moving out of cities into nearby suburbs, a trend dating back to at least the mid-1980s (U.S Census Bureau Data). While some White young residents are moving into city centers (Bahrampour et al. 2023), the pattern has not overcome “white flight” nationwide.
While the U.S. had a GDP more than eight times that of China in the year 2000 (World Bank 2022), China’s booming economy has rapidly closed that gap, trailing the U.S. by just 48%. In fact, some project China’s GDP to surpass the U.S.’s by 2030. Increasing urbanization and a “floating” migrant population has fueled growth in China’s economy, while internal migration has been declining in the United States alongside its decreasing rate of economic growth. This paper explores these contrasting developments by examining various traits and trends of internal migration in the United States and China, including urban living, housing tenure, interregional relocation, self-selection, discrimination, and immobility.
Urbanization and Policy
Migration and urbanization go hand-in-hand, and a country’s economic development is closely linked to its urbanization. There is a strong correlation between urbanization and income per capita, and “developing” countries are urbanizing much faster than developed countries did (Henderson 2010), a process occurring over a few decades instead of a century or more. Much of this acceleration can be explained by government policies and initiatives (Henderson 2010). In China’s case, changes to its hukou, or household registration, have played a prominent role in urbanization.
Implemented in 1958, China’s household registration system (hukou) registered citizens based on their housing location and classified them as either agricultural or non-agricultural (urban). Those with urban designation had access to jobs in cities and received substantially more state-sanctioned benefits, including food and housing. To a large extent, the hukou determined the receipt of benefits, the ability to get an education, and a change in hukou registration was something that had to be approved if a person moved, which was not easily done. In 1978, reform to China’s hukou system, which historically has regulated migration and restricted mobility (Au and Henderson 2006, Chan 2021, Chan and Zhang 1999, Chauvin et al. 2017, Zhou and Hui 2022), opened the door for the most rapid urbanization in history, with massive amounts of rural workers migrating to urban areas (Chan and Zhang 1999, Shi et al. 2020). There have been multiple phases of hukou reform since, and while extreme benefits such as food supply and employment opportunities have not been hukou-based for a few decades, there are still welfare services and benefits attached to them. These urban benefits center most around education, healthcare, and social security (Zhou 2020). Some regions had more support in urbanizing, resulting in economic growth and wealth becoming more concentrated (Chan 2021, Henderson 2010, Shi et al. 2020). Chan (2021) highlights how some local governments have used the hukou system to discriminate against migrants, regardless of intention, which has contributed to social gaps between urban and rural populations. According to Zhou and Hui (2022), the hukou system favors wealthier migrants and the highly skilled and educated. Whereas urbanization and migration have also produced social mobility moving many families into the middle class, the urban-rural wage gap remains (Henderson 2010).
Where others have theorized the effects of China’s hukou on migration choices, Zhou and Hui (2022) provide empirical evidence detailing how it influences self-selection for migrants. They identify inter-regional patterns of selection and describe how immigration policies create “segmented citizenship”, hindering undocumented migrants’ ability to fully integrate.
China’s economic transformation was the main contributing factor to the surge in internal migration, with an increasing percentage of jobs created by state, private, and foreign entities. Once scarce, urban jobs have become abundant, resulting in similar welfare across public and private sectors (Zhou 2020). In recent decades, China’s urban residential migration has become less government-planned and more market-oriented (Hou 2014). These driving factors created China’s explosion in migration and resulted in the nation going from 20% urbanization in 1978 to becoming an officially urban nation in 2011, with 56% of its residents living in urban areas.
In contrast, the United States has been urbanizing since its founding (Boustan et al. 2014). Urbanization accelerated between 1830 and 1930, a period during which the U.S. went from being 9% to 56% urbanized. After more rapid growth from 1940 to 1970, urbanization slowed over the next four decades, landing at 81% as of 2010 (Boustan et al. 2014). Today, the United States sits at 83% urbanization (CSS, University of Michigan, 2022).
Research shows the oldest and largest metropolitan areas in the U.S. are seeing net-migration losses, whereas growth is occurring in the “established midsize, interior cities through all regions of the country” (Mangum 2020). China’s eastern region has begun to see a similar “downward” trend (in very large to large cities) and decentralization, while other regions maintain an “upward and eastward” pattern as people migrate to larger cities located in eastern parts of China.
This decrease in the pace of urbanization is common among developed countries, including the United States (Mu et al. 2022). While there is a steady stream of Americans migrating out of core cities and into suburbs, Golding et al. (2020) caution against declaring the end of urbanization in the U.S. The authors find that rural migration growth in the U.S. is dependent upon metro areas, with growth occurring in “exurbs” just outside metropolitan areas. They argue that the nation is still experiencing urbanization, a phenomenon extending beyond urban cores, and that previous research is misguided in its emphasis of decentralization.
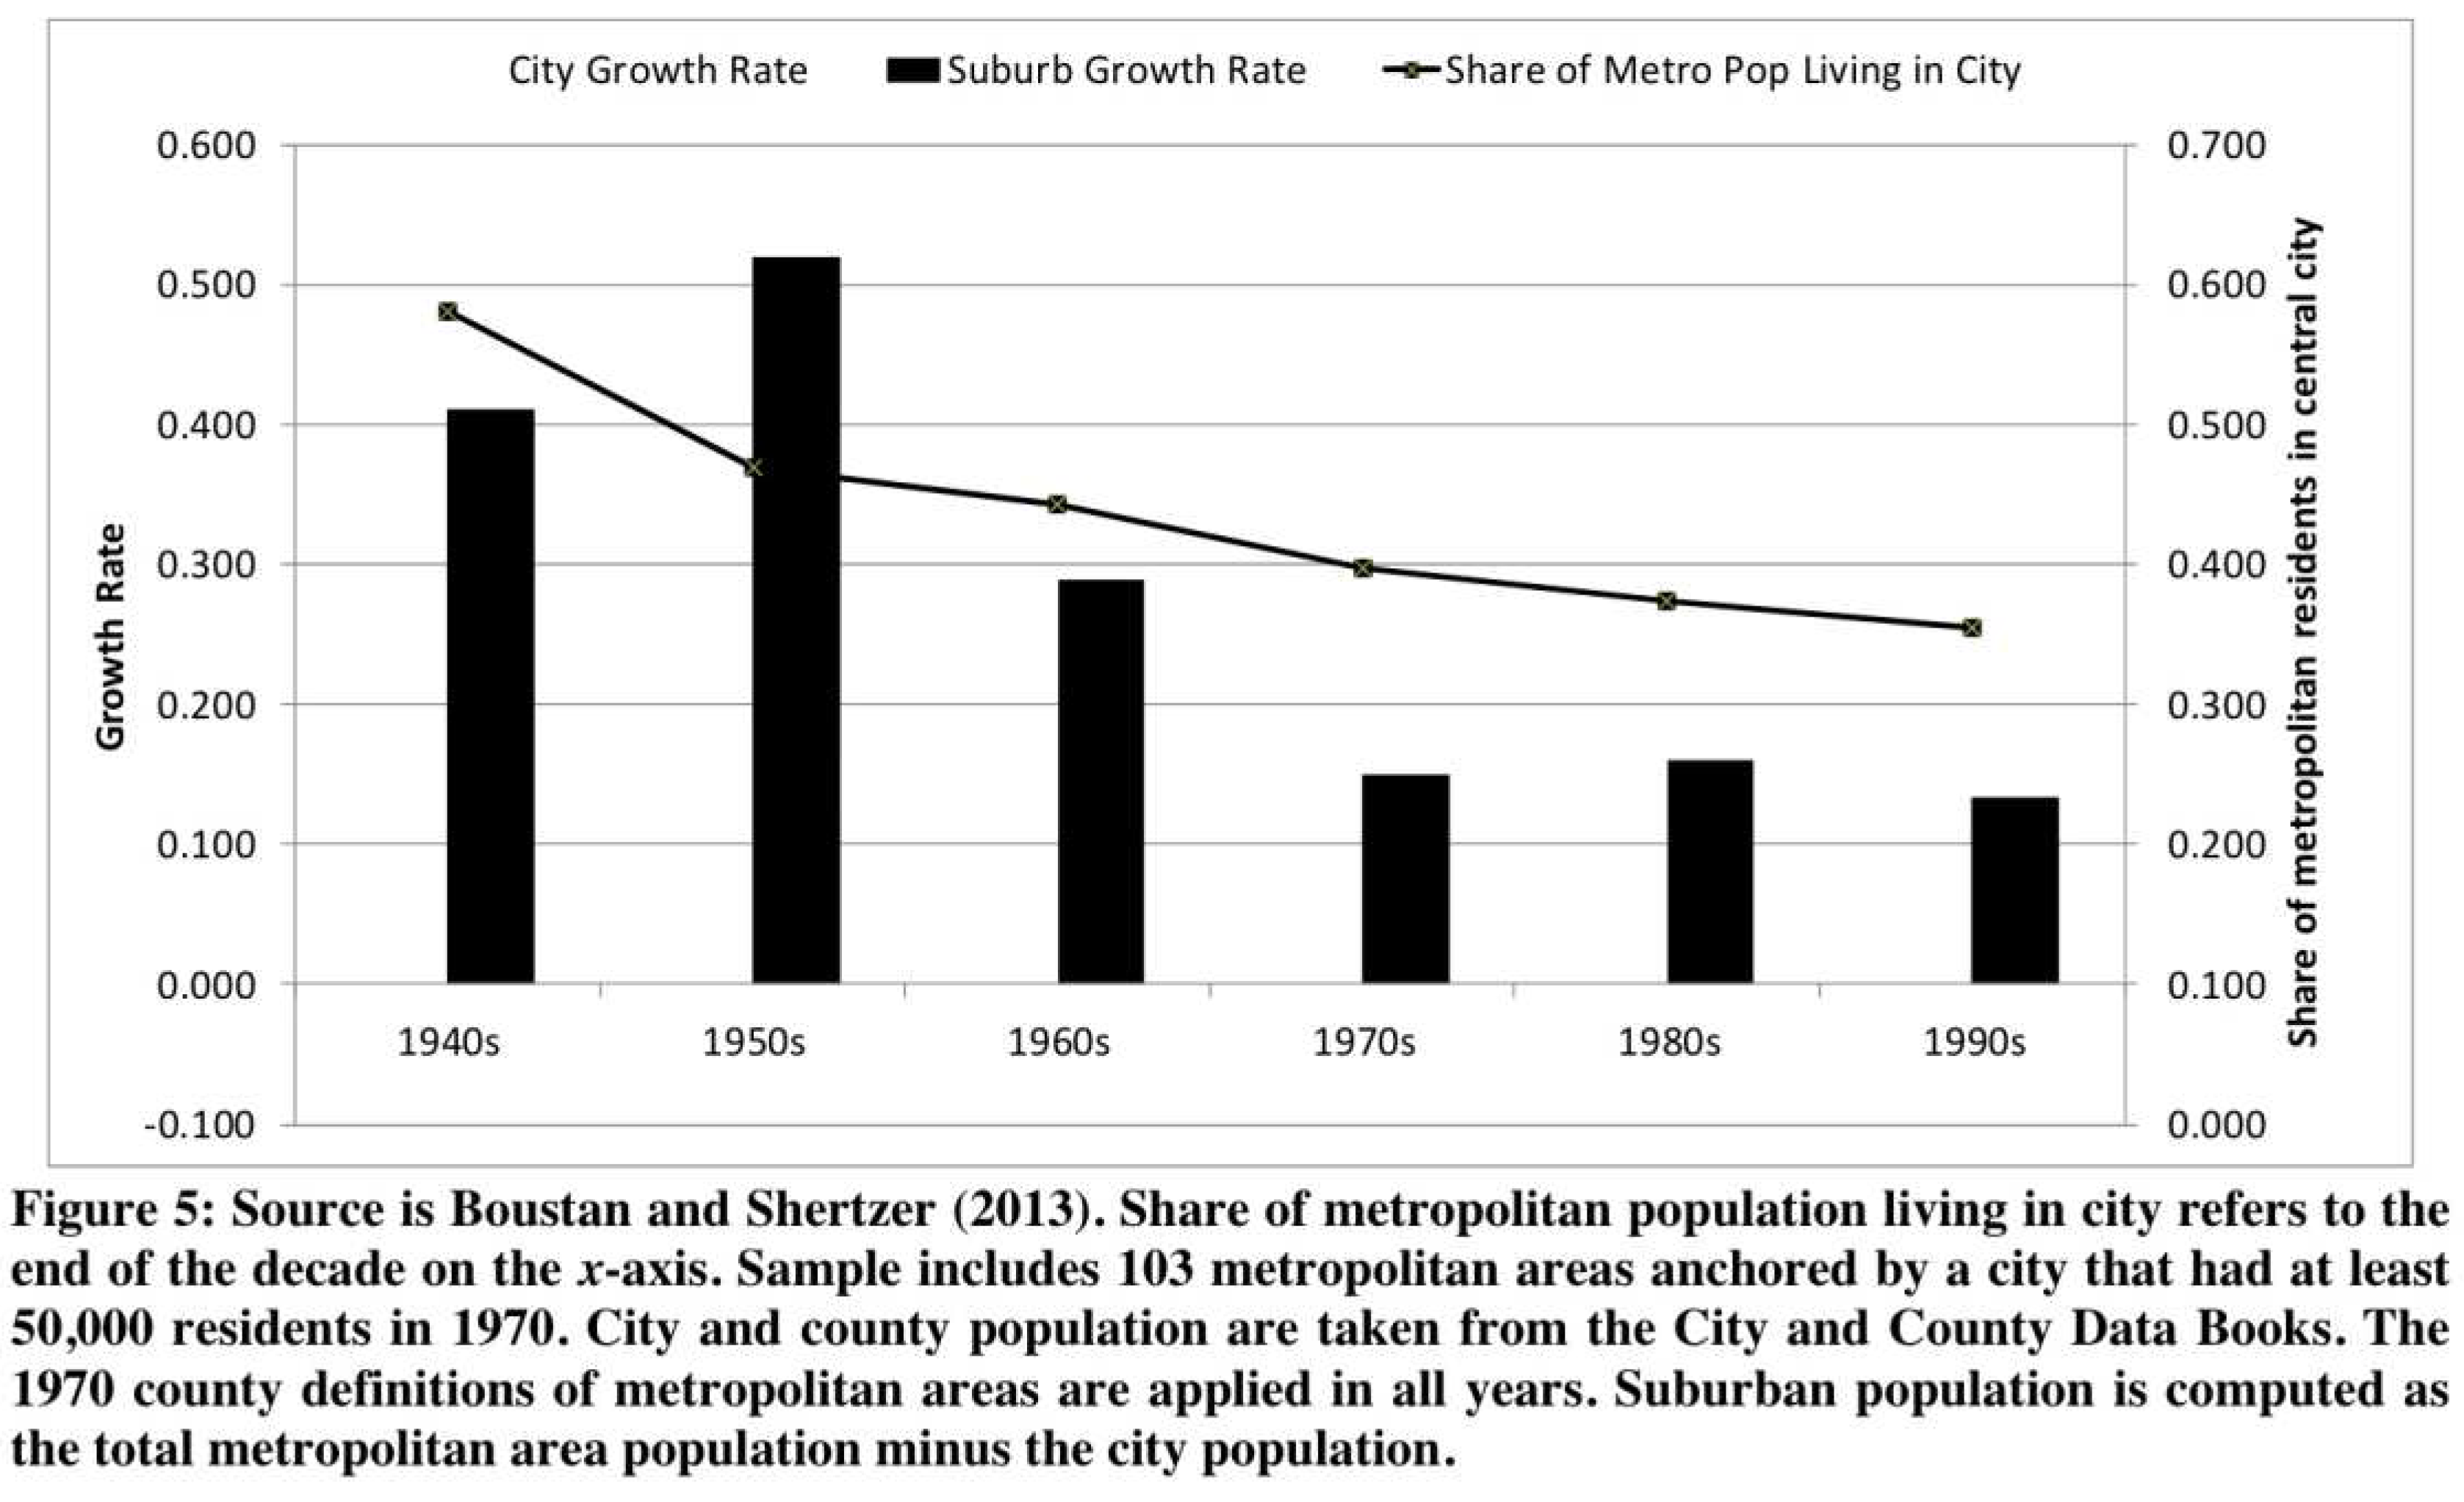
Figure 1.
Here: City and suburban population growth by decade, 1940–2000. [source: Boustan and Shertzer 2013].
Figure 1.
Here: City and suburban population growth by decade, 1940–2000. [source: Boustan and Shertzer 2013].
Motivations for Moving – Employment and Other Factors
Historically, scholars have looked at employment as the most prominent factor driving internal migration (Chen and Rosenthal 2008, Greenwood and Hunt 1989, Mangum 2020, Muth 1971, Shi et al. 2020, Yang et al. 2022). As Zhou and Hui (2022) argue some people move if there is a better job or better pay elsewhere. (Chauvin et al. 2017). A large number of former rural residents are working in Chinese cities and special economic zones with better-paying jobs often in manufacturing (Chan and Zhang 1999, Shi et al. 2020) and often working for U.S.-owned companies manufacturing for the U.S. market, so these internal populations trends are related.
In examining the continuous decline in U.S. migration, there are disparities in the rates of decline between certain types of relocation and population segments. Annual moves have diminished most at the local level (same county) and among renters (Frey 2017, U.S. Census Bureau 2017). As Frey (2017) mentions, local moves within a county are more likely to be related to changes such as marriage, growing families, and changing housing needs. These are life course changes which have shifted as more recent generations wait longer to pursue them.
For the first time in well over a century, young adults (age 18-34) were most likely to live with a parent as of 2014 (Chatterji et al. 2022). Millennials between the ages of 25 and 34 account for a disproportionately high percentage of moving adults, but the rate at which they are making short distance moves is its lowest in twenty-five years (Frey 2017). Chatterji et al. (2022) determined that the Affordable Care Act, with provisions allowing children to stay on their parents’ insurance plan until age 26, had a significant and substantial effect on the likeliness of young adults to be living with a parent.
Rising costs of living contribute to where people migrate, and it may factor into whether people choose to relocate or even have the ability to do so. A study conducted by The Federal Home Loan Mortgage Corporation indicates there have been steep declines in affordable (unsubsidized) housing for very low-income renters. In costly states such as California, even median-income households saw the number of apartments considered to be affordable, cut nearly in half between 2010 and 2016 (Schuetz 2017). Five years ago, the top 10% of counties with the highest housing costs (by % of income) accounted for one-third of the United States’ population growth. In 2021, those counties saw net losses in population, while counties with more modest housing costs experienced population growth (Gebeloff et al. 2022).
Geographic Immobility
Schewel (2020) argues there is a “mobility bias” in most studies of migration. Scholars consistently focus on patterns of migration and their catalysts, overlooking factors that create immobility and identifying themes for those who do not move or are stuck in place. Both economic and noneconomic determinants influence people’s propensity to move, and they contribute to racial and ethnic disparities in migration (Duca 2022). Minority households are less likely to migrate internally across relatively long-distances. However, Black and Hispanic households are much more likely to migrate within the county than White households (Duca 2022). Internal migration also increases with education, leaving workers who are less “skilled” and less educated stuck in cities with high unemployment rates (Moretti 2012).
Huang and Butts (2022) analyze the impact political partisanship, urbanization, and race had on intercounty migrations from 2011 to 2015, and they determine that these factors immobilize migration between dissimilar counties, a significant finding as the U.S. becomes more politically divided, with a large percentage of the U.S. population living in neighborhoods comprised almost entirely of residents who vote like them (Brown & Enos 2021). Huang and Butts (2022) propose the concept of segmented immobility and argue that internal migration is more relational than geographic because most people want to live near those who are similar to them along lines that are important to them.
Close to Home
The evolution of a nation’s cities plays a prominent role in migration patterns. “Fast locations” – those with high resident turnover – produced much of the United States’ migration in the late 20th century as they experienced rapid growth (Coate et al. 2019). This included metros such as Las Vegas, Phoenix, and Miami. As the number of native-born people increased in these locations and populations’ roots grew deeper, with more people identifying as “from there”, attachment increased, and gross out-migration declined. Coate et al. (2019) argue that growth in “home attachment” accounts for a majority (roughly two-thirds) of the United States’ internal migration decline (Coate et al. 2019, Mangum 2020).
Furthering the notion of home attachment, research shows that most adults live in close proximity to their mother for most of their life course (Choi et al. 2021). There are also racial differences in the distance from which blacks and whites live from their mothers, with black adults living significantly closer (< 5 miles) than white adults (approximately 10-15 miles) and demographic and socioeconomic factors accounting for much of the difference (Choi et al. 2021).
Findings
Internal Migration Trends in the United States
American geographic mobility is at its lowest rate since the U.S. Census Bureau began tracking migration with the Current Population Survey in 1947. While some may point to the crash of the housing market and the ensuing financial crisis of 2008, the annual percentage of households relocating has been decreasing since the 1990s. For clarity, a household relocation consists of its resident(s) moving to a new place of residence. Before the year 2000, an average of 16% of American households moved annually, and 11-12% changed residence at the turn of the last decade (2010). This rate fell below 10% in the 2017-2018 survey, and by 2021 the U.S. saw a historic low of 8.1% of households relocate. Of those who relocate, 43% cite “housing reasons”, followed by “family related reason” (27.9%). 18.5% moved for employment (US Census Bureau 2021 ACS).
While internal migration rates continue to decline, this is not evident for all types of relocation. Intercounty moves, interstate moves, and intra-county moves have each seen different trends in recent years. Over the last decade, the numbers of intercounty and interstate moves have remained relatively steady, according to the Census Bureau’s American Community Survey. At the close of the decade, and before the COVID pandemic, there was a considerable increase in intercounty moves within the same state. In fact, the number of intercounty moves in 2019-2020 exceeded 7 million for only the second time since 2006-2007, just before the housing crash. Although the trend for interstate migration had been relatively flat for most of the decade (less than 15% of moves, on average), by 2020, three consecutive years of decline resulted in moves to different states hitting a historic low. However, interstate moves are the only type of moves that increased during the first half of the pandemic (2020-2021).
Most moves are local and within the same county. This segment has been declining since 2014, at an especially steep rate since 2017, with an average of -7.5% same county moves than the year before. The number of local, in-county moves had declined by almost 25% by the end of the decade (2020) and accounted for 60% of domestic relocations, compared to 69% at its start.
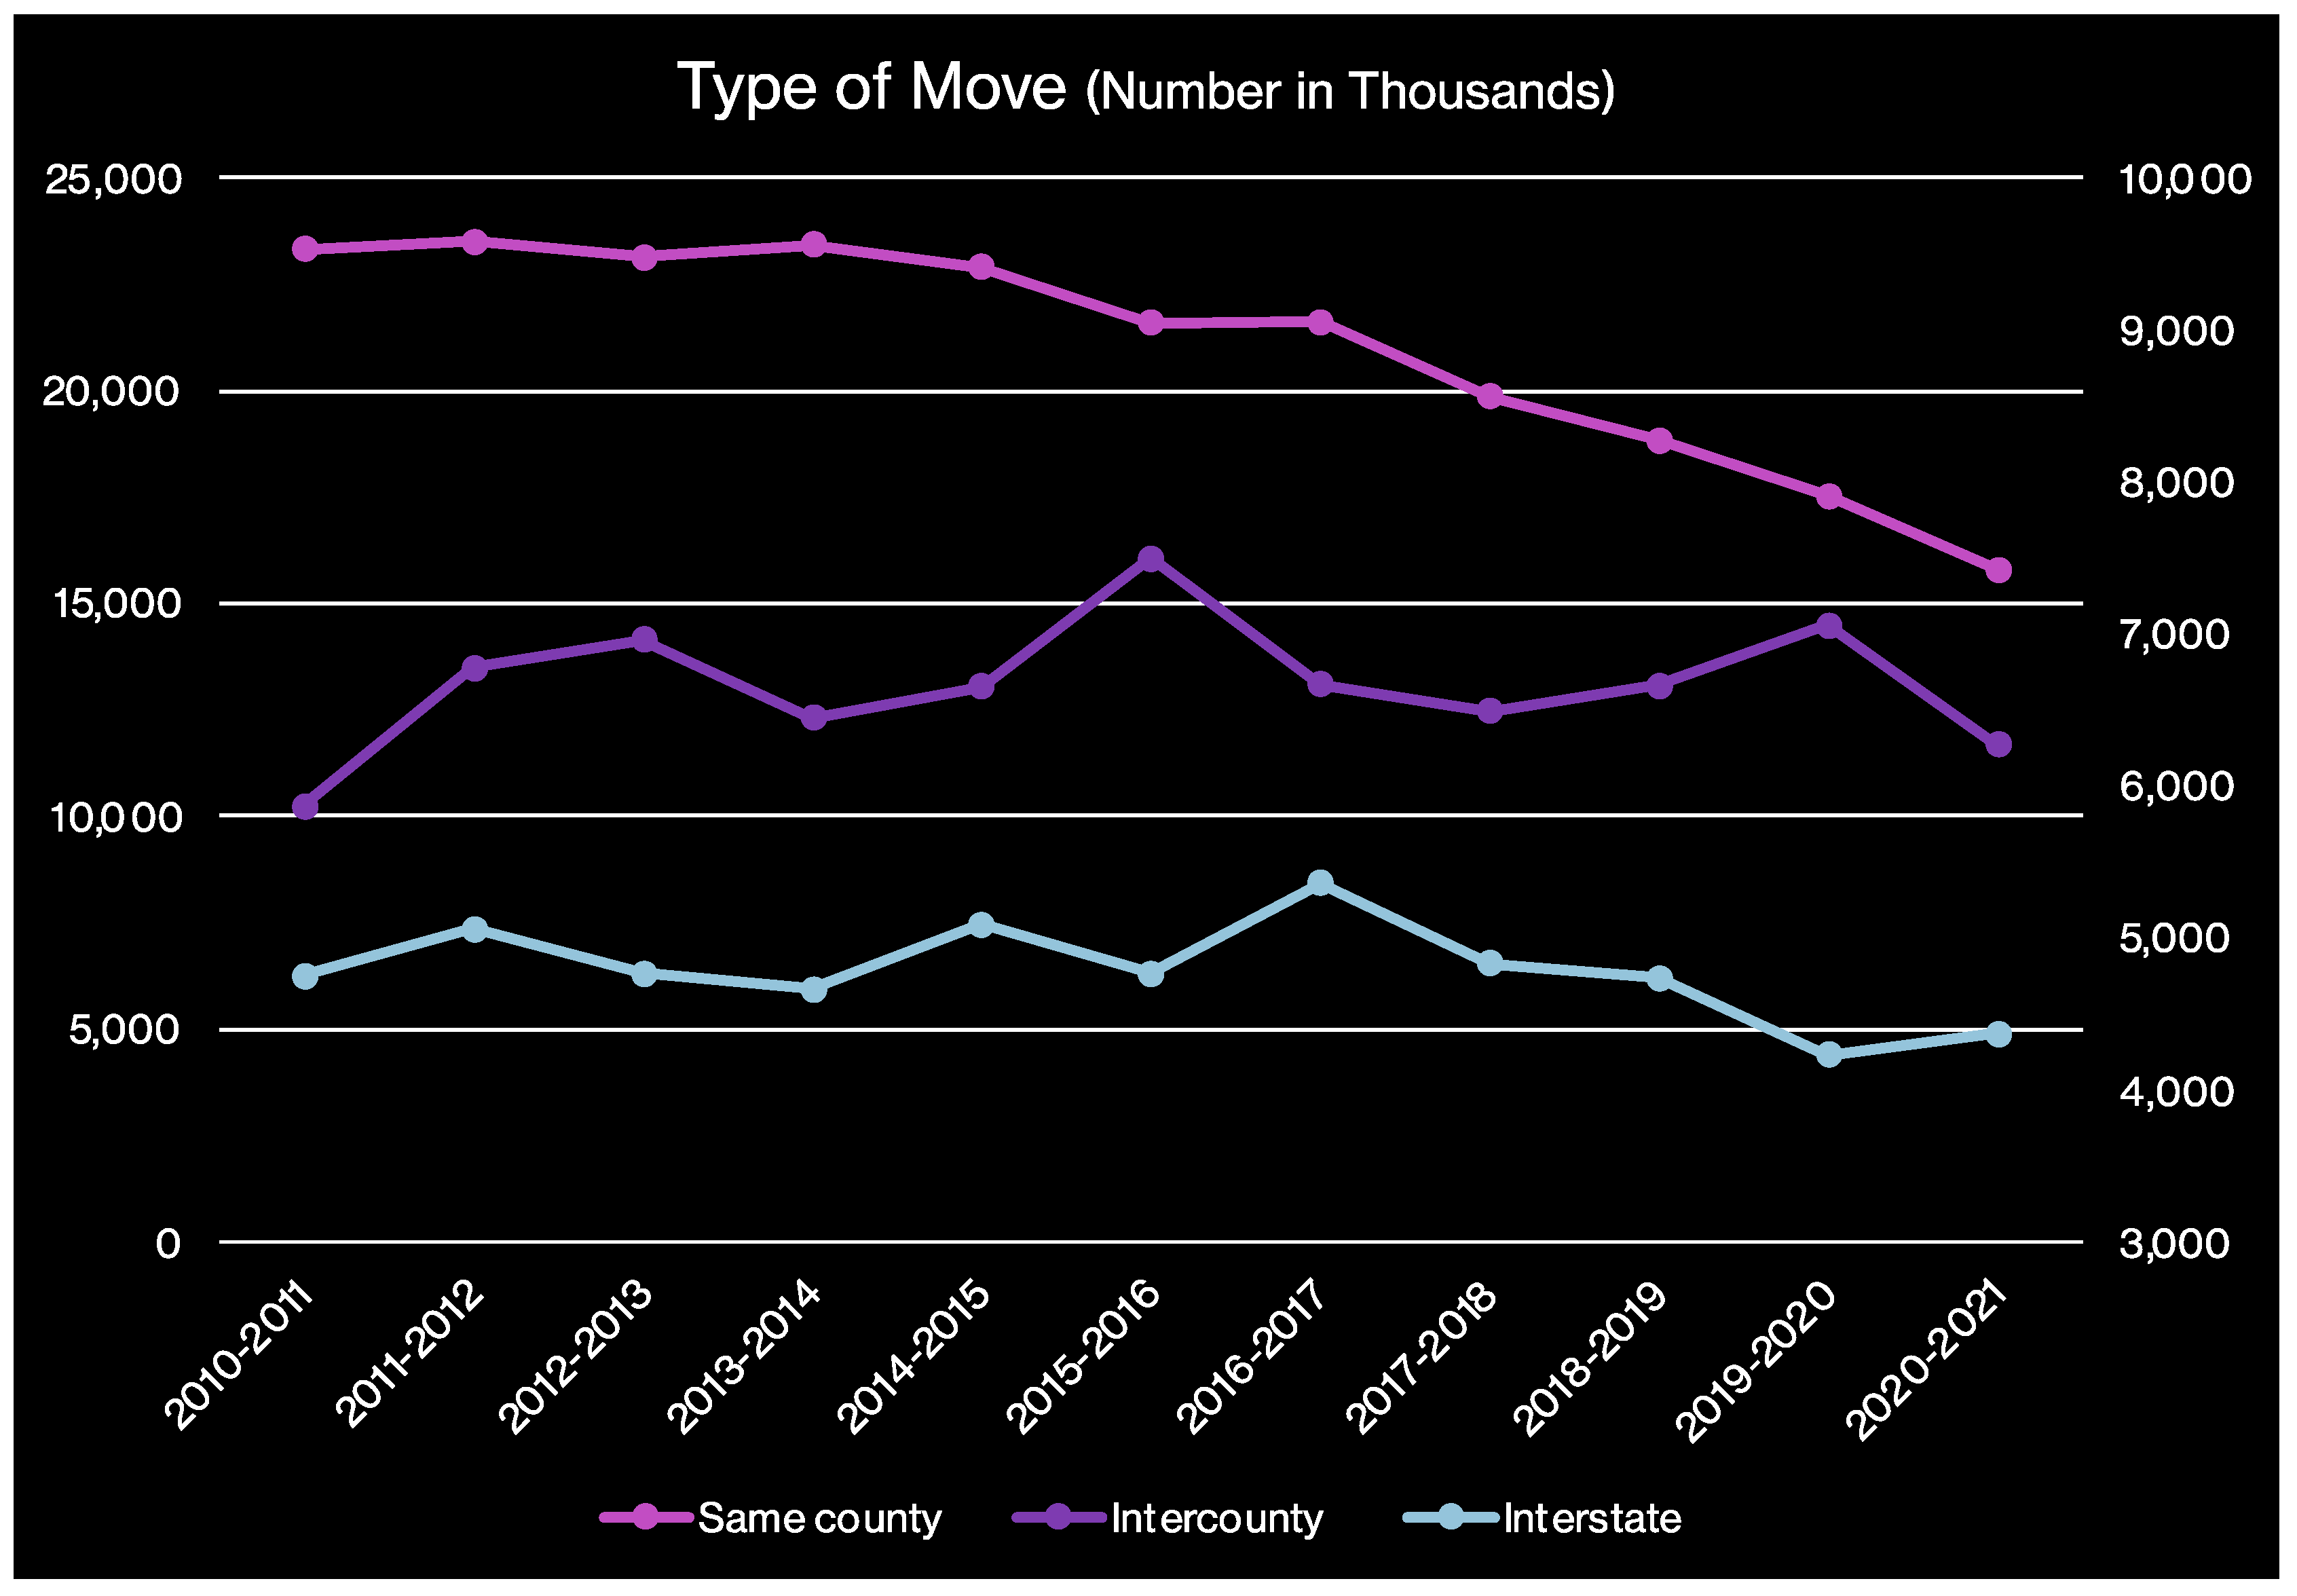
Figure 2.
Here – Type of Move. [source: Joshua Dietz analysis of U.S. Census Bureau, Current Population Survey, Annual Social and Economic Supplement 1948-2021).
Figure 2.
Here – Type of Move. [source: Joshua Dietz analysis of U.S. Census Bureau, Current Population Survey, Annual Social and Economic Supplement 1948-2021).
Housing – Owners vs. Renters
Relocation also varies between renters and homeowners. According to Census Bureau statistics, renters have historically accounted for the majority of annual moves, making up between 60-70% of total relocations each year. While most moves (60%) continue to be renters, this segment has quickly declined since 2016, when it accounted for 70% of relocations. At the beginning of the last decade, 25% of renters moved each year, declining to 17% by 2020. Just 15.6% of renters are estimated to have moved based on the 2020-2021 Current Population Survey, while the rate of relocation for homeowners, approximately 5%, has not changed for more than a decade.
Perhaps an increase in homeownership can offer some explanation for the decline in mobility among renters. There were approximately 80 million renters in the U.S. at the turn of the millennium. This number steadily increased until 2016, when it peaked at a historic high of over 108 million. The number of homeowners reached a high of 208.2 million (68.5% of pop.) before the housing crash, after which it dwindled to 204 million in 2015 (63.5%). The CPS estimates total homeowners surpassed pre-recession levels by 2017, setting a new high of 208.5 million. By 2020, there were more than 222 million homeowners (65.6%), while, in a few years, the number of renters had fallen by 9% to 100 million.
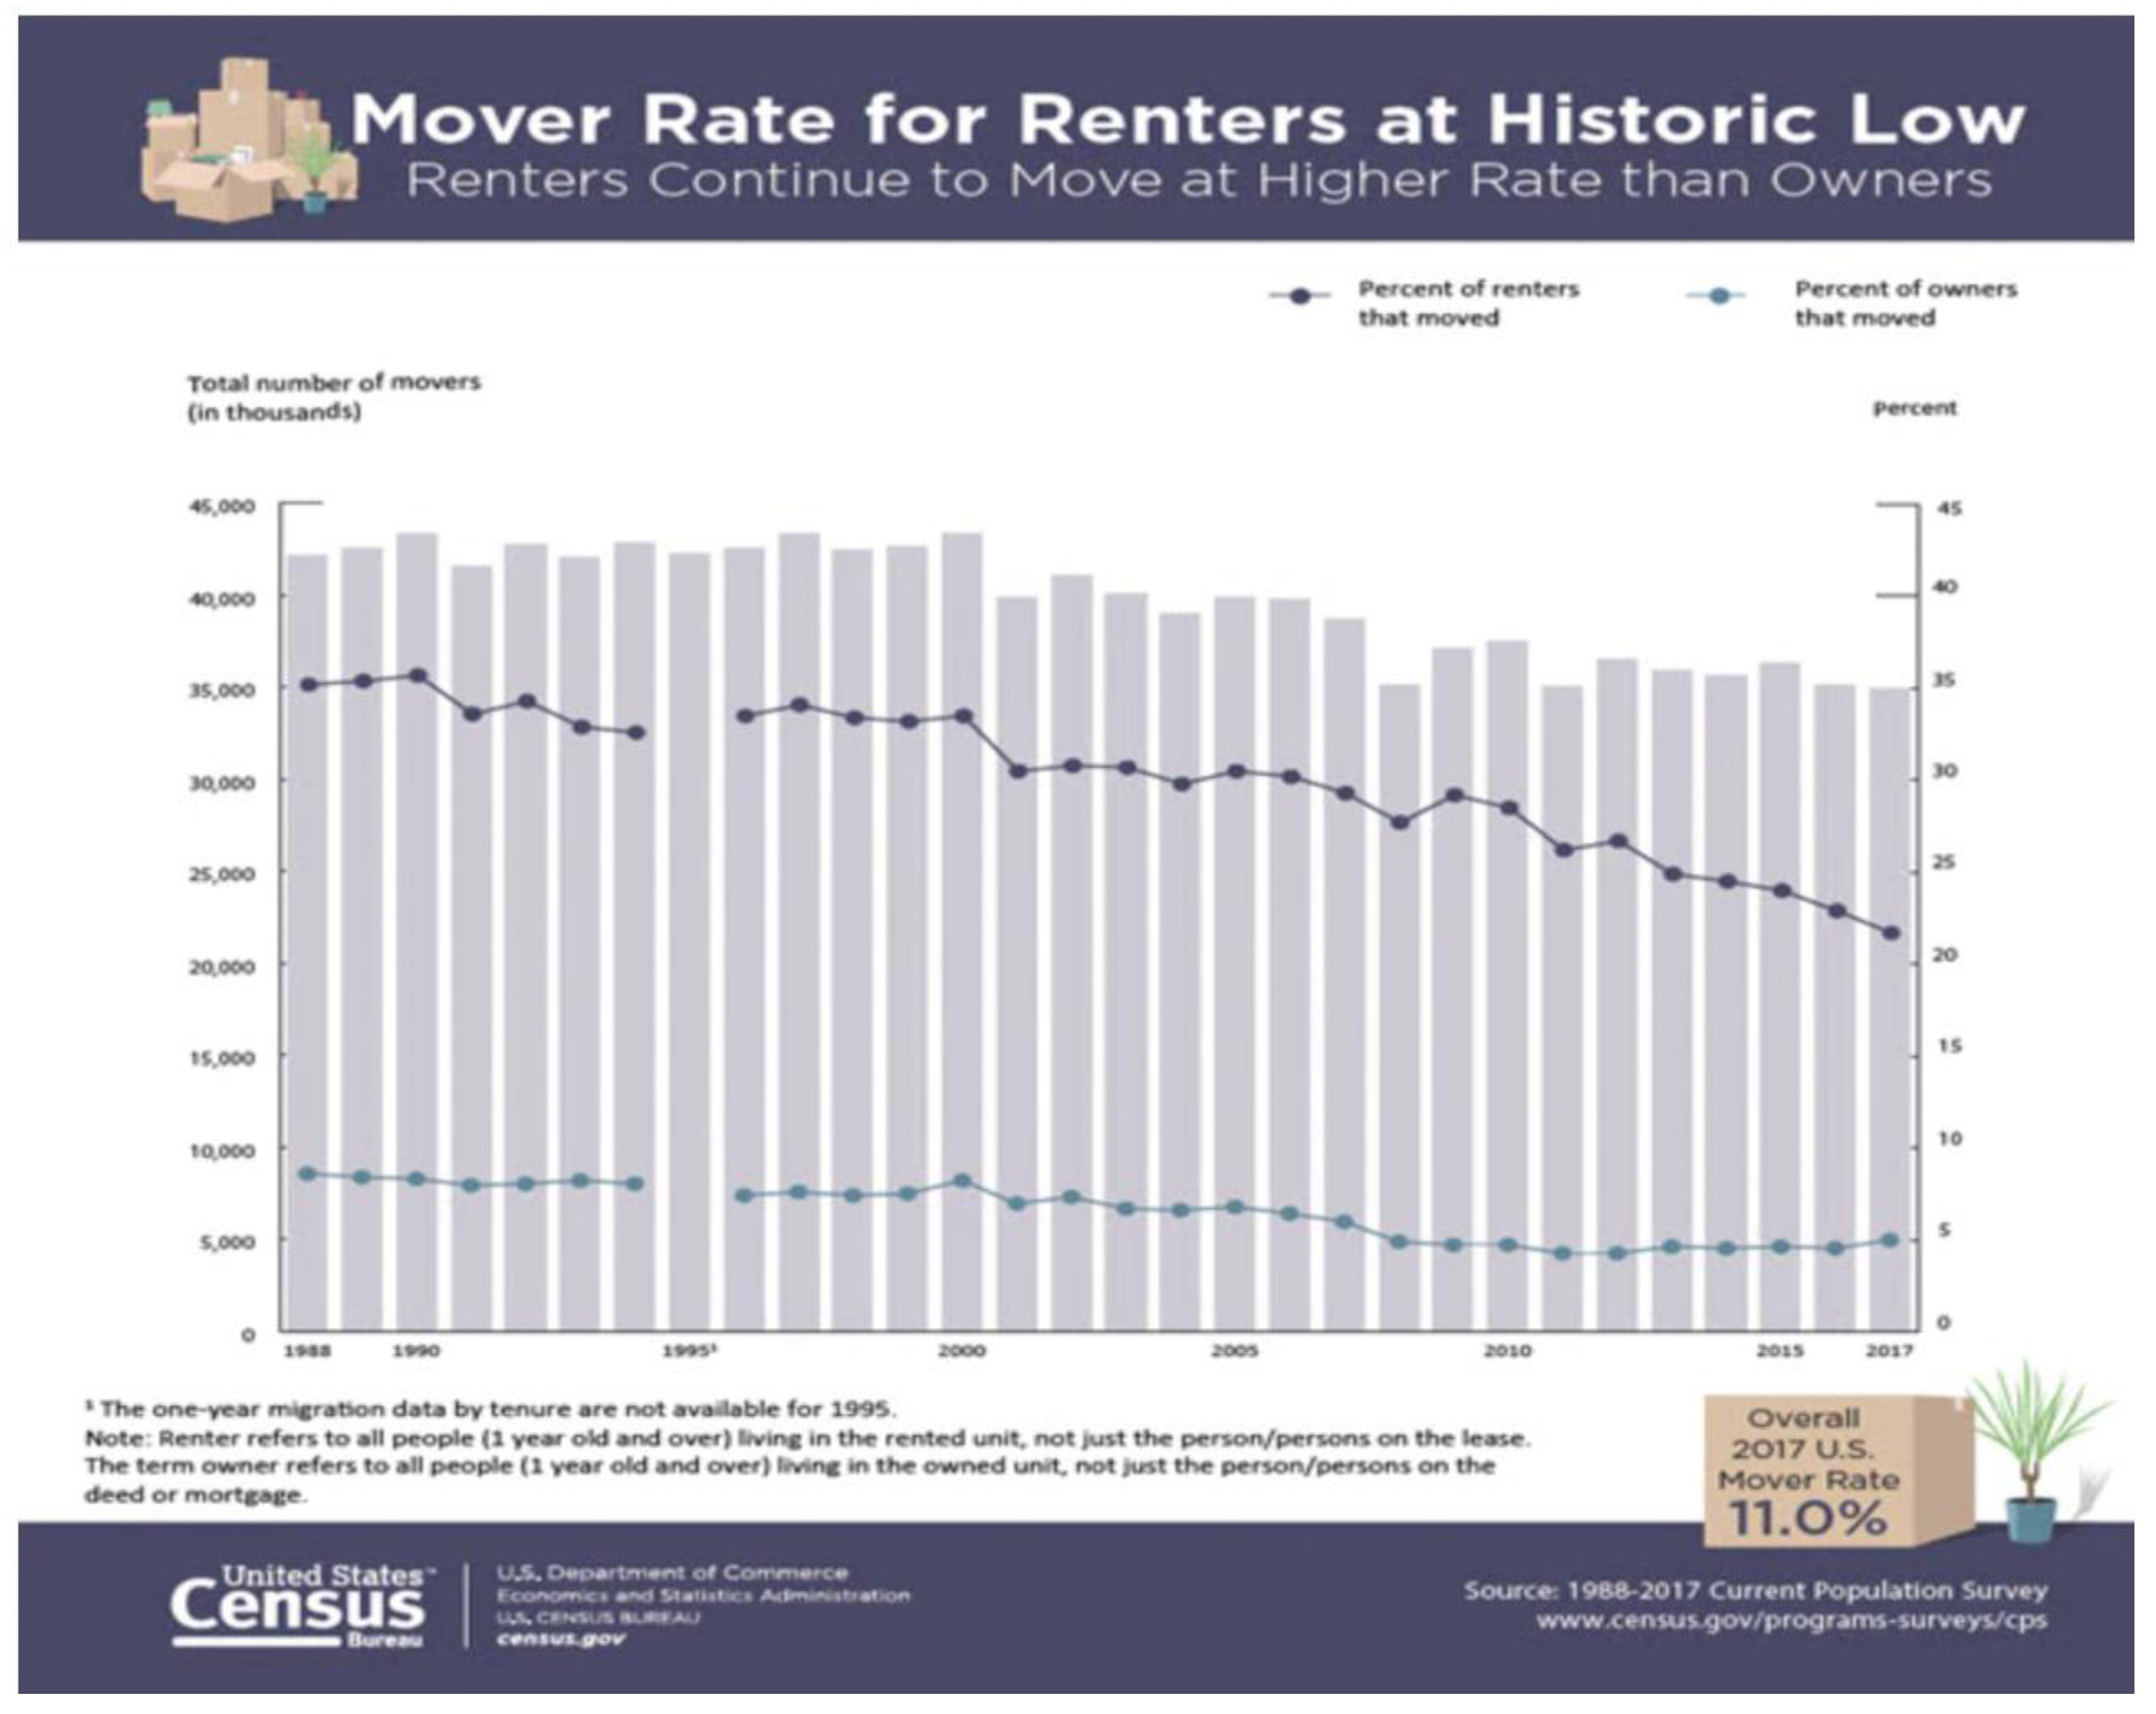
Figure 3.
Here – Mover Rate for Renters. [source: United States Census Bureau 1988-2017 Current Population Survey].
Figure 3.
Here – Mover Rate for Renters. [source: United States Census Bureau 1988-2017 Current Population Survey].
The Role of Discrimination and Racial Disparities
Housing discrimination, in various forms, may contribute to patterns of extreme decline among local and renting movers, especially in an increasingly polarized U.S. society. The National Fair Housing Alliance’s (NFHA) 2018 report states that the number of complaints of housing discrimination reported to private nonprofit fair housing organizations in 2017 was the highest since the alliance began tracking in 1996. In 2018, it jumped to more than 23,000 reports, a 13% increase over 2017 (Abedin et al. 2018).
It may be difficult to confirm hypotheses regarding the growth in complaints of housing discrimination – is it a result of policy, a more politically and racially charged society, or something else? Interestingly, in the first week of 2018, the department of Housing and Urban Development (HUD) revoked the Affirmatively Furthering Fair Housing Rule, implemented in 2015 as a way to more effectively enforce components of the Fair Housing Act of 1968, ensuring that communities receiving federal funds were proactively assessing and addressing issues of discrimination and segregation.
Annual fair housing complaints have remained at more than 21,000 since 2019. In 2020, the NFHA filed suit against Redfin, a national real estate company, alleging that Redfin discriminates against communities of color in its refusal to serve homes below a minimum price, a modern form of redlining (Augustine et al. 2021).
Exploration of internal migration along racial lines, specifically by moves within county and rental statistics, provides a strong case for further research. According to data from the 2021 American Community Survey (U.S. Census Bureau 2021), Black people and Hispanics make up a disproportionate share of renters (19.4% and 20.5%, respectively). 49.7% of renters are non-Hispanic Whites, who make up approximately 60% of the population. Black and Hispanic populations are also much more likely to relocate at a local level (within county) than Whites, and their decline in local moves has been greater than that of Whites (US Census Bureau 2010-2021 American Community Survey). In 2010, 12.8% of Blacks and 12.5% of Hispanics moved within the same county, compared to 7.9% of Whites (non-Hispanic). By 2019, those percentages were down to 9.4% and 8.3% for Blacks and Hispanics, but still 6.8% for Whites and most of the decline for the latter occurred after 2015.
Moving Outward: City Migration (2010 – 2021)
In addition to the frequency of relocation, the U.S. has seen a shift in where people are moving. For decades, Americans have been leaving “principal” cities, those anchoring metropolitan areas, and moving outward into their suburbs (Buaster & Shertzer, 2013). In the last decade, these cities have seen a higher number of people moving out than moving in each year.
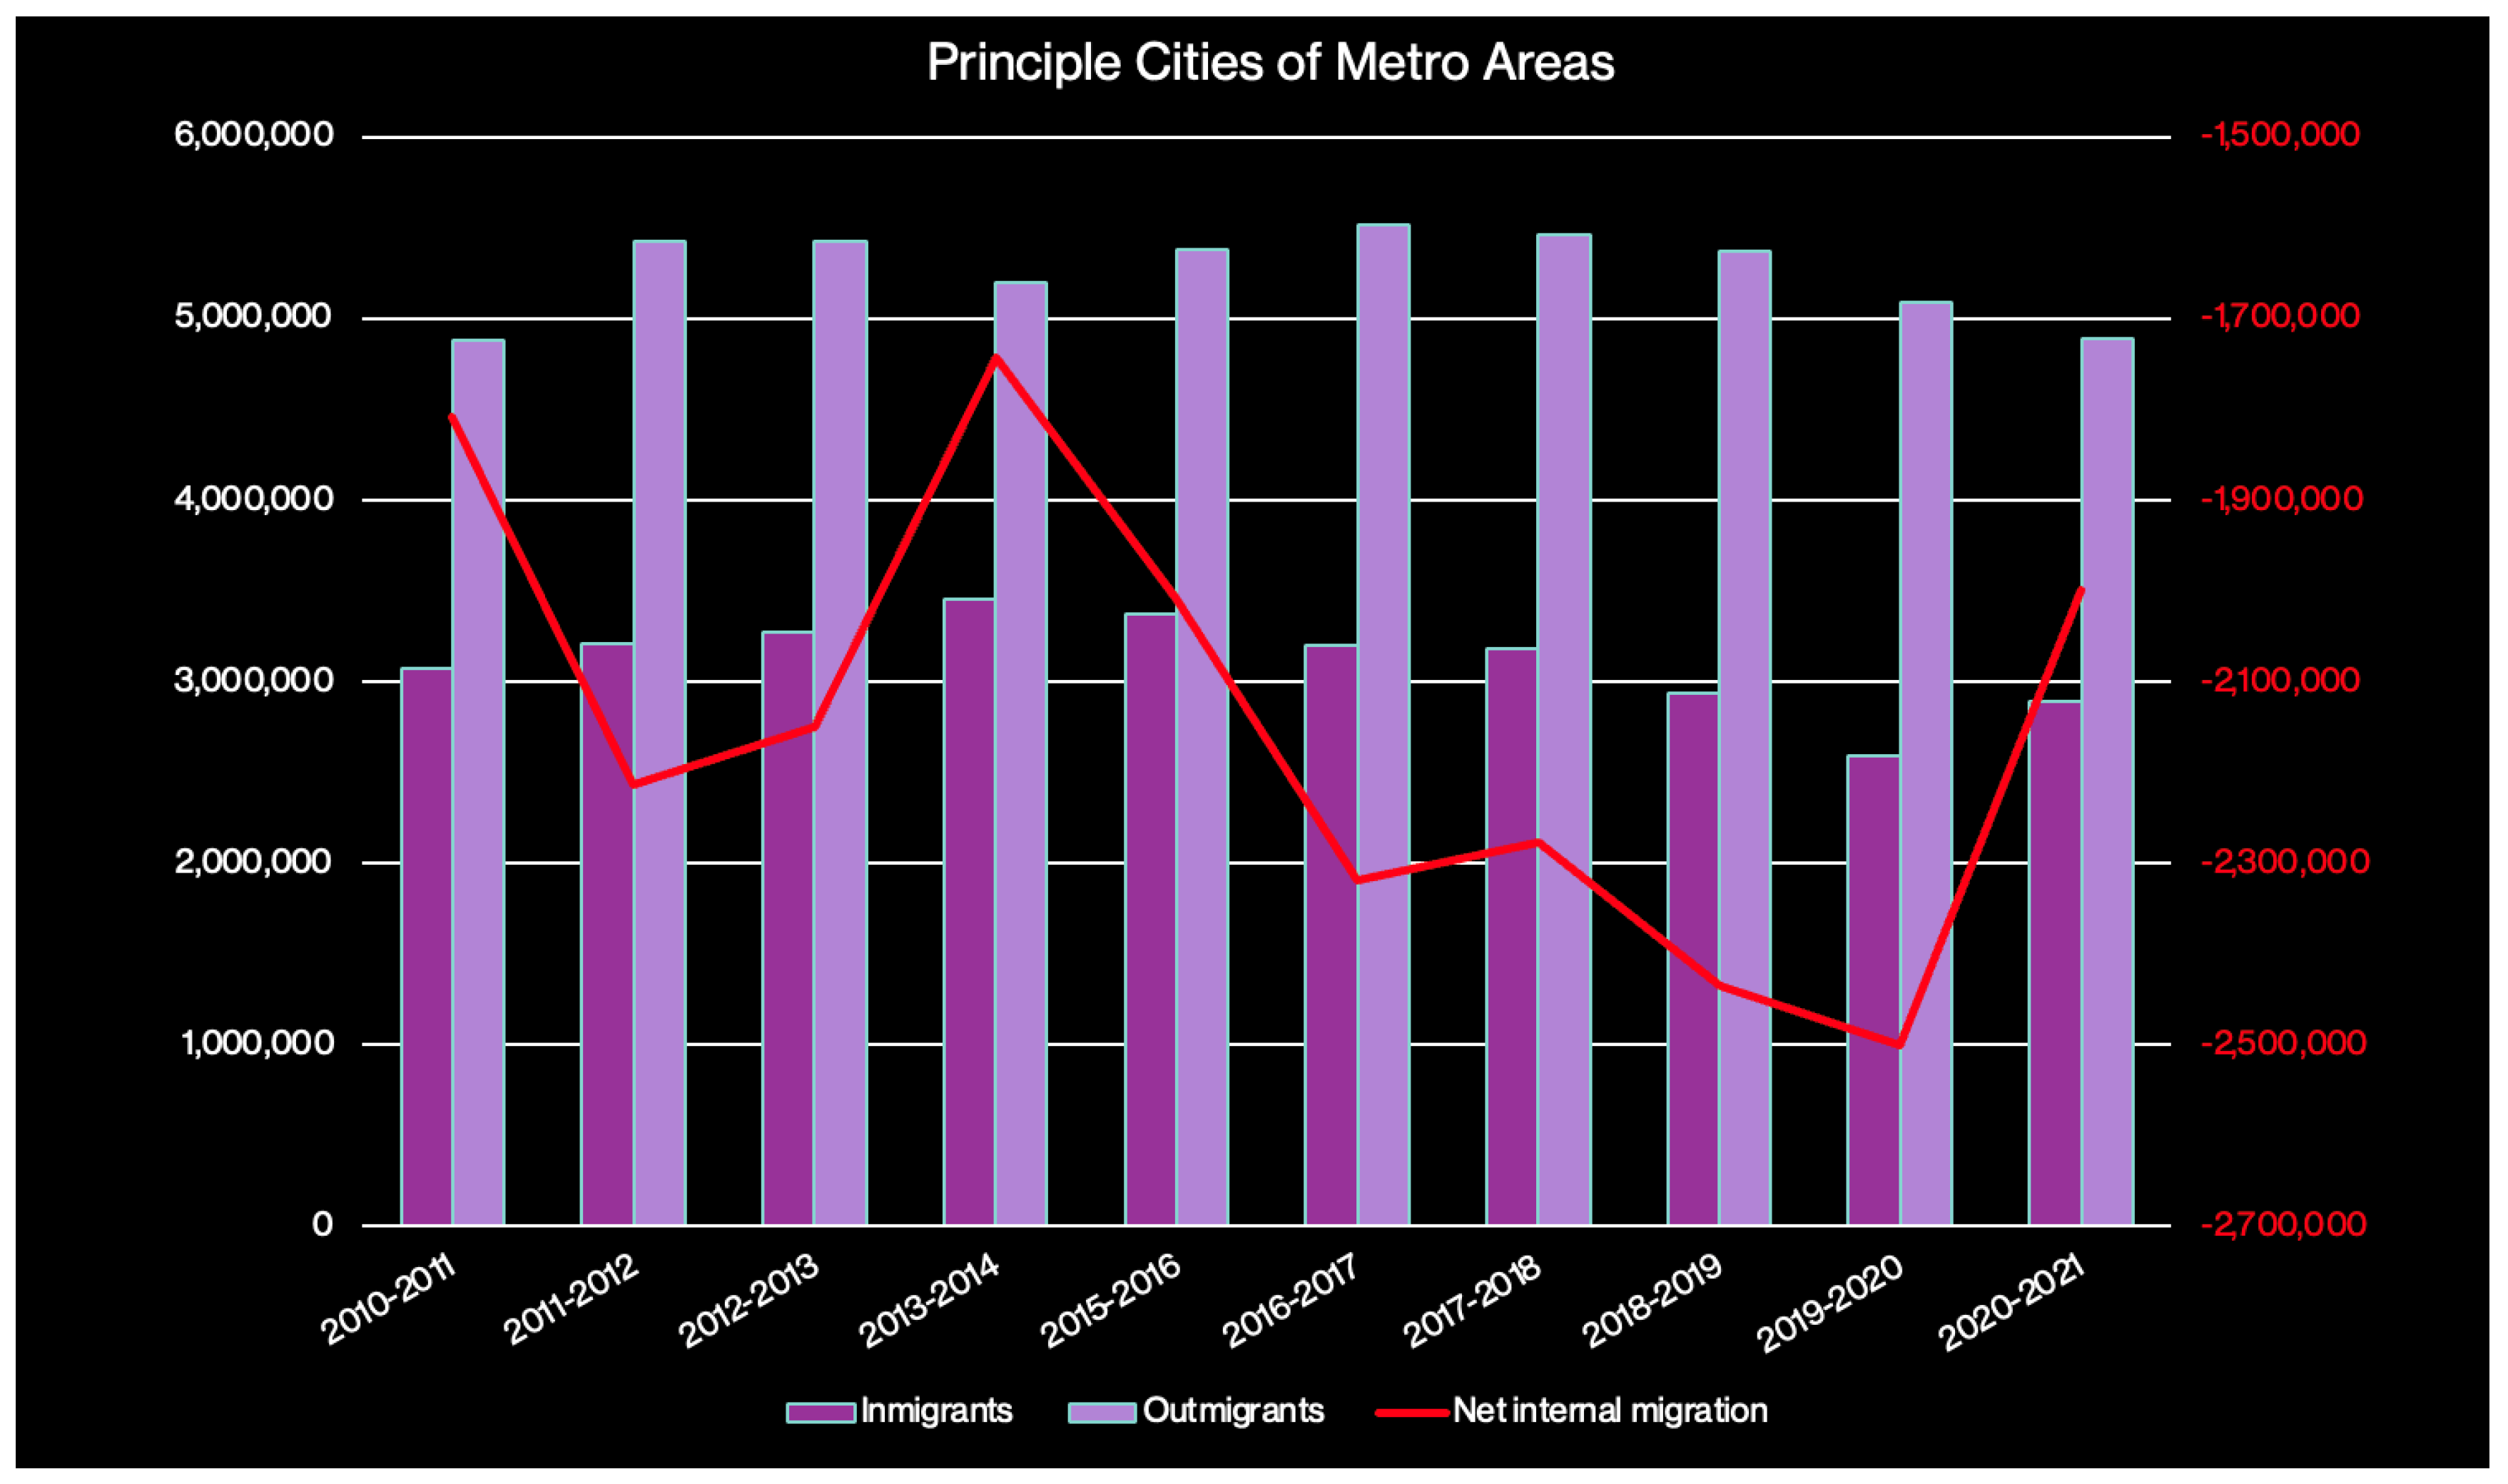
Figure 4.
Here – Principal Cities of Metros. [source: Joshua Dietz analysis of U.S. Census Bureau, Current Population Survey, Annual Social and Economic Supplement 1986-2021).
Figure 4.
Here – Principal Cities of Metros. [source: Joshua Dietz analysis of U.S. Census Bureau, Current Population Survey, Annual Social and Economic Supplement 1986-2021).
This is the aggregate trend; there are surely cities that are exceptions, but the data is telling. In the last 5 years, U.S. cities have seen an average annual decline of -2.3 million migrants, and suburbs have, on average, gained 2.3 million people annually. The largest metros in the U.S. have been experiencing a consistent net loss in migration, not just their principal cities; 6 of the 10 most populated metros are seeing annual loss. New York, Los Angeles, Chicago, and Philadelphia metropolitan areas have been declining for more than a decade, while Washington D.C. and Miami metros have begun to decline in the last 8 years. Conversely, the Dallas, Houston, Atlanta and Phoenix metro areas have seen net growth each year since 2010.
“Sticky” and “Magnetic” States
As geographic mobility in the U.S. continues to slow, and some of the largest metros shrink, it is worth examining states and how settled their populations are. Some states are more “sticky” – retaining a higher percentage of their native residents – than others. According to the Census Bureau’s 2019 American Community Survey, the stickiest state is Texas, with an impressive 82% of residents born in-state still living there. North Carolina, California, Georgia, and Florida round out the top 5, with between 73 – 75% of their native populations residing in-state.
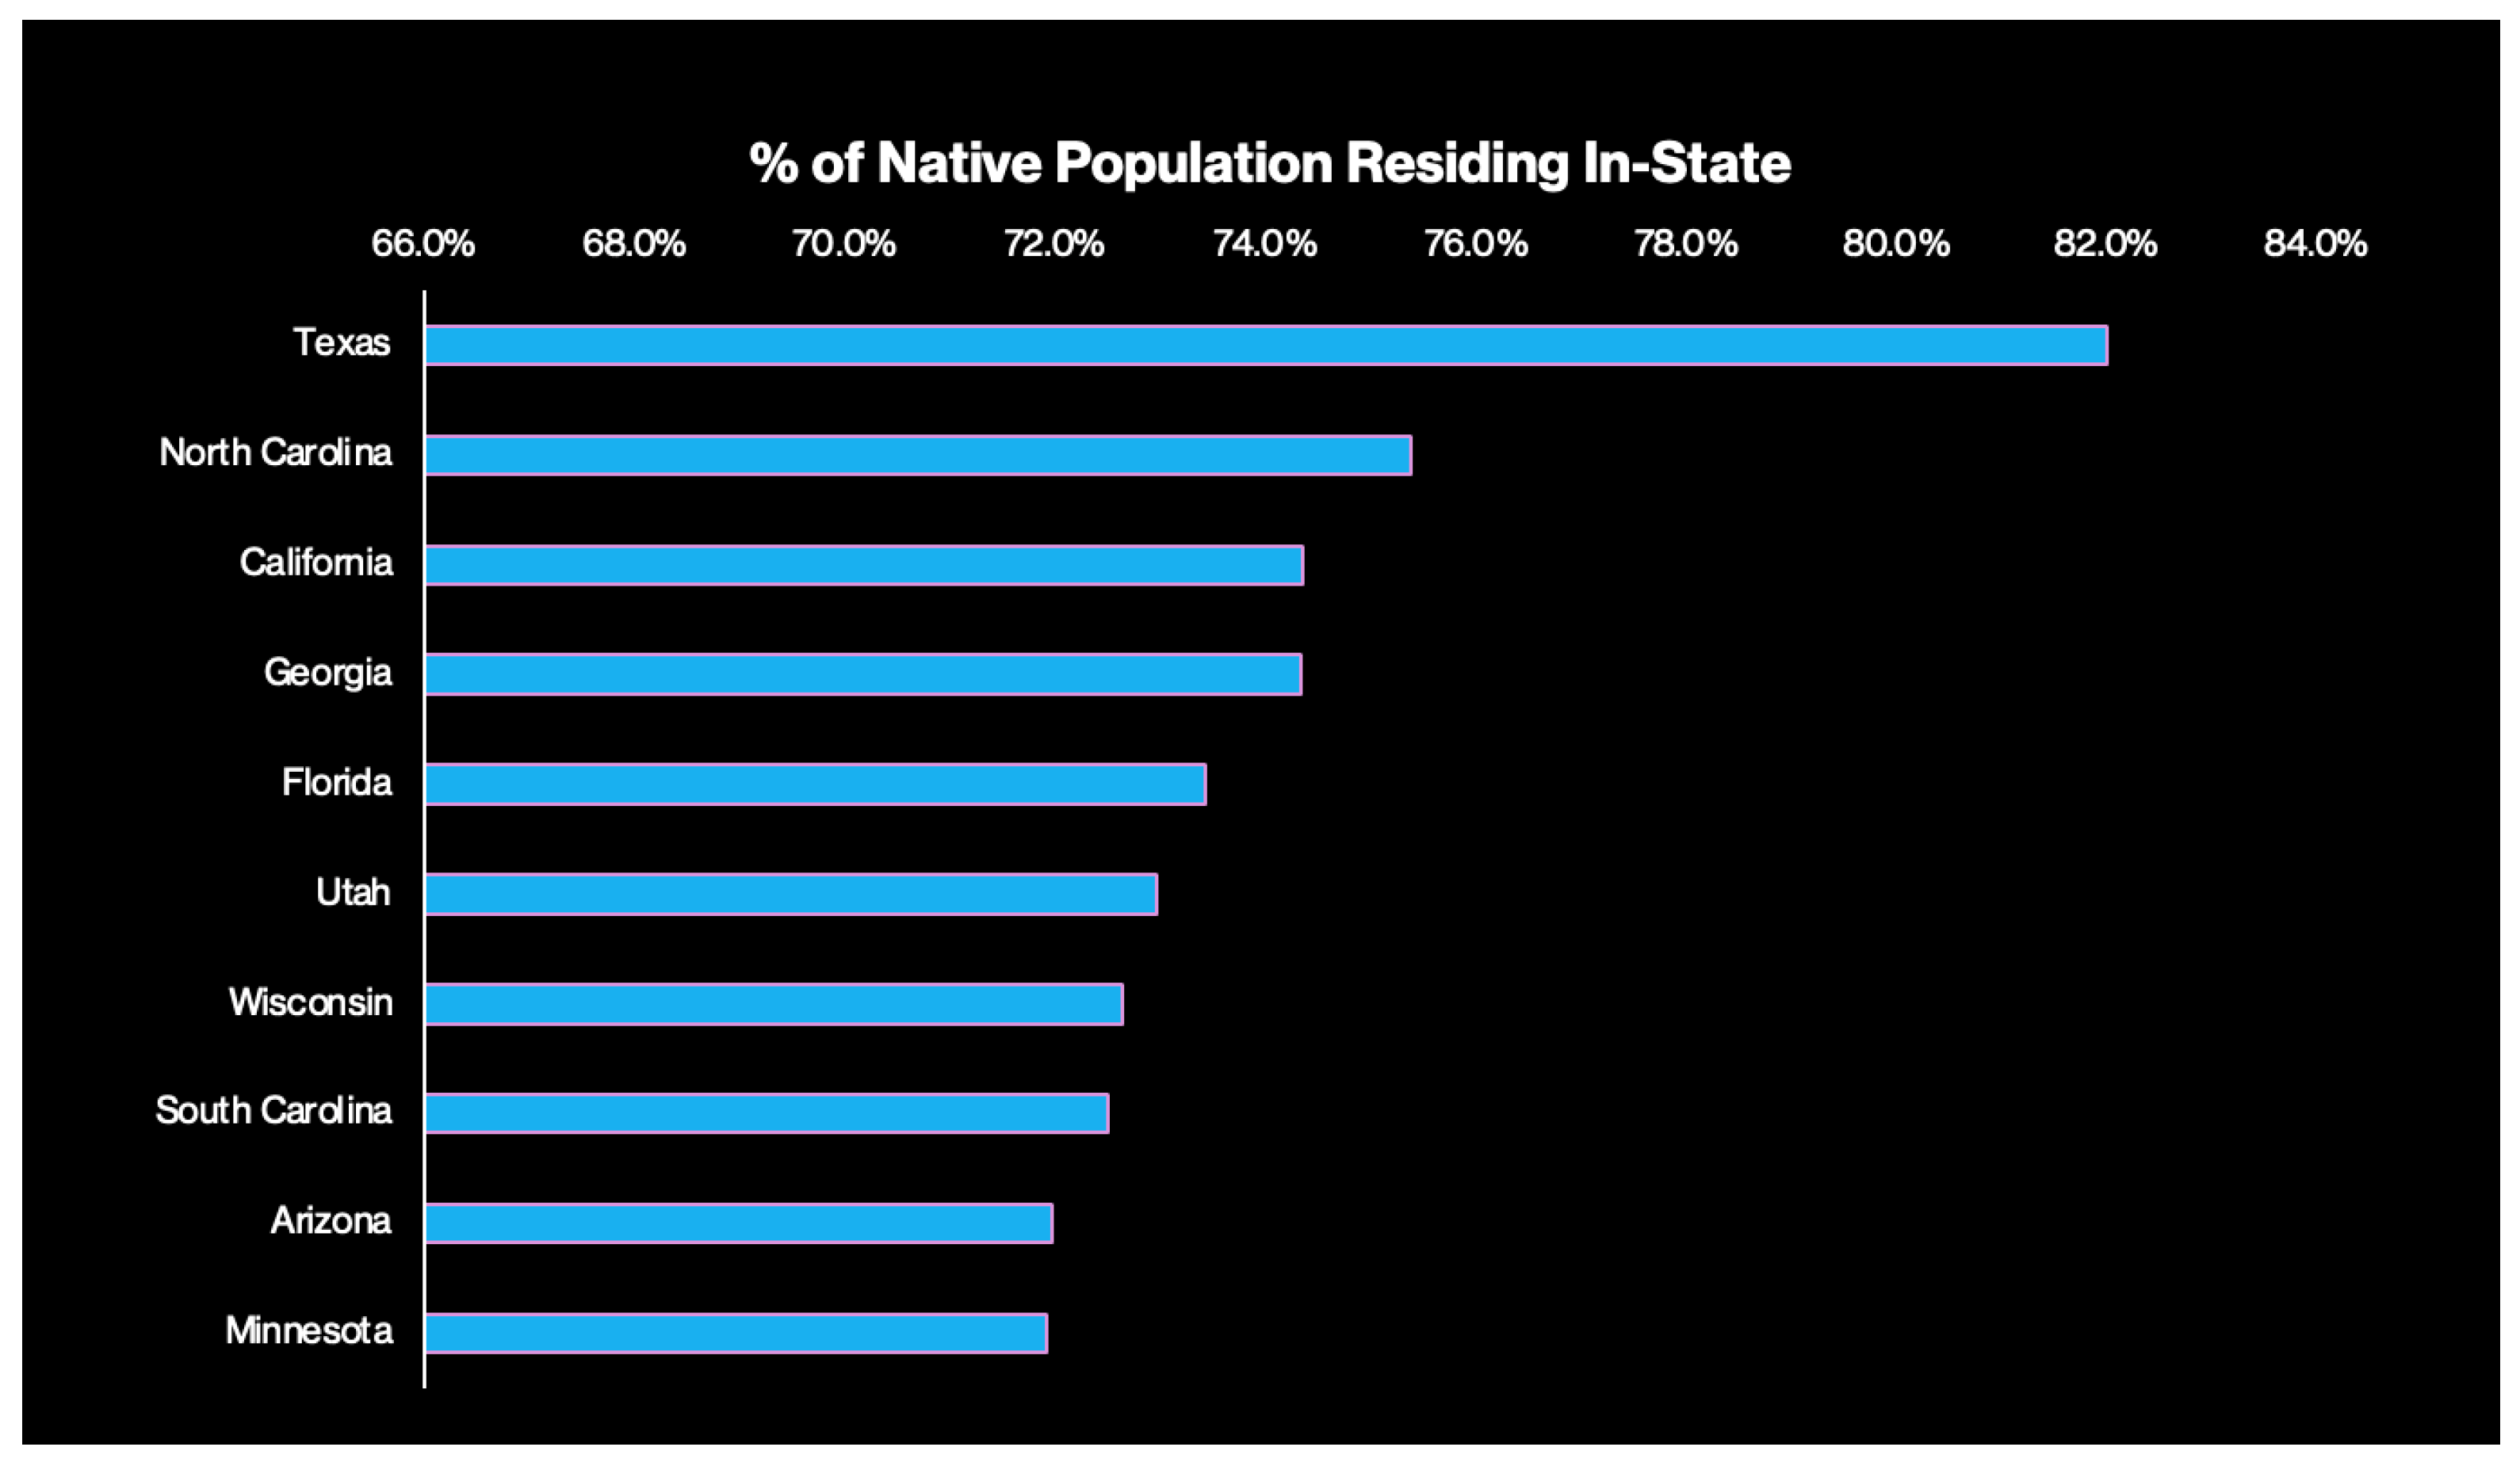
Figure 5.
Here – Native population %. [Source: Joshua Dietz analysis of U.S. Census Bureau, 2019 American Community Survey].
Figure 5.
Here – Native population %. [Source: Joshua Dietz analysis of U.S. Census Bureau, 2019 American Community Survey].
Conversely, some states may not be sticky but attract a high percentage of residents born in other states. Nevada is the most “magnetic” state, with an astounding 72% of the population born elsewhere. Florida also has an exceptionally high percentage of its residents born out-of-state (64%), followed by Arizona (60%), New Hampshire (59%), and Colorado (58%).
As American internal spatial mobility continues to slow, it is evident that the highest declines are among short-distance moves (within a county) and renters. People are moving out of core cities and into surrounding suburbs, while many are leaving the nation’s largest metros altogether. At the same time, housing discrimination is on the rise, making it more difficult for some people to relocate.
Internal Migration in China
On the other side of the globe, the world’s second-largest economy has drastically transformed over the last 30 years, resulting in quite different trends and increasing internal migration. However, analysis of migration trends in China can be challenging. Household relocation rate, which measures the rate at which people are changing residence in a certain period, is not possible because China officials do not offer data comparable to that provided by the U.S. Census Bureau. Research about the housing relocation rate in China is limited; the census data in China only provides information related to population size and source of relocation in administrative districts. This cannot meet the needs of intra-urban relocation studies, and scholars generally use questionnaires to obtain research data despite being time-consuming and laborious (Song 2015). Related empirical studies mainly focus on several big cities such as Beijing, Guangzhou, and Shanghai (Sun 2021).
With limited empirical data, researchers in China have come to a consensus on several conclusions. One finding is that the increase in the housing relocation rate is highly associated with China’s transformation from a planned economy to a market economy. From the 1980s to the early 1990s, the scale of relocation was relatively small, with involuntary factors such as unit allocation, retirement, demolition, and long-distance job changes dominating the relocation process. In non-market economies, the ability to move depends on housing availability and eligibility for housing, both of which depend on housing policies (Sheng 2014). Before the hukou reform, cities in China were limited by various regulations on the planning economy, and internal migration was relatively low. Research from the mid-1990s shows the reason for housing relocation was mainly passive – the distribution of houses from the danwei (work unit) system was an important factor (Hou 2014).
Floating Population
An alternative measure for assessing China’s internal migration is the so-called “floating population,” those who live somewhere other than where they hold household registration (Jizhe 2021). As a nation historically more settled and rural (Shide 2022; Textor 2022), China has seen a huge shift as its population has become more mobile and urban. The 1990s produced an explosive increase in the “floating population” (Shide 2022), which mostly consists of rural workers migrating to work in Chinese cities.

Figure 6.
Here – Floating Population. [source: Pengpai Research Center 2021].
According to Pengpai Research Center (2021), using data from the National Bureau of Statistics, China’s floating population increased by nearly 600% between 1990 and 2000. From 2000 – 2010, China’s floating population increased by another 53%, with an additional 11% by 2015. The next 5 years saw an average annual decline of -1.5% before exploding by 59% as of 2020. The impact of the pandemic becomes the natural question here. There were 4 million less rural migrant workers in cities in 2020, the first decline in at least a decade (-2.3%), likely a result of shutdowns and personal safety decisions. With that in mind, it is a logical possibility that the spike in floating population is a result of people with hukou in the city relocating to less densely populated areas, for similar COVID-related reasons as rural migrant workers.
Many Cities, Many Migrants
Hukou reform, along with economic transformation and an abundance of urban jobs, has resulted in China’s urbanization rate skyrocketing over the last 25 years. In 1995, just 29% of the population lived in urban areas. This increased to more than 40% by 2005, and, as of 2011, China had more urban than rural residents (51%) for the first time in history (Textor 2022). Today, nearly 65% of China’s population resides in urban areas, compared to 82% of the U.S. population.
According to the Organization for Economic Co-Operation and Development, in 2010 there were 643 million Chinese living in 127 metropolitan areas with populations greater than 1.5 million people. There are only 11 metropolitan areas fitting that description in all of the United Kingdom, France, Belgium, the Netherlands, Spain, Portugal and Switzerland (Chauvin et al. 2017). Based on the 2020 census and hukou data, Chan (2021) estimates that about half of the population in the four “first-tier” megacities (Shanghai, Beijing, Guangzhou, and Shenzhen) were migrants. Their deep analysis of data from the 2010 census also revealed that 44% of the population in cities with over five million people were migrants, and the majority migrated from rural locations.
As more of China’s population has relocated to cities, some cities and regions have attracted migrants more than others, as hukou requirements and benefits vary between cities, depending on population and economy (Zhang and Lou 2019; Zhou 2020). Yang’s (2017) study on the impact of household registration system reform indicates that, between 2000 – 2014, cities in the eastern region gained roughly 135% more migrants than those in the middle of the country and roughly 245% more than cities in the western region. The study also revealed that smaller cities, with populations between one million – two million people, experienced the greatest growth during that period. The Bureau of Statistics’ data from the seventh national census (2020) shows the provinces/regions with the largest proportion of floating populations are the Yangtze River Delta (15.9%), Guangdong (13.9%), Zhejiang (6.8%), Jiangsu (6.3%), and Henan (5.6%).
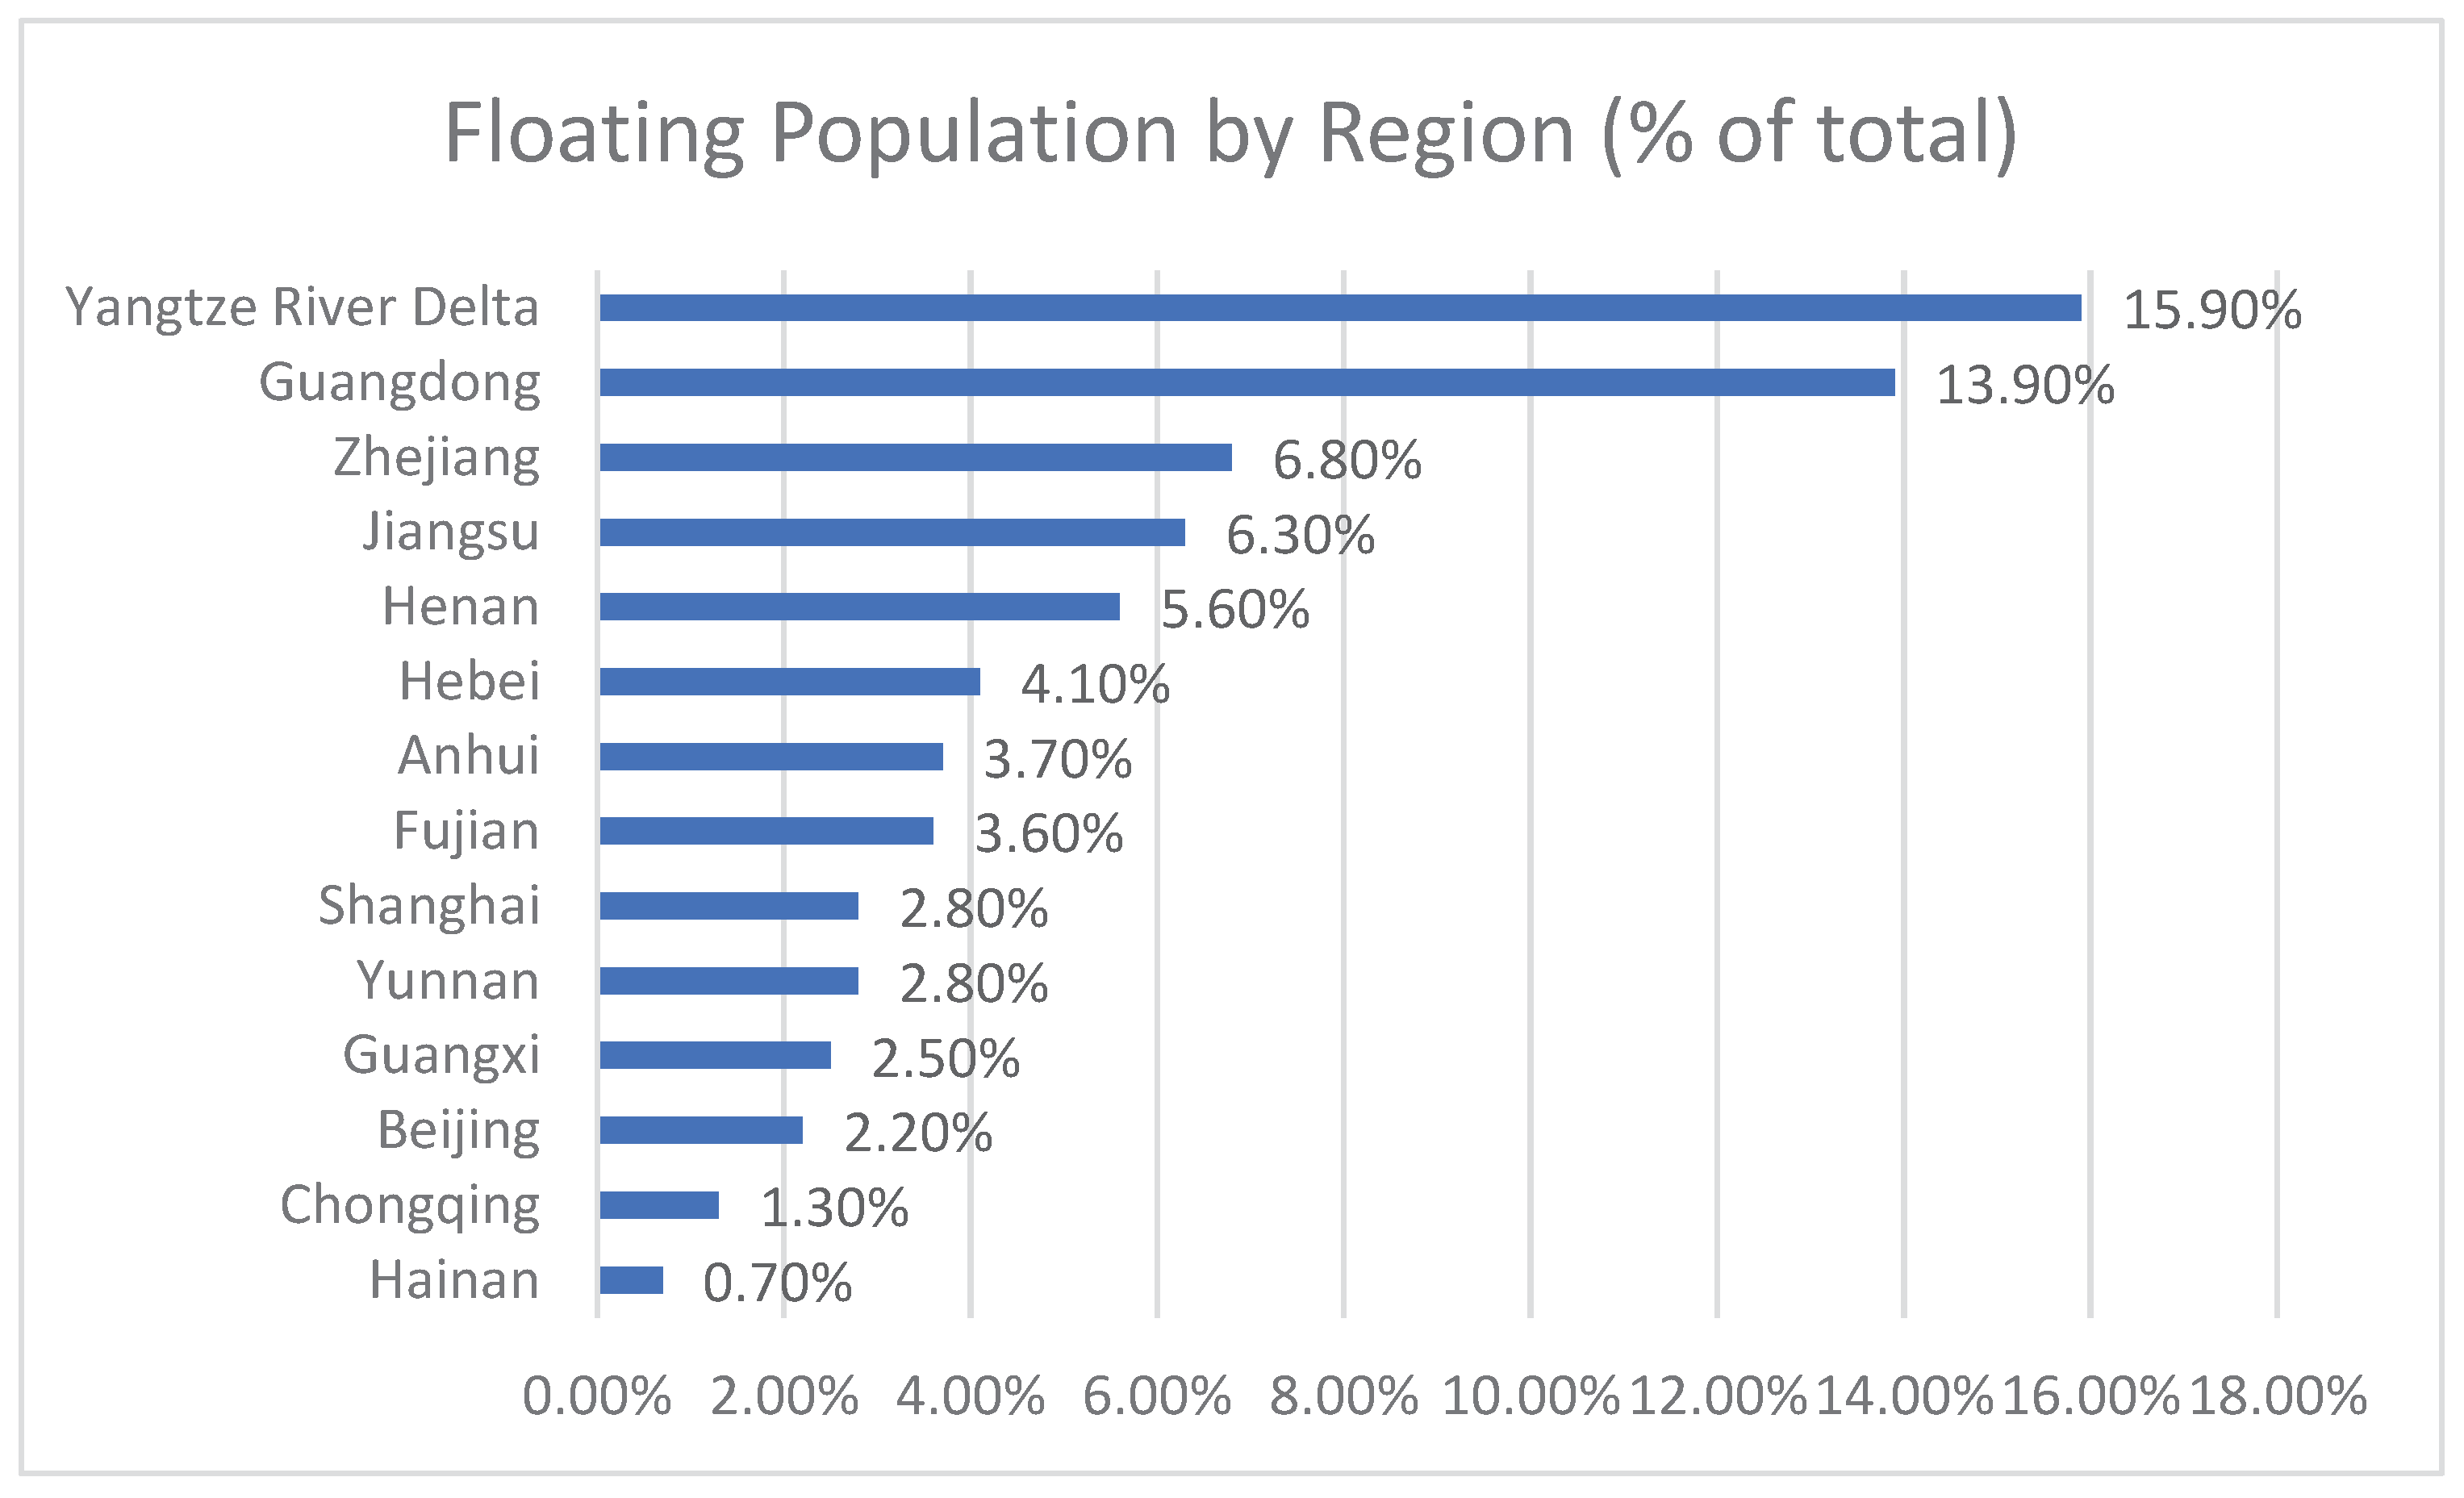
Figure 7.
Here: floating population by region. [source: the 7th national census, 2020].
Hukou Status and Tenure
Research carried out in Shanghai revealed the impact hukou status has on people’s relocation rate. Citizens with local hukou relocate at a consistent rate, while the relocation rate is rising rapidly for those whose hukou registration is in another jurisdiction t, especially after 2010. For people with hukou changes, the most common reason for relocation is “change to a better house” and “old house was demolished”, while people without hukou cite moving for better jobs (Sun 2021). People originally from outside the city have a higher yearly relocation rate than local people (Liu & Yan 2007).
Due to the limits of the hukou system and the legacy of planned-economy public housing, renters are mostly people from other places, the “floating” population, and they are only authorized to rent. These populations have higher relocation rates than those with local hukou. For the Shanghai household population, relocation is more a result of changes in housing ownership, while for foreigners, the only option is to move within the rental market due to various macro policies and individual economic constraints (Sun 2021).
The Urban Social Benefits Gap and Preferred Migrants
With access to social services and public welfare intertwined with hukou status, the disparities between urban and rural populations have been increasing, even with reform. As the Chinese national government relinquished control of hukou requirements, it granted local jurisdictions the power to set their own parameters (Chan 2021, Henderson 2010, Zhou and Hui 2022). Since the turn of the century, most towns have opened and mostly removed restrictions, and smaller cities have eased requirements as well. However, cities with populations over 3 million still have strong restrictions, especially in China’s mega-cities (Chan 2021)
Setting its own threshold for obtaining urban hukou has allowed cities to discriminate against rural migrants based on preferential attributes related to education, labor skills, wealth and local investment (Henderson 2010, Zhou 2020, Zhou and Hui 2022). The relationship between education and hukou illustrates one form of discrimination in obtaining citizenship. Between 2001-2015, less than 10% of interprovincial migrants with no college education obtained a local urban hukou. This was achieved by 20-30% of migrants with a four-year college education and 40-60% of those with a graduate degree (Zhou and Hui 2022). It has also been determined that hukou status most greatly impacts disparities in education between natives and migrants, which is most consequential on migrants’ labor opportunities and economic returns (Fu and Ren 2010), leaving a large portion of the migrant population socially disadvantaged.
In 2014, the Chinese government announced more aggressive initiatives to improve hukou and worker matching and lessen the percentage of migrants unable to receive social provisions, with a goal of closing the mismatch by two percentage points by 2020. As Chan (2021) notes, there has been reform and progress in the gross number of hukou conversions, but the gap has instead widened as a result of increasing migration. According to 2020 census data, 63.9% of China’s population lives in urban areas, while only 45.5% have urban hukou, creating an “urban social benefits gap” of 18.5%. This gap is likely higher, as the census measured “floating” migrants to be 26.6% of China’s national population (Chan 2021). Most major cities have implemented a credit point system to screen migrants, and where some cities have expanded public services, there are still greater benefits considered “citizen services,” accessible only by those with local hukou, and higher quality citizen services may require home ownership in a high quality/resource community (Zhou 2020). These systems attract and benefit more young, educated, and skilled migrants, while those with less education/skills and older in age will be unable to obtain local hukou and eventually return to their rural origins (Zhou 2020).
Discussion
There is much research providing empirical evidence of migration patterns and impacts on the economy, and many scholars pose theories for explaining phenomena on a macro level, such as why the United States is declining in mobility rates. Nonetheless, it seems there is lacking emphasis on the segments in which there is the greatest decline in relocation – local moves within the same county and among renters. These are acknowledged by some, perhaps with broad theory, yet it seems overlooked as a crucial component to the discussion of declining American mobility. For example, the explanations provided by Coate et al. (2019) and Mangum (2020) – fast metros in growing regions becoming more settled and “attached” – are rational with impressive statistical support, but we cannot overlook one key consideration: they do not count moves within counties, or even between counties within the same local labor market (metro) as a migration event. The authors state, “understanding the decline in outflows from fast locations is then essential for studying the national mobility decline.” This may be true. However, most statistics on U.S. mobility include short distance moves, within or between counties, and they cannot be overlooked.
If housing is the most common reason people move, have housing-related variables been most impactful? In the context of American history, it looks like this may be the case. For example, annual relocation plummeted because of the 2007 housing crash, although other economic variables were likely factors as well. Homeownership has been increasing since 2016, from 63.5% of the population to 65.7% in 2020 (US Census Bureau), so the inability to purchase a home does not seem to be having an impact on mobility rates. However, an assessment of annual move rates across various segments over time does not appear to indicate that renters purchasing homes is the cause for declining mobility among the rental population. And as previously noted, affordable housing for renters has increasingly become an issue. In the Los Angeles area, nearly half a million renters do not have access to an affordable unit, according to a 2021 report from the California Housing Partnership (Gebeloff et al. 2022).
It may be flawed logic to assume the reasons that some people are mobile point to the reasons that others are immobile. Schewel (2020) argues there is “mobility bias” in migration research and that focusing on “drivers” of mobility ignores factors that can create immobility. However, measuring people’s patterns of not moving is probably more complicated. To achieve this, the literature requires greater emphasis, both theoretical and empirical, on those who move less. Whether they are “rooted” or “stuck”, more research on immobile populations is warranted. Duca (2022) shares that Black and Hispanic populations move less than Whites; perhaps examination of racial disparities could provide direction as to where further research should occur. Whatever the course, it is apparent more research is needed to better understand the impacts discrimination has on geographic mobility and the pathways through which it stunts internal migration.
As China’s service sector continues to grow (Textor 2022), there is little reason to forecast internal migration slowing much in the short-term. An aging population and fertility rates declining below replacement (Chan 2021, Mu et al. 2022, Shi et al. 2020) make domestic migration crucial for China’s continued growth and development. However, the increasing gap in urban social services and inequalities between native and migrant populations pose questions of sustainability for the long-term. Conversely, the United States’ growth in economy slowed to rates uncomfortable for many during the pandemic, and internal migration continues to decline. All trends seem to suggest the years ahead will consist of low levels of internal migration, or further decline, especially as the professional world becomes increasingly virtual, housing remains expensive, and economic inflation persists, all driven by the aftereffects of the COVID-19 pandemic.
For these reasons, international migration could become a crucial component of each country’s prosperity. Despite public opinion that immigrants take jobs from natives and lower wages, researchers mostly agree the opposite is true (Orrenius et al. 2019). Economies tend to respond to immigration with an increase in demand for labor, thus creating more jobs (Somerville and Sumption 2009). From 2010 – 2018, immigrants accounted for 83% of the growth in U.S. workforce, and they are expected to make up all growth through 2035 (Gelatt et al. 2020). Even the effect of undocumented immigrants is small (Hanson 2009). Huang and Butts (2022) found that the arrival of international immigrants to a county increases its mobility and does not increase net out-migration. As the workforce and industry evolves, immigrants can be the keystone with various contributions to ensuring a healthy, lasting economy – including domestic geographic mobility (Orrenius et al. 2019).
China has the world’s lowest percentage of immigrants in its total population. While the United States has the largest overall number of immigrants (United Nations 2019), as a percentage of its population it is far from being the largest. The United States saw steep declines in immigration, as much as -11.5%, between FY 2016 and FY 2018, due much in part to government policy (Anderson 2020). Ironically, China surpassed Mexico in 2013 as the top country of origin for recent immigrants in the U.S. It would behoove both nations to relax their policies and encourage international migration; the first to do so may very well ensure its position as the world’s economic leader.
In opening their borders and encouraging immigration, both the U.S. and China will need to give serious consideration to parameters for encouraging immigrant integration and safety. New York City, one of the United States’ most welcoming cities for immigrants, has an integration model that is more “laissez-faire” than cultivated integration, compared to a city like Barcelona, which has adopted an intentional “intercultural” model (Castaneda 2018). Even if both countries change nothing in relation to foreign immigration, their existing populations and economies would benefit from policy and programs promoting integration, equity and justice. The recent initiatives of Barcelona are a model of this framework. This includes the Equal Treatment and Non-Discrimination Act. Passed in 2020, it includes incorporating a body for protecting and promoting equal treatment and non-discrimination into the Catalan government along with various commissions and committees of expert staff, centers and labs, and representation from social organizations (Barcelona Discrimination Observatory Report 2020). Perhaps such legislation is ambitious for either nation, the United States or China, but pursuit of this or similar reform would yield many benefits, including stimulation of internal migration benefitting their economies and their people.
Conclusion
There are numerous ways in which internal migration impacts a country, the health of its economy, and the well-being of its society. Migration is more than what is taking place across international borders. For these reasons, it is crucial that discussions on migration include analysis of native populations’ mobility patterns in addition to those of foreign immigrants. It is also important they are not limited to geographic movements but include consideration for barriers preventing such movement from occurring. Doing so requires scholars to further extend migration research and discussion into the realms of politics, socioeconomics, systemic discrimination, racism, and cultural beliefs, among others. This will allow us to acquire better sociological understanding of where and why people live where they do, why they relocate or not, and what mechanisms can be deployed to positively shape these behaviors. Equipment with this knowledge will lend itself to guiding policy and initiatives that create more sustainable and fairer societies.
Around as many migrants move within China as across international borders globally (Koser 2016), thus the importance to study both processes simultaneously to have a better systemic picture. The results from this paper also point to a correlation between the period of deindustrialization in America (Castaneda and Shemesh 2020) and the fast economic growth in China. The causes are connected, and the effects are large for both countries and the distribution of wealth within them. Following the normalization of relations between Chiane and the U.S. in 1989 and the entrance of China into the World Trade Organization, many jobs were offshored from the U.S. to China with the manufacturers’ goal of decreasing labor and production costs and increasing the profits for shareholders. At the same time, many jobs were created in China, but this meant that millions upon millions of people had to move within China, moving into overpopulated neighborhoods, sometimes moving without authorization, and often leaving children and other immediate and extended family members behind. While the merging of U.S. and Chinese communities has created immense wealth for corporations and their executives, lowered poverty and created a Chinese middle class, it has had large social and political costs in both the U.S. and China. Seeing an increase in internal migration within China at the same as it decreases in the U.S., is further evidence of the connections between migration and manufacturing that we have seen since the beginning of the industrial revolution. Then as now, capital and trade transcend borders, and people are likely to follow employment, but not everybody can or is willing to move long distances to obtain a new job, as is the case in some of the deindustrializing cities and towns in the United States.
The COVID pandemic, Trump nationalist discourse, rapid Chinese growth, aging society and more expensive labor force, along with real “made in America” policies announced by the Biden administration, will decouple the two economies to some extent, and we will likely see the effects of this reflected in rates and patterns of internal migration with the U.S. and China.
References
- Abedin, S., Cloud, C., Fierro, A., Goldberg, D., Soto, J. A., & Williams, M. (2018). Making every neighborhood a place of opportunity. Fair Housing Trends Report 2018. Retrieved from https://nationalfairhousing.org/resource/2018-fair-housing-trends-report/.
- Augustine, L., Cloud, C., Frost-Brown, S., McBride, M., Tope-Ojo, S., Williams, M. & Yap, M. (2018). Fair housing trends report. Fair Housing Trends Report 2021. Retrieved from https://nationalfairhousing.org/resource/2021-fair-housing-trends-report/.
- Au, C. C., & Henderson, J. How migration restrictions limit agglomeration and productivity in China. Journal of Development Economics 2006, 80, 350–388.
- Bahrampour, T., Lang, J., Marissa, & Mellnik, Ted. (2023). White people have flocked back to city centers – and transformed them. The Washington Post. Retrieved from https://www.washingtonpost.com/dc-md-va/interactive/2023/us-city-white-population-increase/.
- Boustan, L. P. and Shertzer, A. (2013). Population trends as a counterweight to central city decline, 1950-2000. Demography, 1-23.
- Brown, J.R., Enos, R.D. (2021). The measurement of partisan sorting for 180 million voters. Nat Hum Behav 5, 998–1008 (2021). [CrossRef]
- Castañeda, E. (2018). A place to call home: Immigrant exclusion and urban belonging in New York, Paris, and Barcelona. Palo Alto, CA: Stanford University Press.
- Castañeda, E. and Shemesh, A. (2020). Overselling Globalization: The misleading conflation of economic globalization and immigration, and the subsequent backlash. Retrieved from: https://www.mdpi.com/2076-0760/9/5/61.
- Center for Sustainable Systems, University of Michigan. 2021. U.S. Cities Factsheet. Pub. No. CSS09-06.
- Chan, K. W. (2021). Internal Migration in China: Integrating Migration with Urbanization Policies and Hukou Reform. 8.
- Chan, K. W., & Zhang, L. (1999). The Hukou System and Rural-Urban Migration in China: Processes and Changes. The China Quarterly, 160, 818–855.
- Chatterji, P., Liu, X., & Yörük, B. K. (2022). Health insurance and the boomerang generation: Did the 2010 ACA dependent care provision affect geographic mobility and living arrangements among young adults? Contemporary Economic Policy, 40(2), 243–262. [CrossRef]
- Chauvin, J. P., Glaeser, E., Ma, Y., & Tobio, K. (2017). What is different about urbanization in rich and poor countries? Cities in Brazil, China, India and the United States. Journal of Urban Economics, 98, 17–49. [CrossRef]
- Chen, Y., & Rosenthal, S. S. (2008). Local amenities and life-cycle migration: Do people move for jobs or fun? Journal of Urban Economics, 64(3), 519–537. [CrossRef]
- Choi, H., Schoeni, R., Xu, H., Reyes, A., & Thomas, D. (2021). Proximity to mother over the life course in the United States: Overall patterns and racial differences. Demographic Research, 45, 769-806,769A-769B. [CrossRef]
- Coate, P., Mangum, K., & Lambie-Hanson, T. (2019). Fast locations and slowing labor mobility. (Working Paper (Federal Reserve Bank of Philadelphia), pp. 19–49). Federal Reserve Bank of Philadelphia. [CrossRef]
- Duca, B. (2022). Socioeconomics of Modern-Day Migration Within the United States: Determinants and Economic Implications Across Race and Ethnicity [Ph.D., Colorado State University]. https://www.proquest.com/docview/2677038975/abstract/D09CA7B1730C4159PQ/7.
- Fu, Q., & Ren, Q. (2010). Educational inequality under China’s rural–urban divide: The hukou system and return to education. Environment and Planning A, 42(3), 592-610.
- Frey, W. H. (2017, November 20). U.S. migration still at historically low levels, census shows. Brookings. https://www.brookings.edu/blog/the-avenue/2017/11/20/u-s-migration-still-at-historically-low-levels-census-shows/.
- Gebeloff, R., Goldstein, D., & Hu, W. (2022, March 24). Cities Lost Population in 2021, Leading to the Slowest Year of Growth in U.S. History. The New York Times. https://www.nytimes.com/2022/03/24/us/census-2021-population-growth.html.
- Gelatt, J., Batalova, J., & Capps, R. (2020). Navigating the future of work: the role of immigrant-origin workers in the changing U.S. economy. Migration Policy Institute October 2020.
- Golding, S. A. & Winkler, R. L. (2020). Tracking Urbanization and Exurbs: Migration Across the Rural–Urban Continuum, 1990–2016. Population Research and Policy Review, 39(5), 835–859. [CrossRef]
- Greenwood, M. J., & Hunt, G. L. (1989). Jobs versus amenities in the analysis of metropolitan migration. Journal of Urban Economics, 25(1), 1–16. [CrossRef]
- Henderson, J. V. (2010). Cities and Development. Journal of Regional Science, 50(1), 515–540. [CrossRef]
- Hou, M. (2014). A Literature Review of Research About Citizen Relocation Issues. (English translation). Journal of Capital Normal University 2014(03):95-100.
- Jizhe, N. (2021). Main data of the seventh national population census. National Beurau of Statistics. doi: http://www.stats.gov.cn/english/PressRelease/202105/t20210510_1817185.html.
- Koser, K. (2016). International Migration: A Very Short Introduction (2016). Oxford University Press.
- Lin, S. (2021). Family migration and housing tenure choice: empirical evidence from 25 chinese cities. (in Chinese) Economic Geography 2021(05):95-102.
- Liu, W. & Yan, X. (2007). Comparison of influencing factors for residential mobility between different household register types in transitional urban China: a case study of Guangzhou (English translation) Geographical Research 2007(05):1055-1066.
- Mangum, K. (2020). No More Californias. Economic Insights 5(1): 8-13. doi: https://www.philadelphiafed.org/-/media/frbp/assets/economy/articles/economic-insights/2020/q1/eiq120.pdf.
- Moretti, E. (2012). What Workers Lose By Staying Put. Wall Street Journal. Retrieved from https://online.wsj.com/article/SB10001424052702303610504577420701942867414.html.
- Mu, X., Yeh, A. G.-O., Zhang, X., Wang, J., & Lin, J. (2022). Moving down the urban hierarchy: Turning point of China’s internal migration caused by age structure and hukou system. Urban Studies, 59(7), 1389–1405. [CrossRef]
- Muth, R. F. (1971). Migration: Chicken or Egg? Southern Economic Journal (Pre-1986), 37(3), 295–306.
- Orrenius, P. M., Zavodny, M., & Gullo, S. (2020) How does immigration fit into the future of the U.S. labor market? Federal Reserve Bank of Dallas. Working paper, March 2020. [CrossRef]
- Schewel, K. (2020). Understanding Immobility: Moving Beyond the Mobility Bias in Migration Studies. International Migration Review, 54(2), 328–355. [CrossRef]
- Schuetz, J. (2017, October 31). Yet more evidence that housing affordability is getting worse. Brookings. https://www.brookings.edu/blog/the-avenue/2017/10/31/yet-more-evidence-that-housing-affordability-is-getting-worse/.
- Sheng, Nan. 2014. "A research about relocation behavior inside Hefei city” (in Chinese) Master Thesis, Anhui Normal University.
- Shi et al. (2020). Trends and characteristics of inter-provincial migrants in mainland China and its relation with economic factors: a panel data analysis from 2011 to 2016. Sustainability 2020, 12, 610.
- Shide, F. (2021). The seventh national census discloses new trend of floating population in China discloses new trend of floating population in China. (English translation) Pengpai Research Center. doi: https://www.thepaper.cn/newsDetail_forward_12902468.
- Somerville, W., & Sumption, M. (2009). Immigration and the labour market: theory, evidence and policy. Migration Policy Institute. 55.
- Song, W. (2015). A review of research on residential mobility from the perspective of urban geography. (English translation). Urban Planning Forum 2015(05):41-49.
- Sun, X., & Chen, W. (2021). City space and public service facility: the analysis of residence mobility in Shanghai. (English translation). Journal of Wuhan University of Science & Technology 2021,23(05):508-517.
- Textor, C. (2022). Degree of urbanization in China from 1980 – 2021. doi: https://www.statista.com/statistics/270162/urbanization-in-china/.
- Textor, C. (2022). Distribution of the workforce across economic sectors in China 2011-2021. doi: https://www.statista.com/statistics/270327/distribution-of-the-workforce-across-economic-sectors-in-china/.
- Wuwei, A. (2020). Changes to China’s hukou system are creating new divides. The Economist. doi: https://www.economist.com/china/2020/08/19/changes-to-chinas-hukou-system-are-creating-new-divides.
- Yang, S., Shu, T., & Yu, T. (2022). Migration for Better Jobs or Better Living: Shifts in China. International Journal of Environmental Research and Public Health, 19(21), Article 21. [CrossRef]
- Zhang, J. & Lu, C. (2019). “A quantitative analysis of hukou reform and the threshold of obtaining hukou from big cities. (English translation). China Economic Quarterly (04):1509-1530.
- Zhou, Y. (2020). Reform inside the system or development outside the system? -- the choice of hukou reform path of big cities.” (English translation). Contemporary Economic Research 2020(01):74-82.
- Zhou, J., & Hui, E. C.-M. (2022). The hukou system and selective internal migration in China. Papers in Regional Science, 101(2), 461–482. [CrossRef]
Disclaimer/Publisher’s Note: The statements, opinions and data contained in all publications are solely those of the individual author(s) and contributor(s) and not of MDPI and/or the editor(s). MDPI and/or the editor(s) disclaim responsibility for any injury to people or property resulting from any ideas, methods, instructions or products referred to in the content. |
© 2023 by the authors. Licensee MDPI, Basel, Switzerland. This article is an open access article distributed under the terms and conditions of the Creative Commons Attribution (CC BY) license (http://creativecommons.org/licenses/by/4.0/).
Copyright: This open access article is published under a Creative Commons CC BY 4.0 license, which permit the free download, distribution, and reuse, provided that the author and preprint are cited in any reuse.


