1. Introduction
Fermented chili sauce, also known as hot sauce, is a popular condiment appreciated for its attractive color and spicy flavor [
1]. However, the use of various naturally adhering microorganisms in traditional production methods can lead to difficulties in controlling product quality [
2]. Recently, there has been increased attention on the versatile functional properties of
Lactiplantibacillus plantarum (LP) in the production of fermented foods, including improved taste, probiotic activity, antimicrobial activity, and reduction of undesirable ingredients [
3,
4]. Therefore, the use of a single LP strain in chili sauce production can ensure consistent product quality with excellent organoleptic properties.
Chemical analysis of taste-active molecules is crucial in ensuring food quality and preventing defects that can negatively impact consumer acceptance. Basic taste sensations, such as sweetness, bitterness, acidity, umami, and saltiness, are crucial in determining consumer preference and purchasing behavior [
5]. Sweetness is particularly essential as it contributes to the overall pleasantness of food, while sourness adds a tangy taste and enhances the overall flavor of chili sauce. However, excessive acidity can overpower other flavors and leave a harsh sharpness on the palate, and bitterness can negatively impact food acceptance, despite having a protective function in humans against toxic compounds. Thus, specific metabolic markers associated with taste development in chili sauce require manipulation to improve the flavor profile of the sauce. While previous studies have primarily focused on volatile components and odor activity [
6], a comprehensive investigation of taste-active components is necessary to better understand the mechanisms underlying the unique flavor of chili sauce.
Metabolomics techniques have become increasingly popular for identifying critical metabolites associated with flavor quality in foods, and ultra-performance liquid chromatography coupled to time-of-flight mass spectrometry (UHPLC-Q-TOF-MS) is a frequently used method [
7,
8,
9,
10]. However, the complex chemical composition of fermented foods poses a challenge for non-targeted metabolomics, making it difficult to determine the structure of metabolites. The use of in-house or public databases for metabolite annotation is a widely employed method in metabolomics studies. However, it is important to note that this approach has inherent limitations, including the limited capacity of the database to encompass all possible metabolites and the potential for incorrect matches or search failures [
11].
To address the challenge of identifying taste-active metabolites and assessing flavor quality in foods, several tools and approaches have been developed. The Molecular Network (MN) in the Global Molecular Network for Natural Products Society (GNPS) platform is a powerful method for rapidly annotating mass spectrometry data from non-targeted metabolomics, as demonstrated in previous studies [
12,
13]. Feature-based molecular networks (FBMN) are a newer approach that uses retention time and MS
2 data to identify unknown components and have shown promise in the identification of unknown metabolites [
14,
15]. Moreover, VirtualTaste is also a web-based platform that employs machine learning algorithms to predict the three fundamental taste sensations of compounds, namely sweet, bitter, and sour. This approach offers a promising tool for analyzing the flavor profile of food and beverage products [
16].
To explore the non-volatile metabolites and taste-active compounds in chili sauce during different fermentation times (0-day, 3-day, 5-day), a comprehensive study was conducted using a UHPLC-Q-TOF based untargeted metabolomics technique. The FBMN tool, which has been widely used for the annotation of unknown compounds, was employed to further analyze the metabolites and identify key signature compounds and metabolic pathways. The taste activity of the identified key metabolites was evaluated using the machine learning-based VirtualTaste tool. By combining metabolomics and computational tools, this integrated approach offers several advantages, such as increased efficiency in screening taste-active metabolites and providing a more systematic and comparative analysis of the metabolites involved in the fermentation process. The findings of this study can provide valuable insights and data support for the quality control of chili sauce processing.
2. Materials and methods
2.1. Materials and reagents
The HPLC-grade formic acid was procured from Kermel Chemical Reagent Co., Ltd. (Tianjin, China), while the ammonium acetate was obtained from Krohne Chemical Reagent Co., Ltd. (Chengdu, China). LCMS-grade acetonitrile was purchased from FTSCI Corporation (Wuhan, China), and methanol used for extraction was provided by Chron Chemical Co., Ltd. (Chengdu, China). Ultrapure water with a resistivity of 18.2 MΩ⋅cm was obtained using a Milli-Q system (Millipore, Bedford, USA).
2.2. Chili peppers fermentation and extraction
Fresh chili peppers (Capsicum annuum var.) were purchased from supermarkets in Chengdu, China. The peppers were washed and sterilized by heating at 60°C for 30 min. After cooling to room temperature, 3.0% salt was added and homogenized. The homogenized pepper samples were divided into 15 portions and placed in sterile Petri dishes. Each Petri dish (25g sample) was inoculated with 1.5 ml of LP B5 strain (NCBI accession number: OP782666) solution. The samples were incubated in a constant temperature incubator at 35°C for 5 d. Freeze-drying was carried out on samples after 0 d, 3 d, and 5 d of fermentation (n=5), respectively.
Freeze-dried samples were extracted using a previously described method with some modifications [
17]. Specifically, 1.0 g of each sample was added to a 15 ml centrifuge tube, and 10 ml of methanol was added. The mixture was vortexed for 1 min and then subjected to ultrasonication at room temperature for 20 min. The resulting extract was then filtered through a 0.22 μm membrane for further UHPLC-Q-TOF analysis.
2.3. UHPLC-Q-TOF method
The X500 UHPLC-Q-TOF system (SCIEX Co., Framingham, MA, USA) equipped with an ESI source was utilized in this study. Separation was carried out on an HSS T3 C18 column (100 mm ×2.1 mm ×1.8 μm). The mobile phase A consisted of acetonitrile, while mobile phase B consisted of ultrapure water with 0.1% ammonium acetate. The injection volume was set to 4 μL, and the flow rate was 250 μL/min. The column temperature was maintained at 40 ℃. The gradient elution program was as follows: 0-2 min 5% A, 2-13 min from 5% to 100% A, 13-16 min 100% A, followed by a return to 5% A in 16-16.5 min, and finally 16.5-20min 5% A. Samples were analyzed in both positive and negative ionization modes using MS precursor ion scanning from 70 to 600 Da and MS/MS product ion scanning from 50 to 600 Da. The IDA function was utilized for data acquisition.
2.4. Data processing and statistical analysis
The raw UHPLC-Q-TOF files were imported into MSDIAL 4.60 software [
18] to annotate metabolite names and species in the three sample sets. The resulting dataset was then subjected to principal component analysis (PCA), partial least squares discriminant analysis (PLS-DA), and VIP scoring using SIMCA 14.1. Differential metabolites were screened using ANOVA (VIP>1.0,
p<0.05) in SPSS25. Heat map visualization analysis was performed using OmicStudio tools (
https://www.omicstudio.cn/tool). Metabolic pathway enrichment was analyzed using MetaboAnalyst 5.0 (
https://www.metaboanalyst.ca/) with Arabidopsis thaliana as the background to identify functional annotations and perform enrichment analysis on chili sauce at different fermentation times. The VirtualTaste tool (
https://insilico-cyp.charite.de/VirtualTaste/) identified potential flavor markers for quality control.
2.5. FBMN analysis
After pre-processing the data using MSDIAL, the files were exported for FBMN online analysis (
https://gnps.ucsd.edu/). The resulting data were then imported into Cytoscape 3.9.1 for visualization analysis [
19].
3. Results
3.1. Global FBMN analysis
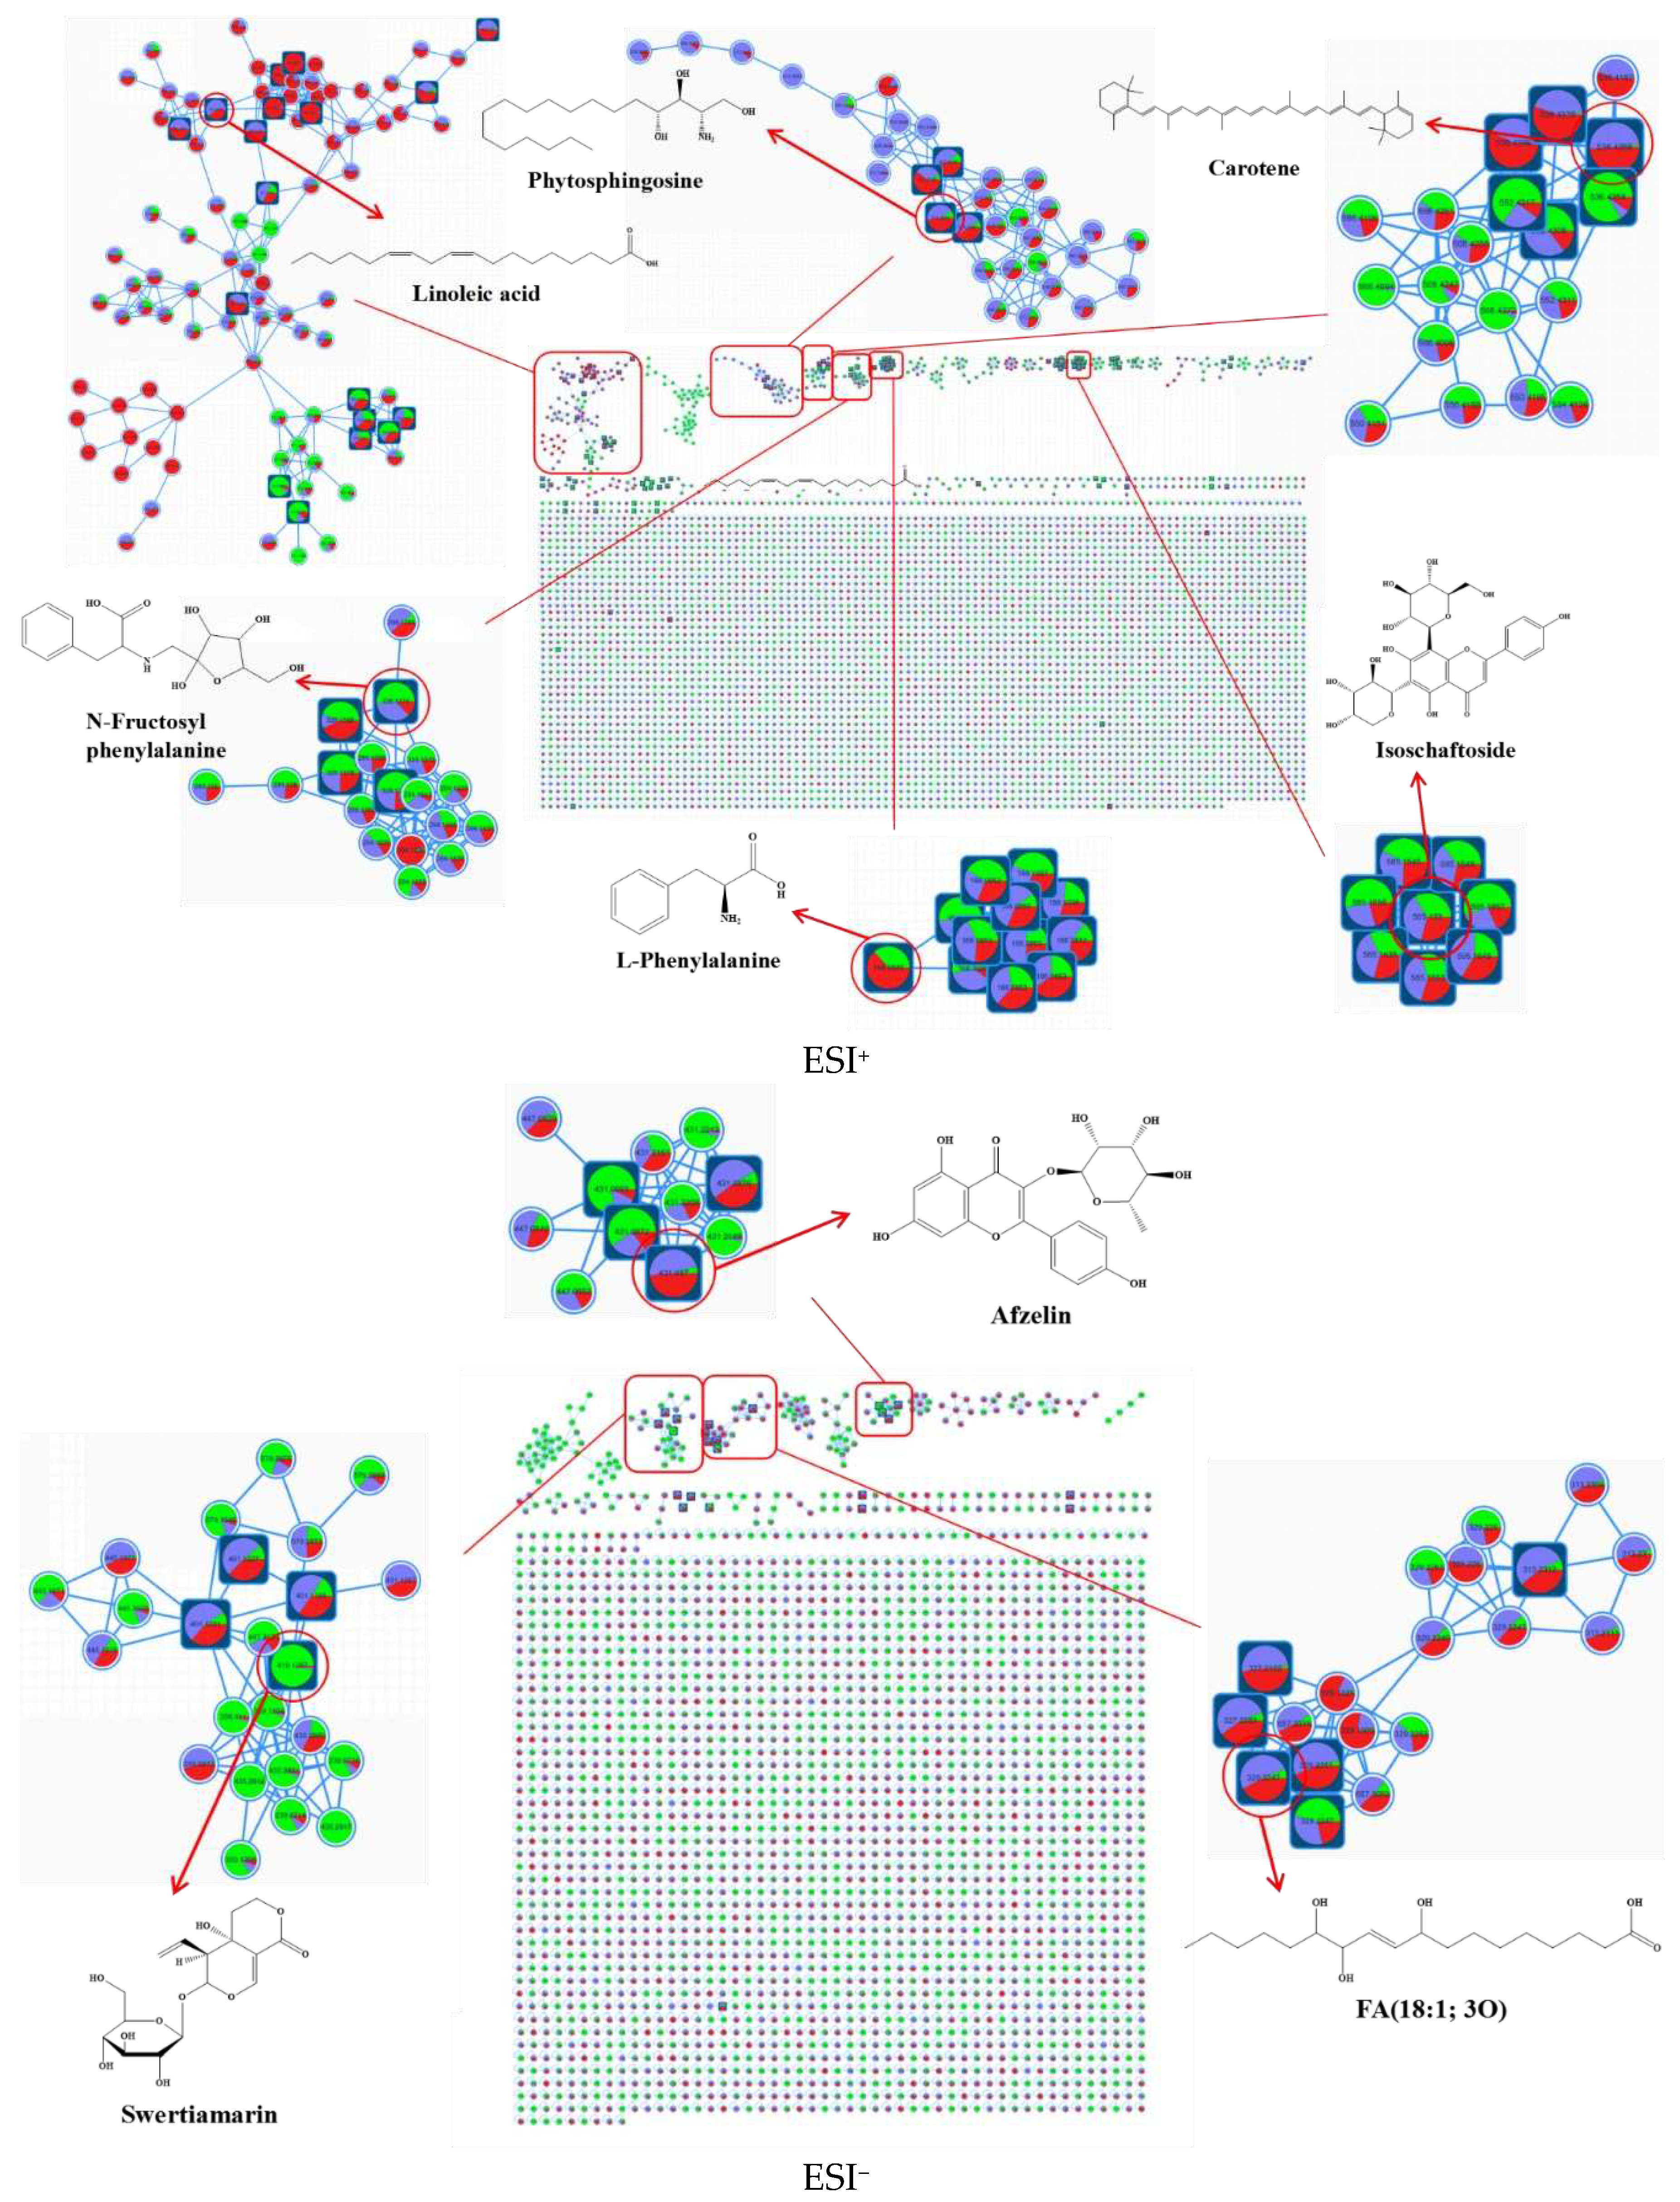
In this study, untargeted metabolomics was employed to obtain data on chili sauce at different fermentation times (0 d, 3 d, and 5 d). Chromatographic separation was achieved within 20 minutes (
Figure S1), and the MS
2 data were analyzed using the FBMN tool. The FBMN analysis allowed for the visualization of metabolite families based on their similarity in MS
2 fragmentation patterns (
Figure 1). A total of 13,517 positive precursor ions ([M + H]
+, [M + 2H]
2+, [M + Na]
+ and [M + NH4]
+) and 8,472 negative precursor ions ([M-H]
- and [M-2H]
2-) were organized into metabolic networks (MN) with 101 and 61 clusters (nodes ≥ 2), respectively. These clusters were comprised of 569 and 273 nodes, respectively. The nodes in the MN were color-coded to represent the relative content of metabolites at the three different fermentation times. Self-linked points at the bottom of the network represented spectra not classified into molecular families.
In the positive electrospray ionization (ESI
+) mode, the identified molecular families mainly comprised fatty acids, sphingolipids, carotenoids, and amino acids, while in the negative electrospray ionization (ESI
-) mode, the identified molecular families were primarily glycosides, flavonoids, and oxidized fatty acids. Following manual de-duplication and merging, a total of 206 metabolites were annotated using the GNPS database, which included 12 major groups, such as amino acids, phenolics, alkaloids, acids, terpenoids, flavonoids, lipids, ketones, esters, sugars, vitamins, and other classified constituents (
Table S1). Many of these metabolites had not been previously reported in chili sauce. However, it is noteworthy that nearly 70% of the nodes remain unidentified, highlighting the complexity of the metabolic composition of fermented chili sauce.
Identifying metabolites with taste activity is essential for enhancing the taste and flavor qualities of chili sauce. However, annotating unknown metabolites poses a significant challenge in metabolomics. Previous studies on chili sauce have been limited to only a few non-volatile compounds such as capsaicinoids, amino acids and organic acids [
20]. This study successfully employed the FBMN tool to annotate highly complex metabolomics data using powerful cloud computing capabilities, facilitating the rapid clustering of metabolites from background noise and improving the annotation of unknown components. This innovative approach could prove to be an invaluable tool for future research in identifying taste-active metabolites in various foods and beverages.
3.2. Multivariate statistical analysis
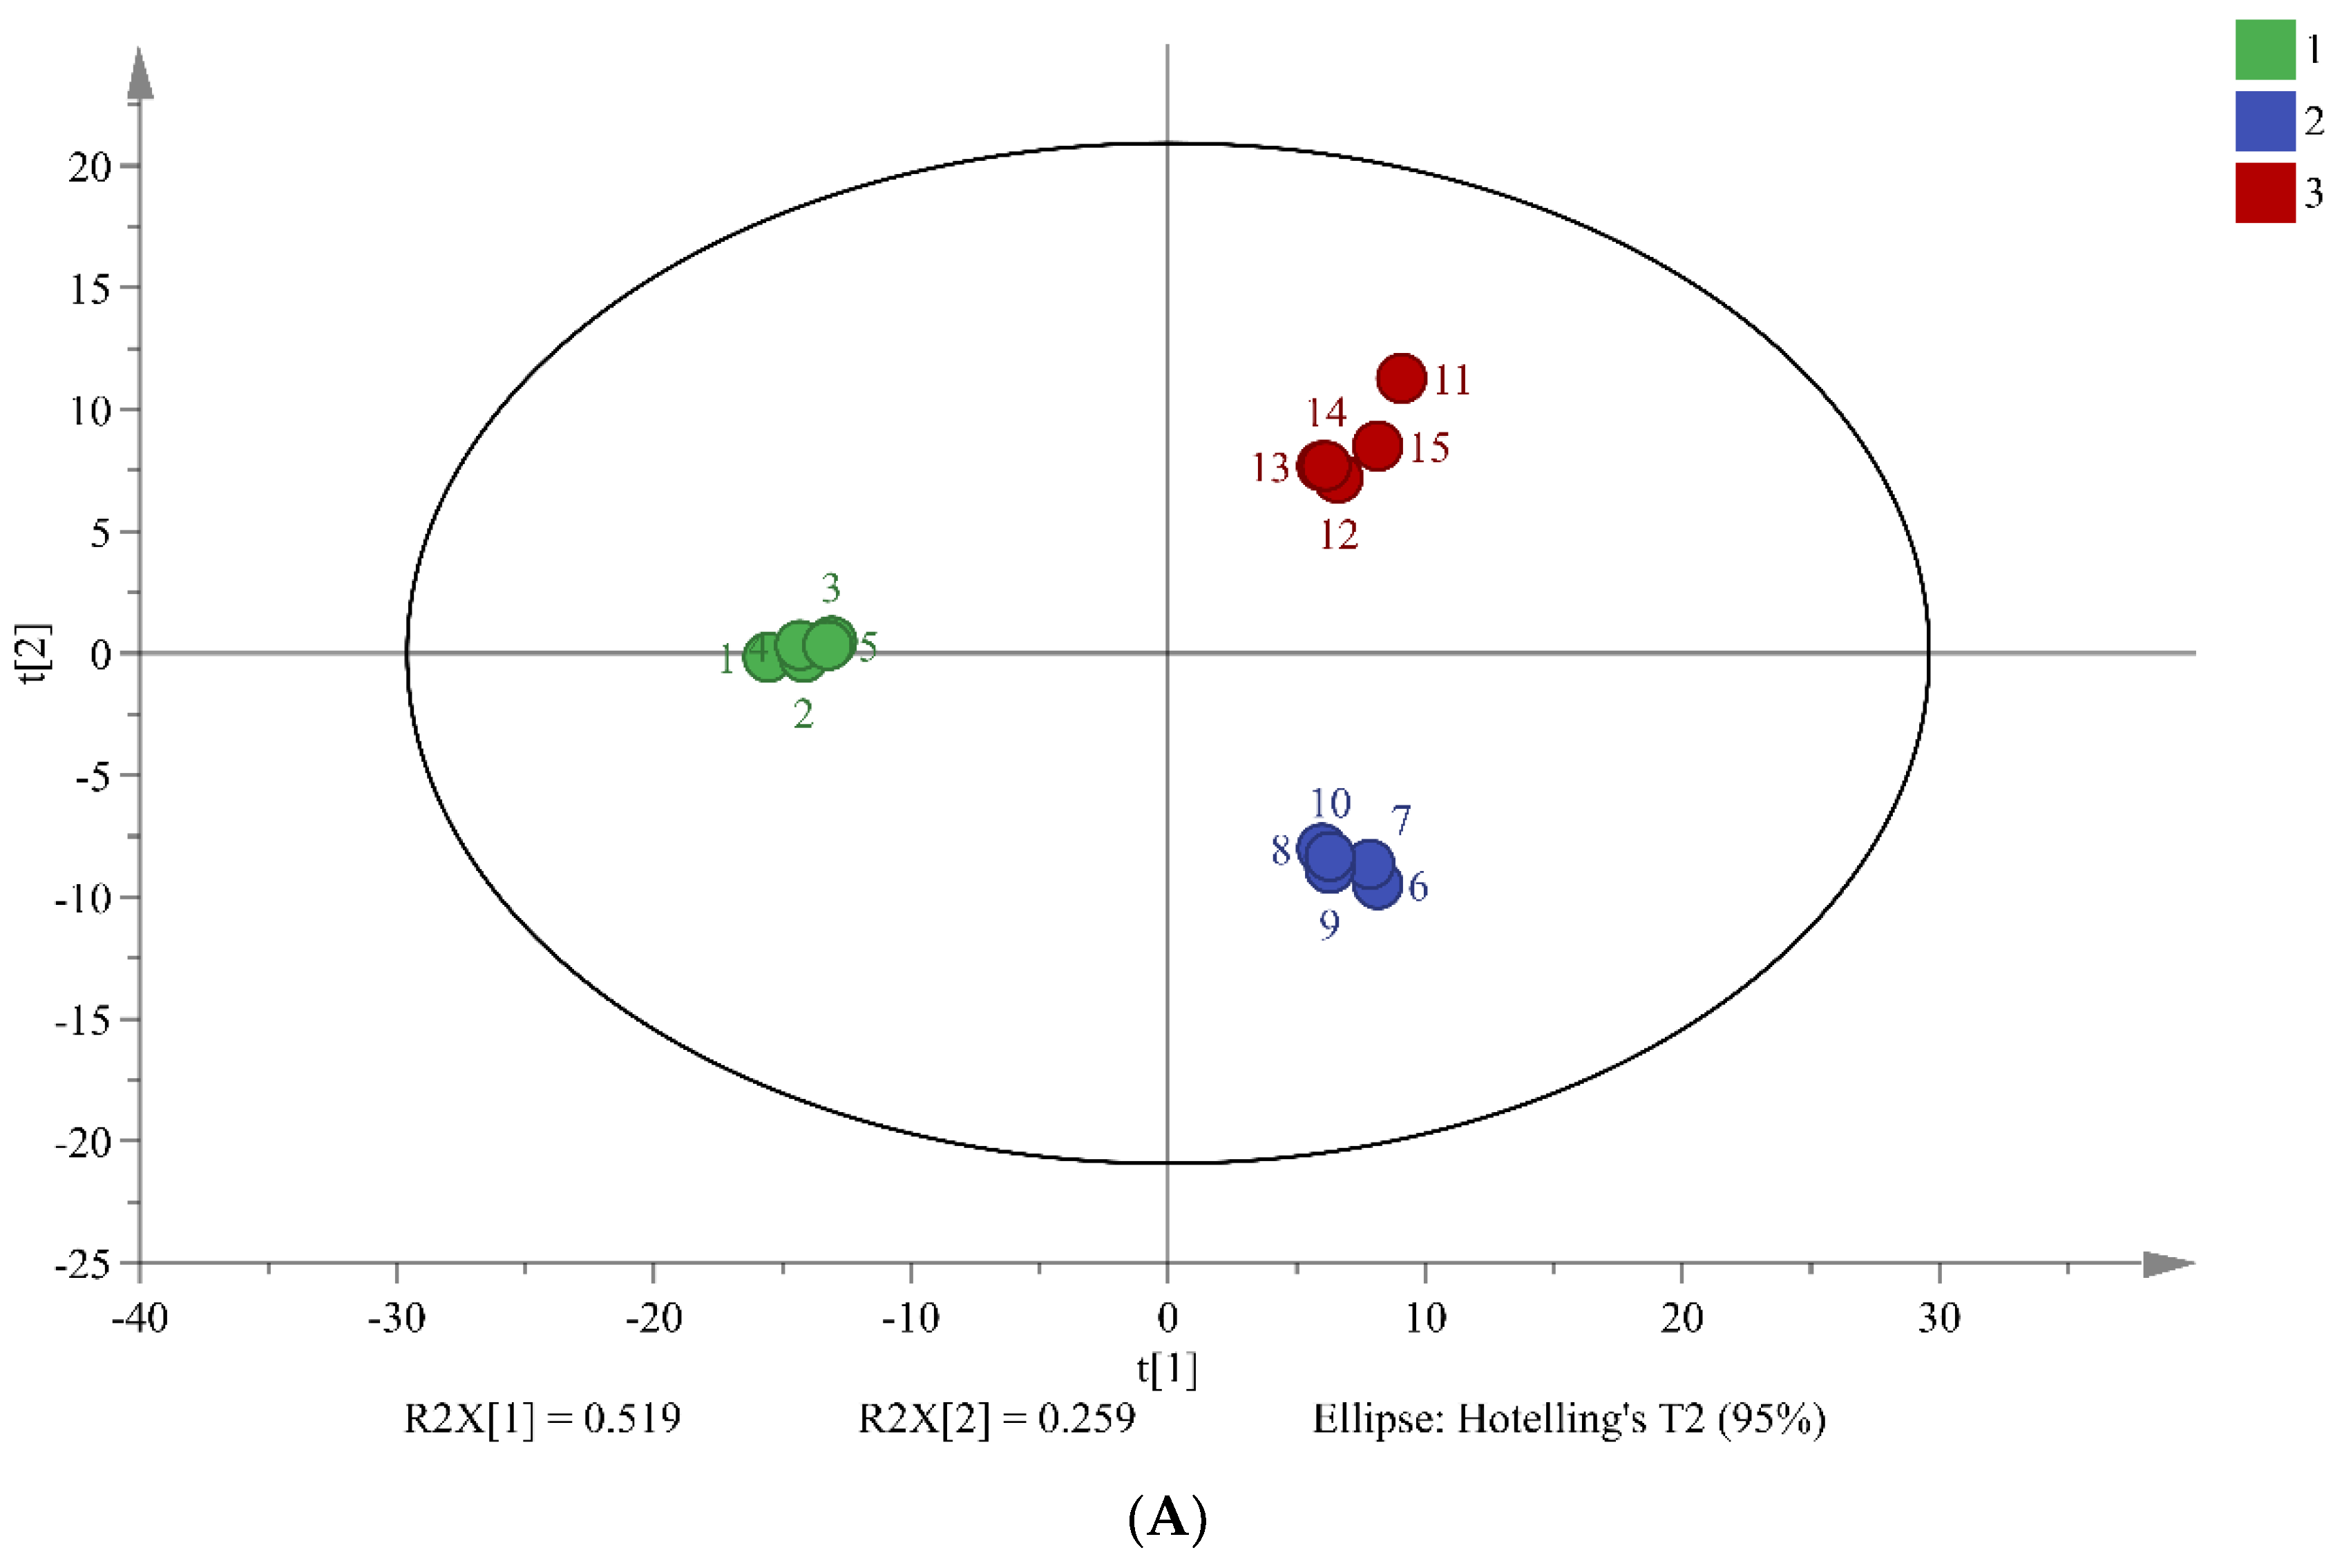
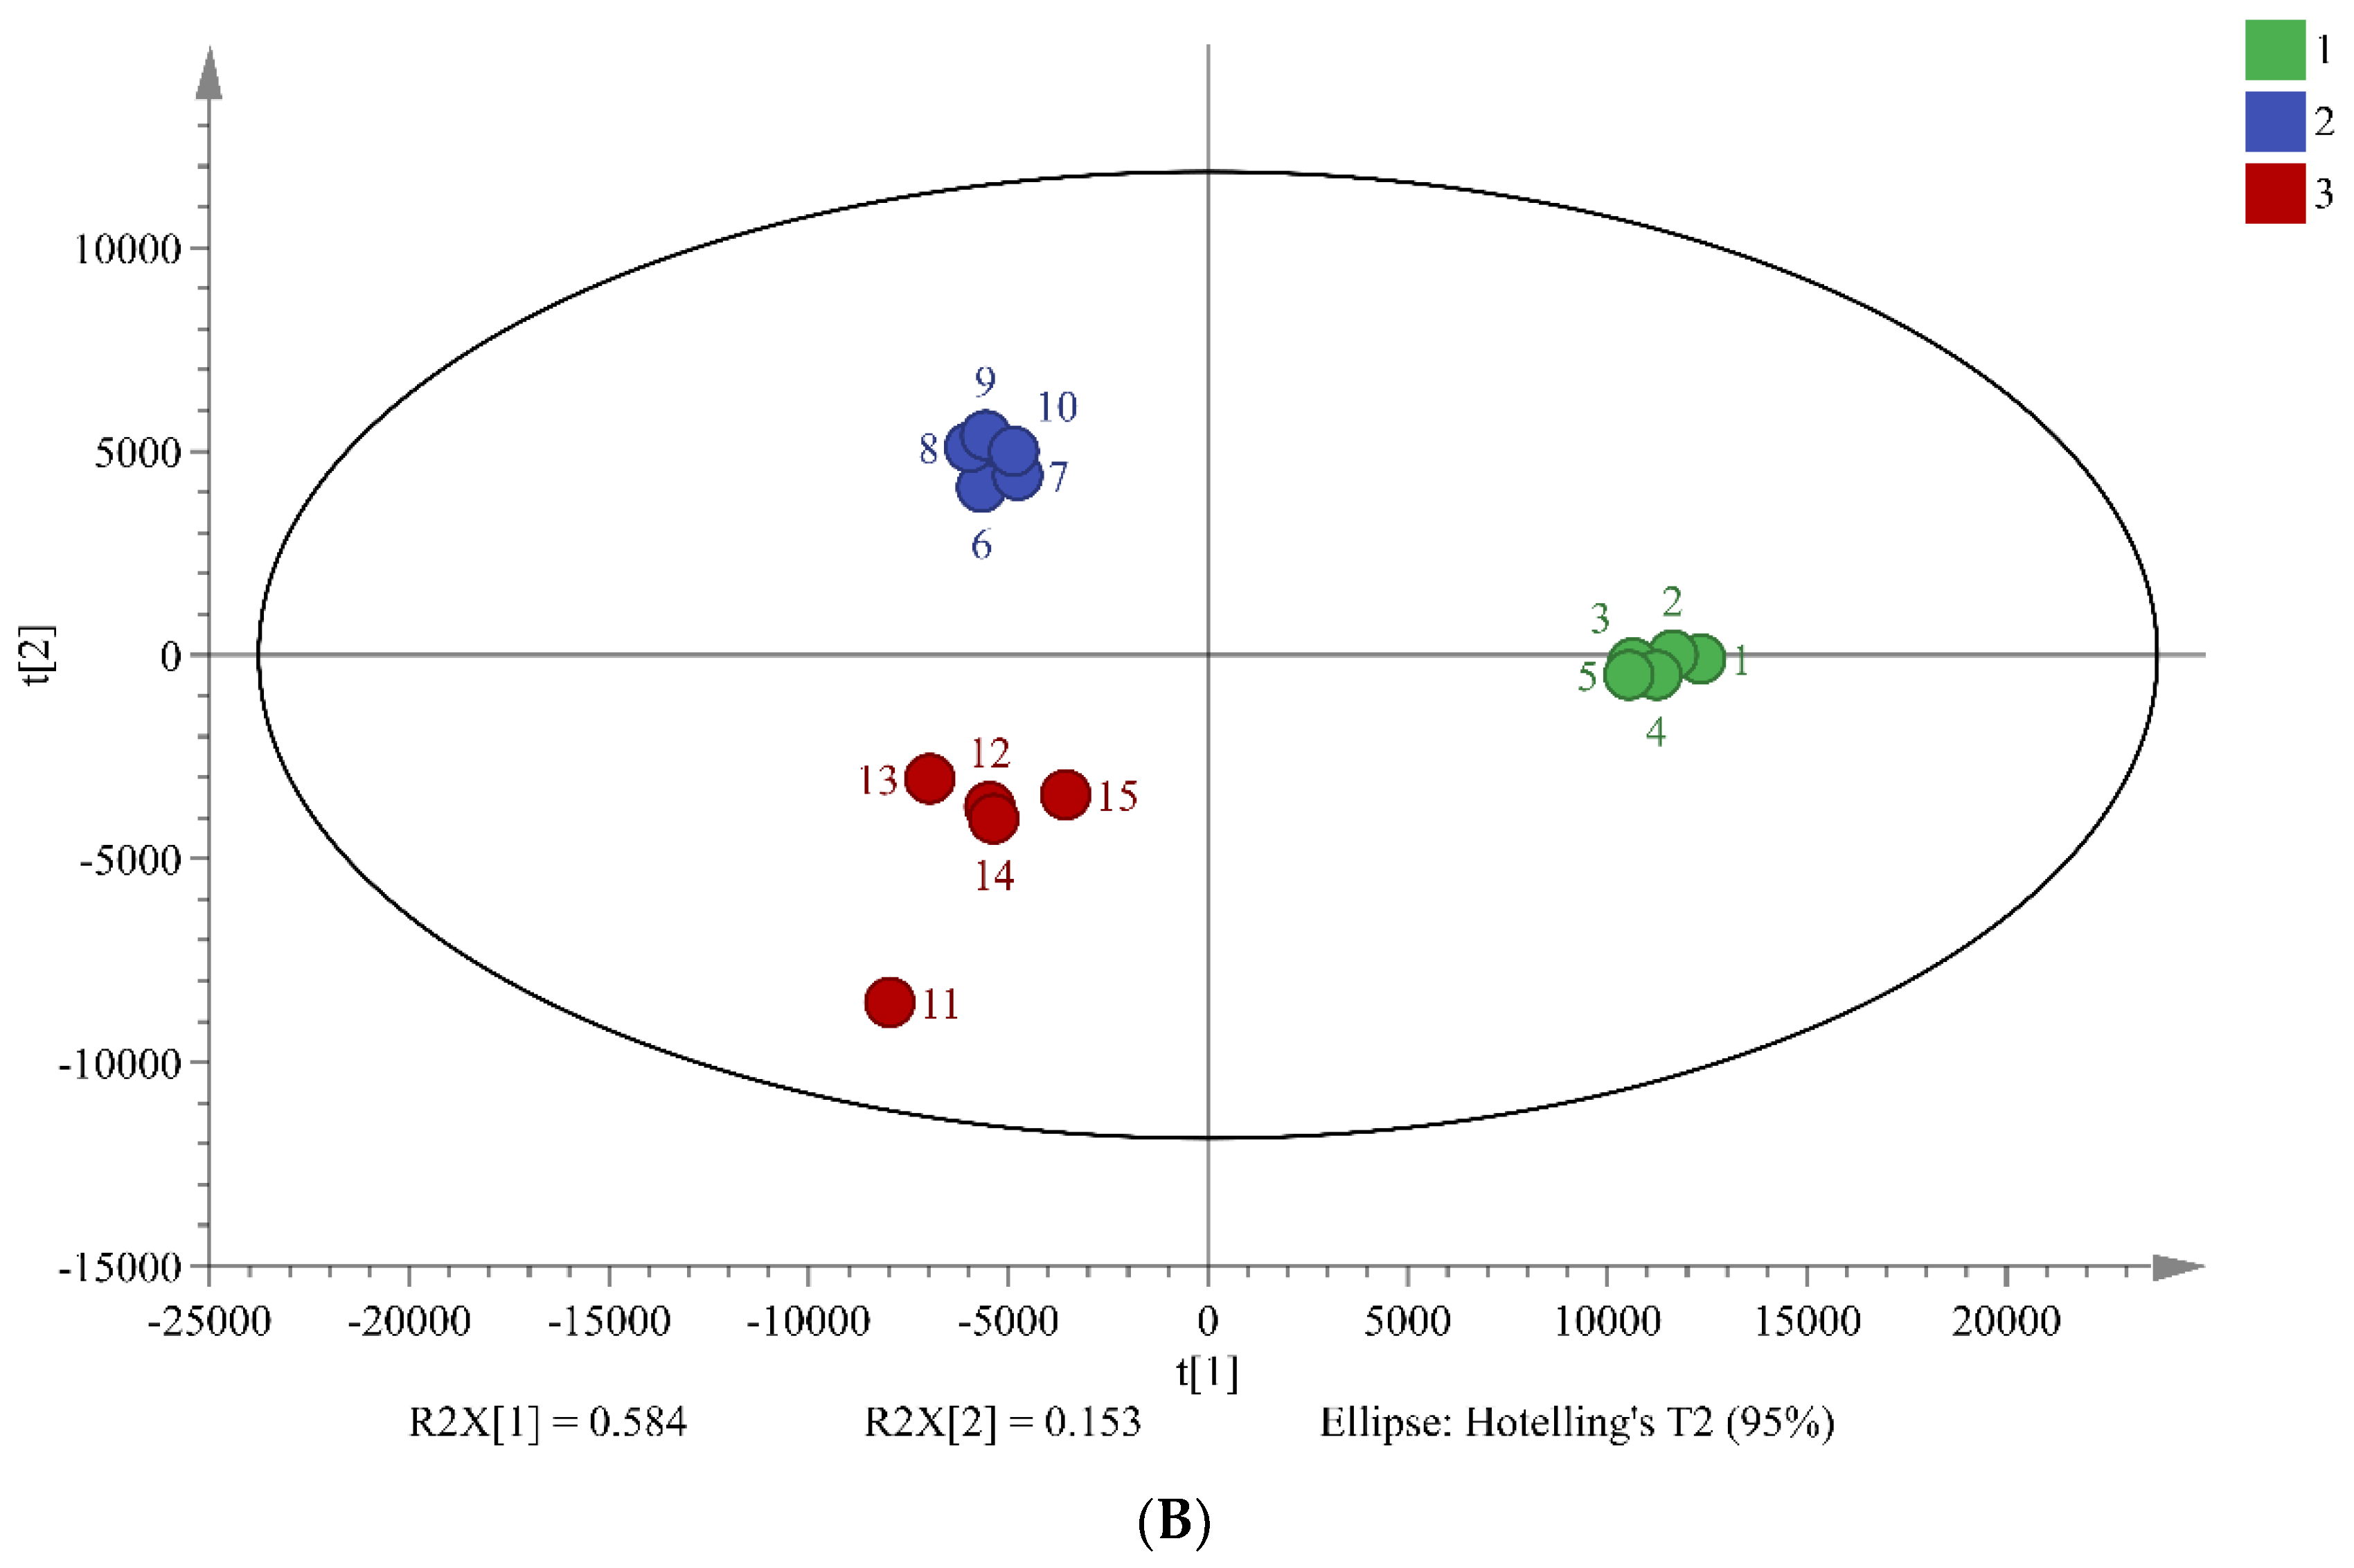
PCA is widely used multivariate analysis methods in metabolomics that can reveal significant differences between sample groups. The results of PCA in this study suggest that the three different fermentation times of chili sauce have distinct metabolic compositions (
Figure 2). The total combined variance of 77.8% of the first two principal components in the PCA model indicates that the model retains a large amount of information from the original data. The PLS-DA model further screened 34 differentiated markers that represented 12 major categories of metabolites (R
2X = 0.737, R
2Y = 0.948, and Q
2 = 0.874;
Figure 2B). These findings demonstrate the effectiveness of the PCA and PLS-DA models in screening differences in the metabolic composition of chili sauce at various fermentation times.
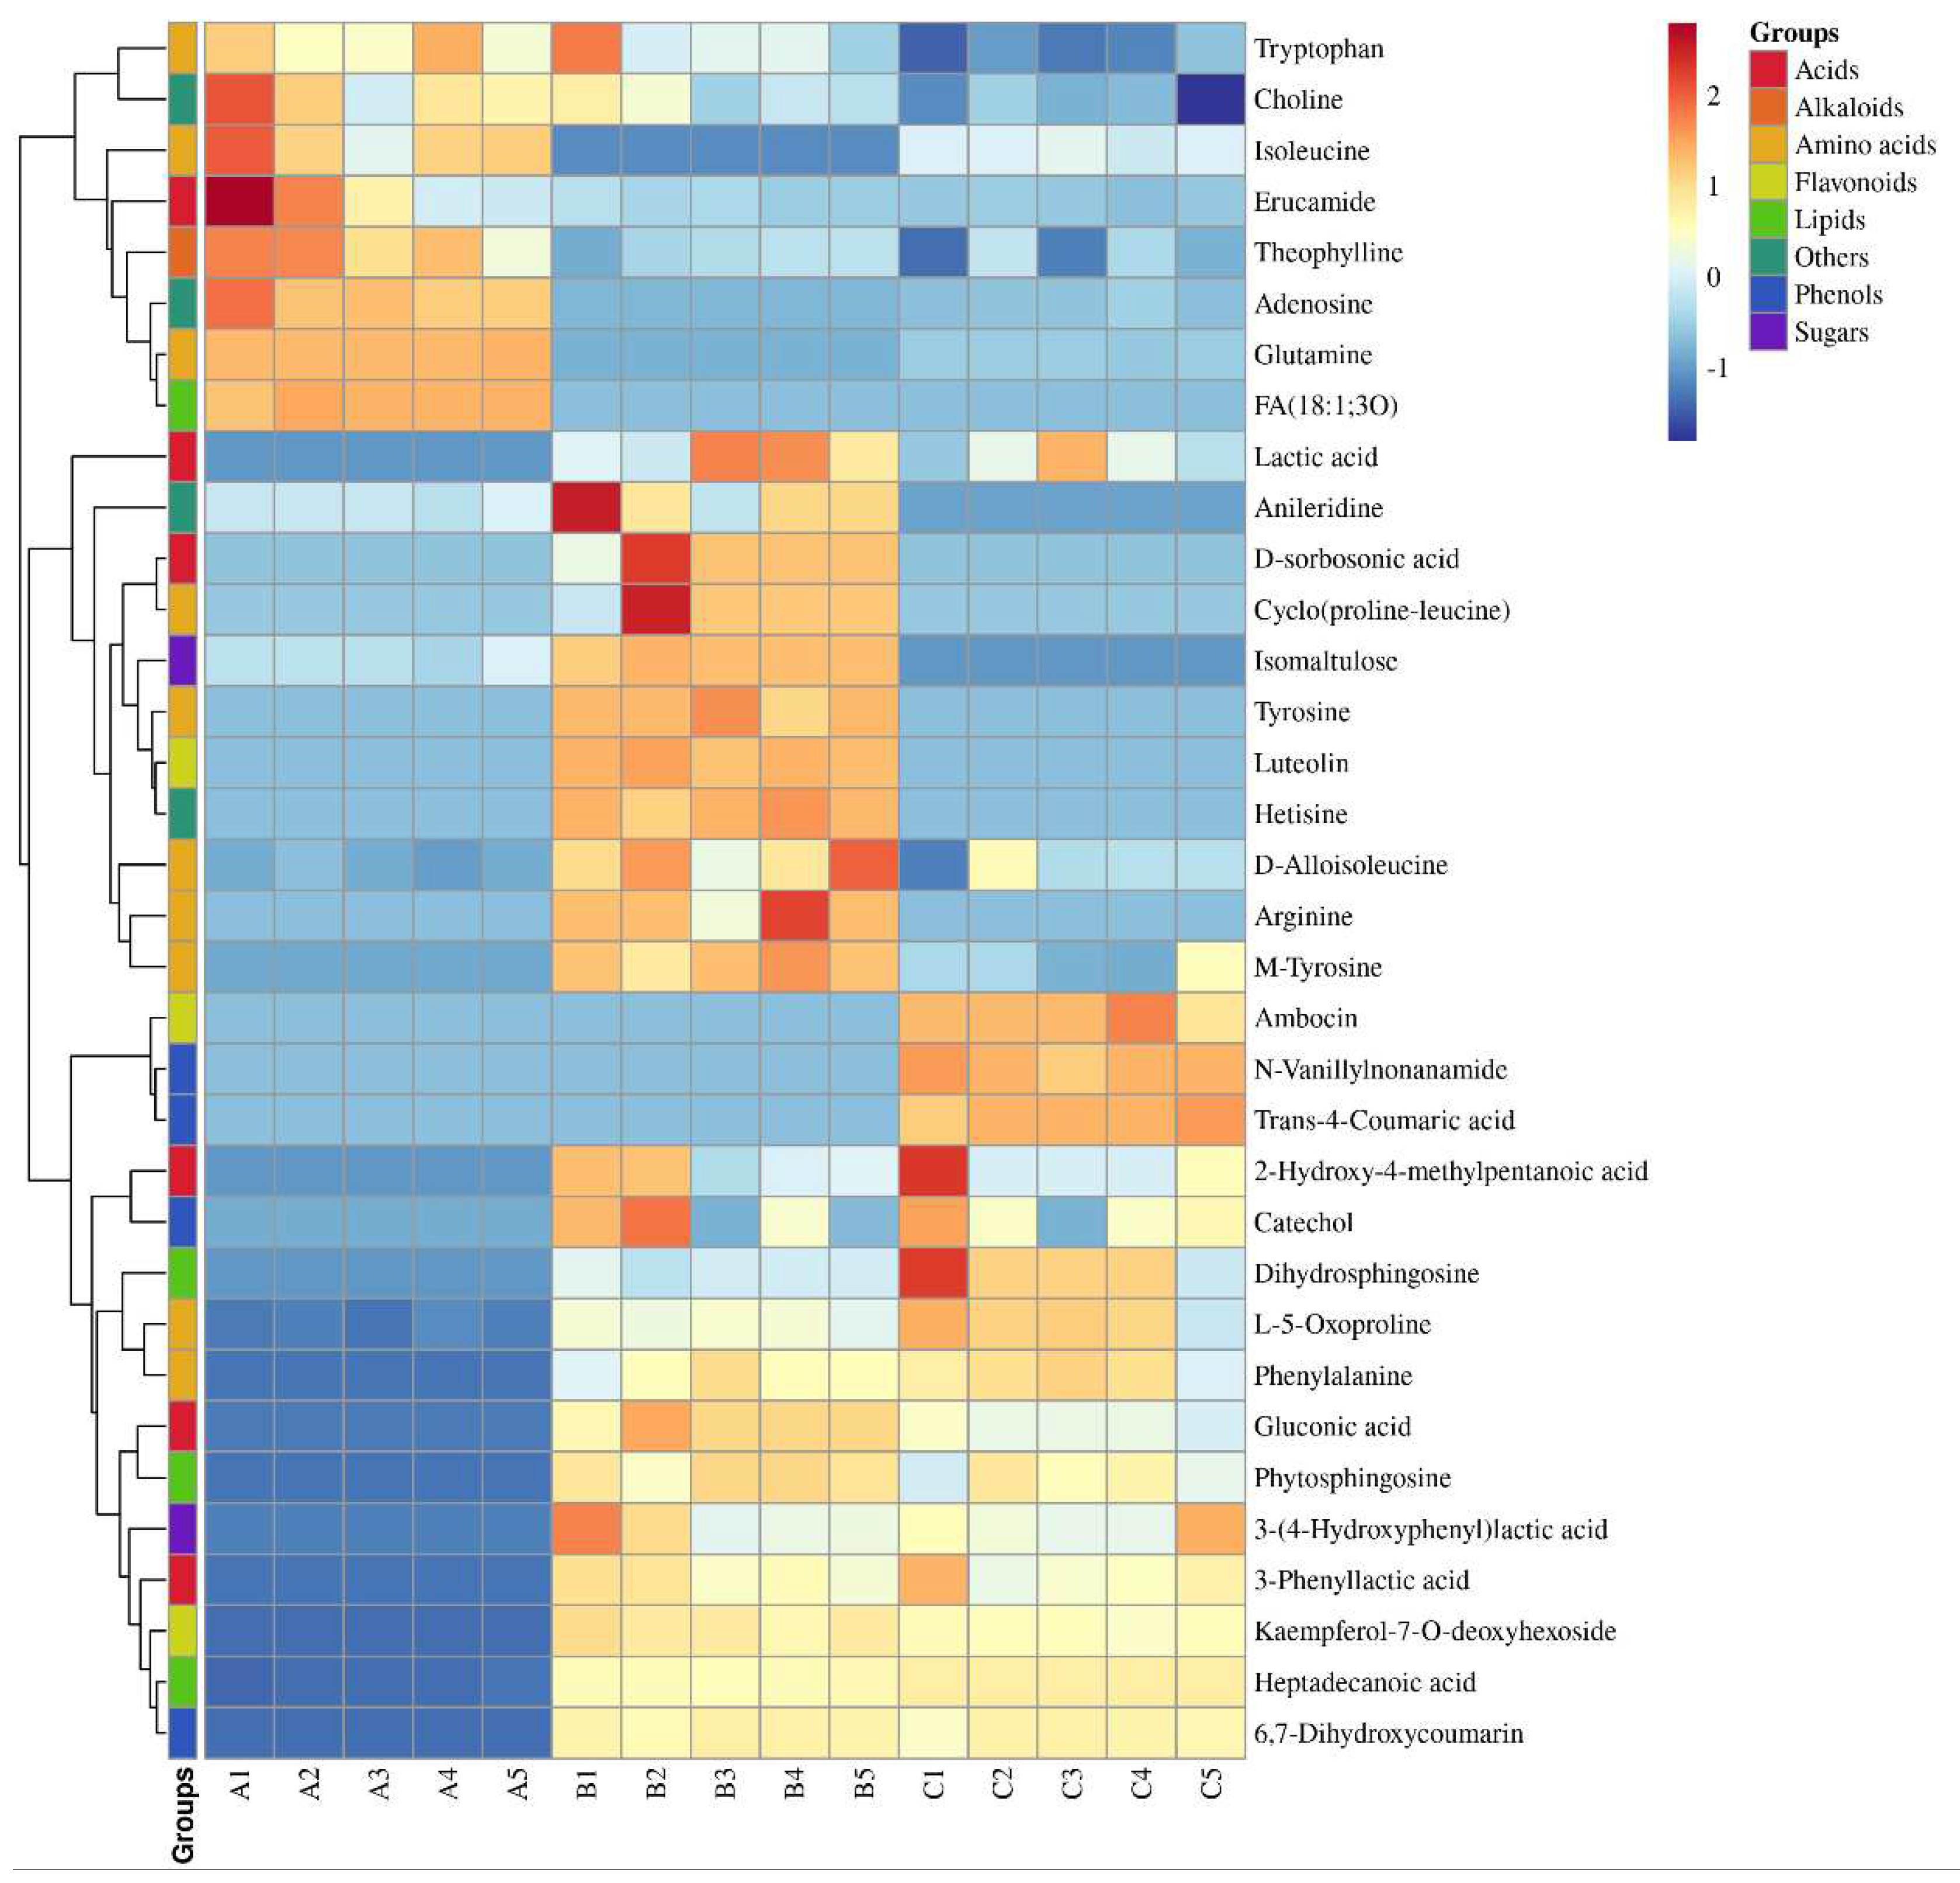
A semi-quantitative analysis of the 34 markers of variability was performed using dihydrocapsaicin as a standard (
Table 1). The dynamic changes in these components were visualized using a heat map (
Figure 3). The results showed that the lipid component showed the most significant increase, from 24.1 μg/g to 307.7 μg/g. Additionally, the content of organic acids initially increased from 44.3 μg/g to 347.1 μg/g, before slightly decreasing. The content of amino acids also showed a slight increase, from 160.0 μg/g to 199.6 μg/g. Among the aromatic amino acids (AAA), Phe showed the most significant increase, from zero to 60.57 μg/g, while the content of Tyr and Try was relatively low, less than one-third of the Phe content.
3.3. Identification of taste-active metabolites using VirtualTaste
In this study, a VirtualTaste tool was utilized to assess the taste attributes of the 34 differential components. The results presented in
Table 1 identified. A total of 13 sweetness-related metabolites, including arginine, D-alloisoleucine, glutamine, isoleucine, L-5-oxoproline, phenylalanine, ambocin, kaempferol-7-O-deoxyhexoside, dihydrosphingosine, phytosphingosine, catechol, and isomaltulose. Additionally, 9 sour-related metabolites were identified, namely 2-hydroxy-4-methylpentanoic acid, 3-phenyllactic acid, D-sorbosonic acid, gluconic acid, lactic acid, 3-(4-Hydroxyphenyl)-lactic acid, fatty acids, heptadecanoic acid, and trans-4-coumaric acid. Finally, 10 bitter-related metabolites were identified, including erucamide, theophylline, cyclo (proline-leucine), tyrosine, luteolin, adenosine, anileridine, choline, hetisine, and 6,7-dihydroxycoumarin.
Fermented chili sauce is a popular and widely consumed condiment, but its flavor profile and key taste-active metabolites are not fully understood. In this study, the top five main taste-active metabolites in fermented chili sauce were identified based on their VIP values. Dihydrosphingosine, isoleucine, and phytosphingosine were found to have sweet taste properties, while lactic acid and gluconic acid had sour taste properties. These five metabolites could be used as key taste markers in the production of chili sauce, and adjusting their proportions could potentially enhance the taste qualities of the sauce. Interestingly, the unique flavor component in chilies comes from their alkaloids, particularly capsaicinoids. The study found that the fermentation process of LP did not have a significant impact on the spiciness of chilies. This result suggests that other factors, such as the type of chili used or the duration of fermentation, may play a more critical role in modulating the spiciness of chili sauce.
Taste evaluation is important in assessing the quality of fermented chili sauce, but the traditional sensory evaluation method by a trained panel of experts is time-consuming, expensive, and involves potential risks associated with direct assessment of taste using the tongue. Therefore, an effective and efficient method to predict the taste characteristics of compounds in fermented chili sauce is urgently needed. Machine learning modelling has shown promising results in predicting the taste of food ingredients. VirtualTaste, an online tool developed for this purpose, has reported an accuracy of 96% in predicting sweet and bitter taste using an independent test set, with an AUC of 0.98 [
21].
3.4. KEGG annotation and interpretation of pathway
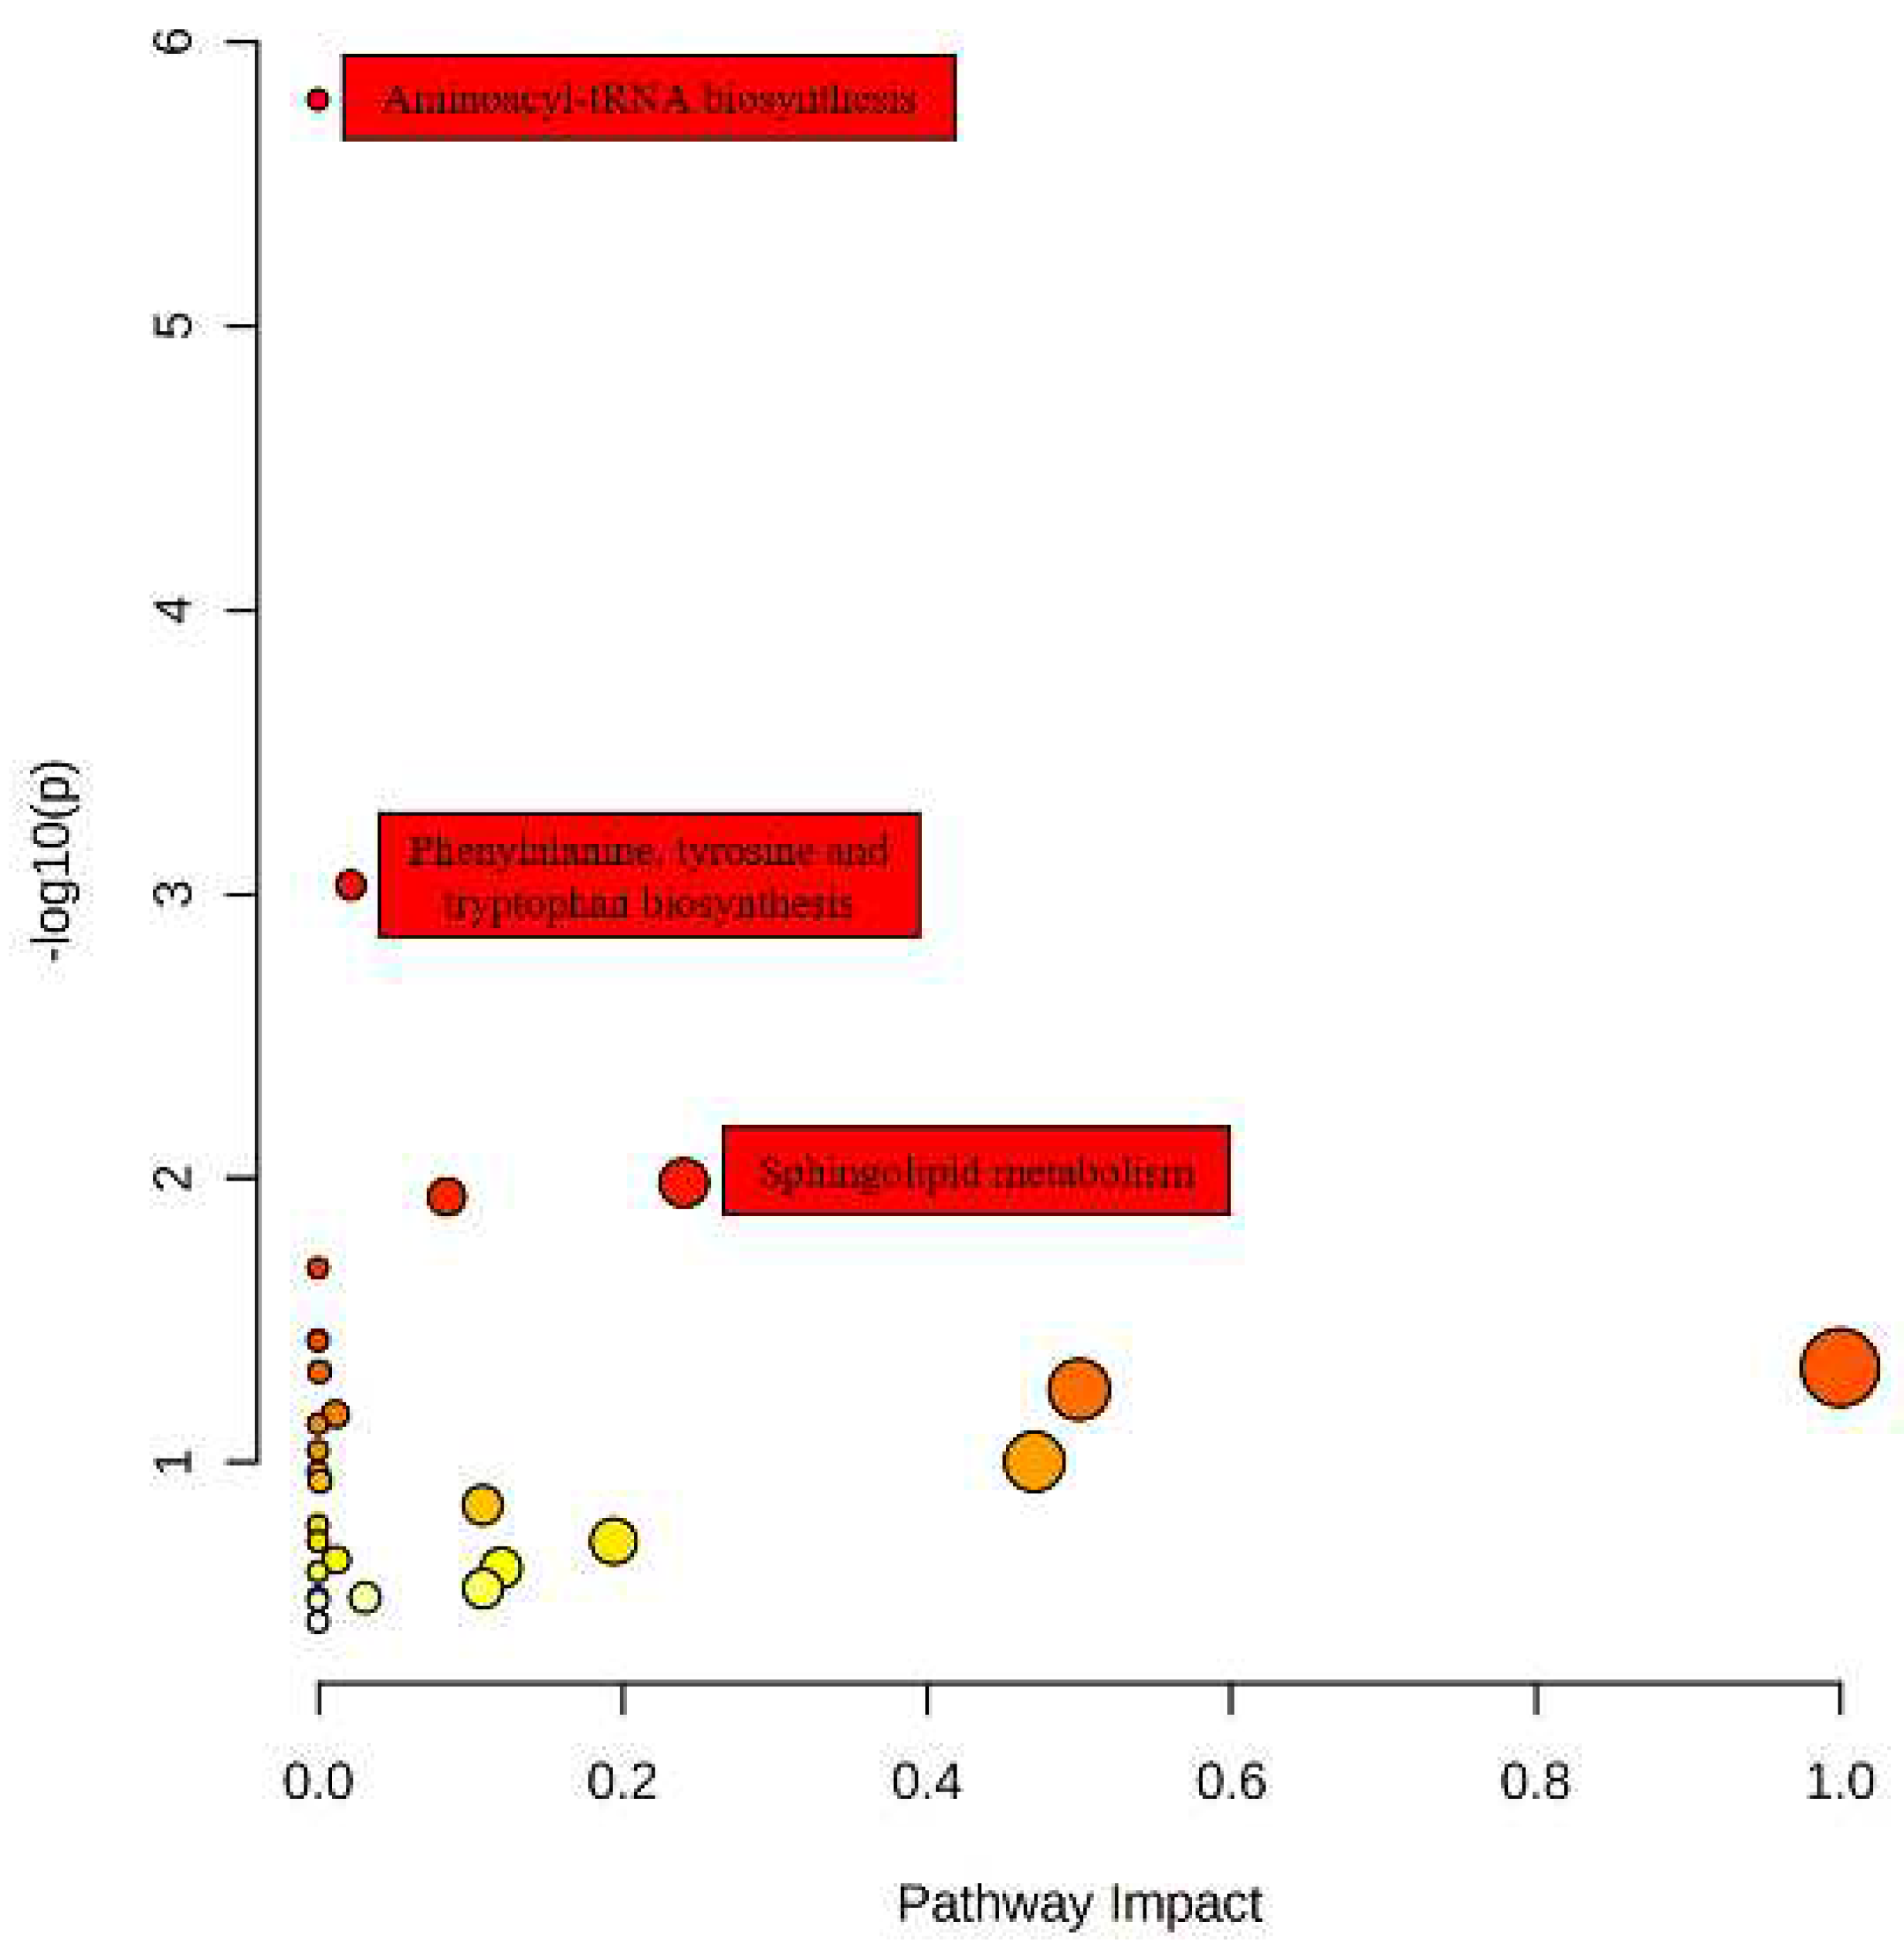
Pathway enrichment analysis is a common method used in bioinformatics to identify enriched metabolic or signaling pathways based on metabolomics data. The study has successfully identified 34 differential metabolites that are associated with 29 metabolic pathways by performing KEGG pathway analysis. The findings of the study are visually represented in
Figure 4, which shows the significance of each pathway based on both
p-value and impact factor. The pathways with the highest significance are depicted with larger and darker bubbles in the figure. The pathways involved in amino acid tRNA, phenylalanine, tyrosine, and tryptophan biosynthesis, as well as sphingolipid metabolism, were identified as significant pathways based on a rigorous screening process. Specifically, this process entailed a
p-value threshold of less than 0.05 and an influence factor threshold of greater than 0.1, or a
p-value threshold of less than 0.001.
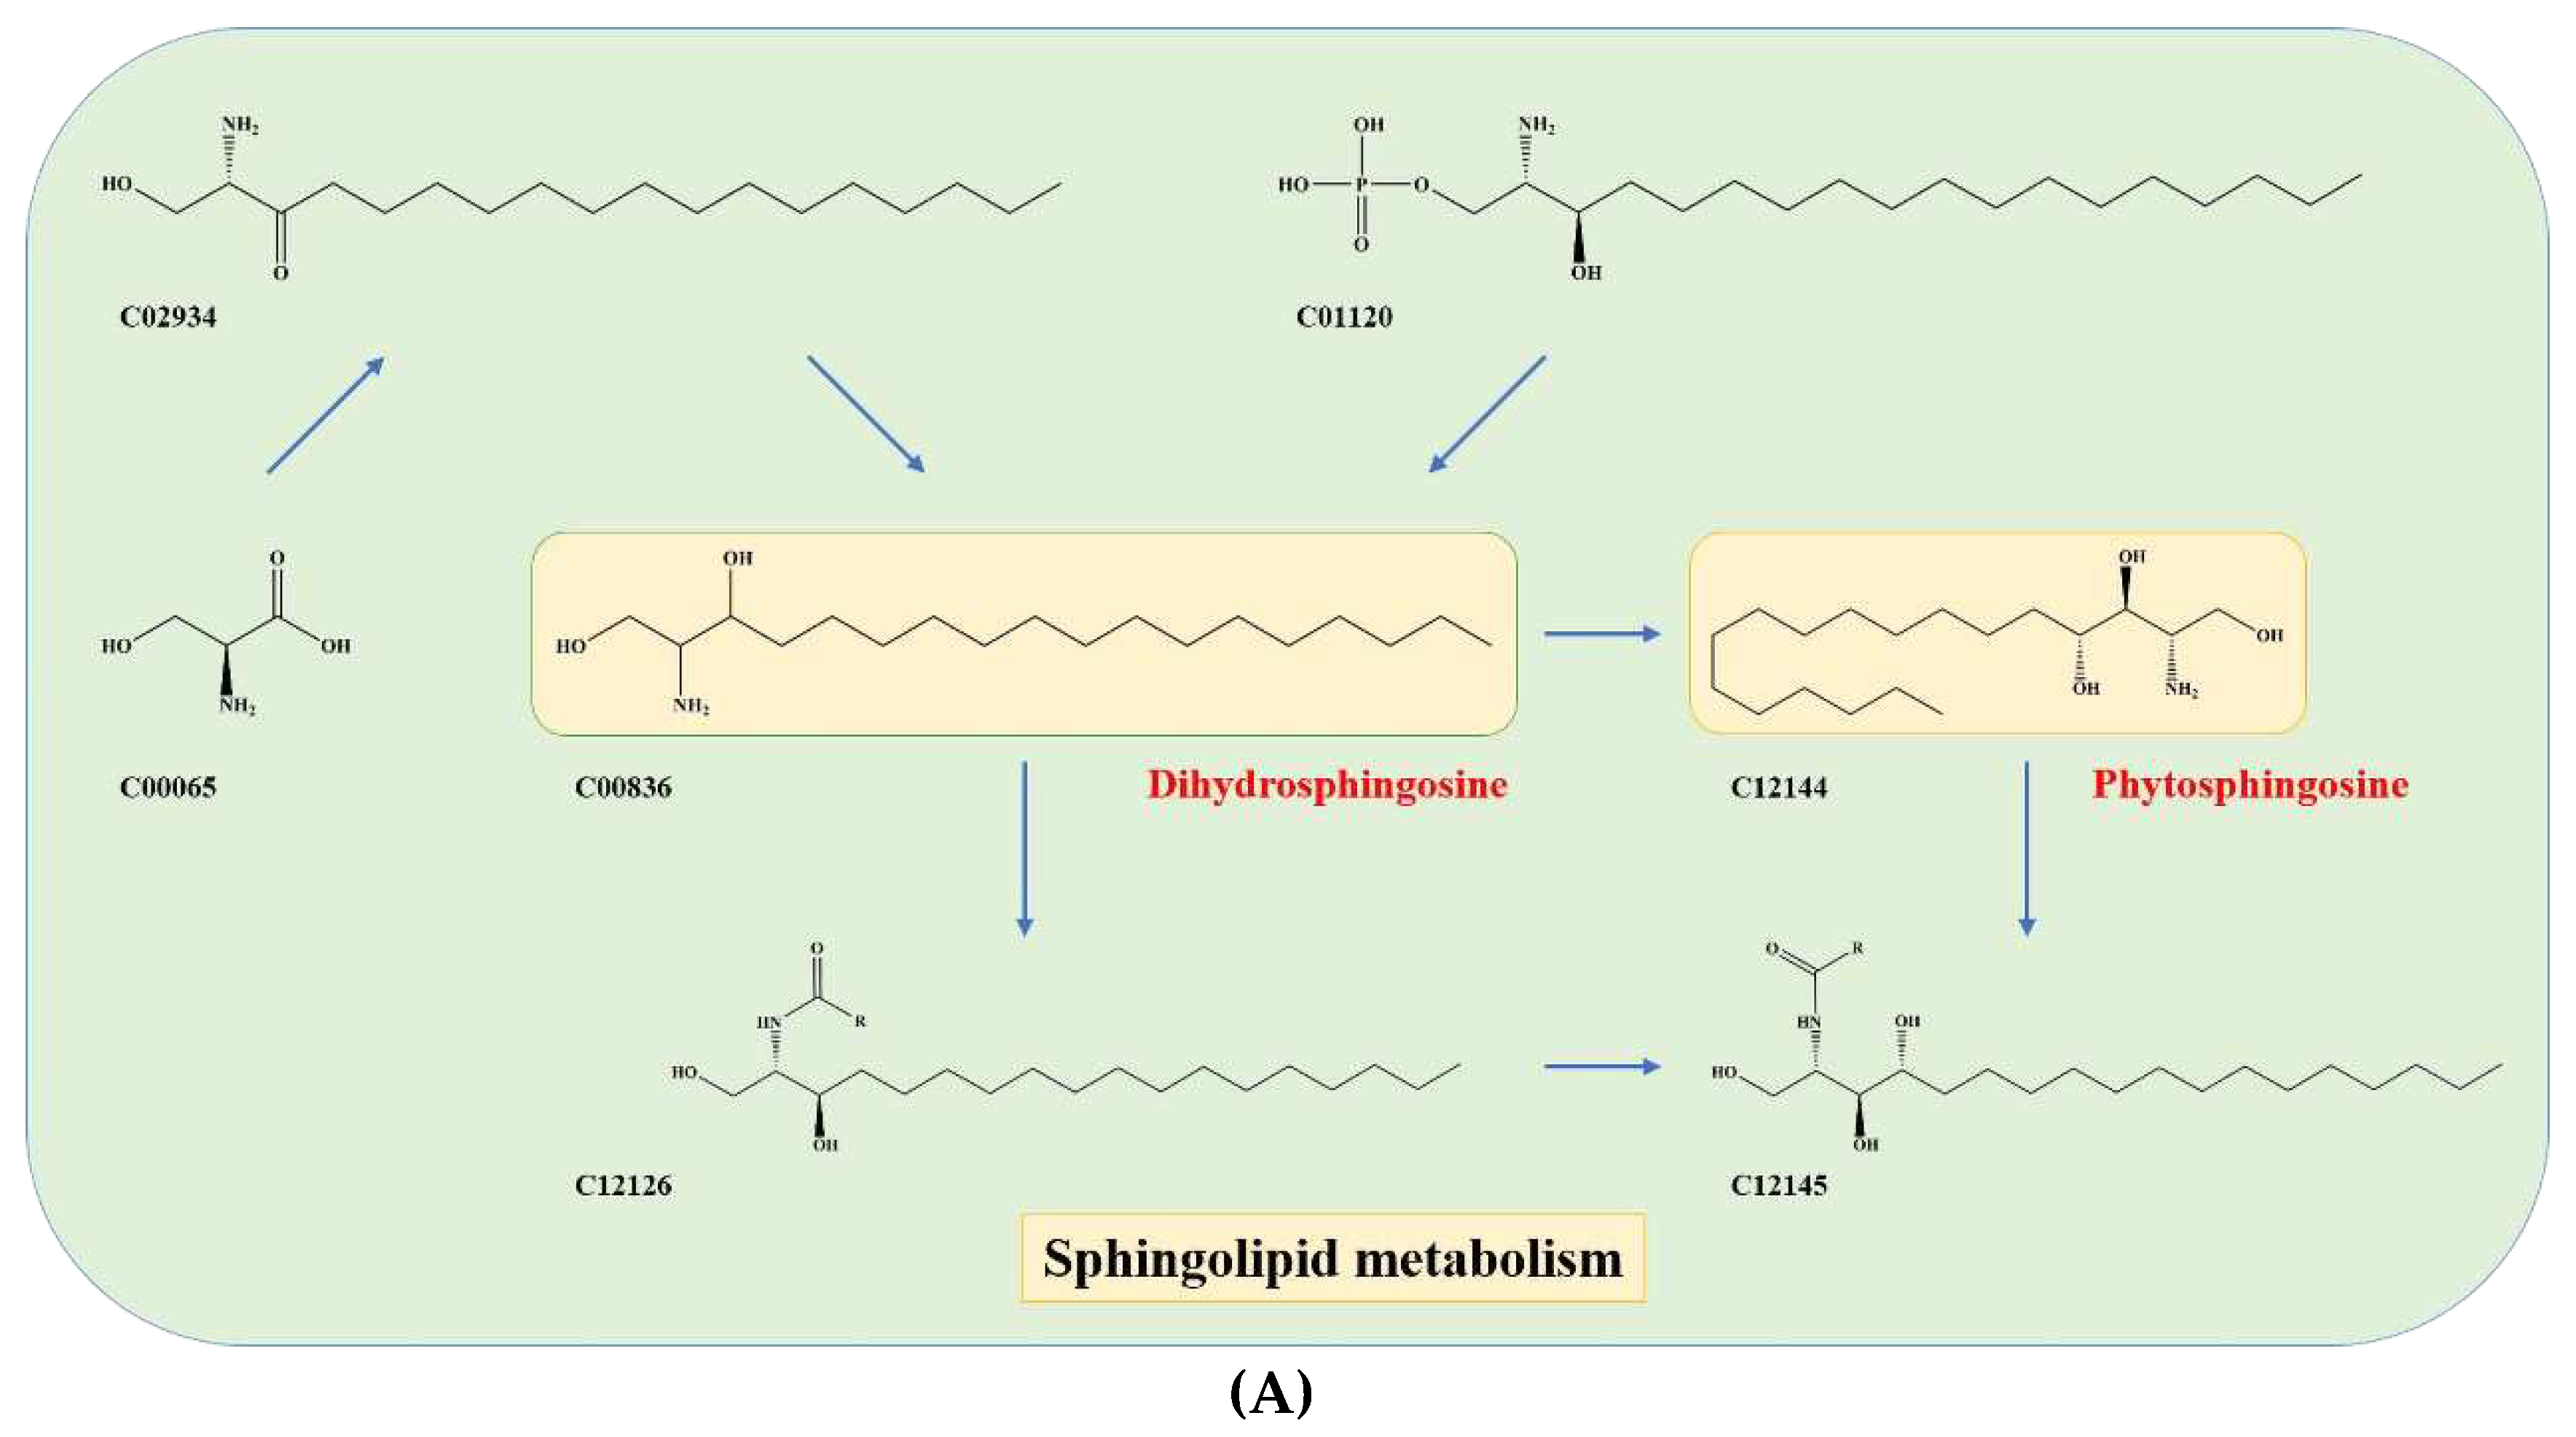
The study highlight that serine (C00065) is an important precursor component of dihydrosphingosine (DHS; C00836) and phytosphingosine (PHS; C12144) (
Figure 5A), which are mainly involved in the early stages of sphingolipid biosynthesis
The present study highlights the pivotal role of serine (C00065) as a precursor molecule in the biosynthesis of dihydrosphingosine (DHS; C00836) and phytosphingosine (PHS; C12144) (
Figure 5A). These two sphingolipids are essential components in the initial stages of sphingolipid biosynthesis, which play critical roles in various cellular functions, including but not limited to signal transduction, cell growth, and apoptosis. Sphingolipid biosynthesis requires a series of enzymatic reactions that involve several precursor molecules, among which serine holds significant importance. Thus, the availability of serine is a crucial factor that determines the efficiency of sphingolipid biosynthesis, thereby impacting the taste [
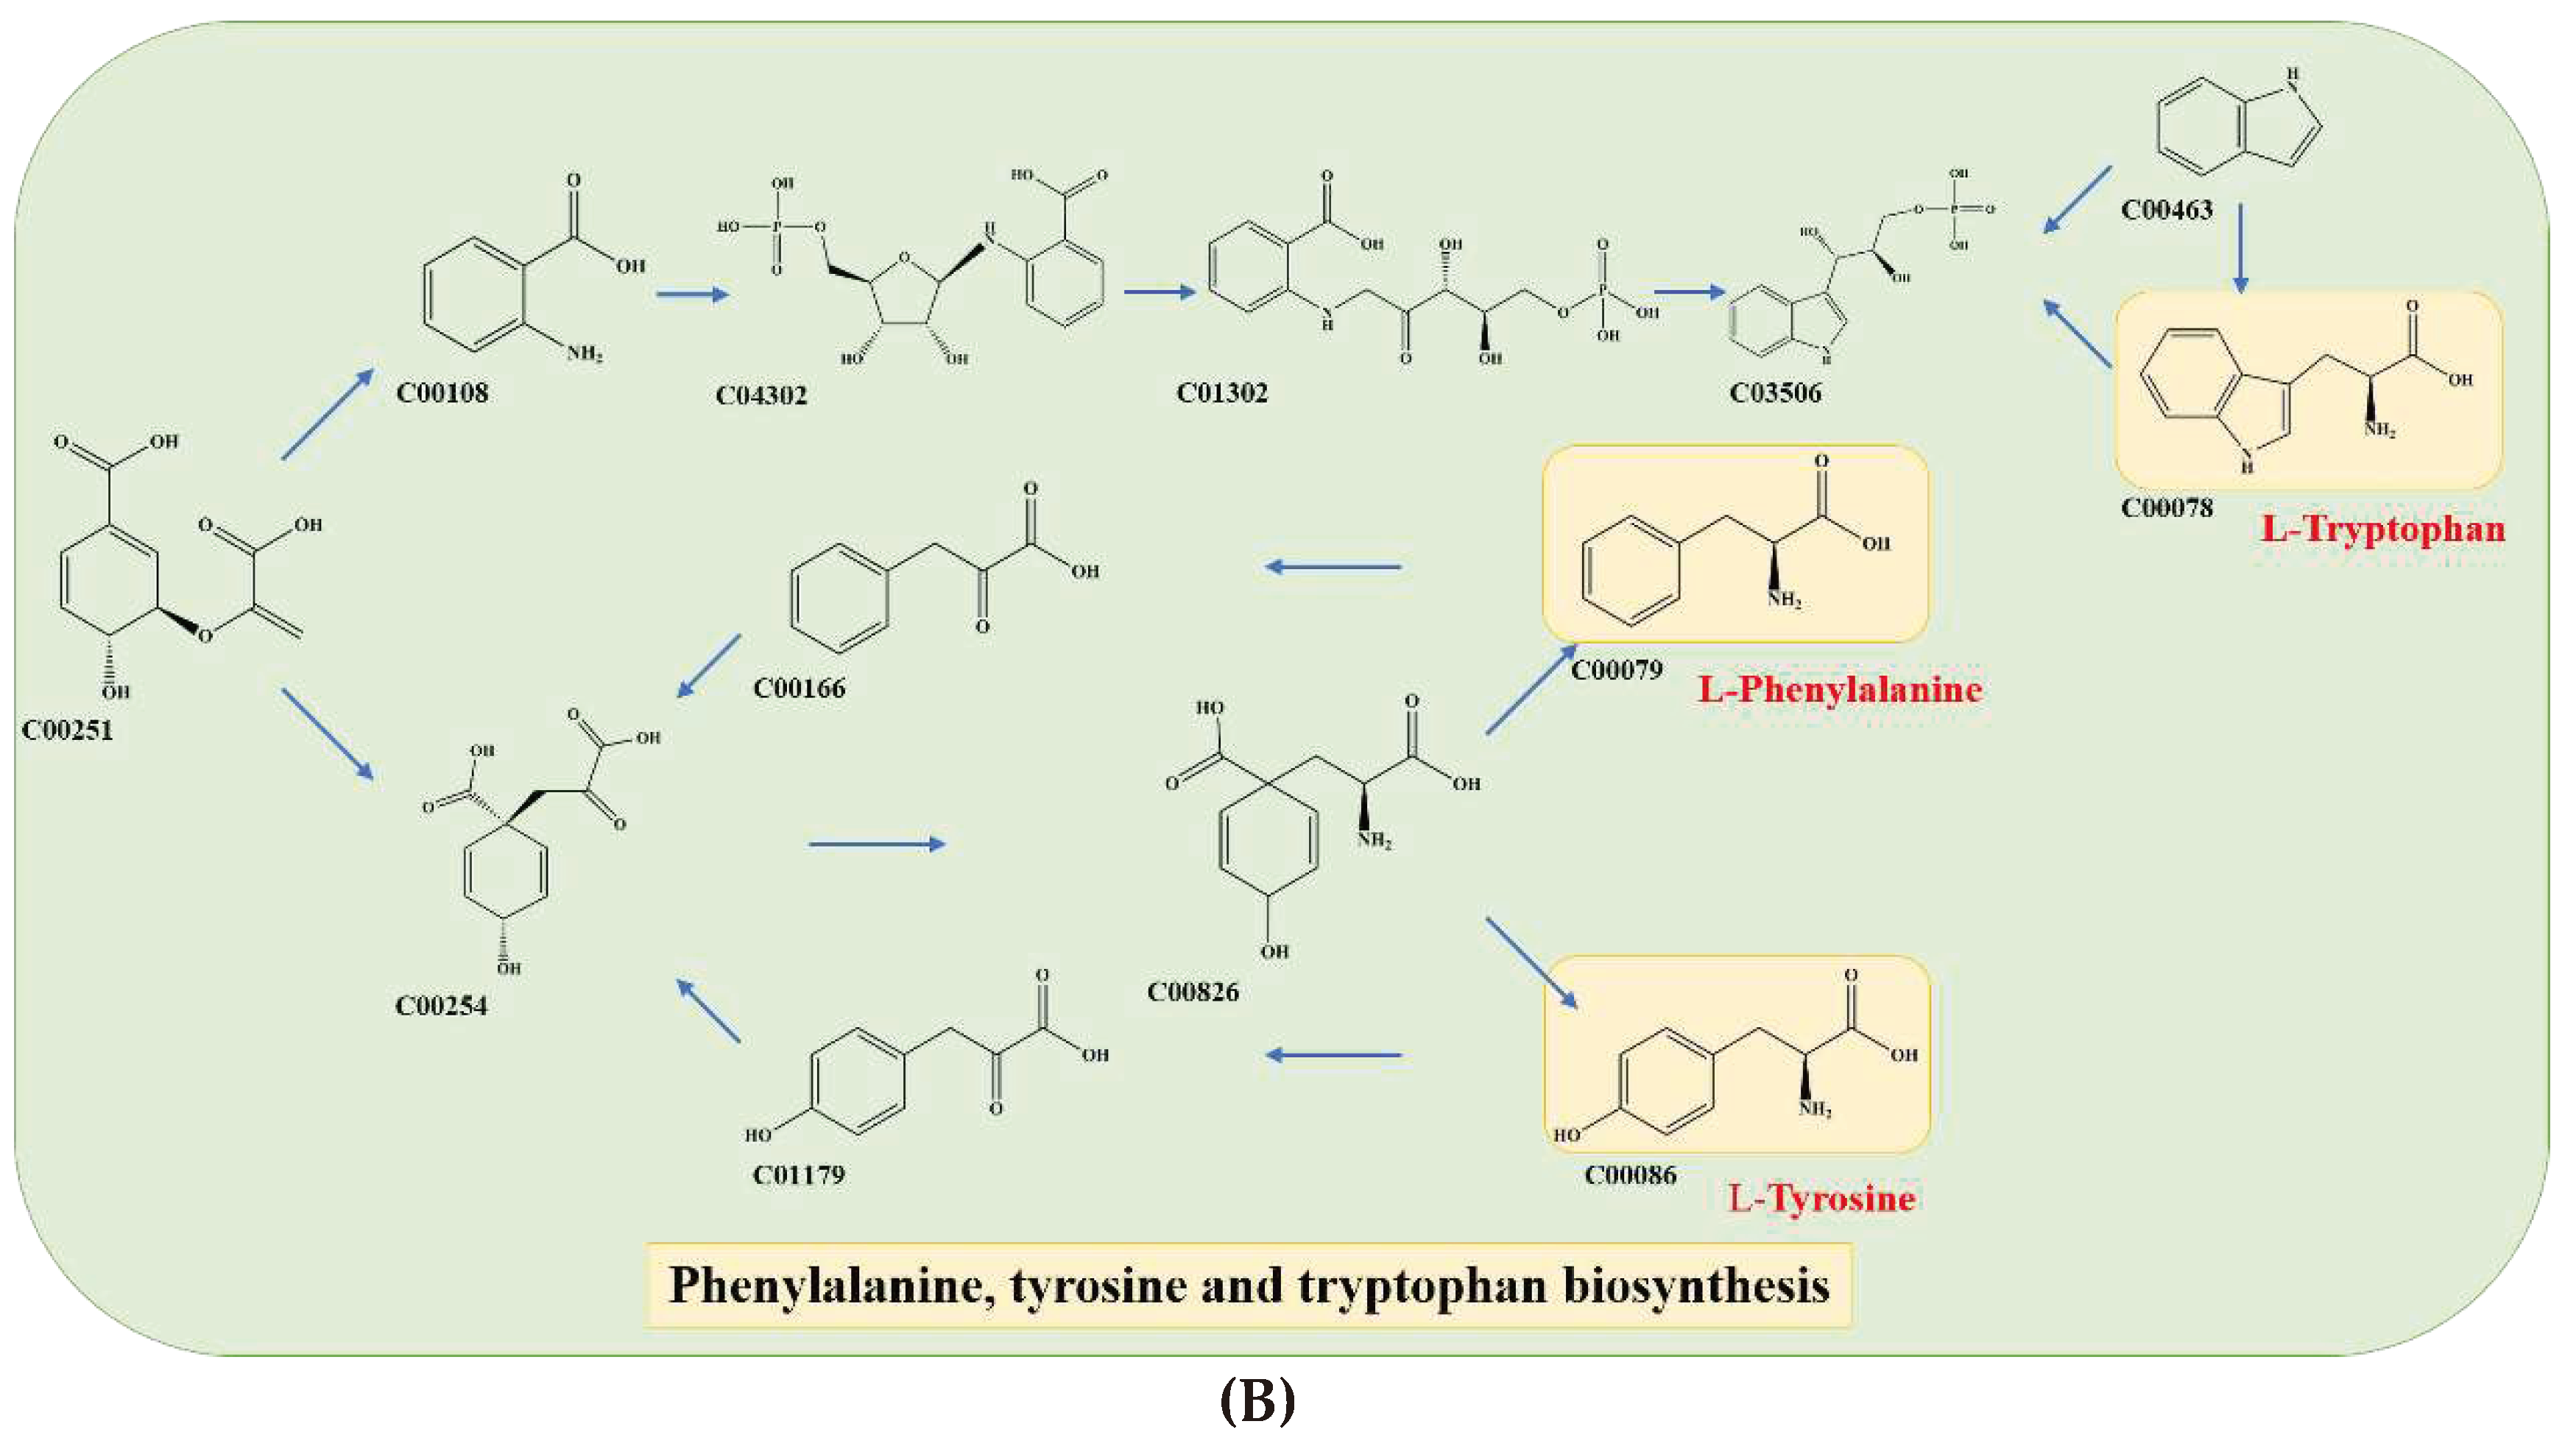
22]. Additionally, two other metabolic pathways were identified as key pathways of aromatic amino acid (AAA) metabolism, including phenylalanine, tryptophan, and tyrosine metabolism. Chorismate (C00251) was identified as a crucial precursor material that is converted to anthranilate (C00108) and prephenate (C00254) (
Figure 5B), ultimately leading to the formation of AAAs [
23].
These findings provide valuable insights into the metabolic pathways underlying the development of taste in chili sauce and may have implications for improving its flavor and nutritional properties. Modulating the proportions of these precursor metabolites could potentially be used to optimize the taste profile of chili sauce.
In summary, we have successfully utilized metabolomics techniques and network computing tools to non-targeted determine the taste-active components in chili sauce. Our research has employed the FBMN and multivariate statistical analysis, providing crucial insights into the metabolic pathways involved in the development of taste in chili sauce. By integrating VirtualTaste with metabolomics, we have demonstrated a promising approach for rapidly predicting the taste characteristics of compounds in fermented chili sauce. The identification of specific metabolic markers associated with taste formation in chili sauce may have broader implications for improving the flavor and nutritional properties of other foods. Our research highlights the potential of metabolomics and web-based computational tools in flavor research. However, further verification of the taste properties of these key components through artificial sensory testing is necessary.
Supplementary Materials
The following supporting information can be downloaded at the website of this paper posted on Preprints.org.
Author Contributions
Jiaqi Wang: Writing original draft. Sen Mei: Experiments. Chi Jin: Data Analysis. Muhammad Aamer Mehmood: Data Analysis. Qing Zhang:Methodology, Supervision. Tao Hu: Supervision. Weili Li: Methodology, Supervision. Tao Wu: Conceptualization, Writing-review & editing, Supervision. All authors have read and agreed to the published version of the manuscript.
Funding
We are grateful for the financial support from Sichuan Technology Development Program, China (2020YFN0056, 2021ZHCG0051, 2020YFN0094, 2021YFN0048, 2020YFN0151), the Natural Science Foundation of Sichuan Province (Grant number 2022NSFSC0105) and Pidu 100 Innovative Talents Program (2022).
Conflicts of Interest
The authors declare that they have no known competing financial interests or personal relationships that could have appeared to influence the work reported in this paper.
References
- Li, X.; Cheng, X.; Yang, J.; Wang, X.; Lü, X. Unraveling the difference in physicochemical properties, sensory, and volatile profiles of dry chili sauce and traditional fresh dry chili sauce fermented by Lactobacillus plantarum PC8 using electronic nose and HS-SPME-GC-MS. Food Bioscience 2022, 50. [Google Scholar] [CrossRef]
- Zheng, Y.; Chen, J.; Chen, L.; Hu, T.; Shi, L.; Wan, S.P.; Wang, M. Analysis and control of microbial gas production in fermented chili paste. J. Food Process. Preserv. 2020, 44. [Google Scholar] [CrossRef]
- Hu, Y.Y.; Zhang, L.; Wen, R.X.; Chen, Q.; Kong, B.H. Role of lactic acid bacteria in flavor development in traditional Chinese fermented foods: A review. Crit. Rev. Food Sci. Nutr. 2022, 62, 2741–2755. [Google Scholar] [CrossRef]
- Echegaray, N.; Yilmaz, B.; Sharma, H.; Kumar, M.; Pateiro, M.; Ozogul, F.; Lorenzo, J.M. A novel approach to Lactiplantibacillus plantarum: From probiotic properties to the omics insights. Microbiological Research 2023, 268, 127289. [Google Scholar] [CrossRef] [PubMed]
- Besnard, P.; Passilly-Degrace, P.; Khan, N.A. Taste of Fat: A Sixth Taste Modality? Physiological Reviews 2016, 96, 151–176. [Google Scholar] [CrossRef]
- Li, X.; Cheng, X.; Yang, J.; Wang, X.; Lü, X. Unraveling the difference in physicochemical properties, sensory, and volatile profiles of dry chili sauce and traditional fresh dry chili sauce fermented by Lactobacillus plantarum PC8 using electronic nose and HS-SPME-GC-MS. Food Bioscience 2022, 50, 102057. [Google Scholar] [CrossRef]
- Avula, B.; Katragunta, K.; Wang, Y.-H.; Ali, Z.; Srivedavyasasri, R.; Gafner, S.; Slimestad, R.; Khan, I.A. Chemical profiling and UHPLC-QToF analysis for the simultaneous determination of anthocyanins and flavonoids in Sambucus berries and authentication and detection of adulteration in elderberry dietary supplements using UHPLC-PDA-MS. Journal of Food Composition and Analysis 2022, 110. [Google Scholar] [CrossRef]
- Barathikannan, K.; Chelliah, R.; Yeon, S.J.; Tyagi, A.; Elahi, F.; Vijayalakshmi, S.; Agastian, P.; Arockiasami, V.; Hawn Oh, D. Untargeted metabolomics of fermented onion (Allium cepa L) using UHPLC Q-TOF MS/MS reveals anti-obesity metabolites and in vivo efficacy in Caenorhabditis elegans. Food Chem. 2022, 404, 134710. [Google Scholar] [CrossRef]
- Dadwal, V.; Joshi, R.; Gupta, M. A comparative metabolomic investigation in fruit sections of Citrus medica L. and Citrus maxima L. detecting potential bioactive metabolites using UHPLC-QTOF-IMS. Food Res. Int. 2022, 157, 111486. [Google Scholar] [CrossRef]
- Dadwal, V.; Joshi, R.; Gupta, M. Comparative metabolomics of Himalayan crab apple (Malus baccata) with commercially utilized apple (Malus domestica) using UHPLC-QTOF-IMS coupled with multivariate analysis. Food Chem. 2023, 402, 134529. [Google Scholar] [CrossRef]
- Vinaixa, M.; Schymanski, E.L.; Neumann, S.; Navarro, M.; Salek, R.M.; Yanes, O. Mass spectral databases for LC/MS- and GC/MS-based metabolomics: State of the field and future prospects. TrAC Trends in Analytical Chemistry 2016, 78, 23–35. [Google Scholar] [CrossRef]
- Olivon, F.; Grelier, G.; Roussi, F.; Litaudon, M.; Touboul, D. MZmine 2 Data-Preprocessing To Enhance Molecular Networking Reliability. ANALYTICAL CHEMISTRY 2017, 89, 7836–7840. [Google Scholar] [CrossRef] [PubMed]
- Nothias, L.F.; Petras, D.; Schmid, R.; Duhrkop, K.; Rainer, J.; Sarvepalli, A.; Protsyuk, I.; Ernst, M.; Tsugawa, H.; Fleischauer, M.; et al. Feature-based molecular networking in the GNPS analysis environment. Nat. Methods 2020, 17, 905. [Google Scholar] [CrossRef]
- Zhao, X.; Hengchao, E.; Dong, H.; Zhang, Y.; Qiu, J.; Qian, Y.; Zhou, C. Combination of untargeted metabolomics approach and molecular networking analysis to identify unique natural components in wild Morchella sp. by UPLC-Q-TOF-MS. Food Chem. 2022, 366, 130642. [Google Scholar] [CrossRef] [PubMed]
- Zhang, Y.; Bian, X.; Yan, G.; Sun, B.; Miao, W.; Huang, M.; Li, N.; Wu, J.-L. Discovery of novel ascorbic acid derivatives and other metabolites in fruit of Rosa Roxburghii Tratt through untargeted metabolomics and feature-based molecular networking. Food Chem. 2022, 405, 134807. [Google Scholar] [CrossRef] [PubMed]
- Fritz, F.; Preissner, R.; Banerjee, P. VirtualTaste: a web server for the prediction of organoleptic properties of chemical compounds. Nucleic Acids Research 2021, 49, W679–W684. [Google Scholar] [CrossRef] [PubMed]
- Tobolka, A.; Škorpilová, T.; Dvořáková, Z.; Cusimamani, E.F.; Rajchl, A. Determination of capsaicin in hot peppers (Capsicum spp.) by direct analysis in real time (DART) method. Journal of Food Composition and Analysis 2021, 103. [Google Scholar] [CrossRef]
- Tsugawa, H.; Ikeda, K.; Takahashi, M.; Satoh, A.; Mori, Y.; Uchino, H.; Okahashi, N.; Yamada, Y.; Tada, I.; Bonini, P.; et al. A lipidome atlas in MS-DIAL 4. Nat Biotechnol 2020, 38, 1159–1163. [Google Scholar] [CrossRef] [PubMed]
- Otasek, D.; Morris, J.H.; Bouças, J.; Pico, A.R.; Demchak, B. Cytoscape Automation: empowering workflow-based network analysis. Genome Biology 2019, 20, 185. [Google Scholar] [CrossRef]
- Blaško, J.; Nižnanská, Ž.; Kubinec, R.; Mikuláš, Ľ.; Nižnanský, Ľ.; Kubincová, J.; Kunštek, M.; Duháčková, Ľ.; Hrčka, R.; Kabát, J.; et al. Simple, fast method for the sample preparation of major capsaicinoids in ground peppers, in potato chips and chilli sauces and their analysis by GC-MS. Journal of Food Composition and Analysis 2022, 114, 104733. [Google Scholar] [CrossRef]
- Banerjee, P.; Preissner, R. BitterSweetForest: A Random Forest Based Binary Classifier to Predict Bitterness and Sweetness of Chemical Compounds. Frontiers in Chemistry 2018, 6. [Google Scholar] [CrossRef] [PubMed]
- Ferreira, C.R.; Goorden, S.M.I.; Soldatos, A.; Byers, H.M.; Ghauharali-van der Vlugt, J.M.M.; Beers-Stet, F.S.; Groden, C.; van Karnebeek, C.D.; Gahl, W.A.; Vaz, F.M.; et al. Deoxysphingolipid precursors indicate abnormal sphingolipid metabolism in individuals with primary and secondary disturbances of serine availability. Mol. Genet. Metab. 2018, 124, 204–209. [Google Scholar] [CrossRef] [PubMed]
- Cao, M.; Gao, M.; Suastegui, M.; Mei, Y.; Shao, Z. Building microbial factories for the production of aromatic amino acid pathway derivatives: From commodity chemicals to plant-sourced natural products. Metab. Eng. 2020, 58, 94–132. [Google Scholar] [CrossRef] [PubMed]
|
Disclaimer/Publisher’s Note: The statements, opinions and data contained in all publications are solely those of the individual author(s) and contributor(s) and not of MDPI and/or the editor(s). MDPI and/or the editor(s) disclaim responsibility for any injury to people or property resulting from any ideas, methods, instructions or products referred to in the content. |
© 2023 by the authors. Licensee MDPI, Basel, Switzerland. This article is an open access article distributed under the terms and conditions of the Creative Commons Attribution (CC BY) license (http://creativecommons.org/licenses/by/4.0/).

