
Submitted:
05 March 2023
Posted:
13 March 2023
You are already at the latest version
Abstract
The gut microbiota plays a crucial role in childhood obesity, and diet is a dominating driver. The effects of fructo-oligosaccharides (FOS), as a dietary fiber, on the composition and metabolism of gut microbiota in healthy children was investigated by vitro fermentation system with a reformative YCFA medium (rich in tryptic hydrolysates of meat). The 16S rRNA sequencing technology was utilized to analyze the varieties of gut microbiota. Measurement of short chain fatty acids (SCFAs) and gases were used by the gas chromatograph. Majorbio Cloud Platform and MetOrigin, as the interactive cloud server, perform the microbiota analysis, the metabolic pathway enrichment analysis, the statistical correlations, and biological relationships using network visualization. We found that the FOS group significantly regulated the composition and metabolism of gut microbiota. The co-metabolism network showed that 3 metabolites were related to 6 differential bacteria and 8 metabolism pathways. These findings suggest that dietary fiber could regulate the composition of gut microbiota and its metabolites in a better direction, but when dietary fiber participates in precision nutrition formula, it may be relevant for precision obesity, may help identify windows of opportunity for the dietary intervention of childhood obesity.
Keywords:
dietary fiber
; childhood obesity
; gut microbiota
; metabolite
; high-meat diet
1. Introduction
Obesity has become a general health issue in children in recent decades. Obesity is a higher risk factor in the process of type 2 diabetes, cardiovascular diseases, and colon cancer e [1]. Childhood obesity tracks to adolescence and adulthood [2]; thus, most adolescents with obesity may have a higher risk of metabolic disorders such as dyslipidemia, insulin resistance, and hypertension in adult life [3,4].
Excessive meat intake and transformation to lipid amassing in the body are the primary drivers of obesity. In this way, a reasonable diet is a vital aspect of avoiding obesity. Dietary varieties, including high fat, high protein, and other undesirable dietary examples [5,6], are significant obesity-causing factors except for genetic background, exercise propensities, mental status, and sleep [7]. An investigation revealed that from youth to pre-adulthood, dietary quality reductions were essential, particularly decreases in organic products, vegetable, and complete dairy consumption, followed by expanding meat consumption [8]. Mozaffarian et al. found that weight gain is positively connected with the intake of potato chips, sweet refreshments, and red meats and is conversely connected with the intake of vegetables, natural products, nuts, and yogurt [9]. In the past three decades, the progress from a customary low meat, high dietary fiber to a high meat and low dietary fiber has increased the risk of obesity in China [10]. Accordingly, further examinations of the dietary patterns influencing children's health are urgently needed.
Accumulating evidence suggests that a dysbiotic gut microbiota may contribute to diet-related obesity [11,12]. Germ-free mice were demonstrated to be impervious to high-sugar, high-fat, "Western" diet-induced obesity [13]. Transplantation of gut microbiota from corpulent mice or people expanded fat stores in germ-free mouse beneficiaries [14,15]. The advancement of adiposity and insulin resistance in mice could be fundamentally decreased by lessening the gut microbiota with broad-spectrum antibiotics [16]. Transplantation of gut microbiota from healthy benefactors further developed insulin resistance in the initial one and a half months in obese human volunteers [17]. Dietary fiber has been shown to diminish endotoxin markers and improve beneficial Bifidobacteria in the gut of obese volunteers, prompting diminished endotoxin in the bloodstream and critical easing of inflammation, adiposity and insulin resistance [18,19]. Thus, undeniable proof suggests that the gut microbiota is a vital contributing component in the improvement of diet-related obesity.
Having this as a main priority, the expanded interest in focusing on the gut microbiota for the treatment and counteraction of obesity is understandable. One of the significant impacts on the microbial signatures of people is diet [20], and one method for changing the microbiota is through an increase in dietary fiber intake [21]. As indicated by the United States Food and Drug Administration (FDA), dietary fiber, which is a carbohydrate part of an edible plant that is unable to be digested and absorbed, such as fructo-oligosaccharides (FOS), galacto-oligosaccharides (GOS), and resistant starch, has been shown to beneficially impact the composition of gut microbiota. In this way, dietary fiber cannot be digested by the host but can be matured by gut microbes in the distal digestive tract, bringing about the development of short-chain fatty acids (SCFAs), which are known to help energy homeostasis and metabolism [20].
Various mechanisms that associate gut microbiota with the risk of obesity and metabolic disorders depend on the discoveries of rodent models, yet the structure of gut microbiota in rodents is very different from that in humans [22]. As of now, researches on gut microbiota and metabolites are still chiefly focused on obese adults, while the exploration of obese children is moderately lacking [10]. Because of the significant difference in the structure of the gut microbiota among adults and children [23], future cohort studies that concentrate on the gut microbiota and metabolites in obese children are needed. In this research, we used an in vitro fermentation approach to address the constraints of prior human examinations. An in vitro fermentation with more straightforward examinations of various dietary fiber supplements: the higher throughput of in vitro fermentation permits more extensive assortment of dietary fiber to be tried, and the impacts of these enhancements can be tried on indistinguishable microbiota tests, as opposed to after some time within subjects, which is complicated by microbiota drift over time [24], as well as contradiction in dietary composition. Using in vitro fermentation the impacts of dietary fiber on gut microbiota permits a more straightforward way to study microbial metabolite production since we can concentrate on the impacts of dietary fiber supplementation independent of the impacts of host absorption [25]. Using a preclinical in vitro fermentation model and tests from healthy children, we sought to answer three explicit lines of inquiry: (i) Can dietary fiber modify the composition, diversity, or metabolites of the gut microbiota? (ii) Will such modification affect gut metabolite production, which is probably related to childhood obesity?
2. Materials and Methods
2.1. Materials and Reagents
FOS (purity ≥95% with ≤5% moisture) was purchased from Quantum Hi-Tech (China) Biological Co., Ltd. (Jiangmen, Guangdong, China). Bile salt, yeast extract, L-cysteine, NaCl, KH2PO4, K2HPO4, heme, MgSO4, CaCl2, and corrotonic acid were purchased from Sigma Company, USA. Tryptone is derived from the trypsin hydrolysis product of bovine bone and meat and was purchased from Beijing Dingguochangsheng Biotechnology Co., Ltd.
2.2. Collection of Fresh Fecal Samples from Healthy Volunteers
The body mass index (BMI) was calculated as the ratio of the weight in kilograms (kg) to the height (h) in meters squared (m2). The BMI for age Z scores (BFAZ) were calculated according to the criteria recommended by the WHO and then categorized as normal weight based on Chinese national standards [26]. Fresh gut samples were taken from healthy volunteers with normal weight who did not have a history of digestive diseases or any treatment with antibiotics, probiotics, or prebiotics for at least 1 month (20 boys and 20 girls, all aged between 6 and 15 years old). The volunteers had all been living in Hangzhou, Zhejiang Province, and had a decent eating routine (a balanced diet with vegetables and meat). The study was approved by the Ethical Committee of Hangzhou Centers for Disease Control and Prevention (No. 202047). Samples were collected and stored at 4 ℃ and tested within 4 hours.
2.3. Treatment of Fresh Fecal Samples
Using three 1.5 mL sterile centrifuge tubes, we separately weighed 0.2 g of fresh fecal samples taken from fecal sampling boxes, then stored them in an 80 °C freezer. 0.8 g of the fecal samples were then weighed into sterile 10 mL centrifuge tubes, 8 mL of sterile PBS buffer solution was then added, and the interfaces were fixed with tape. Lastly, a 10% fecal suspension inoculum was produced by combining the fecal and buffer solutions in the shaker and collecting the supernatant by filtering.
2.4. In Vitro Fermentation of Gut Microbiota
Gut microbiota were cultivated from fresh fecal samples utilizing a previously reported simulated gut fermentation system. [27]. The fundamental reformative YCFA medium contained the following (per 100 ml): 4.5 g/L yeast separate, 3.0 g/L tryptone, 3.0 g/L peptone, 0.4 g/L bile salt, 0.8 g/L cysteine hydrochloride, 4.5 g/L NaCl, 2.5 g/L KCl, 0.45 g/L MgCl2, 0.2 g/L CaCl2, 0.4 g/L KH2PO4, 1.0 mL Tween 80, 1.0 mL resazurin, and 2.0 mL of a trace element solution. Nitrogen was then introduced to keep the fluid surface of the medium free of oxygen after dissolving and boiling. Afterwards, a peristaltic pump was used to inject 4.5 mL of YCFA medium into vials. After that, a cap was placed on the vial, and it was high-pressure steamed to sanitize it. According to Table 1, the YCFA group may add anything to YCFA medium while the FOS group must add FOS at a proportion of 8 g/100 mL.
2.5. Genomic DNA Extraction and 16S rRNA High-Throughput Sequencing of Gut Microbiota
The FastDNA® Spin Kit for Soil (MP Biomedicals, U.S.) was used to extract the microbial community genomic DNA from the gut microbiota in accordance with the manufacturer's recommendations. The V3-V4 hypervariable portions of the bacterial 16S rRNA gene were amplified using the primers 341F (5′-CCTAYGGGRBGCASCAG-3′) and 806R (5′-GGACTACHVGGGTWTCTAAT-3′) using a thermocycler PCR system (GeneAmp 9700, ABI, San Diego, CA, USA). The following PCR conditions were used: 3 min of predenaturation, 27 cycles of 95 °C for 30 s each, 30 s of annealing at 55 °C, 45 s of elongation at 72 °C, and 10 min of extension at 72 °C. Majorbio Bio-Pharm Technology Co. Ltd. used a NovaSeq PE250 platform (Illumina, San Diego, USA) to pair-end sequence the purified amplicons in accordance with industry standards (Shanghai, China).
2.6. Measurement of SCFAs In Vitro Fermentation
A crotonic acid/metaphosphoric acid solution was created by dissolving 0.6464 g of crotonic acid in 100 mL of deionized water after dissolving a total of 2.5 g of metaphosphoric acid in 100 mL of deionized water. In order to complete the process of acidification in 24 h, an equal amount of the fermentation broth (500 mL) and the crotonic acid/metaphosphoric acid solution (100 mL) were combined and stored at -40 °C. Following acidification, the samples were centrifuged for three minutes at a speed of 13,000 rpm and 4 °C to separate the supernatants from the encourage, and then they were processed through a 0.22 m hydrophilic micron membrane for separation. 150 L of the filtrate was then suctioned into a test vial.
After the example had been placed into the gas chromatograph, the aging strategy was carried out. The heating conditions for the column were as follows: Column temperature heating conditions were as follows: column temperature: 80 ℃ for 1 min, 10 ℃/min, increased to 190 ℃ and kept up with for 0.50 min; then, at that point, increased to 240 ℃ at a pace of 40 ℃/min and kept up with for 5 min; FID detector: 240 °C; gasification chamber: 240 °C; carrier gas: nitrogen stream rate of 20 mL/min, hydrogen stream rate of 40 mL/min, air stream rate of 400 mL/min, and air stream rate of 400 mL/min. The collected data were saved.
2.7. Measurement of Gas In Vitro Fermentation
The vial was brought back to room temperature after in vitro fermentation, and the gas was then automatically analyzed by a gas analyzer to determine its composition and content.
2.8. Data Analysis
After quality control splicing, the streamlined sequences were denoised using the DADA2 plugin in the QIIME2 (version 2020.2) procedure to produce amplicon sequence variations (ASVs). Using the SILVA 16S rRNA database and the Na-ive Bayes agreement taxonomy classifier included into QIIME2, the taxonomic work for ASVs was completed (v138). The National Center for Biotechnology Information Short Read Archive has received all agreed sequencing data from raw fecal samples and fermentation samples under the accession number PRJNA938251.
The Majorbio Cloud Platform, an online resource, was used to analyze the microbiota data (www.majorbio.com). The Wilcoxon rank-sum test comparing the two groups revealed that the alpha diversity was still rising in the atmosphere. The ASV table and Bray-Curtis distance algorithm were also used as the foundation for the beta diversity (PCoA and NMDS graphs), which was used to analyze the structural changes in the microbial community at the genus level. For each category, statistical analyses of taxonomic abundances at the phylum and genus levels were conducted and presented as Venn and bar plots. Each bacterial genus in the fermentation group was evaluated using the correlation heatmap using the correlation coefficient Spearman to determine how well it correlated with SCFAs and gases. MetOrigin conducted an examination of functional prediction.
3. Results
3.1. Alpha-diversity and Beta-diversity
After in vitro fermentation, various populations of gut microbiota were examined in different populations using 16S rRNA sequencing techniques. Figure 1A–C show the alpha-diversity of the YCFA group and the FOS group, respectively. The Ace, Chao, and Shannon indices did not differ significantly (P > 0.05), indicating that there was little change in the community diversity between the FOS group and the YCFA group. Figure 1D,E shows the beta diversity of the FOS group and the YCFA group. During in vitro fermentation, PCoA and NMDS analyses revealed a significant difference between the FOS group and the YCFA group in the structure of the genus-level bacterial community (P = 0.001, Figure 1B,C).
3.2. Composition Analysis
Bifidobacterium had the highest relative abundance in the FOS group at the genus level, followed by Escherichia-Shigella, Lactobacillus, and Bacteroides. Escherichia-Shigella was the most elevated in the YCFA group, followed by Bacteroides, Bifidobacterium, and Phascolarctobacterium (Figure 2). After in vitro fermentation for 24 h, compared with the YCFA group, the relative abundances of Bifidobacterium, Lactobacillus, and Faecalibacterium were significantly expanded (P ≤ 0.05) in the FOS group. The relative abundances of Escherichia-Shigella, Bacteroides, unclassified_f_Enterobacteriaceae, Phascolarctobacterium, and Veillonella were substantially lower in the FOS group than in the YCFA group (Figure 2B).
Further analyses showed that the relative abundance of bacteria at the genus level was connected with age individually with various media (Figure 3A). We analyzed 8 bacterial genera with the most tremendous distinction in relative abundance, as shown in Figure 3B. Compared with the YCFA group, the relative abundance of Escherichia-Shigella (P≤ 0.001, Figure 3B) and Phascolarctobacterium (P≤ 0.05, Figure 3G) in the FOS group fundamentally diminished, and the relative abundance of Bifidobacterium (P ≤ 0.001, Figure 3C) and Lactobacillus (P≤ 0.05, Figure 3E) essentially increased in the FOS group of the two age groups, while the relative abundance of Bacteroides (P ≤ 0.001, Figure 3D) was altogether diminished exclusively in the FOS group of the primary school group, and the relative abundance of Faecalibacterium (P≤ 0.001, Figure 3H) was essentially expanded exclusively in the FOS group of the junior middle school.
3.3. SCFA Production During In Vitro Fermentation
The composition and content of SCFAs were analyzed after 24 h of in vitro fermentation. Six SCFAs, including acetic acid (Ace), propionic acid (Pro), isobutyric acid (Isob), butyric acid (But), isovaleric acid (Isov), and pentanoic acid (Pen), were measured and their levels are shown in Figure 4. In contrast to the YCFA group, the level of total SCFAs was significantly higher in the FOS group (Figure 4A). Compare to YCFA group, the level of Ace (P ≤ 0.001) was significantly increased and the levels of Pro (P ≤ 0.01), Isob (P ≤ 0.05), and Isov (P ≤ 0.05) were significantly decreased in the FOS group (Figure 4B). Further analysis of significant distinction related to age in the total of SCFAs and the single of SCFAs. Compared to the YCFA group, the levels of total SCFAs (P ≤ 0.05; P ≤ 0.001, Figure 4C) and Ace (P ≤ 0.001; P ≤ 0.001, Figure 4D) were significantly increased in the FOS group of the two age groups; however, the levels of Isob (P ≤ 0.05, Figure 4D) and But (P ≤ 0.01, Figure 4G) in the FOS group of the primary school and the levels of Pro (P ≤ 0.01, Figure 4E) and Isov (P ≤ 0.01, Figure 4H) in the FOS group of the junior middle school were significantly decreased in the FOS medium. We used heatmaps with Spearman correlation coefficients to analyze correlations between SCFAs with significant changes and the relative abundance of bacterial genera (Figure 4J). Among the eight bacterial genera with the highest significant difference, Ace, Pro, Isob, and Isov were notably correlated with Escherichia-Shigella and Bifidobacterium. Escherichia-Shigella had marked positive effects on Pro, Isob, and Isov but a significant negative correlation with Ace. Bifidobacterium and Lactobacillus had marked positive effects on Ace, but Bifidobacterium showed a significant negative correlation with Pro, Isob, and Isov.
3.4. Gas Production During Vitro Fermentation
The composition and content of gases were analyzed after 24 h of in vitro fermentation. After 24 h of in vitro fermentation, the content of gas in the FOS group was significantly higher than that in the YCFA group (P ≤ 0.001, Figure 5A). The FOS group and the YCFA group had the highest volume of H2, followed by H2S, CH4, and NH3, and a small content of CO2 (Figure 5B). The contents of H2 (P ≤ 0.001, Figure 5B), H2S (P ≤ 0.001, Figure 5B), and NH3 (P ≤ 0.001, Figure 5B) were significantly reduced in the FOS group compared to the YCFA group. Additionally, further analyses of significant differences related to age in the total gases and the single gases showed that the contents of H2 (P ≤ 0.001; P ≤ 0.05, Figure 5F), H2S (P ≤ 0.001; P ≤ 0.001, Figure 5G), and NH3 (P ≤ 0.001; P ≤ 0.05, Figure 5H) in the FOS group of the two age groups and the content of CO2 (P ≤ 0.01, Figure 5H) in the FOS group of the junior middle school were significantly decreased. In analyzing the relationships between gases and gut microbiota, we employed heatmaps and Spearman correlation coefficients (Figure 5I). Among the eight bacterial genera with the highest significant difference in genus-level abundance, NH3, H2, and H2S were notably positively correlated with Escherichia-Shigella, unclassified_f_Enterobacteriaceae, and Veillonella, whereas there was a significant negative correlation with Bifidobacterium, Lactobacillus, and Faecalibacterium.
3.5. Functional Predictive Analysis of Gut Microbiota and Metabolites
Based on 16S rRNA sequencing information and metabolite information, we utilized MetOrigin to predict the metabolic function of the gut microbiota, and the results are displayed in Figure 6. A total of 9 recognized metabolites were first characterized into 3 groups: 2 bacterial metabolites, 4 bacteria-host (human) cometabolites, and 1 other (drug and food) (Figure 6A). There were 19 metabolic pathways related to bacteria-host cometabolites. (Figure 6B,C). The cometabolism network showed that 3 metabolites were related to 6 differential bacteria and 8 metabolism pathways (P < 0.01) (Figure 6D).
4. Discussion
This study aimed to acquire further understanding of gut microbiota dysbiosis brought about by consuming more meats low in dietary fiber in childhood and the ameliorative effect of dietary fiber on it. The communication between the gut microbiota and dietary fiber is poised to uncover the mechanistic role of the microbiota and its metabolism in childhood health and disease pathophysiology. Metabolic diseases in childhood obesity have all previously been connected to changes in the gut microbiota; however, until now, they have not been checked in an integrative manner. FOS groups (the model of dietary fiber intake) exhibit contrasts in microbiota and metabolites when contrasted with YCFA groups (the model of high meat intake) and predict the connection between the diet of children and metabolic diseases.
The importance of diet in determining the gut microbiota has long been recognized [28]. Diet has a significant effect on the composition, diversity, and richness of the gut microbiota. The gut microbiota population will change throughout time as a result of various dietary components. Long-term dietary habits, especially the consumption of animal fat and protein (Bacteroides) as opposed to carbohydrates or dietary fiber (Prevotella), are linked to what is known as childhood obesity. The Prevotella/Bacteroides ratio showed a dichotomy between industrialized and nonindustrialized human populations, suggesting that these bacterial populations are influenced by long-term dietary differences, such as meat (which drives Bacteroides in the West) and dietary fiber (which influences Prevotella in nonwesternized populations) [29]. In the diversity analysis in Figure 1, our results showed no significant difference in alpha diversity by comparing the FOS group with the YCFA group, while beta diversity was significantly altered, indicating that different dietary institutions can significantly affect the composition of children's gut microbiota. Our study revealed that the FOS group significantly improved the composition of children's gut microbiota compared to the YCFA group, increasing the relative abundance of probiotics and decreasing the relative abundance of harmful bacteria at the genus level. This may help lower the likelihood of childhood obesity. The significant differences between the various microbial genera were not consistent in the primary school and junior middle school groups when comparing the eight microbial genera with the greatest differences in relative abundance at various ages, comparing the FOS and YCFA groups. This was most likely caused by the small sample size and changes in the development of gut microbiota at different ages. Previous research has found dietary differences in the human gut microbiota. This high abundance of digestive Bifidobacterium has likewise been observed in Japanese children and is accepted to be connected to the equilibrium diet in Japan [30]. People from Western countries consume more fat and protein with less dietary fiber. Investigations have discovered that these people show a higher abundance of Bacteroides in their digestive microbiota. Consequently, Western diets are many times high in meat and low in dietary fiber, adjusting the metabolism of digestive microbiota and expanding the risk of obesity, cardiovascular diseases, and diabetes [31,32].
The human diet has been dependent on huge changes over the last hardly any hundred years, which is a vital consideration making sense of the enormous contrast in the predominance of chronic metabolic disease among created and emerging countries. The hole framed by decreased dietary fiber utilization has been filled by the utilization of energy-dense, high-glycemic load foods, which are a staple of the Western diet. Our progenitors are remembered to have consumed 100 g of dietary fiber daily [33]; in correlation, individuals from non-industrialized countries for the most part ingest up to 50 g daily [34], while those from industrialized western countries will more often than not consume just 12-18 g daily [35,36,37]. This significant difference in routine dietary fiber intake, except for the high meat content of the Western diet, is related to the distinction in gut microbiota composition and richness observed among developed and developing countries, which has been accounted for in a few studies [32,38,39,40,41]. In addition, while looking at the microbiotas of humans from various industrialized nations, there is little distinction in composition and richness [42], while vegan and vegetarian people from these social orders have a gut microbiota all the more intently looking like that of non-industrialized populaces who have high constant dietary fiber consumption [43] and low related metabolic disease predominance. Current proposals for dietary fiber intake lie somewhere in the range of 30-35 g each day for men and 25-32 g each day for women [44]. Western social orders are as yet not complying with these rules, and low fiber utilization remains a significant general medical problem. Truth be told, even the present suggested daily intake of fiber is a lot lower than that consumed by our predecessors. Diet-microbiota collaborations are proved to be vital for the capacity of dietary fiber to work on the metabolic soundness of humans experiencing obesity and metabolic syndrome [45,46,47,48].
Dietary fiber is metabolized by a wide variety of taxa of gut microbiota to create SCFAs such as Ace, Pro, and But. The types and amounts of fiber ingested, as well as the makeup of the gut microbiota, all influence the composition and concentration of SCFAs generated by the gut microbiota. Locally and systemically, SCFAs are used as host energy substrates and signaling chemicals [49]. SCFAs also affect host metabolism by suppressing appetite, altering lipid metabolism (by boosting fat oxidation and decreasing fat synthesis and storage), and maintaining homeostasis of glucose levels [50]. Hence, SCFAs are important molecules to consider if you want to avoid or reduce obesity. In fact, scientific trials to treat obesity are now evaluating the effectiveness of SCFAs [51]. In this study, compared to the YCFA group, we found that the FOS group was able to significantly increase the content of total SCFAs, and this increase was mainly caused by Ace (Figure 4). The differential results for SCFAs were inconsistent in both age groups, except for Ace, and the production of Ace was closely related to Bifidobacterium and Lactobacillus (Figure 4). The latest research has uncovered that dietary fiber supplementation brought about upgraded microbial fermentation into Ace [52]. The role of Ace in host metabolism, including lipid synthesis, insulin secretion, hyperphagia, and obesity. Ace treatment inhibited high-fat diet-actuated body weight gain and hepatic lipid collection by upregulating articulation of hepatic Pparα, Cpt-1, acetyl-CoA oxidase, and uncoupling protein 2 genes in mice [53].
Of the gaseous metabolites generated by protein fermentation, the concentration of NH3 in feces might be employed as a helpful gas biomarker, as the concentration of NH3 can rise (10-30 mmol/L) with higher than normal protein intake [54]. H2S is another helpful indicator of protein fermentation, as its luminal concentration is elevated in those who consume a diet high in meat, and the addition of cysteine to recently passed feces in vitro significantly increases H2S generation [54,55]. Our study showed that compared with the YCFA group, the FOS group was able to significantly decrease the concentration of total gases, and this decrease was mainly caused by H2, NH3, and H2S. The differential results for gases were inconsistent in both age groups, except for NH3 and H2S. The consumption of NH3 and H2S is closely related to Bifidobacterium, Lactobacillus, and Faecalibacterium, and their production is highly related to Escherichia-Shigella, Bacteroides unclassified_f_Enterobacteriaceae, and Veillonella. Nevertheless, research into how protein fermentation affects the physiology and pathophysiology of hosts is still in its infancy, and more controlled experiments, including human intervention, are needed to gain greater knowledge.
MetOrigin is a publicly accessible and interactive online server intended for research scientists to streamline the entire course of data mining and does not need computation or bioinformatics research foundations. MetOrigin meets the pressing need to investigate the complicated connection between the microbiota and the metabolome. It is novel to perform metabolic pathway enrichment analysis on metabolites from various origins and link biological and statistically correlated microbiota. This strong bioinformatics tool provides significant data on microbial participation in metabolism and will assist researchers in finding novel dietary or pharmacological intervention systems to forestall microbial dysbiosis and keep up with metabolic equilibrium later on [56]. The outcomes of MetOrigin in this study showed that Ace had remarkable positive effects on Bifidobacteria but a significant negative correlation with Bacteroides and 4 related metabolic pathways (P< 0.01), including glyoxylate, dicarboxylate metabolism, and carbon fixation pathways in prokaryotes (Figure 6).
In summary, after fermentation, FOS controls the composition of the gut microbiota by hindering the growth of Bacteroides while increasing the abundance of Bifidobacterium to regulate the metabolites of the gut microbiota, including Ace, NH3, and H2S. Additionally, the host-specific metabolic network and microbe-metabolite affiliation network provided more unambiguous information on metabolic changes. Dietary fiber as an intervention should be applied to high meat consumption to prevent childhood obesity.
5. Conclusions
According to our study, the fermentation of FOS altered the composition of the gut's microbial composition by raising the populations of beneficial bacteria like Bifidobacterium and Faecalibacterium while decreasing the populations of harmful bacteria like Escherichia-Shigella and Bacteroides. These increases in probiotics and decreases in harmful bacteria resulted in significant increases in short-chain fatty acid content (mainly Ace) and decreases in the production of harmful gases (mainly NH3 and H2S). Through MetOrigin, an interactive cloud-based platform, we predicted possible metabolic pathways by which FOS improves gut microbes and their metabolites, and the related mechanisms are likely to be applied to understand the ameliorative effects of dietary fiber on high meat consumption in children and the preventive effects on childhood obesity. These results will provide a theoretical basis for the involvement of dietary fiber in childhood precision nutrition to control childhood obesity.
Author Contributions
Conceptualization, Zhi Du and Xiaoli Ye; Data curation, Jiabin Li and Guofei Ren; Formal analysis, Zhi Du and Xiaoli Ye; Funding acquisition, Xionge Pi and Jing Miao; Investigation, Jiabin Li; Methodology, Zhi Du and Xiaoli Ye; Project administration, Xionge Pi and Jing Miao; Resources, Jieying Ding and Guofei Ren; Software, Zhi Du, Xiaoli Ye and Hao Fu; Validation, Zhi Du; Visualization, Hao Fu; Writing–original draft, Zhi Du; Writing–review & editing, Xiaoli Ye. All authors have read and agreed to the published version of the manuscript.
Funding
This research was supported by the Hangzhou Agricultural and Society Development Project (202004A20) and the Natural Science Foundation of Zhejiang Province (LYY22H280002).
Institutional Review Board Statement
The study was conducted in accordance with the Declaration of Helsinki and approved by the Ethics Committee of Hangzhou Centers for Disease Control and Prevention (No. 20047) for studies involving humans.
Informed Consent Statement
Informed consent was obtained from all subjects involved in the study.
Data Availability Statement
The authors declare that the data supporting the findings of this study are presented in the manuscript. The sequences obtained in this study of 16S, and metagenomic and transcriptome data submission numbers were deposited in the NCBI Sequence Read Archive under the accession number PRJNA938251. Additional data sources are also available from the corresponding author upon request.
Conflicts of Interest
The authors declare no conflict of interest.
References
- Collaborators, G.B.D.O.; Afshin, A.; Forouzanfar, M.H.; Reitsma, M.B.; Sur, P.; Estep, K.; Lee, A.; Marczak, L.; Mokdad, A.H.; Moradi-Lakeh, M.; et al. Health Effects of Overweight and Obesity in 195 Countries over 25 Years. N Engl J Med 2017, 377, 13–27. [Google Scholar] [CrossRef] [PubMed]
- Alcazar, M.; Escribano, J.; Ferre, N.; Closa-Monasterolo, R.; Selma-Royo, M.; Feliu, A.; Castillejo, G.; Luque, V.; Obemat2. 0 Study, G. Gut microbiota is associated with metabolic health in children with obesity. Clin Nutr 2022, 41, 1680–1688. [Google Scholar] [CrossRef]
- Baker, J.L.; Olsen, L.W.; Sorensen, T.I. Childhood body-mass index and the risk of coronary heart disease in adulthood. N Engl J Med 2007, 357, 2329–2337. [Google Scholar] [CrossRef]
- Juonala, M.; Magnussen, C.G.; Berenson, G.S.; Venn, A.; Burns, T.L.; Sabin, M.A.; Srinivasan, S.R.; Daniels, S.R.; Davis, P.H.; Chen, W.; et al. Childhood adiposity, adult adiposity, and cardiovascular risk factors. N Engl J Med 2011, 365, 1876–1885. [Google Scholar] [CrossRef] [PubMed]
- Zhang, C.; Yin, A.; Li, H.; Wang, R.; Wu, G.; Shen, J.; Zhang, M.; Wang, L.; Hou, Y.; Ouyang, H.; et al. Dietary Modulation of Gut Microbiota Contributes to Alleviation of Both Genetic and Simple Obesity in Children. EBioMedicine 2015, 2, 968–984. [Google Scholar] [CrossRef]
- Zhou, P.; Li, R.; Liu, K. The Neighborhood Food Environment and the Onset of Child-Hood Obesity: A Retrospective Time-Trend Study in a Mid-sized City in China. Front Public Health 2021, 9, 688767. [Google Scholar] [CrossRef] [PubMed]
- Zhang, Y.; Zhang, X.; Li, J.; Zhong, H.; Pan, C.W. Associations of outdoor activity and screen time with adiposity: findings from rural Chinese adolescents with relatively low adiposity risks. BMC Public Health 2020, 20, 1769. [Google Scholar] [CrossRef]
- Taverno Ross, S.E.; Militello, G.; Dowda, M.; Pate, R.R. Changes in Diet Quality in Youth Living in South Carolina From Fifth to 11th Grade. J Nutr Educ Behav 2020, 52, 928–934. [Google Scholar] [CrossRef]
- Mozaffarian, D.; Hao, T.; Rimm, E.B.; Willett, W.C.; Hu, F.B. Changes in diet and lifestyle and long-term weight gain in women and men. N Engl J Med 2011, 364, 2392–2404. [Google Scholar] [CrossRef]
- Zhang, S.; Dang, Y. Roles of gut microbiota and metabolites in overweight and obesity of children. Front Endocrinol (Lausanne) 2022, 13, 994930. [Google Scholar] [CrossRef]
- Backhed, F.; Ding, H.; Wang, T.; Hooper, L.V.; Koh, G.Y.; Nagy, A.; Semenkovich, C.F.; Gordon, J.I. The gut microbiota as an environmental factor that regulates fat storage. Proc Natl Acad Sci U S A 2004, 101, 15718–15723. [Google Scholar] [CrossRef]
- Zhao, L. The gut microbiota and obesity: from correlation to causality. Nat Rev Microbiol 2013, 11, 639–647. [Google Scholar] [CrossRef]
- Backhed, F.; Manchester, J.K.; Semenkovich, C.F.; Gordon, J.I. Mechanisms underlying the resistance to diet-induced obesity in germ-free mice. Proc Natl Acad Sci U S A 2007, 104, 979–984. [Google Scholar] [CrossRef]
- Turnbaugh, P.J.; Backhed, F.; Fulton, L.; Gordon, J.I. Diet-induced obesity is linked to marked but reversible alterations in the mouse distal gut microbiome. Cell Host Microbe 2008, 3, 213–223. [Google Scholar] [CrossRef]
- Ridaura, V.K.; Faith, J.J.; Rey, F.E.; Cheng, J.; Duncan, A.E.; Kau, A.L.; Griffin, N.W.; Lombard, V.; Henrissat, B.; Bain, J.R.; et al. Gut microbiota from twins discordant for obesity modulate metabolism in mice. Science 2013, 341, 1241214. [Google Scholar] [CrossRef]
- Cani, P.D.; Bibiloni, R.; Knauf, C.; Waget, A.; Neyrinck, A.M.; Delzenne, N.M.; Burcelin, R. Changes in gut microbiota control metabolic endotoxemia-induced inflammation in high-fat diet-induced obesity and diabetes in mice. Diabetes 2008, 57, 1470–1481. [Google Scholar] [CrossRef]
- Vrieze, A.; Van Nood, E.; Holleman, F.; Salojarvi, J.; Kootte, R.S.; Bartelsman, J.F.; Dallinga-Thie, G.M.; Ackermans, M.T.; Serlie, M.J.; Oozeer, R.; et al. Transfer of intestinal microbiota from lean donors increases insulin sensitivity in individuals with metabolic syndrome. Gastroenterology 2012, 143, 913–916 e917. [Google Scholar] [CrossRef] [PubMed]
- Xiao, S.; Fei, N.; Pang, X.; Shen, J.; Wang, L.; Zhang, B.; Zhang, M.; Zhang, X.; Zhang, C.; Li, M.; et al. A gut microbiota-targeted dietary intervention for amelioration of chronic inflammation underlying metabolic syndrome. FEMS Microbiol Ecol 2014, 87, 357–367. [Google Scholar] [CrossRef] [PubMed]
- Fei, N.; Zhao, L. An opportunistic pathogen isolated from the gut of an obese human causes obesity in germfree mice. ISME J 2013, 7, 880–884. [Google Scholar] [CrossRef] [PubMed]
- Rodriguez-Lara, A.; Plaza-Diaz, J.; Lopez-Uriarte, P.; Vazquez-Aguilar, A.; Reyes-Castillo, Z.; Alvarez-Mercado, A.I. Fiber Consumption Mediates Differences in Several Gut Microbes in a Subpopulation of Young Mexican Adults. Nutrients 2022, 14. [Google Scholar] [CrossRef]
- Martinez, T.M.; Meyer, R.K.; Duca, F.A. Therapeutic Potential of Various Plant-Based Fibers to Improve Energy Homeostasis via the Gut Microbiota. Nutrients 2021, 13. [Google Scholar] [CrossRef] [PubMed]
- Koleva, P.T.; Bridgman, S.L.; Kozyrskyj, A.L. The infant gut microbiome: evidence for obesity risk and dietary intervention. Nutrients 2015, 7, 2237–2260. [Google Scholar] [CrossRef] [PubMed]
- Radjabzadeh, D.; Boer, C.G.; Beth, S.A.; van der Wal, P.; Kiefte-De Jong, J.C.; Jansen, M.A.E.; Konstantinov, S.R.; Peppelenbosch, M.P.; Hays, J.P.; Jaddoe, V.W.V.; et al. Diversity, compositional and functional differences between gut microbiota of children and adults. Sci Rep 2020, 10, 1040. [Google Scholar] [CrossRef] [PubMed]
- Faith, J.J.; Guruge, J.L.; Charbonneau, M.; Subramanian, S.; Seedorf, H.; Goodman, A.L.; Clemente, J.C.; Knight, R.; Heath, A.C.; Leibel, R.L.; et al. The long-term stability of the human gut microbiota. Science 2013, 341, 1237439. [Google Scholar] [CrossRef]
- Holmes, Z.C.; Silverman, J.D.; Dressman, H.K.; Wei, Z.; Dallow, E.P.; Armstrong, S.C.; Seed, P.C.; Rawls, J.F.; David, L.A. Short-Chain Fatty Acid Production by Gut Microbiota from Children with Obesity Differs According to Prebiotic Choice and Bacterial Community Composition. mBio 2020, 11. [Google Scholar] [CrossRef] [PubMed]
- Wei, Y.; Liang, J.; Su, Y.; Wang, J.; Amakye, W.K.; Pan, J.; Chu, X.; Ma, B.; Song, Y.; Li, Y.; et al. The associations of the gut microbiome composition and short-chain fatty acid concentrations with body fat distribution in children. Clin Nutr 2021, 40, 3379–3390. [Google Scholar] [CrossRef] [PubMed]
- Liu, W.; Li, X.; Zhao, Z.; Pi, X.; Meng, Y.; Fei, D.; Liu, D.; Wang, X. Effect of chitooligosaccharides on human gut microbiota and antiglycation. Carbohydr Polym 2020, 242, 116413. [Google Scholar] [CrossRef]
- Deehan, E.C.; Duar, R.M.; Armet, A.M.; Perez-Munoz, M.E.; Jin, M.; Walter, J. Modulation of the Gastrointestinal Microbiome with Nondigestible Fermentable Carbohydrates To Improve Human Health. Microbiol Spectr 2017, 5. [Google Scholar] [CrossRef]
- Makki, K.; Deehan, E.C.; Walter, J.; Backhed, F. The Impact of Dietary Fiber on Gut Microbiota in Host Health and Disease. Cell Host Microbe 2018, 23, 705–715. [Google Scholar] [CrossRef]
- Nakayama, J.; Watanabe, K.; Jiang, J.; Matsuda, K.; Chao, S.H.; Haryono, P.; La-Ongkham, O.; Sarwoko, M.A.; Sujaya, I.N.; Zhao, L.; et al. Diversity in gut bacterial community of school-age children in Asia. Sci Rep 2015, 5, 8397. [Google Scholar] [CrossRef]
- Matenchuk, B.A.; Mandhane, P.J.; Kozyrskyj, A.L. Sleep, circadian rhythm, and gut microbiota. Sleep Med Rev 2020, 53, 101340. [Google Scholar] [CrossRef]
- De Filippo, C.; Cavalieri, D.; Di Paola, M.; Ramazzotti, M.; Poullet, J.B.; Massart, S.; Collini, S.; Pieraccini, G.; Lionetti, P. Impact of diet in shaping gut microbiota revealed by a comparative study in children from Europe and rural Africa. Proc Natl Acad Sci U S A 2010, 107, 14691–14696. [Google Scholar] [CrossRef]
- Eaton, S.B. The ancestral human diet: what was it and should it be a paradigm for contemporary nutrition? Proc Nutr Soc 2006, 65, 1–6. [Google Scholar] [CrossRef]
- O'Keefe, S.J.; Li, J.V.; Lahti, L.; Ou, J.; Carbonero, F.; Mohammed, K.; Posma, J.M.; Kinross, J.; Wahl, E.; Ruder, E.; et al. Fat, fibre and cancer risk in African Americans and rural Africans. Nat Commun 2015, 6, 6342. [Google Scholar] [CrossRef]
- Slavin, J.L. Position of the American Dietetic Association: health implications of dietary fiber. J Am Diet Assoc 2008, 108, 1716–1731. [Google Scholar] [CrossRef]
- Jew, S.; AbuMweis, S.S.; Jones, P.J. Evolution of the human diet: linking our ancestral diet to modern functional foods as a means of chronic disease prevention. J Med Food 2009, 12, 925–934. [Google Scholar] [CrossRef]
- Deehan, E.C.; Walter, J. The Fiber Gap and the Disappearing Gut Microbiome: Implications for Human Nutrition. Trends Endocrinol Metab 2016, 27, 239–242. [Google Scholar] [CrossRef]
- Yatsunenko, T.; Rey, F.E.; Manary, M.J.; Trehan, I.; Dominguez-Bello, M.G.; Contreras, M.; Magris, M.; Hidalgo, G.; Baldassano, R.N.; Anokhin, A.P.; et al. Human gut microbiome viewed across age and geography. Nature 2012, 486, 222–227. [Google Scholar] [CrossRef]
- Schnorr, S.L.; Candela, M.; Rampelli, S.; Centanni, M.; Consolandi, C.; Basaglia, G.; Turroni, S.; Biagi, E.; Peano, C.; Severgnini, M.; et al. Gut microbiome of the Hadza hunter-gatherers. Nat Commun 2014, 5, 3654. [Google Scholar] [CrossRef]
- Martinez, I.; Stegen, J.C.; Maldonado-Gomez, M.X.; Eren, A.M.; Siba, P.M.; Greenhill, A.R.; Walter, J. The gut microbiota of rural papua new guineans: composition, diversity patterns, and ecological processes. Cell Rep 2015, 11, 527–538. [Google Scholar] [CrossRef]
- De Filippo, C.; Di Paola, M.; Ramazzotti, M.; Albanese, D.; Pieraccini, G.; Banci, E.; Miglietta, F.; Cavalieri, D.; Lionetti, P. Diet, Environments, and Gut Microbiota. A Preliminary Investigation in Children Living in Rural and Urban Burkina Faso and Italy. Front Microbiol 2017, 8, 1979. [Google Scholar] [CrossRef]
- Arumugam, M.; Raes, J.; Pelletier, E.; Le Paslier, D.; Yamada, T.; Mende, D.R.; Fernandes, G.R.; Tap, J.; Bruls, T.; Batto, J.M.; et al. Enterotypes of the human gut microbiome. Nature 2011, 473, 174–180. [Google Scholar] [CrossRef]
- David, L.A.; Maurice, C.F.; Carmody, R.N.; Gootenberg, D.B.; Button, J.E.; Wolfe, B.E.; Ling, A.V.; Devlin, A.S.; Varma, Y.; Fischbach, M.A.; et al. Diet rapidly and reproducibly alters the human gut microbiome. Nature 2014, 505, 559–563. [Google Scholar] [CrossRef]
- Stephen, A.M.; Champ, M.M.; Cloran, S.J.; Fleith, M.; van Lieshout, L.; Mejborn, H.; Burley, V.J. Dietary fibre in Europe: current state of knowledge on definitions, sources, recommendations, intakes and relationships to health. Nutr Res Rev 2017, 30, 149–190. [Google Scholar] [CrossRef]
- Cani, P.D.; Knauf, C.; Iglesias, M.A.; Drucker, D.J.; Delzenne, N.M.; Burcelin, R. Improvement of glucose tolerance and hepatic insulin sensitivity by oligofructose requires a functional glucagon-like peptide 1 receptor. Diabetes 2006, 55, 1484–1490. [Google Scholar] [CrossRef]
- Cani, P.D.; Possemiers, S.; Van de Wiele, T.; Guiot, Y.; Everard, A.; Rottier, O.; Geurts, L.; Naslain, D.; Neyrinck, A.; Lambert, D.M.; et al. Changes in gut microbiota control inflammation in obese mice through a mechanism involving GLP-2-driven improvement of gut permeability. Gut 2009, 58, 1091–1103. [Google Scholar] [CrossRef]
- Neyrinck, A.M.; Possemiers, S.; Druart, C.; Van de Wiele, T.; De Backer, F.; Cani, P.D.; Larondelle, Y.; Delzenne, N.M. Prebiotic effects of wheat arabinoxylan related to the increase in bifidobacteria, Roseburia and Bacteroides/Prevotella in diet-induced obese mice. PLoS One 2011, 6, e20944. [Google Scholar] [CrossRef]
- Sonnenburg, J.L.; Backhed, F. Diet-microbiota interactions as moderators of human metabolism. Nature 2016, 535, 56–64. [Google Scholar] [CrossRef]
- Stinson, L.F.; Geddes, D.T. Microbial metabolites: the next frontier in human milk. Trends Microbiol 2022, 30, 408–410. [Google Scholar] [CrossRef]
- Tan, J.; McKenzie, C.; Potamitis, M.; Thorburn, A.N.; Mackay, C.R.; Macia, L. The role of short-chain fatty acids in health and disease. Adv Immunol 2014, 121, 91–119. [Google Scholar] [CrossRef]
- Descamps, H.C.; Herrmann, B.; Wiredu, D.; Thaiss, C.A. The path toward using microbial metabolites as therapies. EBioMedicine 2019, 44, 747–754. [Google Scholar] [CrossRef] [PubMed]
- Zhao, S.; Jang, C.; Liu, J.; Uehara, K.; Gilbert, M.; Izzo, L.; Zeng, X.; Trefely, S.; Fernandez, S.; Carrer, A.; et al. Dietary fructose feeds hepatic lipogenesis via microbiota-derived acetate. Nature 2020, 579, 586–591. [Google Scholar] [CrossRef] [PubMed]
- Hong, Y.; Sheng, L.; Zhong, J.; Tao, X.; Zhu, W.; Ma, J.; Yan, J.; Zhao, A.; Zheng, X.; Wu, G.; et al. Desulfovibrio vulgaris, a potent acetic acid-producing bacterium, attenuates nonalcoholic fatty liver disease in mice. Gut Microbes 2021, 13, 1–20. [Google Scholar] [CrossRef]
- Kalantar-Zadeh, K.; Berean, K.J.; Burgell, R.E.; Muir, J.G.; Gibson, P.R. Intestinal gases: influence on gut disorders and the role of dietary manipulations. Nat Rev Gastroenterol Hepatol 2019, 16, 733–747. [Google Scholar] [CrossRef]
- Yao, C.K.; Rotbart, A.; Ou, J.Z.; Kalantar-Zadeh, K.; Muir, J.G.; Gibson, P.R. Modulation of colonic hydrogen sulfide production by diet and mesalazine utilizing a novel gas-profiling technology. Gut Microbes 2018, 9, 510–522. [Google Scholar] [CrossRef]
- Yu, G.; Xu, C.; Zhang, D.; Ju, F.; Ni, Y. MetOrigin: Discriminating the origins of microbial metabolites for integrative analysis of the gut microbiome and metabolome. iMeta 2022, 1. [Google Scholar] [CrossRef]
Figure 1.
Diversity analysis of gut microbiota after in vitro fermentation. Alpha-diversity analysis of (A) Ace index, (B) Chao index, and (C) Shannon index between the FOS group and the YCFA group; Beta-diversity analysis of (D) PCoA and (E) NMDS between the FOS group and the YCFA group. Data are means ± SEMs (41 independent experiments × 3 replicate experiments). Statistical significance thresholds were *0.01 < P ≤ 0.05; **0.001 < P ≤ 0.01; *** P ≤ 0.001.
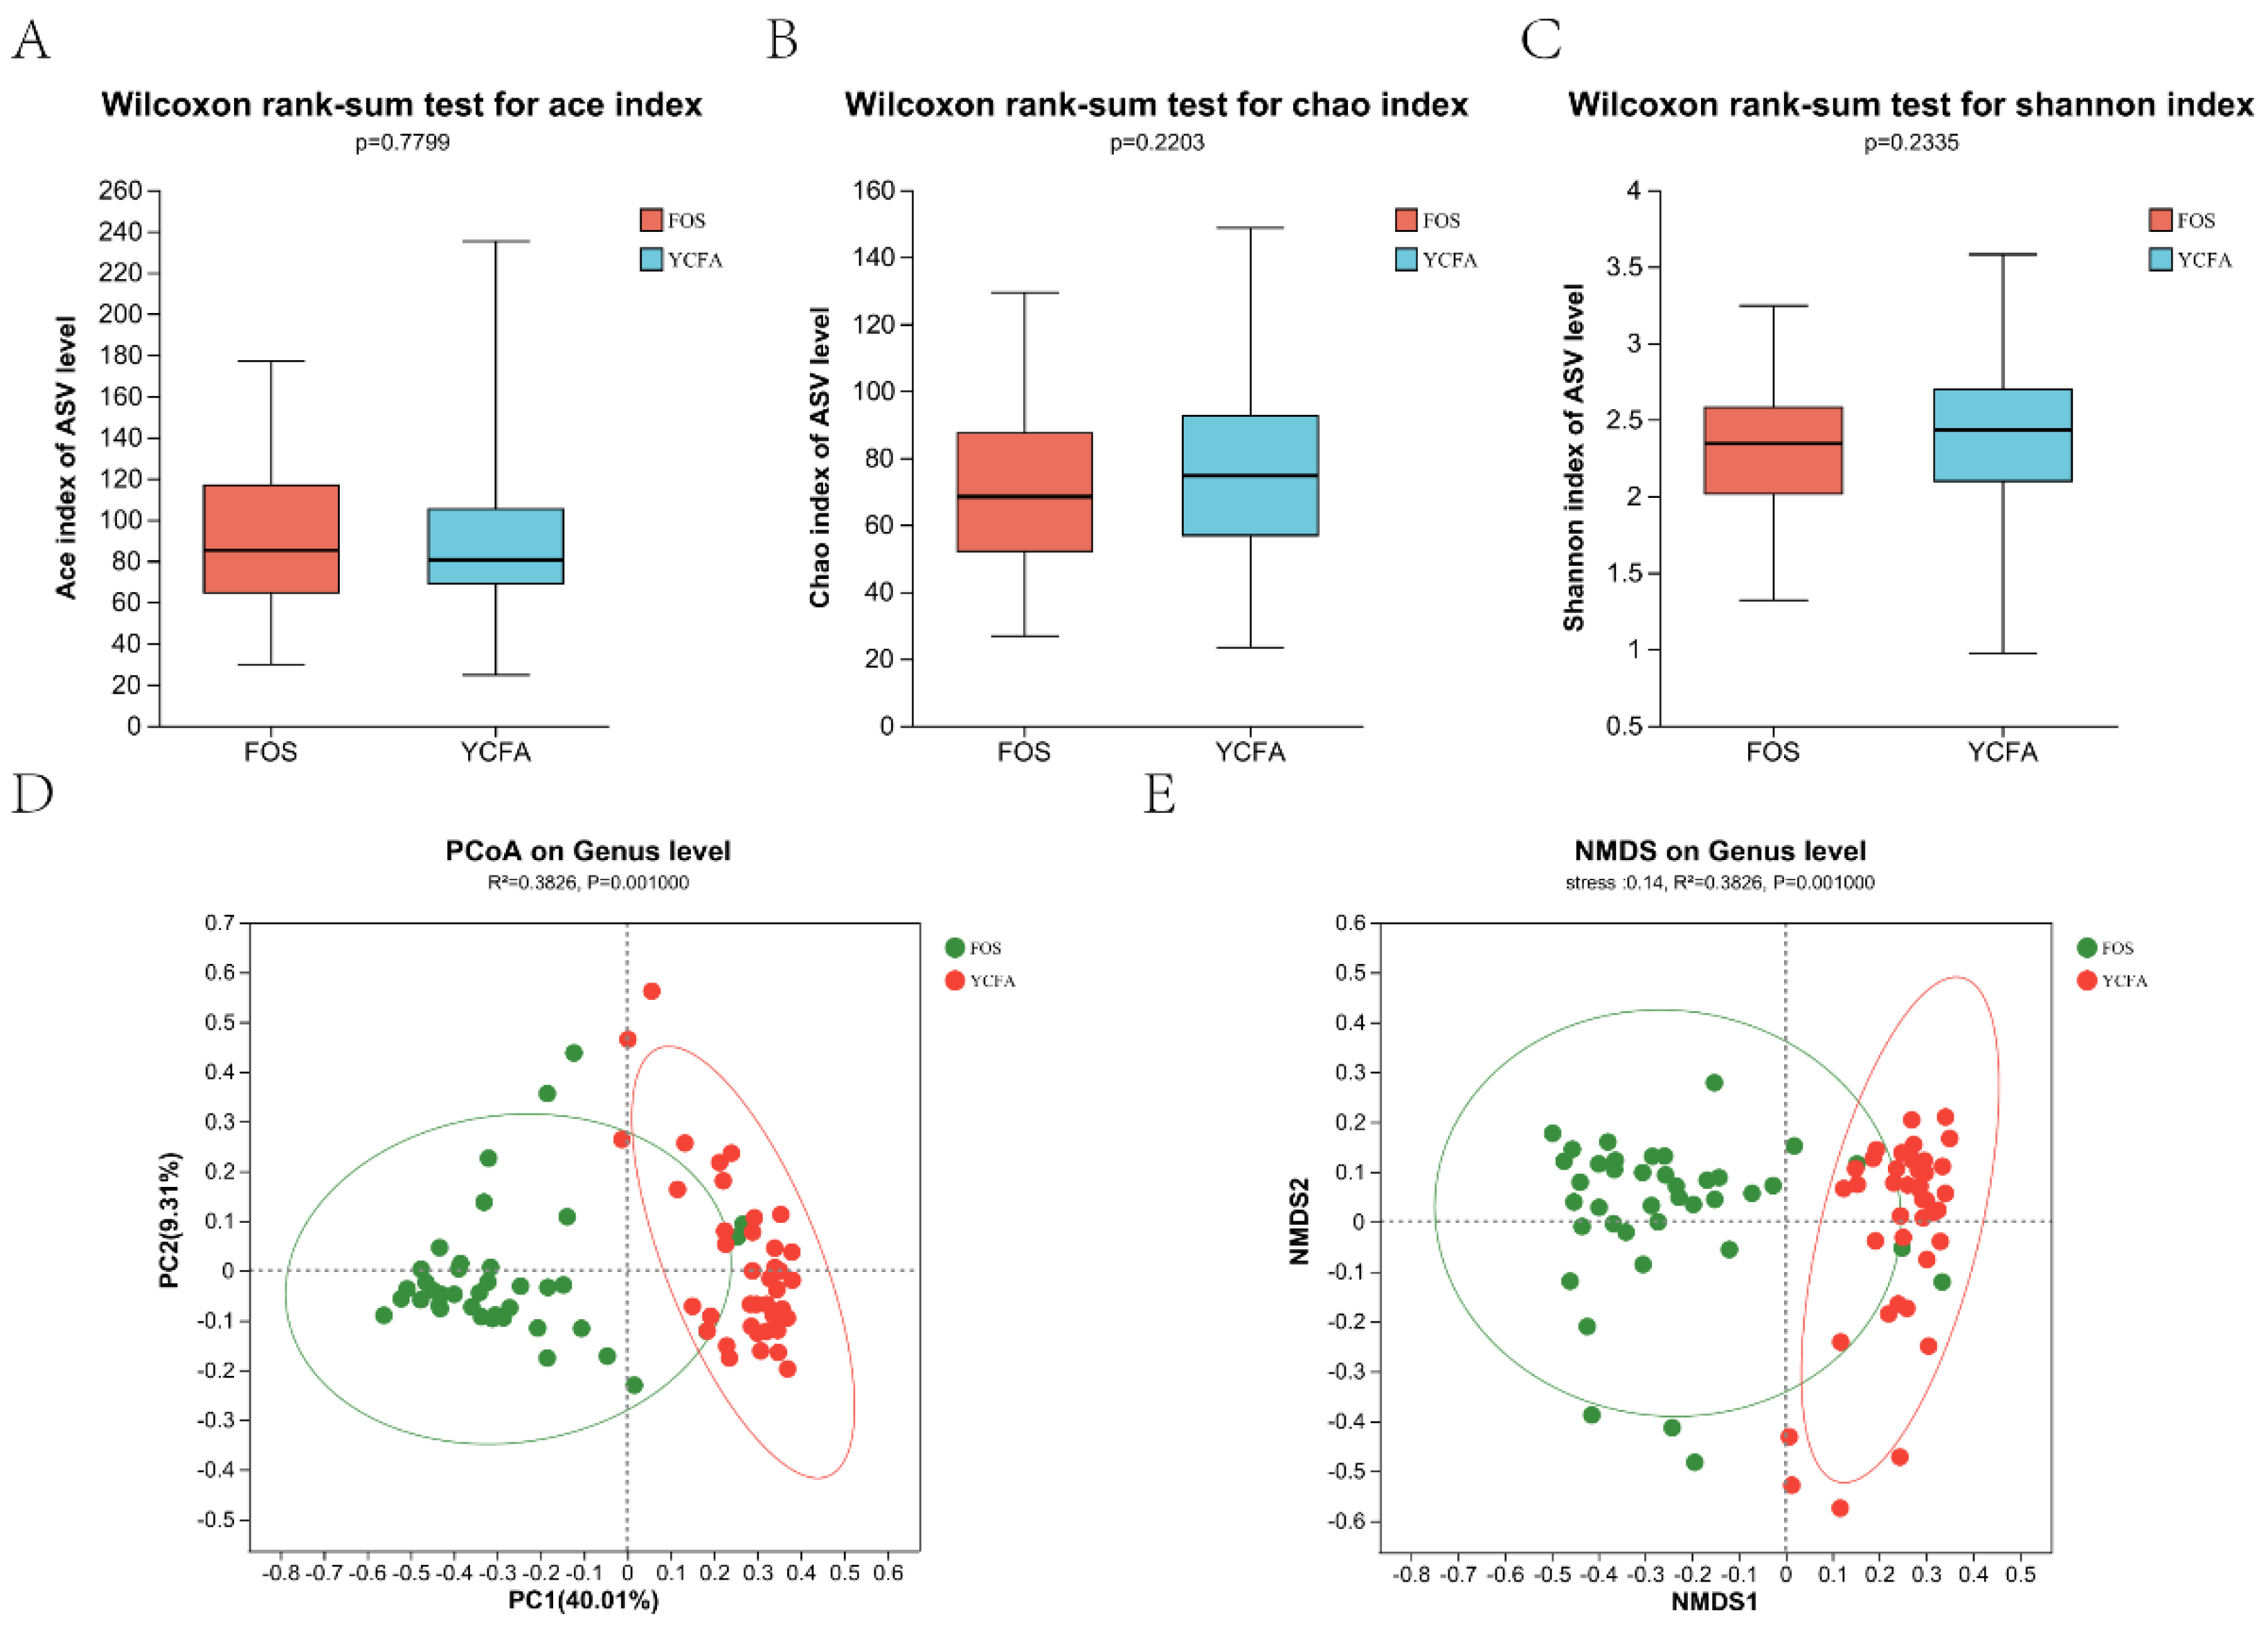
Figure 2.
Composition analysis of gut microbiota after in vitro fermentation: (A) genus-level bacterial community barplot of the FOS group and the YCFA group; (B) LEfSe analysis of relative abundance at the genus level between the FOS group and the YCFA group. Data are means ± SEMs (41 independent experiments × 3 replicate experiments). Statistical significance thresholds were *0.01 < P ≤ 0.05; **0.001 < P ≤ 0.01; ***P ≤ 0.001.
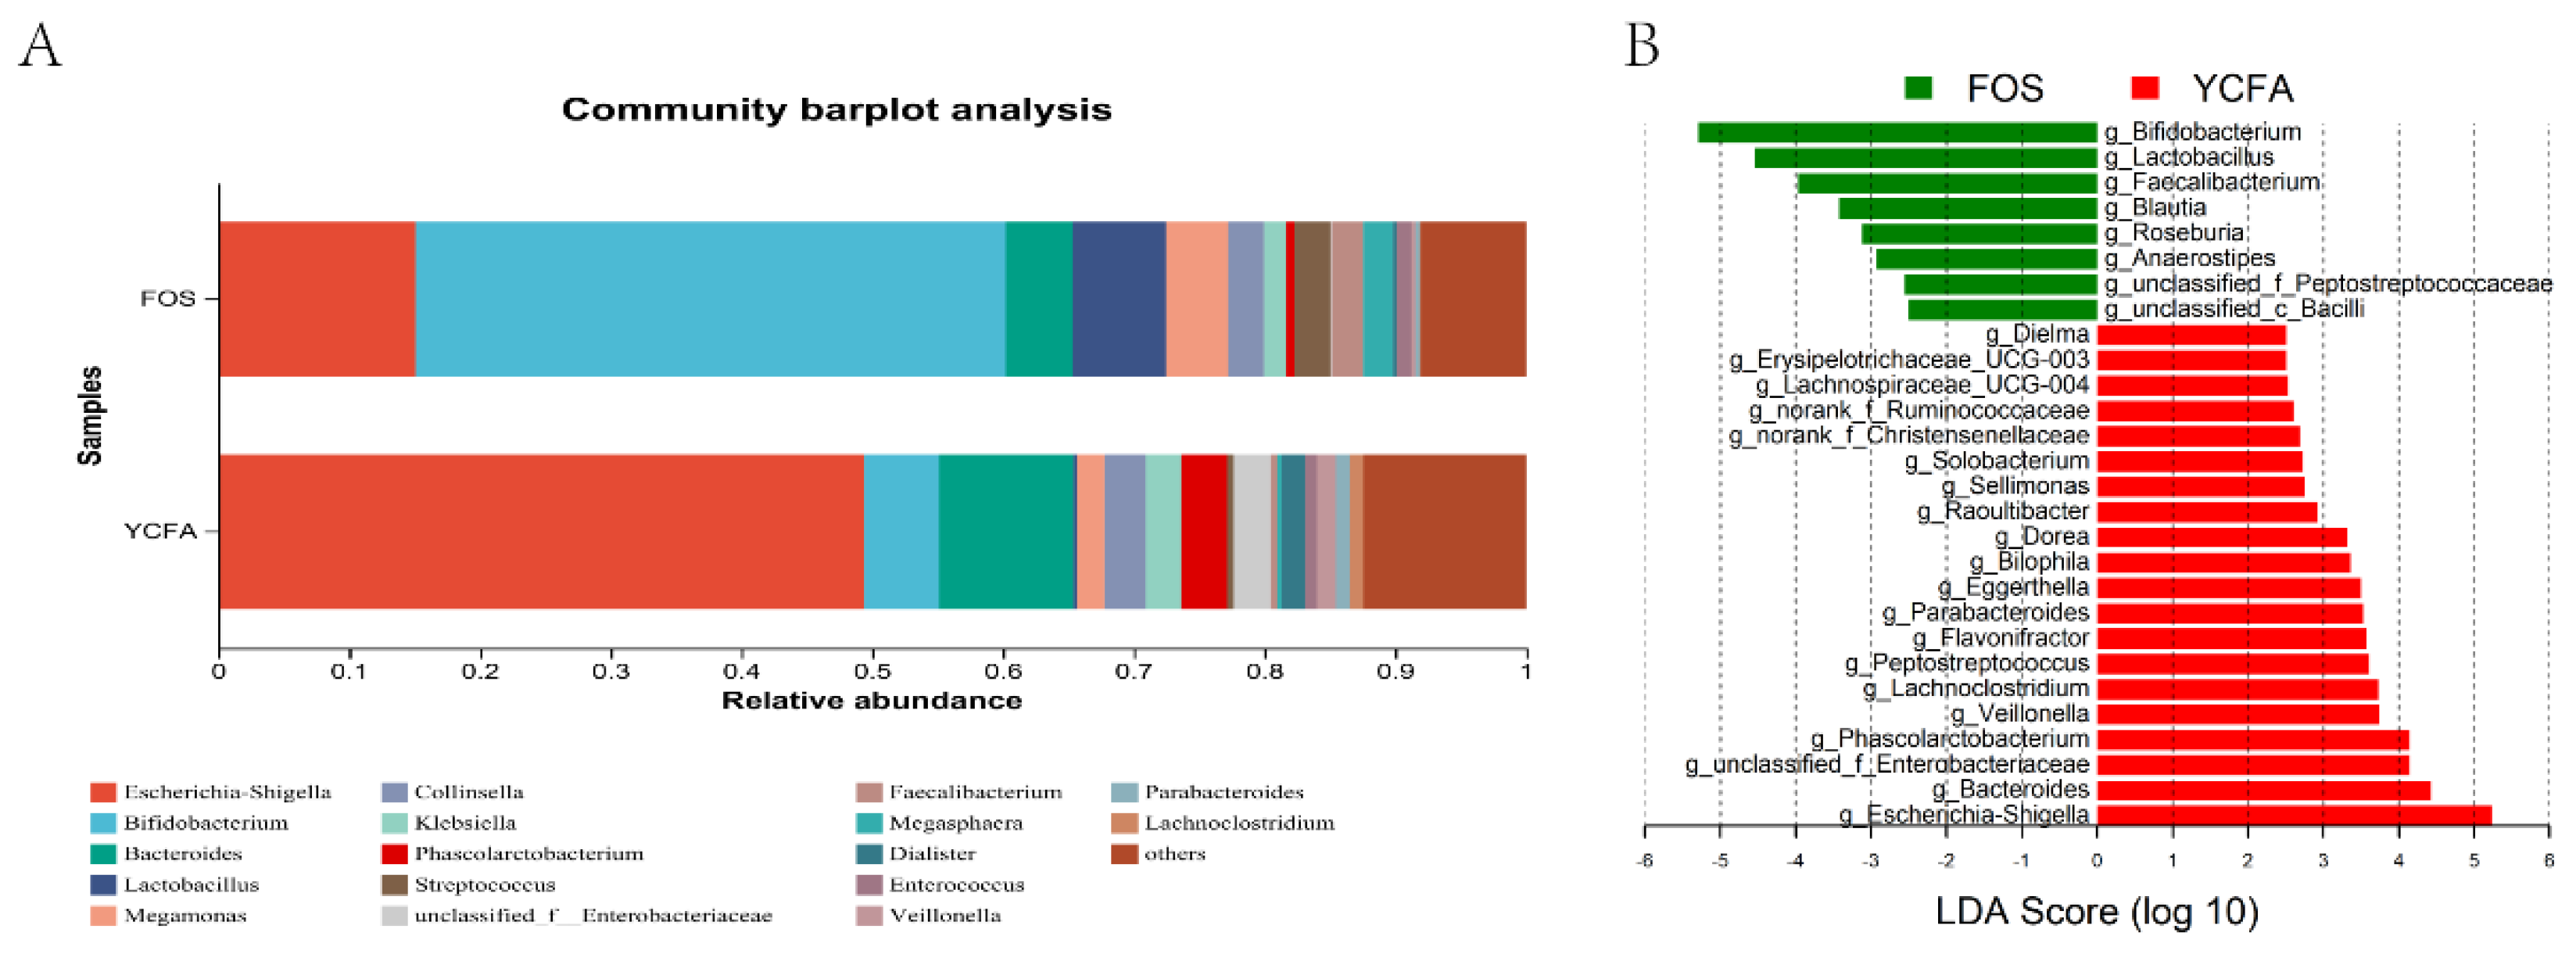
Figure 3.
Bacterial composition of the primary school group and the junior middle school group on FOS medium and YCFA medium after in vitro fermentation. (A) Genus-level microbiota composition of four groups: the primary school group in the FOS+YCFA medium (FOS_P), the primary school group in the YCFA medium (YCFA_P), the junior middle school group in the FOS+YCFA medium (FOS_M), and the junior middle school group in the YCFA medium (YCFA_M); (B~I) the relative abundance of the 8 bacterial genera in the two age groups after in vitro fermentation. Data are means ± SEMs (41 independent experiments × 3 replicate experiments). Statistical significance thresholds were *0.01 < P ≤ 0.05; **0.001 < P ≤ 0.01; ***P ≤ 0.001.
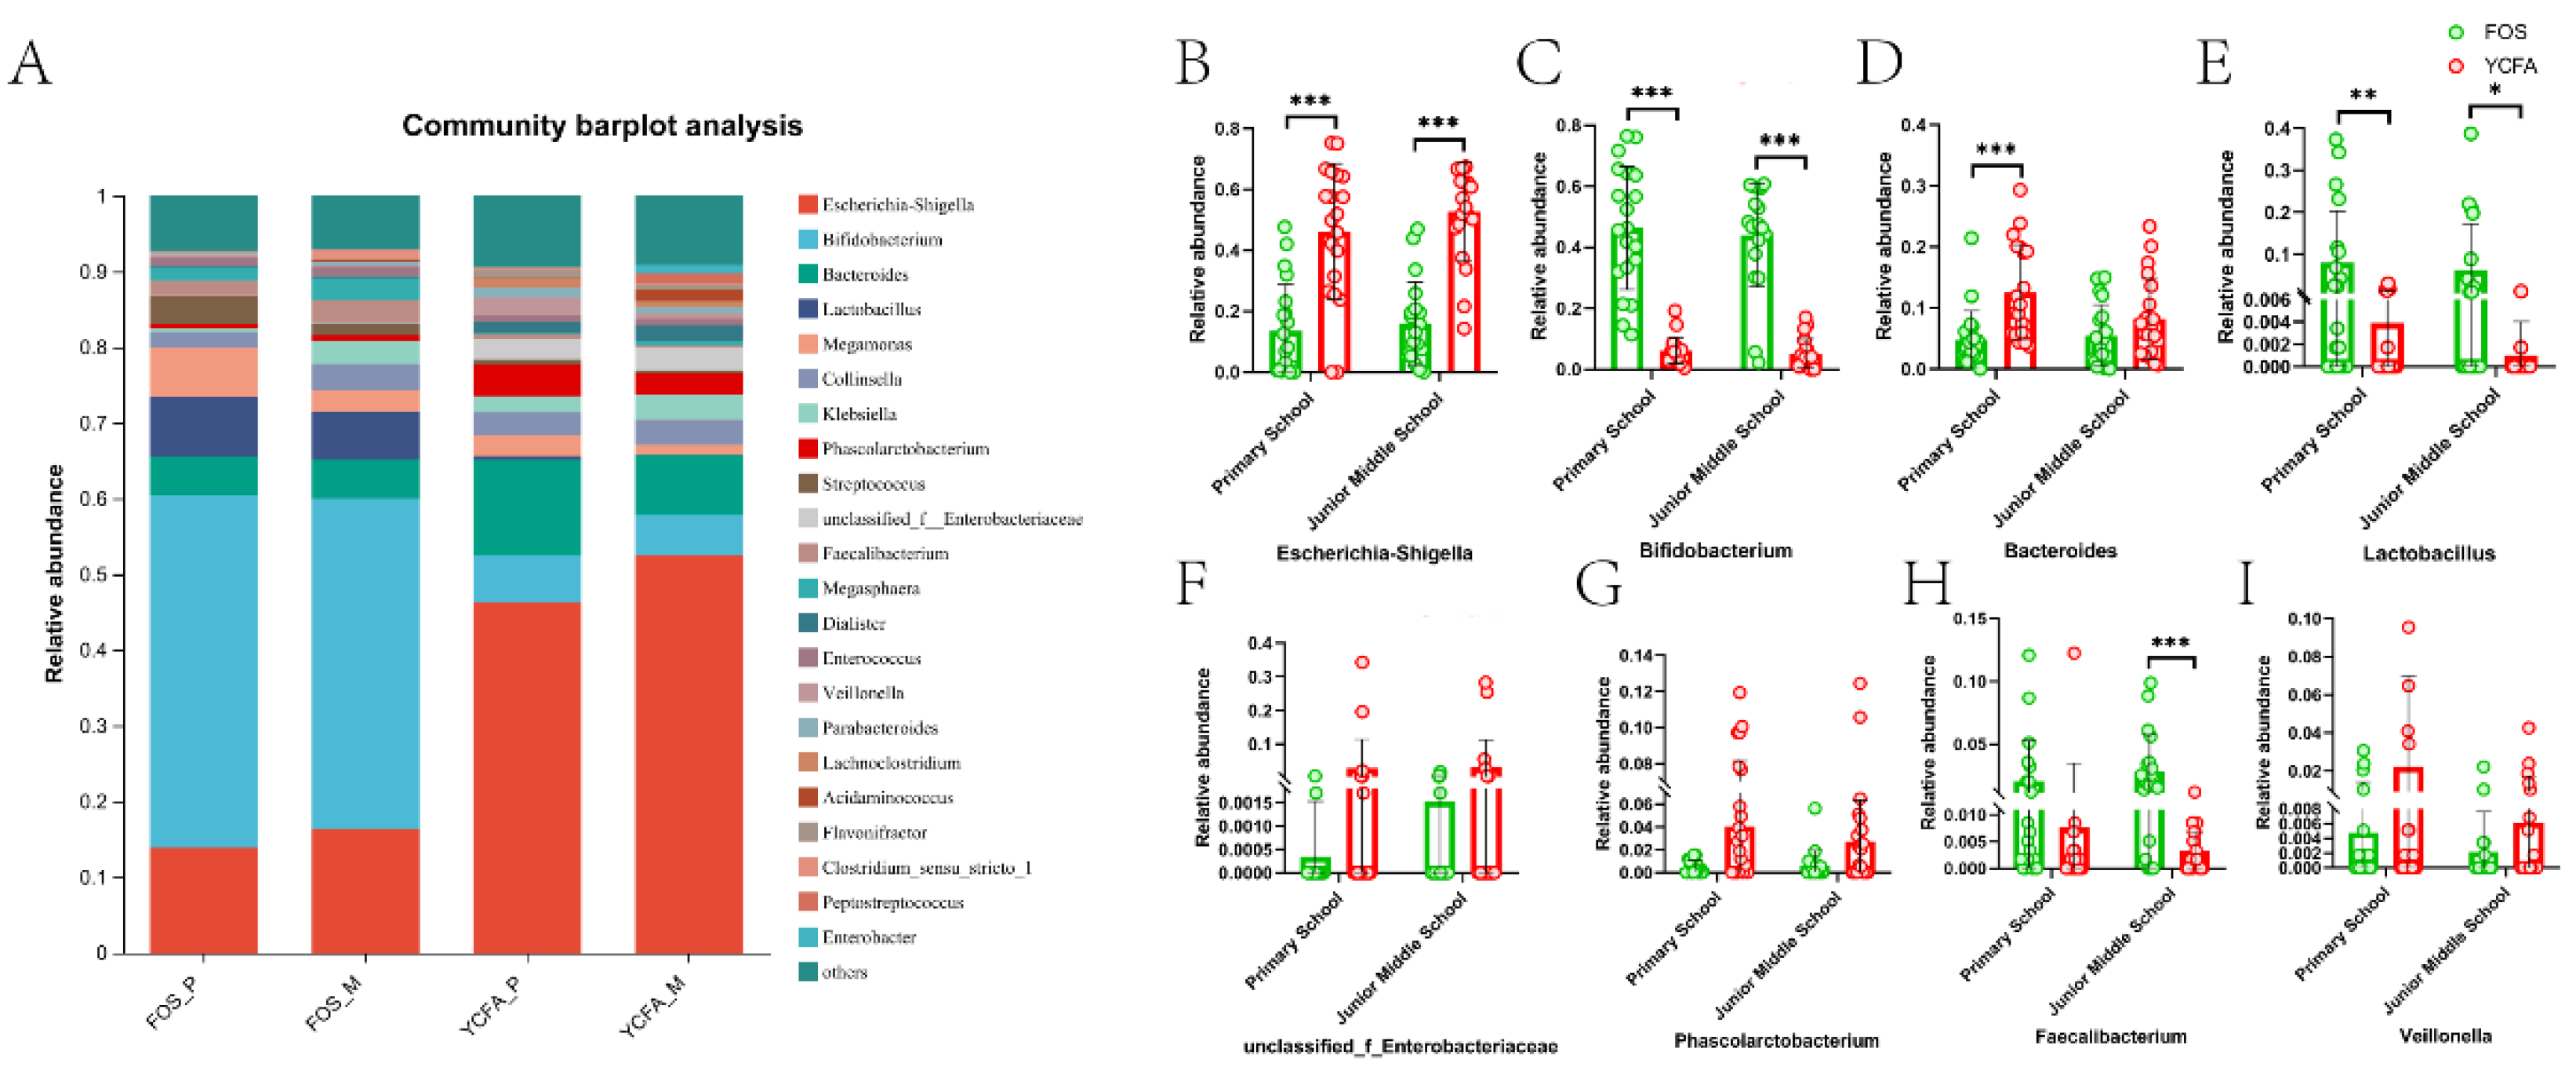
Figure 4.
The level of SCFAs between different media during in vitro fermentation. (A) The level of total SCFAs and (B) six SCFAs between different mediums, and (C) the level of total SCFAs and (D~I) six SCFAs between different mediums of two age groups; (J) Correlation between gut microbiota and SCFAs. Data are means ± SEMs (41 independent experiments × 3 replicate experiments). Statistical significance thresholds were *0.01 < P ≤ 0.05 and **0.001 < P ≤ 0.01.
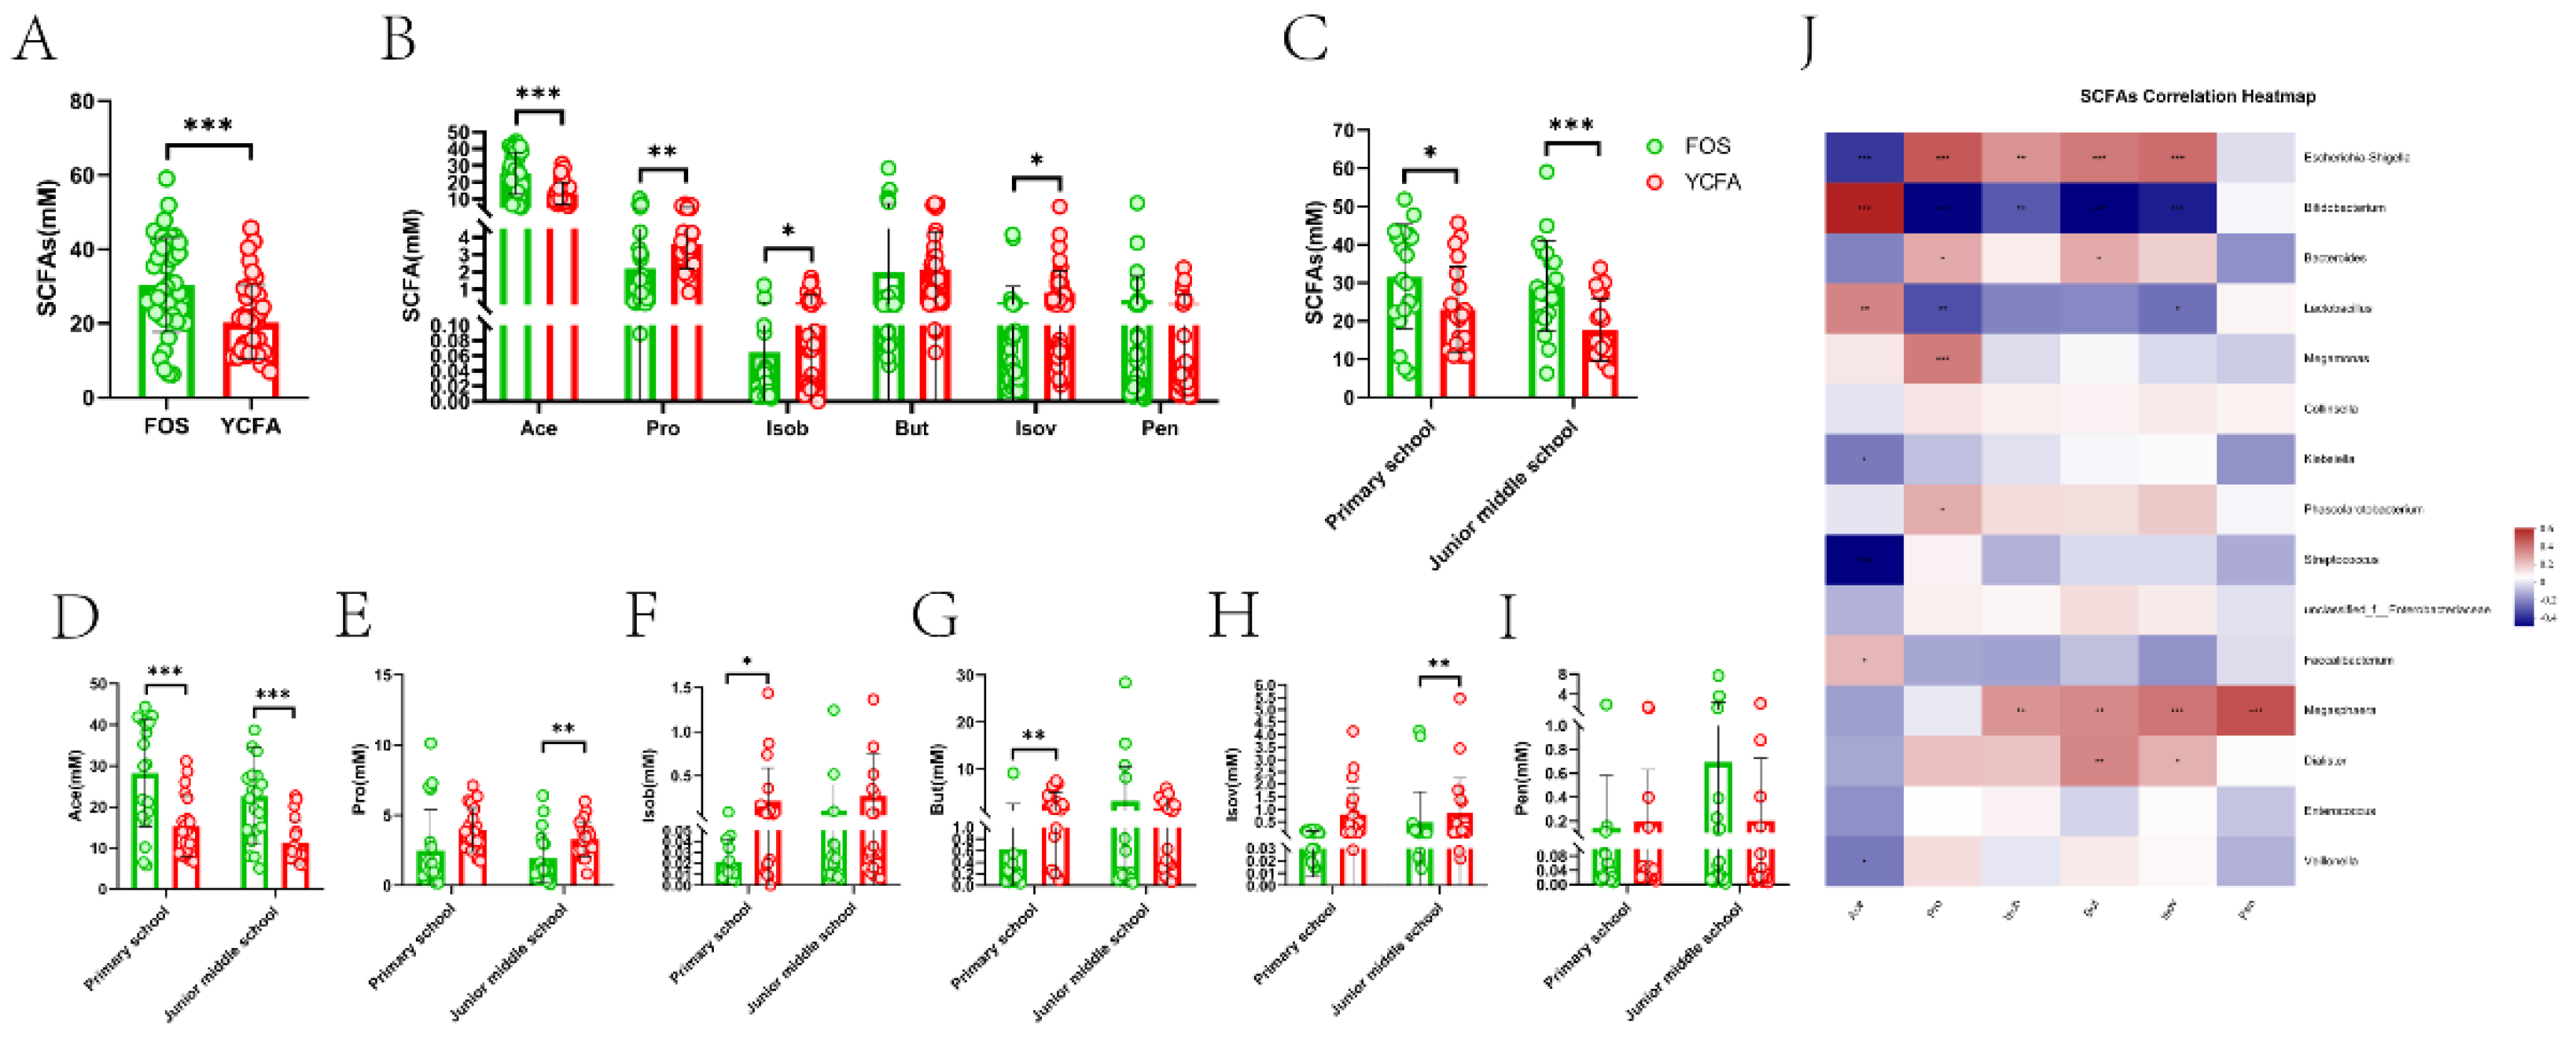
Figure 5.
Effects on the content of gas between different media during in vitro fermentation. (A) The content of total gases and (B) five gases between different mediums, and (C) the level of total gases and (D~H) six gases between different mediums in two age groups; (I) Correlation between gut microbiota and gas. Data are means ± SEMs (41 independent experiments × 3 replicate experiments). Statistical significance thresholds were *0.01 < P ≤ 0.05; **0.001 < P ≤ 0.01; ***P ≤ 0.001.
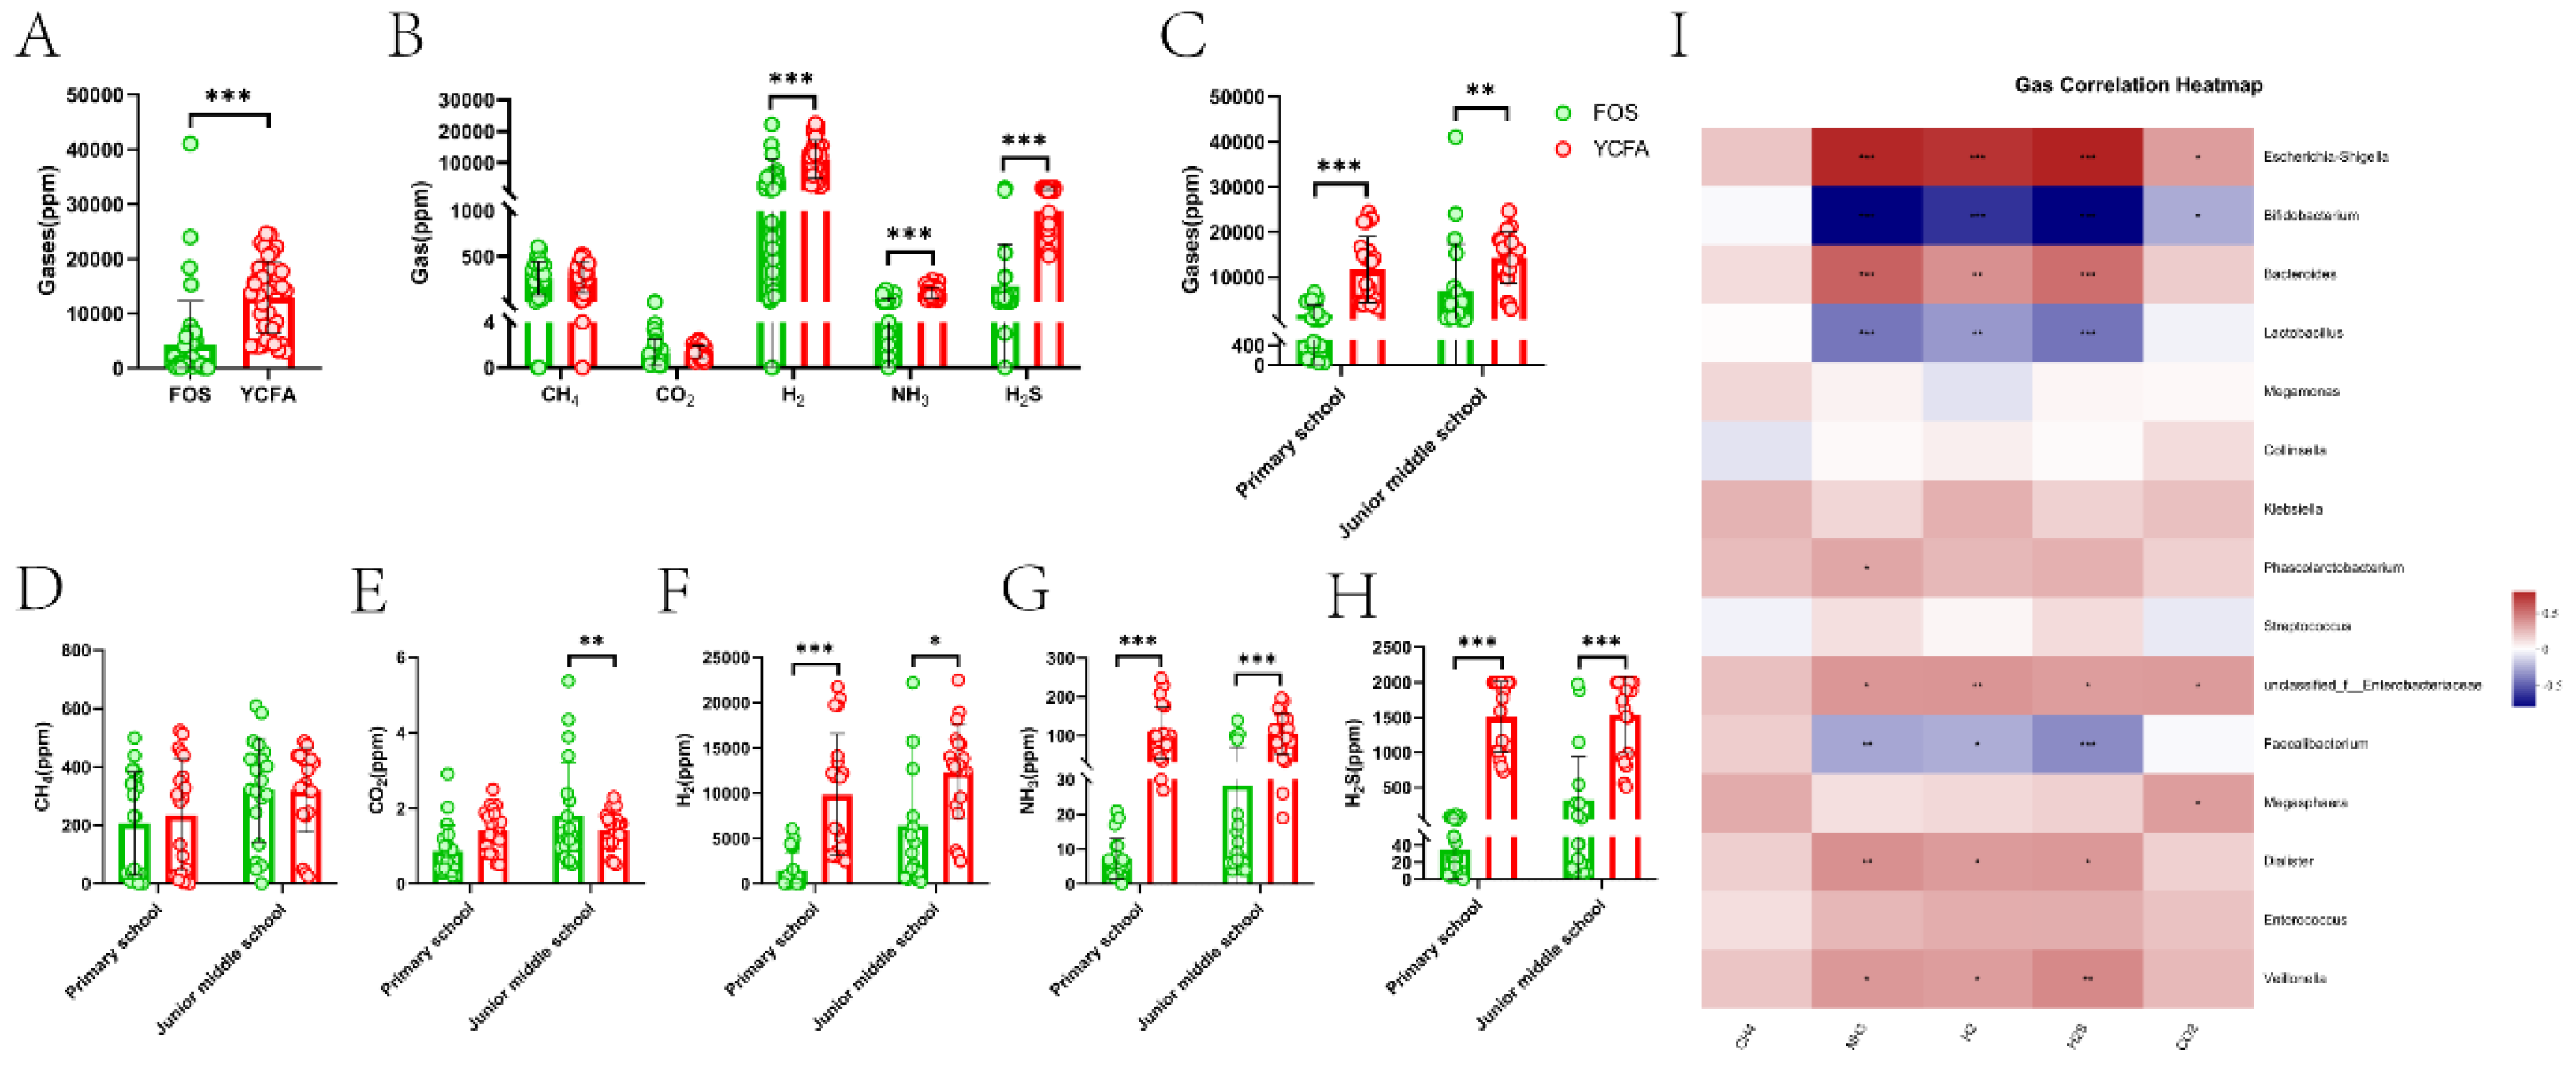
Figure 6.
Origin analysis and origin-based function analysis. (A) Bar plot of the number of metabolites in different categories. Venn diagram (B) of the number of enriched metabolic pathways (C) from origin-based MPEA analysis. In the network summary of the diet study on metabolites produced by microbiota, diamond, dot, and rectangle shapes indicate corelate metabolites, microbes, and metabolic pathways, respectively. (D) The red/green color of nodes indicates up/downregulation. The red/green lines indicate the positive/negative correlations between microbes and metabolites.
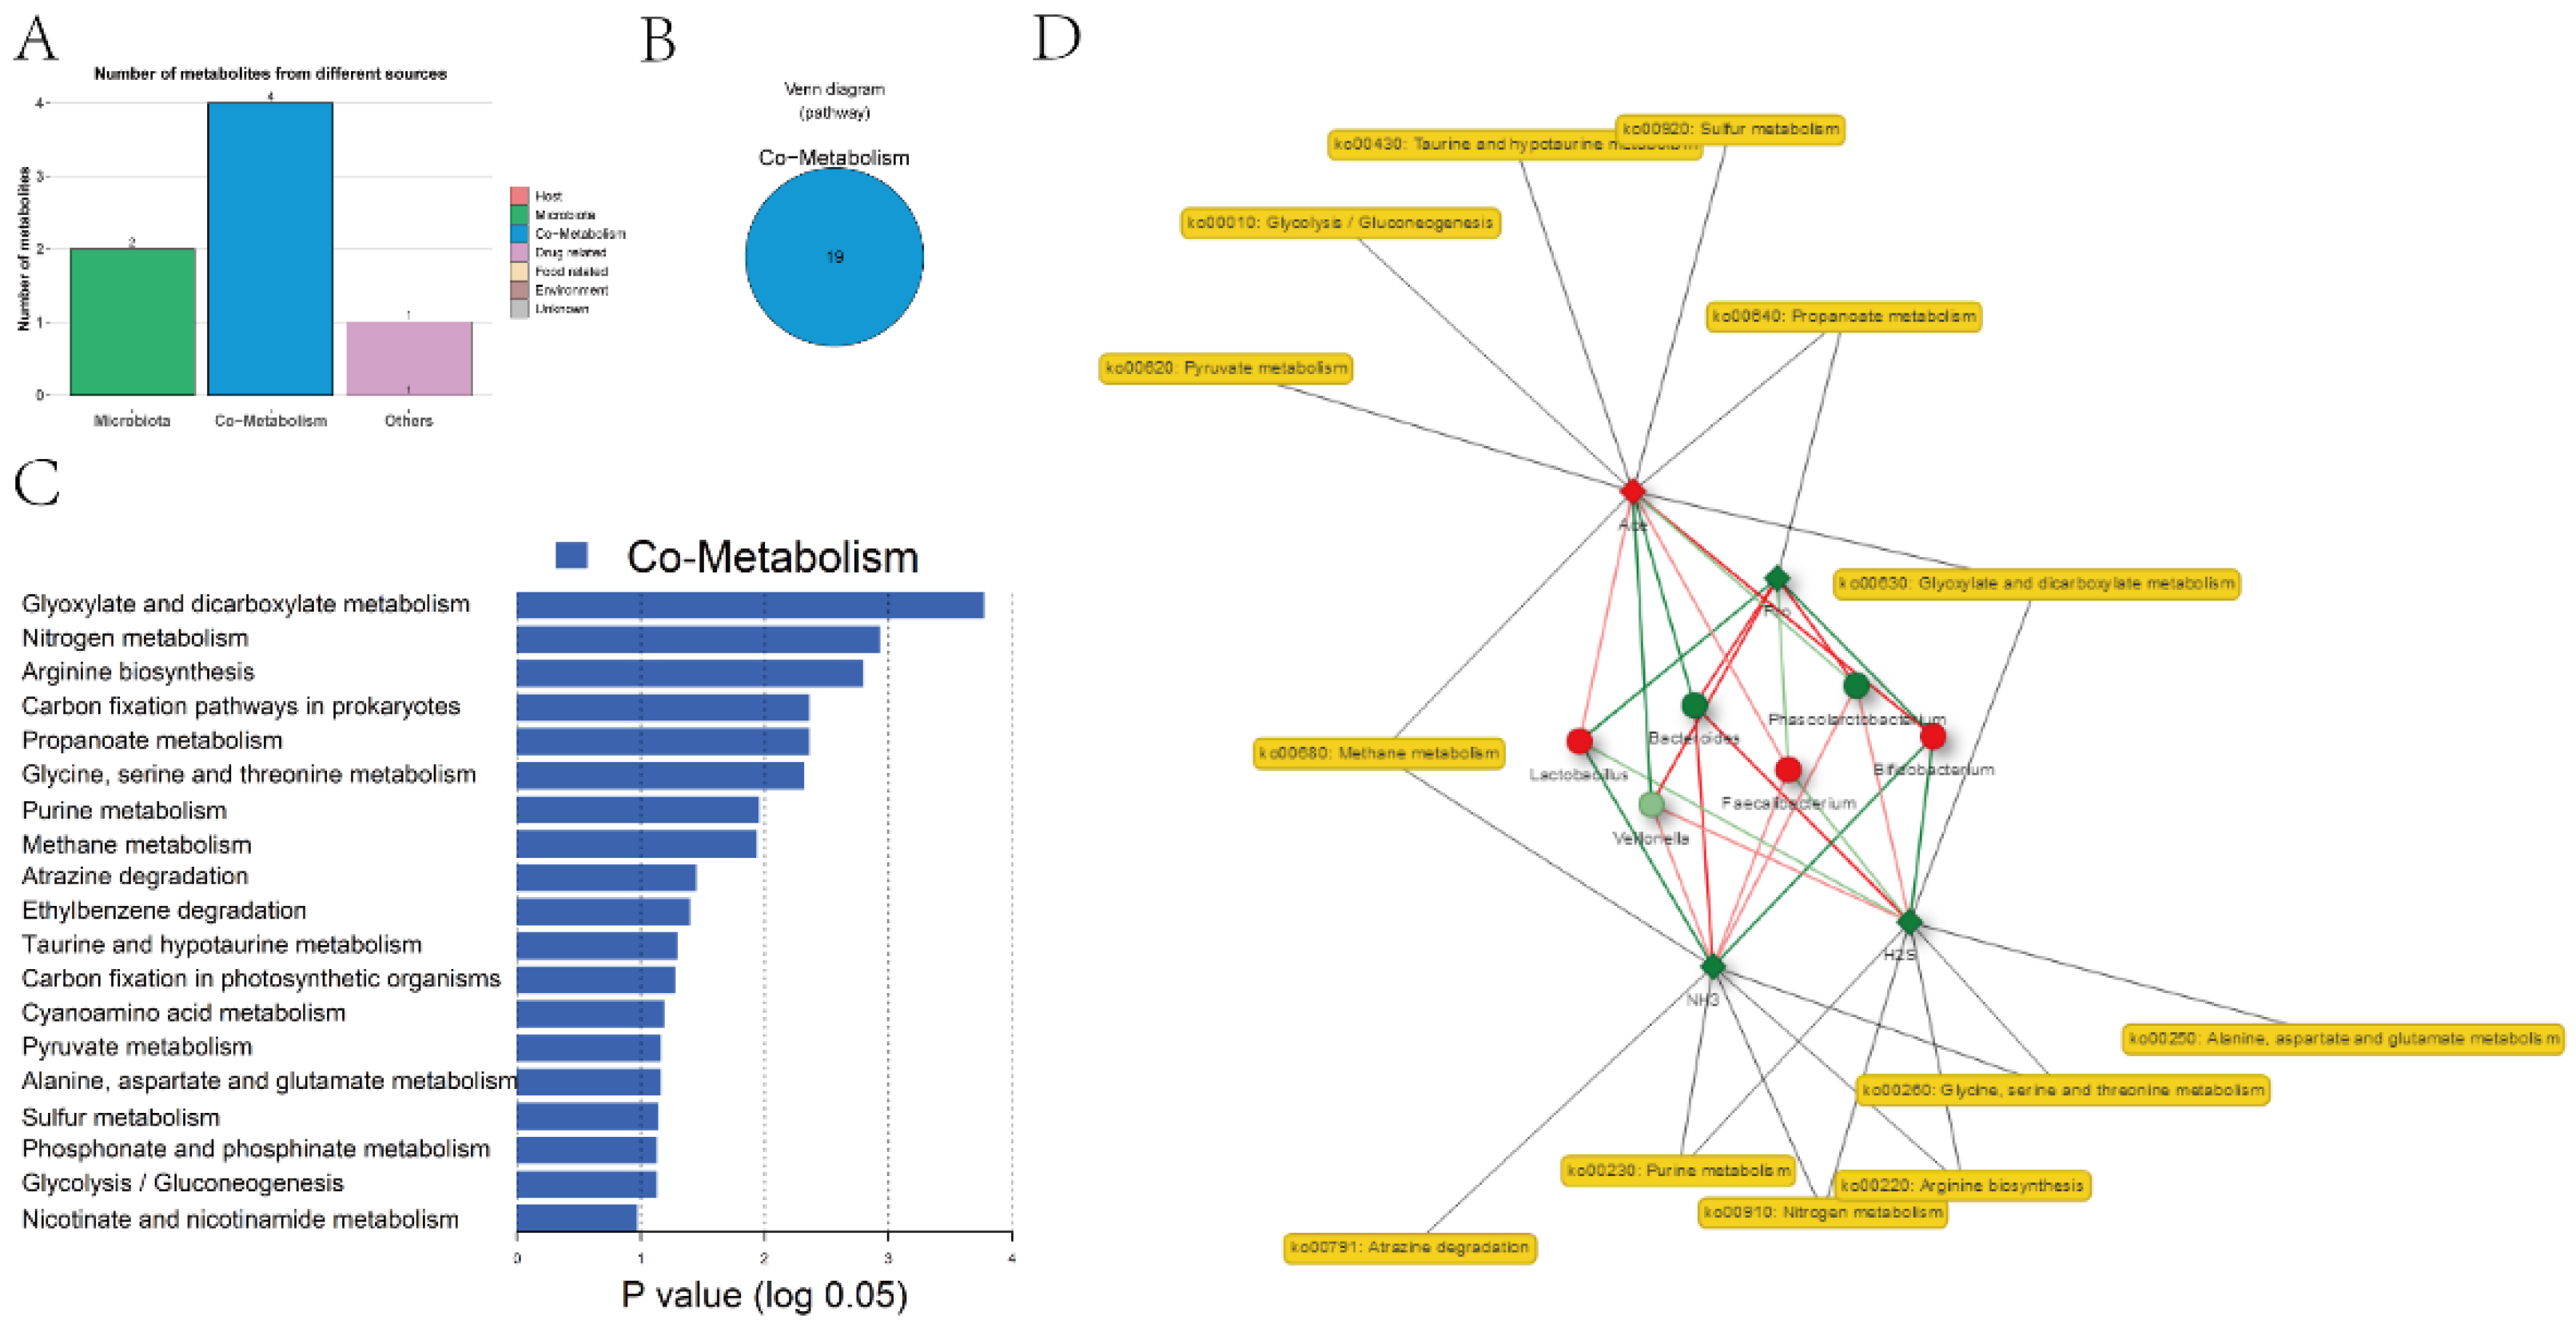

Table 1.
Characteristics of the children in different mediums
| Age group | Primary school | Junior middle school | ||
|---|---|---|---|---|
| Medium | YCFA+FOS | YCFA | YCFA+FOS | YCFA |
| Experimental group | FOS_P | YCFA_P | FOS_M | YCFA_M |
| Number of samples | 20 | 20 | 20 | 20 |
Disclaimer/Publisher’s Note: The statements, opinions and data contained in all publications are solely those of the individual author(s) and contributor(s) and not of MDPI and/or the editor(s). MDPI and/or the editor(s) disclaim responsibility for any injury to people or property resulting from any ideas, methods, instructions or products referred to in the content. |
© 2023 by the authors. Licensee MDPI, Basel, Switzerland. This article is an open access article distributed under the terms and conditions of the Creative Commons Attribution (CC BY) license (http://creativecommons.org/licenses/by/4.0/).
Copyright: This open access article is published under a Creative Commons CC BY 4.0 license, which permit the free download, distribution, and reuse, provided that the author and preprint are cited in any reuse.


