Submitted:
05 March 2023
Posted:
06 March 2023
You are already at the latest version
Abstract
Chronic hepatitis B infection remains a significant worldwide health burden, placing persons at risk for hepatocellular cancer and hepatic fibrosis. Chronic hepatitis B virus (CHB) infection is characterized by elevated levels of immunosuppressive regulatory T cells (Tregs), which can inhibit the function of effector T cells and lead to an insufficient immune clearance response against HBV in the host. Theoretically, suppression of Treg functionality and percentage could increase anti-HBV reactivity in CHB-infected patients, although this has not yet been explored. We attempted to enhance our previously established anti-CHB protocol utilizing the GM-CSF+IFN-α+rHBVvac regimen (GMI-HBVac) by incorporating Mafosfamide (MAF), which has been utilized in anticancer therapy in the past. Intravenous administration of MAF to rAAV8-1.3HBV-infected mice resulted in a dose-dependent reduction of Tregs in the blood, rebounding to pretreatment levels 10 days later. To determine the efficacy of anti-CHB, 2ug/ml MAF was combined with the GMI-HBVac in an HBV-infected animal model as an anti-Treg treatment. When rAAV8-1.3HBV-infected mice were immunized with MAF+GMI-HBVac, peripheral blood Tregs decreased significantly, leading to dendritic cell activation, HBV-specific T cell proliferation, and upregulation of IFN-gamma producing CD8+T cells. In addition, MAF+GMI-HBVac vaccination stimulates T cell infiltration in HBV-infected liver. These conditions may contribute to an enhanced immune response and the clearance of HBV-associated antigens, including serum HBsAg, serum HBcAg, and HBcAg+ hepatocytes. Overall, this is the first indication that MAF was utilized as an adjuvant to deplete Tregs and paired with GMI-HBVac as a unique therapeutic vaccine regimen against established CHB mice to produce a functional cure, as seen by the remarkable clearance of HBsAg.
Keywords:
Chronic hepatitis B infection
; Therapeutic vaccines
; Regulatory T cells
; Functional cure
; GMI-HBVac
; Mafosfamide
1. Introduction
Hepatitis B is a potentially fatal liver disease caused by infection with the hepatitis B virus (HBV), and it has become a major global health issue. HBV is an enveloped, hepatotropic, non-cytopathic DNA virus that can cause acute and chronic hepatitis [1]. Chronic HBV infection (CHB) puts people at risk of cirrhosis and hepatocellular carcinoma in the advanced stage of the disease and death. As of 2019, 2.3 billion people were infected with HBV worldwide, 296 million became chronic HBV infections, and approximately 0.82 million people died each year from HBV-related liver disease [2]. In Asia, the percentages of chronic HBV infection in adults range between 5% and 10%, posing a serious public health concern. A cure for chronic hepatitis B remains a formidable challenge.
The current therapeutic regimen of nucleotide analogs and interferon-a for HBV infection is still insufficient in clearing HBV-related antigens, particularly long-term medication, which is an enormous burden to a patient and incurs high costs. Although several antiviral drugs are clinically effective in suppressing viral replication and production, a functional cure cannot be achieved with a viral rebound if the drug is withdrawn. Simultaneously, the presence of cccDNA and integrated DNA are still critical challenges for antiviral approaches. To achieve a functional cure, the field has agreed that antiviral drugs should be combined with an effective immunotherapeutic treatment. Most immunotherapeutic approaches, however, have difficulty circumventing the immunosuppression or immunotolerance induced by HBV infection by using several potent viral components to induce regulatory T cells (Tregs, defined as CD4+CD25+Foxp3+). Tregs are known to suppress T cell proliferation and effector functions, resulting in immunosuppression and tolerance [3]. CHB has been linked to a significant increase in the proportion of Tregs [4,5,6,7]. Immunosuppression and immunotolerance led by Tregs fail to clear host cells infected with HBV and HBV-related antigens (e.g., HBsAg, HBeAg, HBV DNA) in CHB patients, resulting in chronic infections. Tregs have also been shown in murine models to impede the development of antitumor immune responses. Removing CD4+CD25+Foxp3+ Tregs boosts immune responses against tumor antigens after immunotherapeutic agents are administered. The same evidence was discovered in chronic HBV infection [8,9]. As a result, methods of impairing Treg function may be at the root of successful immunotherapeutic treatment for chronic HBV infection. There would be significant therapeutic potential in delivering an immunotherapeutic agent to suppress the function of Tregs while having minimal side effects on normal immune cells and achieving the goal of a functional cure for CHB infection.
Cyclophosphamide (CTX) and Mafosfamide (MAF) are two clinically alkylating agents that are used in cancer chemotherapy to suppress Treg function [10,11,12]. Immunosuppression of cell proliferation and excessive immune response, such as preventing organ rejection in transplantation, necessitates high doses of the agent. Nonetheless, low doses of the agent can boost immune responses to pathogenic antigens by depleting Tregs and unidentified immunosuppressive cells such as MDSCs. CTX is hydrolyzed to phosphoramide mustard by the cytochrome P450 system (phosphoramidase/P450-enzyme/phosphatase) in the liver (active form). Phosphoramide mustard has the ability to alkylate DNA at the N7 position of guanine, resulting in DNA inter-strand crosslinks (ICL) and, as a result, cell apoptosis. Although MAF is derived from CTX, it does not require hydrolysis from the liver function, making it safer than CTX [13,14]. It has recently been demonstrated that CTX or MAF can reduce the percentages of CD4+CD25+Foxp3+ Tregs at low doses and directly attenuate Treg suppression. Treatment with CTX or MAF also promotes the apoptosis of other immunosuppressive cells. Furthermore, several studies have found that GM-CSF can stimulate the activation of phagocytes and dendritic cells [15,16,17]. Interferon-α can induce specific degradation of HBV covalently closed circular DNA (cccDNA) in HBV-infected cells via up-regulated APOBEC3A and APOBEC3B cytidine deaminases without causing hepatotoxicity [18,19]. Furthermore, previous research in our laboratory has shown that cytokines like GM-CSF and IFN-α can effectively boost the immune response induced by the hepatitis B vaccine [20,21]. All of this emphasizes the possibility of curation of CHB infection.
We investigated the impairment of immune suppression induced by Tregs with MAF or CTX) in order to potentiate the immunogenicity of the GMI-HBVac when MAF or CTX was used as an adjuvant and further enhance the efficacy of the immunotherapeutic treatment in CHB infected mice caused by rAAV8-1.3HBV infection. To the best of our knowledge, the therapeutic effect of MAF or CTX on Treg in CHB infection has not yet been investigated. This approach could be modified and lead to a functional cure for CHB infection in human clinical trials.
2. Materials and Methods
2.1. Animals, viruses, and reagents
Animals: Six- to eight-week-old male C57BL/6 mice of the wild-type strain were acquired from Silaike Laboratory Animal Co., Ltd. (Shanghai, China). All mice were housed in separate, ventilated, pathogen-free cages following the Animal Care guidelines of Fudan University.
Viruses: The rAAV8-1.3HBV has a 1.3kb HBV genome (genotype D, serotype ayw) packed into a recombinant AAV8 vector. The rAAV8-1.3HBV was acquired from Paizhen Biotechnology Co., Ltd. (Guangzhou, China).
Reagents: Recombinant Chinese hamster ovary cells-derived HBsAg (rHBVvac) and recombinant human GM-CSF were generously donated by Jingtan Biotech Corp. of China North Pharmaceutical Group (Shijiazhuang, China) and Huaqiao hospital, respectively (Putian, China). Human recombinant Interferon-α (IFN-α) was bought from Ruijin Hospital's Pharmacy (Shanghai, China), and purified recombinant HBsAg protein (rHBsAg) that was purchased from Guikang Biotechnology, Ltd. (Shanghai, China). Both the HBsAg-specific CTL epitope S208-215 (ILSPFLPL; H-2b-restricted) and the Ovalbumin (OVA)-specific CTL peptide OVA257-264 (SIINFEKL; H-2b-restricted) were manufactured by the Genscript Biotech Corporation (Nanjing, China). CFSE was purchased from Invitrogen, while antibodies used in flow cytometry and immunohistology analysis and Brefeldin A (BFA) were obtained from Becton, Dickinson &Co., BioLegend Inc., and eBioscience, respectively. FBS, or fetal bovine serum, was bought from Gibco (US). Ionomycin and phorbol myristate acetate (PMA) were acquired from MedChemExpress company. Cyclophosphamide (CTX) and mafosfamide (MAF) were obtained from Sigma-Aldrich and Santa Cruz Biotechnology.
2.2. CHB animal model
Each male mouse was injected via the tail vein with 1x10¹⁰ TCID50 of the rAAV8-1.3HBV following the manufacturer's instructions. All mice were bred under controlled environmental conditions. Serum from infected mice was analyzed for the levels of HBV DNA, HBsAg, anti-HBsAg, and HBeAg. All experimental procedures were performed under the guidance of the animal use and care committee.
2.3. Immunization
Mice infected with rAAV8-1.3HBV were randomly divided into six groups (n = 6), according to Table 1. Subcutaneous injections of GM-CSF (10ug), IFN-α(10,000IU), and HBV vaccine (1ug) were administered on day 0 following vaccination. On day 0, CTX or MAF was given intravenously, whereas mice in the control group did not receive CTX or MAF. Three subcutaneous injections of the same regimens were given on days 14, 28, and 49. After injections, mice were sacrificed at respective time points following, and spleen and peripheral blood cells were removed and examined.
2.4. Delayed-type hypersensitivity (DTH) assay
On day 7, following the third and fourth immunization, 10 ug of rHBsAg was injected into the left footpad, and phosphate-buffered saline (PBS) was injected into the right footpad as a control. After 24 hours and 48 hours, the swelling was measured with a vernier caliper. The results are reported as the mean standard deviation of the thickness of the left and right footpads.
2.5. Cell culture
CD8+ T cells (5x10⁴) from control mice were incubated with 1x10⁵ antigen-presenting cells (APCs), which were screened from spleen cells by depleting CD4+ and CD8+ cells from untreated control mice, and 1ug/mL anti-CD3 (BD Biosciences PharMingen) in the presence or absence of 5x10⁴ Tregs from either control mice or mice treated with 2ug/ml MAF (15mg/kg CTX). The cells were cultured for 72 hours and harvested 12 hours after adding CFSE. Using control wells containing Tregs, APCs, and anti-CD3, baseline levels of proliferation were determined. Tregs were determined to be the CD4+CD25+Foxp3+ cells that did not proliferate further.
2.6. In vitro T cell proliferation assay
On day 14, following the fourth immunization, all animals were sacrificed for the preparation of single cell suspension of splenocytes. To assess splenocyte proliferation, a commercially available cell proliferation dye (CFSE, Invitrogen) was utilized. As cells divide, the fluorescence intensity of primordial cells diminishes. Splenocytes (5x10⁵ cells) were incubated with CFSE at a concentration of 1uM. The cells were incubated at 37°C in the dark for 10 minutes before being resuspended in RPMI1640 with 10% FBS. After washing, the cells were moved to plates and re-incubated in the presence of anti-CD28 (100ng/mL) with HBsAg-specific CTL epitope S208-215 (1ug/L) as a specific stimulator. Positive control cells were re-incubated with anti-CD3 (1ug/mL) and anti-CD28 (100ng/mL), while negative control cells were re-incubated with OVA-derived peptide OVA257-264 (1ug/mL). All plates were incubated for 72 hours at 37°C in a humidified environment containing 5% CO2 before flow cytometry (FCM) analysis was performed.
2.7. Serological and biochemical analysis
Seven days after the last vaccination, serum HBsAg, HBsAb, and HBeAg levels were measured using ELISA kits acquired from Kehua Bioengineering Co., Ltd. (Shanghai, China). Serum ALT activity was determined using an ALT kit from BioSino Bio-technology and Science Inc. (Beijing, China).
2.8. HBV DNA quantitation
Real-time quantitative PCR was used to quantify serum HBV DNA using a kit from Kehua Bio-engineering Co., Ltd. (Shanghai, China). The minimum detectable concentration was 100 IU/ml.
2.9. In vivo cytotoxic lysis assay
Splenocytes from naive C57BL/6 donor mice were labeled with 15uM CFSE and treated with 1ug/mL S208-215 peptide (cells of high fluorescence intensity). Equal number of splenocytes were used to labeled with 1uM of CFSE and activating them with 1ug/mL of OVA257-264 peptide (cells of low fluorescence intensity). On day 14 after the last immunization, 2x10⁷ cells were adaptively transferred intravenously into immunized recipients using a 1:1 mixture of two cell types. The recipients' splenocytes were extracted and quantified eight hours later using FCM fluorescence intensities.
2.10. Histology and immunohistochemistry (IHC) analysis
The liver and spleen were fixed overnight with 4% formalin and prepared for paraffin embedding. Hematoxylin-eosin (H&E)-stained 10μm slices were examined by light microscopy to identify liver abnormalities. IHC analysis was used to investigate further HBcAg- and HBsAg-positive hepatocytes and inflammatory cell infiltration. To assess the HBcAg, HBsAg, CD4, and CD8 markers, 10μm liver or spleen slices were fixed with ice-cold methanol, dehydrated through graded alcohols, and subjected to antigen retrieval with 10mM sodium citrate. Sections of the liver or spleen were treated with mouse monoclonal anti-HBcAg, anti-HBsAg, anti-CD4, and anti-CD8 antibodies. Sections were treated with goat anti-mouse horseradish peroxidase antibody for 1 hour after being washed and incubated with TBST for 1 hour. Finally, the slides were treated with 3,3-diaminobenzidine (DAB) chromogen solution, followed by hematoxylin counterstaining. Then, the integral OD of HBcAg, HBsAg, CD4, and CD8 staining was examined using Image-Pro Plus (Media Cybernetics, Inc., Silver Spring, Maryland, United States of America) software.
2.11. Flow cytometry (FCM)
Flow cytometry was performed with Diva software on a flow cytometer (FACS LSR-Fortessa, BD Bioscience, USA). CD11b (clone: M1/70, BioLegend), CD11c (clone: HL3, BD), CD80 (clone: 1610A1, eBioscience), CD86 (clone: GL-1, BioLegend), MHC-I (clone: AF6.88.5.5.3, eBioscience), and MHC-II (clone: M5/114.15.2, eBioscience) were the flow cyto CD11b (clone: M1/70, BioLegend), Ly6G (clone: RB6-8C5, eBioscience), and Ly6C are found on monocytes (clone: HK1.4, BioLegend). T cell: CD4 (RM4-5, BioLegend clone); CD8 (clone: 53-6.7, eBioscience). Intracellular cytokine: anti-IL4 (clone: 11B11, BioLegend), anti-IFN-γ (clone: XMG1.2, BioLegend). To identify nonspecific background staining, isotype-matched control mAbs were employed.
2.12. Statistics
GraphPad Prism Software 9.0 was used for statistical analysis (GraphPad, La Jolla, CA, USA). All results are displayed as means ± Standard Error of Mean (SEM). For continuous variables, the Mann-Whitney U test was used to determine abnormal distribution, whereas the student’s t-test was used to determine normal distribution and homogeneity of variance. P<0.05 was considered significant for all analyses.
3. Results
3.1. rAAV8-1.3HBV infected mice production and immune tolerance facilitated by increased CD4+CD25+Foxp3+ Tregs
To examine the efficiency of our regimens, male C57 BL/6 mice were injected with rAAV8-1.3HBV at 1×10¹⁰ug per mouse intravenously to produce a persistent infected mouse model for testing. For confirming rAAV8-1.3HBV infectivity in these mice, the HBV-related antigens were measured by ELISA, qPCR, and immunohistochemistry after 14 days and continuously monitored changes for half of the year (Figure 1A). The analysis revealed that HBsAg, HBeAg, and HBV DNA could be detected in serum by ELISA and qPCR after 2 weeks of mice infected, the level of serum HBsAg, HBeAg, and HBV DNA were dramatically increased over baseline (cut-off value), which were higher in rAAV8-1.3HBV infected mice than those control mice. Meanwhile, the level of anti-HBsAg was below the baseline. Moreover, ALT in serum was also increased over baseline (Figure 1D). H&E staining revealed mildly diffuse hepatocellular de-generation alongside swollen and vacuolated hepatocytes in the HBV-infected mouse liver when compared to hepatocytes from a healthy individual. Immunohistochemistry and immunofluorescence staining were used to determine the expression of HBsAg and HBcAg in the liver of rAAV8-1.3HBV-infected mice. Large amounts of HBsAg and HBcAg were found in infected hepatocytes with widespread distribution (Figure 1C). Moreover, HBsAg, HBeAg, and HBV DNA persisted in the serum and hepatocytes for several months. These findings are consistent with the concept that clinical CHB individuals have an active expression of HBV-related antigens without anti-HBsAg in serum. Furthermore, here we verified that the persistent infected CHB-like mouse could be used for developing novel antiviral strategies for the functional cure of CHB infection.
The difficulty in treating chronic hepatitis B is immune suppression due to immune tolerance and excessive Tregs. Many studies reported that immune tolerance is associated with immunosuppressive cells such as Tregs induced by HBV infection. We found that Tregs of peripheral blood represented 7.13% of the total CD4+ T cell population in the CHB mice infected by rAAV8-1.3HBV, which was nearly twice higher than 4.25% of negative control mice (Figure 1B), in agreement with these clinical observations that excessive Tregs impaired the immune response against HBV-related antigens, resulting in immune tolerance and chronic HBV infection.
3.2. Low concentrations of Mafosfamide (Cyclophosphamide) contribute to Tregs decrease with minimal detrimental effects in vivo
Since CTX and MAF have opposite effects on immune function at high and low concentrations, their metabolization pathways into active products are also different in vivo. To deplete the excessive Tregs and break immune tolerance in CHB-infected animals, we first tested the pernicious effects of CTX or MAF on Tregs at different concentrations. CTX or MAF was administrated once by intravenous tail injection into five groups with different doses, as illustrated in Figure 2A. PBS was injected as a negative control. Doses for MAF were set at 0μg/ml, 0.5μg/ml, 1.0μg/ml, 2.0μg/ml, and 4.0μg/ml, while CTX were set at 0 mg/kg, 15 mg/kg, 30 mg/kg, and 60 mg/kg. Peripheral blood monocytes of the treated mice were collected on days 0, 2, 4, 6, 8, and 10, and performed to determine the change of Tregs over time by FCM analysis.
As depicted in Figure 2B, we found that rAAV8-1.3HBV infected mice treated with a low dose of MAF at 1ug/ml led to a striking decrease in the percentages of Tregs within 48 hours, the percentages of Tregs decreased from 7.69% approach to 3.59% after administration of MAF. Simultaneously, MAF treatment disturbs the balance of circulating lymphocytes, especially in both populations of CD4+ and CD8+ T cells. In comparison, Tregs are more sensitive to MAF than those T cells and B cells. When the concentration of MAF is equal to or above 2 μg/ml (calculated based on the total 2 ml circulating blood of the mouse), and the decrease in Tregs proportion peaked more at a 5% drop (6.72% to 0.97%) on the 4th day after the MAF administration. The effective depletion of Tregs was more than 80% and lasted for about 10 days. Tregs and T cells were gradually back to the pretreatment level by 10 days after the MAF administration, suggesting a self-balancing mechanism of the immune system (Figure 2B, Figure 3A). When the concentration of MAF was above 4 μg/ml, the percentage of depleted Treg was slightly higher than with the 2μg/ml treatment, but the loss of CD4+ T cells and CD8+ T cells reached 50%. whereas, the loss of CD4+ and CD8+ T cells was less than 30% when mice were treated with MAF at 2μg/ml. Interestingly, treating with MAF slightly affected weight losses in the mice compared with controls, but eventually recovered and gained normal growth over time (Figure 3C, 3D). CTX was also examined in the depletion effect of Tregs, and CTX of 15 mg/kg exhibits a better depleting effect of Tregs compared with controls. In contrast to MAF, the effect of CTX to deplete Tregs is weaker than that of MAF of 2μg/ml, and the toxicity to T cells from CTX was stronger than that of MAF at a similar dose (Supplementary figure 2). Therefore, MAF of 2μg/ml was chosen for further investigation if it can enhance the immunogenicity of GMI-HBVac.
As depicted in Figure 2B, we found that rAAV8-1.3HBV infected mice treated with a low dose of MAF at 1ug/ml led to a striking decrease in the percentages of Tregs within 48 hours, the percentages of Tregs decreased from 7.69% approach to 3.59% after administration of MAF. Simultaneously, MAF treatment disturbs the balance of circulating lymphocytes, especially in both populations of CD4+ and CD8+ T cells. In comparison, Tregs are more sensitive to MAF than those T cells and B cells. When the concentration of MAF is equal to or above 2 μg/ml (calculated based on the total 2 ml circulating blood of the mouse), and the decrease in Tregs proportion peaked more at a 5% drop (6.72% to 0.97%) on the 4th day after the MAF administration. The effective depletion of Tregs was more than 80% and lasted for about 10 days. Tregs and T cells were gradually back to the pretreatment level by 10 days after the MAF administration, suggesting a self-balancing mechanism of the immune system (Figure 2B, Figure 3A). When the concentration of MAF was above 4 μg/ml, the percentage of depleted Treg was slightly higher than with the 2μg/ml treatment, but the loss of CD4+ T cells and CD8+ T cells reached 50%. whereas, the loss of CD4+ and CD8+ T cells was less than 30% when mice were treated with MAF at 2μg/ml. Interestingly, treating with MAF slightly affected weight losses in the mice compared with controls, but eventually recovered and gained normal growth over time (Figure 3C, 3D). CTX was also examined in the depletion effect of Tregs, and CTX of 15 mg/kg exhibits a better depleting effect of Tregs compared with controls. In contrast to MAF, the effect of CTX to deplete Tregs is weaker than that of MAF of 2μg/ml, and the toxicity to T cells from CTX was stronger than that of MAF at a similar dose (Supplementary figure 2). Therefore, MAF of 2μg/ml was chosen for further investigation if it can enhance the immunogenicity of GMI-HBVac.
3.3. Immunization of Mafosfamide plus GMI-HBVac break immune tolerance and enhanced the function of DCs (CD11b+CD11c+) in rAAV8-1.3HBV infected mice
Overcoming immune tolerance induced by CHB infection is essential in therapeutic vaccination. Immune tolerance is the main cause of immune anergy, while immune anergy is attributed to APC (mainly DCs and Langerhans cells referred to in this investigation) failing to recognize and present HBV-related antigens. APCs not only participate in the recognition and presentation of HBV-related antigens but also are involved in the activation of T cells and B cells via the costimulatory molecules expressed on DC membrane, including MHC I, MHC II, CD80, and CD86. To examine the adjuvanticity of MAF on DCs, rAAV8-1.3HBV infected mice were immunized with MAF combined with GMI-HBVac. Peripheral blood was collected for FCM analysis on 3rd day after fourth immunization.
The intensity of the DTH reaction is one of the indicators to assess the cellular immunity of antiviral in vivo. Therefore, we determine the intensity of DTH to estimate the antigen (HBsAg)-specific cellular immune response induced by our regimen. DTH reaction (assessed by footpad swelling) was detected after rAAV8-1.3HBV infection was re-
challenged by antigen (HBsAg) in footpads. As depicted in photos (Figure 4B), swelling (assessed by footpad thickness) of rAAV8-1.3HBV infected mice immunized with MAF+GMI-HBVac was thicker than that of mice immunized with GMI-HBVac and controls. The level of DTH was the highest 24 hours after the re-challenge and gradually returned to the pretreatment level after 72 hours, suggesting that robust anti-HBV antigen-specific cellular responses were induced with the MAF+GMI-HBVac in those rAAV8-1.3HBV infected mice. It is also worth noting that the DTH reaction induced by CTX+GMI-HBVac was slightly weaker than that of GMI-HBVac but higher than that of CTX treated alone. These results suggest that either CTX or MAF administration can indeed enhance the cellular immune responses induced by the GMI-HBVac immunization, but the effect associated with the MAF was superior to the CTX. Moreover, Peripheral Blood Mononuclear Cell (PBMC) analysis demonstrated that the regimen of MAF plus GMI-HBVac could remarkedly make a contribution to the availability of immunogenic dendritic cells defined as CD11b+CD11c+ in vivo. After immunization with MAF+GMI-HBVac, the rAAV8-1.3HBV infected mice exhibited higher percentages (4.58%) of DCs compared with the mice administrated with MAF (1.84%) or PBS (0.84%), and that is more than 2.92% of GMI-HBVac and 3.24% of CTX+GMI-HBVac (Figure 4C, Figure 4D). The increased DCs implied that the proliferation and maturation of DC were enhanced by the regimen after immunization. In addition to increased DCs, functional molecules, CD80, expressed on the membranes of DCs were up-regulated simultaneously (Figure 4E). That facilitates the recognition of HBV-related antigens and the activation of subsequent lymphocytes.
3.4. Mafosfamide plus GMI-HBVac induces robust T cells responses and facilitates cytokine secretion in the peripheral immune system
Anti-HBV cellular immunity has been demonstrated as essential to clear persistent HBV infection [22,23,24,25,26]. To gain insight into this potent regimen, we further analyzed several parameters of cellular responses. As previously demonstrated that several vital cytokines secreted by activated T cells are indirectly involved in the clearance of HBV-infected cells [27,28,29,30,31,32,33], the cytokine profiles should be investigated. To examine these relevant cytokines induced by these regimens, serum cytokine assays were performed by ELISA. Results show that when splenocytes from the persistently HBV-infected mice treated with MAF plus GMI-HBVac were re-stimulated in vitro with 10 μg/mL HBsAg, the frequencies of IFN-γ secreting CD8+ T cells were increased to 9.25% sharply when HBV-infected mice immunized with MAF plus GMI-HBVac versus those mice immunized with CTX plus GMI-HBVac up-regulated the level of IFN-γ secreted by CD8+ T cells to 6.07%, which was more than 6.78% of GMI-HBVac immunized mice alone (Figure 5A). Meanwhile, the IFN-γ-producing CD4+ T cells were also up to 7.08% after the HBV-infected mice immunized by MAF+GMI-HBVac, which was more than 3.9% of mice immunized by GMI-HBVac and 6% of mice immunized by CTX+GMI-HBVac (Figure 5B, Figure 5C). It demonstrated that T cells were remarkably enhanced in the periphery blood, particularly in the function of CD8+ T cells. In addition, the level of IL-4 secreting CD4+ T cells were increased to 9.85%, which was higher than 6.25% of mice immunized by GMI-HBVac and 8.5% of CTX+GMI-HBVac (Figure 5D). IL-17-producing CD4+ T cells reach 1.51% after immunization with MAF+GMI-HBVac, compared with 1.45% of GMI-HBVac, and 1.45% of CTX+GMI-HBVac (Supplementary figure 4D).
CD8+ T cell-mediated cytotoxic T lymphocytes (CTL) play a crucial role in specifically targeting and eliminating HBV-infected hepatocytes. To directly determine CTL response mediated by activated CD8+ T cells induced by the regimen in vivo, we employed
in vivo CTL assay by labelling splenocytes with low or high concentrations of CFSE at either 1 μM or 15 μM for target cells after they has been pulsed by HBsAg-derived S208-215 peptide at 1μg/mL as the specific target cells, or by OVA257-264 peptide as a negative control. Eight hours later, cells were identified with intensity changes of CFSE fluorescence by FCM. As attacked target cells losing CFSE fluorescence but the control did not, the percentage of attacks to the target cells was near 60% in the mice treated with MAF+GMI-HBVac, 35% for mice treated with CTX+GMI-HBV and 41.9% for mice treated with GMI-HBVac. In contrast, the killing rate of control mice treated with MAF, CTX, and PBS was less than 10% (Figure 5E). These data indicated that the MAF+GMI-HBVac could robustly enhance the CTL response and should be more effect in the treatment of HBV-infected hepatocytes than the regimen of GMI-HBVac and CTX+GMI-HBVac.
Additionally, antigen-specific proliferation of CD4+T cells and CD8+T cells is important in restoring antiviral cellular immunity. Here we used CFSE staining to analyze CD4+ and CD8+ T cell populations and proliferative capacities after the immunizations. In this experiment, splenocytes of mice were co-stimulated with anti-CD3 plus anti-CD28 in vitro for the positive control, stimulated with PBS for the negative control, and splenocytes of treated mice were stimulated with HBsAg peptide (S208-215). Immunization of MAF and the GMI-HBVac could trigger an expansion of activated/proliferating T cells, which differs from immunizations of other regimens (Figure 5F and 5G). The proliferation ratio of CD4+ T cells was 32% and 40.8% for CD8+ T cells in the mice immunized with GMI-HBVac, whereas the proliferation ratio of CD4+ T cells was 41.7% and 56.2% for CD8+ T cells from mice immunized with MAF plus GMI-HBVac. In comparison, we could achieve an average proliferation 39.1% for CD4+ T cells and 53.3% for CD8+ T cells when we immunized with the CTX+GMI-HBVac or 41.7% for CD4+ T cells and 56.2% for CD8+ T cells with the MAF plus GMI-HBVac. While the level of proliferation from the GMI-HBVac immunizations could reach to 32% for CD4+ T cells and 40.8% for CD8+ T cells. These data revealed that either CTX or MAF combined with the GMI-HBVac can indeed facilitate T cell activations and proliferation.
Spleen tissues were used to perform immunohistochemistry staining with specific anti-CD4 and CD8 antibodies, we observed that there are more enlarged and agglomerate cells in the CHB model mice after immunized with GMI-HBVac and MAF+GMI-HBVac, whereas splenocytes of rAAV8-1.3HBV infected mice administrated with MAF were smaller and arranged densely. The shade of brown spots marked with anti-CD8 was deepened, and the brown zone was up-regulated and denser after mice were immunized with MAF+GMI-HBVac. Besides, these phenotypes were more obvious than that of rAAV8-1.3HBV infected mice immunized with other regimens. When the spleen was stained with anti-CD4 antibodies, the shade of brown spots marked for CD4+ T cells after immunization with MAF+GMI-HBVac had no significant difference compared with controls. It indicated that CD8+ T cells in the spleen had been activated by HBV antigen and proliferated specifically (Supplementary figure 5).
These results demonstrated that better immunotherapeutic effects were achieved significant enhancement not only for the elevated levels of serum IFN-γ, IL-4, and IL-17 but also robust CTL response mediated by CD8+T cells from these rAAV8-1.3HBV infected mice immunized with the MAF+GMI-HBVac accompanied with significantly expansion of CD4+ and CD8+ T cells, comparing to these treated with either CTX+GMI-HBVac or GMI-HBVac. It revealed that the immune function was improved in the peripheral immune system after rAAV8-1.3HBV infected mice immunized with MAF+GMI-HBVac.
3.5. Mafosfamide plus GMI-HBVac promote the infiltration of T cells and enhanced IFN-γ secretion in the liver microenvironment of rAAV8-1.3HBV infected mice
Since the liver is the host organ of HBV infection and reproduction, attracting activated CD8+ T cells infiltrated into liver are in the vanguard of clearance HBV infected hepatocytes. CHB infection shaped the particular liver microenvironment led to anti-HBV immune dysfunction. To further examine the specific immune responses against HBV- infection in liver after the treatments, we analyzed liver T cells, especially IFN-γ expressing CD8+ T cells, by immunohistochemistry assay and immunofluorescence staining. We used red fluorescent labeled antibodies to stain IFN-γ+CD8+ T cells and green fluorescent labeled antibodies to stain HBcAg+ hepatocytes (indication of HBV- infected hepatocyte)
in the liver. As showed in the Figure 6A and 6B, we found that plenty of activated CD4+ T cells and CD8+ T cells were crowded around hepatocytes and liver vacuoles, with a trend of expansion. What was more noteworthy was that rAAV8-1.3HBV infected mice immunized with MAF+GMI-HBVac harbored more infiltrated T cells in the liver than the mice immunized with CTX+GMI-HBVac or GMI-HBVac, especially the CD4+ T cells. Consistent with results of immunohistochemistry assay, datas from immunofluorescence staining (Figure 7A, Figure 7B) illustrated that large numbers of IFN-γ+CD8+ T cells concurrently presented around the HBcAg+ hepatocytes after immunizations with the MAF+GMI-HBVac compared with those immunized with either CTX+GMI-HBVac or GMI-HBVac. Particularly, IFN-γ+CD8+ T cells were zoomed in the zones filled with highly expressing HBcAg+ hepatocytes (Strong green fluorescence regions). This suggests that these anti-HBV and cytolytic IFN-γ+CD8+ T cells were activated and recruited to HBV-infected hepatocytes after immunizations. Additionally, the intensity of red fluorescent in the mice was higher than those immunized with CTX+GMI-HBVac and GMI-HBVac. It implied that the proportion of infiltrated T cells in the liver from mice immunized with MAF+GMI-HBVac were more than mice immunized with CTX+GMI-HBVac and GMI-HBVac.
3.6. Mafosfamide plus GMI-HBVac vaccination contributes to HBsAg seroclearance and HBV-infected hepatocyte clearances in chronic HBV infection
The strength of a therapeutic vaccine's ability to clear hepatitis B antigens reflects its potential for clinical application. The liver, as the primary organ of HBV virus infestation, is also the primary site where therapeutic vaccine function. To further assess the therapeutic effects of these regimens, we collected liver tissues of the rAAV8-1.3HBV infected mice after the last immunization for the analysis with anti-HBsAg and anti-HBcAg (fluorescence labeled antibody for immunofluorescence staining, lack of fluorescence labeled antibody for immunohistochemical analysis). As depicted in Figure 7A and 7B, the HBcAg+ hepatocytes labeled by green fluorescently from infected mice immunized with the MAF+GMI-HBVac was greatly reduced compared with rAAV8-1.3HBV infected mice immunized with GMI-HBVac or CTX+GMI-HBVac. These finding is consistent with the results of immunohistochemical analysis (Figure 8A, 8B) with a substantial eradication of HBcAg+ hepatocytes observed after immunization of MAF+GMI-HBVac compared with others, and the reduction of HBcAg+ hepatocytes in mice immunized with MAF+HBVac was more than that of mice immunized with GMI-HBVac and CTX+GMI-HBVac. It implied that the HBV virus replication and de novo infection could be suppressed by the activated anti-HBV immune responses. Histopathologic examination of liver biopsy samples (Figure 8C) exhibited that cell infiltration, especially lymphocyte infiltration, was facilitated around vacuoles of liver from rAAV8-1.3HBV infected mice immunized with MAF+GMI-HBVac, these infiltrated cells were denser and affect most portal tracts. Concurrently, evacuated and swelled hepatocytes were obviously decreased with small and few vacuoles. Few necroinflammatory and necrotic lesions were found after immunization with MAF+GMI-HBVac, which indicated that the regimen of MAF+GMI-HBVac induced specific anti-HBV immune response with the remission of liver injury.
Serological markers of chronic hepatitis B infection in patients' blood are the key to determining the infection status, particularly the essential hallmark of functional cure in CHB patients is that the level of HBsAg becomes negative and anti-HBsAg antibody becomes positive. In order to further examine the immunotherapeutic effect of MAF+GMI-HBVac on clearance of HBV-related antigens in serum of rAAV8-1.3HBV infected mice after treatment, we collected the blood of the rAAV8-1.3HBV infected mice after each immunization for analysis. We use ELISA kits to determine the HBsAg, HBeAg, and anti-HBsAg, Q-PCR for HBV DNA as well as colorimetric test for ALT. Changes of HBsAb, HBsAg, HBV DNA, and ALT in serum were recorded. As indicated in Figure 9, we found that serum HBsAg of infected mice showed a gradual decline after the second immunization with MAF+GMI-HBVac compared with controls due to the neutralization, which was significantly differentiated from the regimen of CTX+GMI-HBVac and GMI-HBVac, and the reduction of HBsAg expanded with increasing number of immunizations (Figure 9A). while there was only a slight drop of serum HBeAg in the HBV-infected mice immunized by MAF+GMI-HBVac, when it’s compared with controls (Figure 9B). Most importantly, as the main force to neutralize HBsAg, HBsAb was detected in the rAAV8-1.3HBV infected mice after the second immunization with MAF+GMI-HBVac, continued to increase along with the number of immunizations, and peaked after the 4th immunization. Additionally, the duration of HBsAb can be remained for 24 weeks at higher level in those rAAV8-1.3HBV infected mice immunized with the MAF+GMI-HBVac, comparing to that in the mice immunized with other regimens (Figure 9C). However, HBV DNA in serum did not descend significantly compared with the original levels due to active HBV cccDNA after the fourth immunization (Figure 9D). During the treatment, we observed a slight upward trend of serum alanine aminotransferase (ALT) level and reached a maximum after the fourth immunization, and there was no significant difference among these regimens (Figure 9E). In addition, no rebounds were found in either HBsAg or HBcAg after mice immunized with the MAF+GMI-HBVac.
In conclusion, the results from peripheral blood and liver tissue directly confirm that CHB-infected mice immunized with MAF+GMI-HBVac can effectively lead to a break immune tolerance and rebuild immune function in infected mice, which results in an enhanced anti-HBV response. It was verified that the new therapy strategy could not only effectively increase intrahepatic IFN-γ-producing CD8+ T cells and induce HBsAg specific antibodies, but also can clear HBV-related antigens and suppress the replication of HBV infection by inhibiting the up-regulation of HBcAg, HBeAg and HBV DNA.
4. Discussion
Immunocompromised individuals who become infected with HBV are more likely to develop chronic HBV infections and immune tolerance to HBV-related antigens in vivo, both of which can lead to immune tolerance. The barrier that prevents CHB treatment is systemic immune tolerance or exhaustion, both of which are caused by chronic HBV infection. The mechanism by which the host immune system develops immune tolerance to HBV is unknown, but previous research has shown that the number and proportion of immunosuppressive cells, particularly Tregs and MDSCs, are significantly increased in patients with chronic hepatitis B [6,7,34,35]. These enhanced immunosuppressive cells impede the anti-HBV response, specifically CD8+ T cells that produce IFN-γ. They are the most important lymphocytes in the anti-HBV response. To properly treat chronic hepatitis B infection, immunosuppressive cells must be suppressed and the immunological function of immunocytes must be restored. Depletion of Tregs is the most efficient method for releasing immunosuppressive and immunological tolerance with an immunomodulator, highlighting the possibility of a functional cure for chronic hepatitis B infection.
Current treatments (drugs containing nucleosides or nucleotides in conjunction with interferon-α) resulted in delayed and/or decreased rates of liver failure, HCC, and associated comorbidities. To avoid HBV reactivation and hepatic flares, however, their effects are not sustained. Large patient populations necessitate the development of novel therapeutic techniques for HBV infection, which is characterized by sustained off-treatment HBsAg decrease. The distinct liver microenvironment created by persistent infection and changes in HBV-specific immunity must be addressed by innovative methods.
Prior to injection, MAF and CTX were chosen as adjuvants and immunomodulators for the HBV therapeutic vaccine in our investigation, and the appropriate dose and immunization approach were determined. MAF and CTX are both alkylating drugs that have been extensively utilized in clinical oncology. CTX can be metabolized to generate phosphoramide mustard, which drives Tregs to undergo programmed death via DNA crosslinking. Due to its toxicity and stability, it is promptly replaced with less toxic medicines such as MAF. MAF, a CTX derivative, can hydrolyze phosphoramide nitrogen mustard in the absence of an enzyme after being administered into the bloodstream. It enhanced the ability of MAF to cause apoptosis in Tregs. Consequently, immune system suppression was compromised. After daily treatment of 2ug/ml MAF, mice infected with rAAV8-1.3HBV had an effective Treg depletion of greater than 80%, according to our research. Moreover, immunization with MAF+GMI-HBVac enhanced cellular and humoral immunity in rAAV8-1.3HBV-infected mice, particularly the increase in IFN-γ-producing CD8+ T cells. This work shown that immunization with MAF+GMI-HBVac can break immune tolerance and restore a greater anti-HBV response in mice infected with rAAV8-1.3HBV and rAAV8-1.3HBV. Not only did IFN-γ- and IL-17-producing CD8+ T cells and IL-17-producing CD4+ T cells rise, but anti-HBsAg secretion also increased. Fluorescence co-localization and immunohistochemistry analysis of the liver demonstrate that immunization with MAF+GMI-HBVac can effectively promote the recruitment of specifically activated CD4+ T cells and IFN-γ-producing CD8+ T cells around HBV-infected hepatocytes, thereby facilitating the clearance of HBsAg and HBV-infected hepatocytes. In other words, mice infected with rAAV8-1.3HBV that are immunized with the MAF+GMI-HBVac regimen are functionally cured. Together, these results demonstrate that MAF and GMI-HBVac work synergistically to enhance the anti-HBV response, and that immunizations with our novel regimen eradicated HBsAg and other HBV-related antigens. Moreover, the therapeutic efficacy of MAF+GMI-HBVac is superior to that of CTX+GMI-HBVac and GMI-HBVac. In conclusion, our investigation revealed that the substantial anti-HBV responses induced by MAF+GMI-HBVac in rAAV8-1.3HBV-infected mice had wider applicability. It suggests that the MAF+GMI-HBVac regimen may make a functional cure for CHB individuals possible in the future.
Figure 10.
Mechanism of regimen performs in CHB individual.
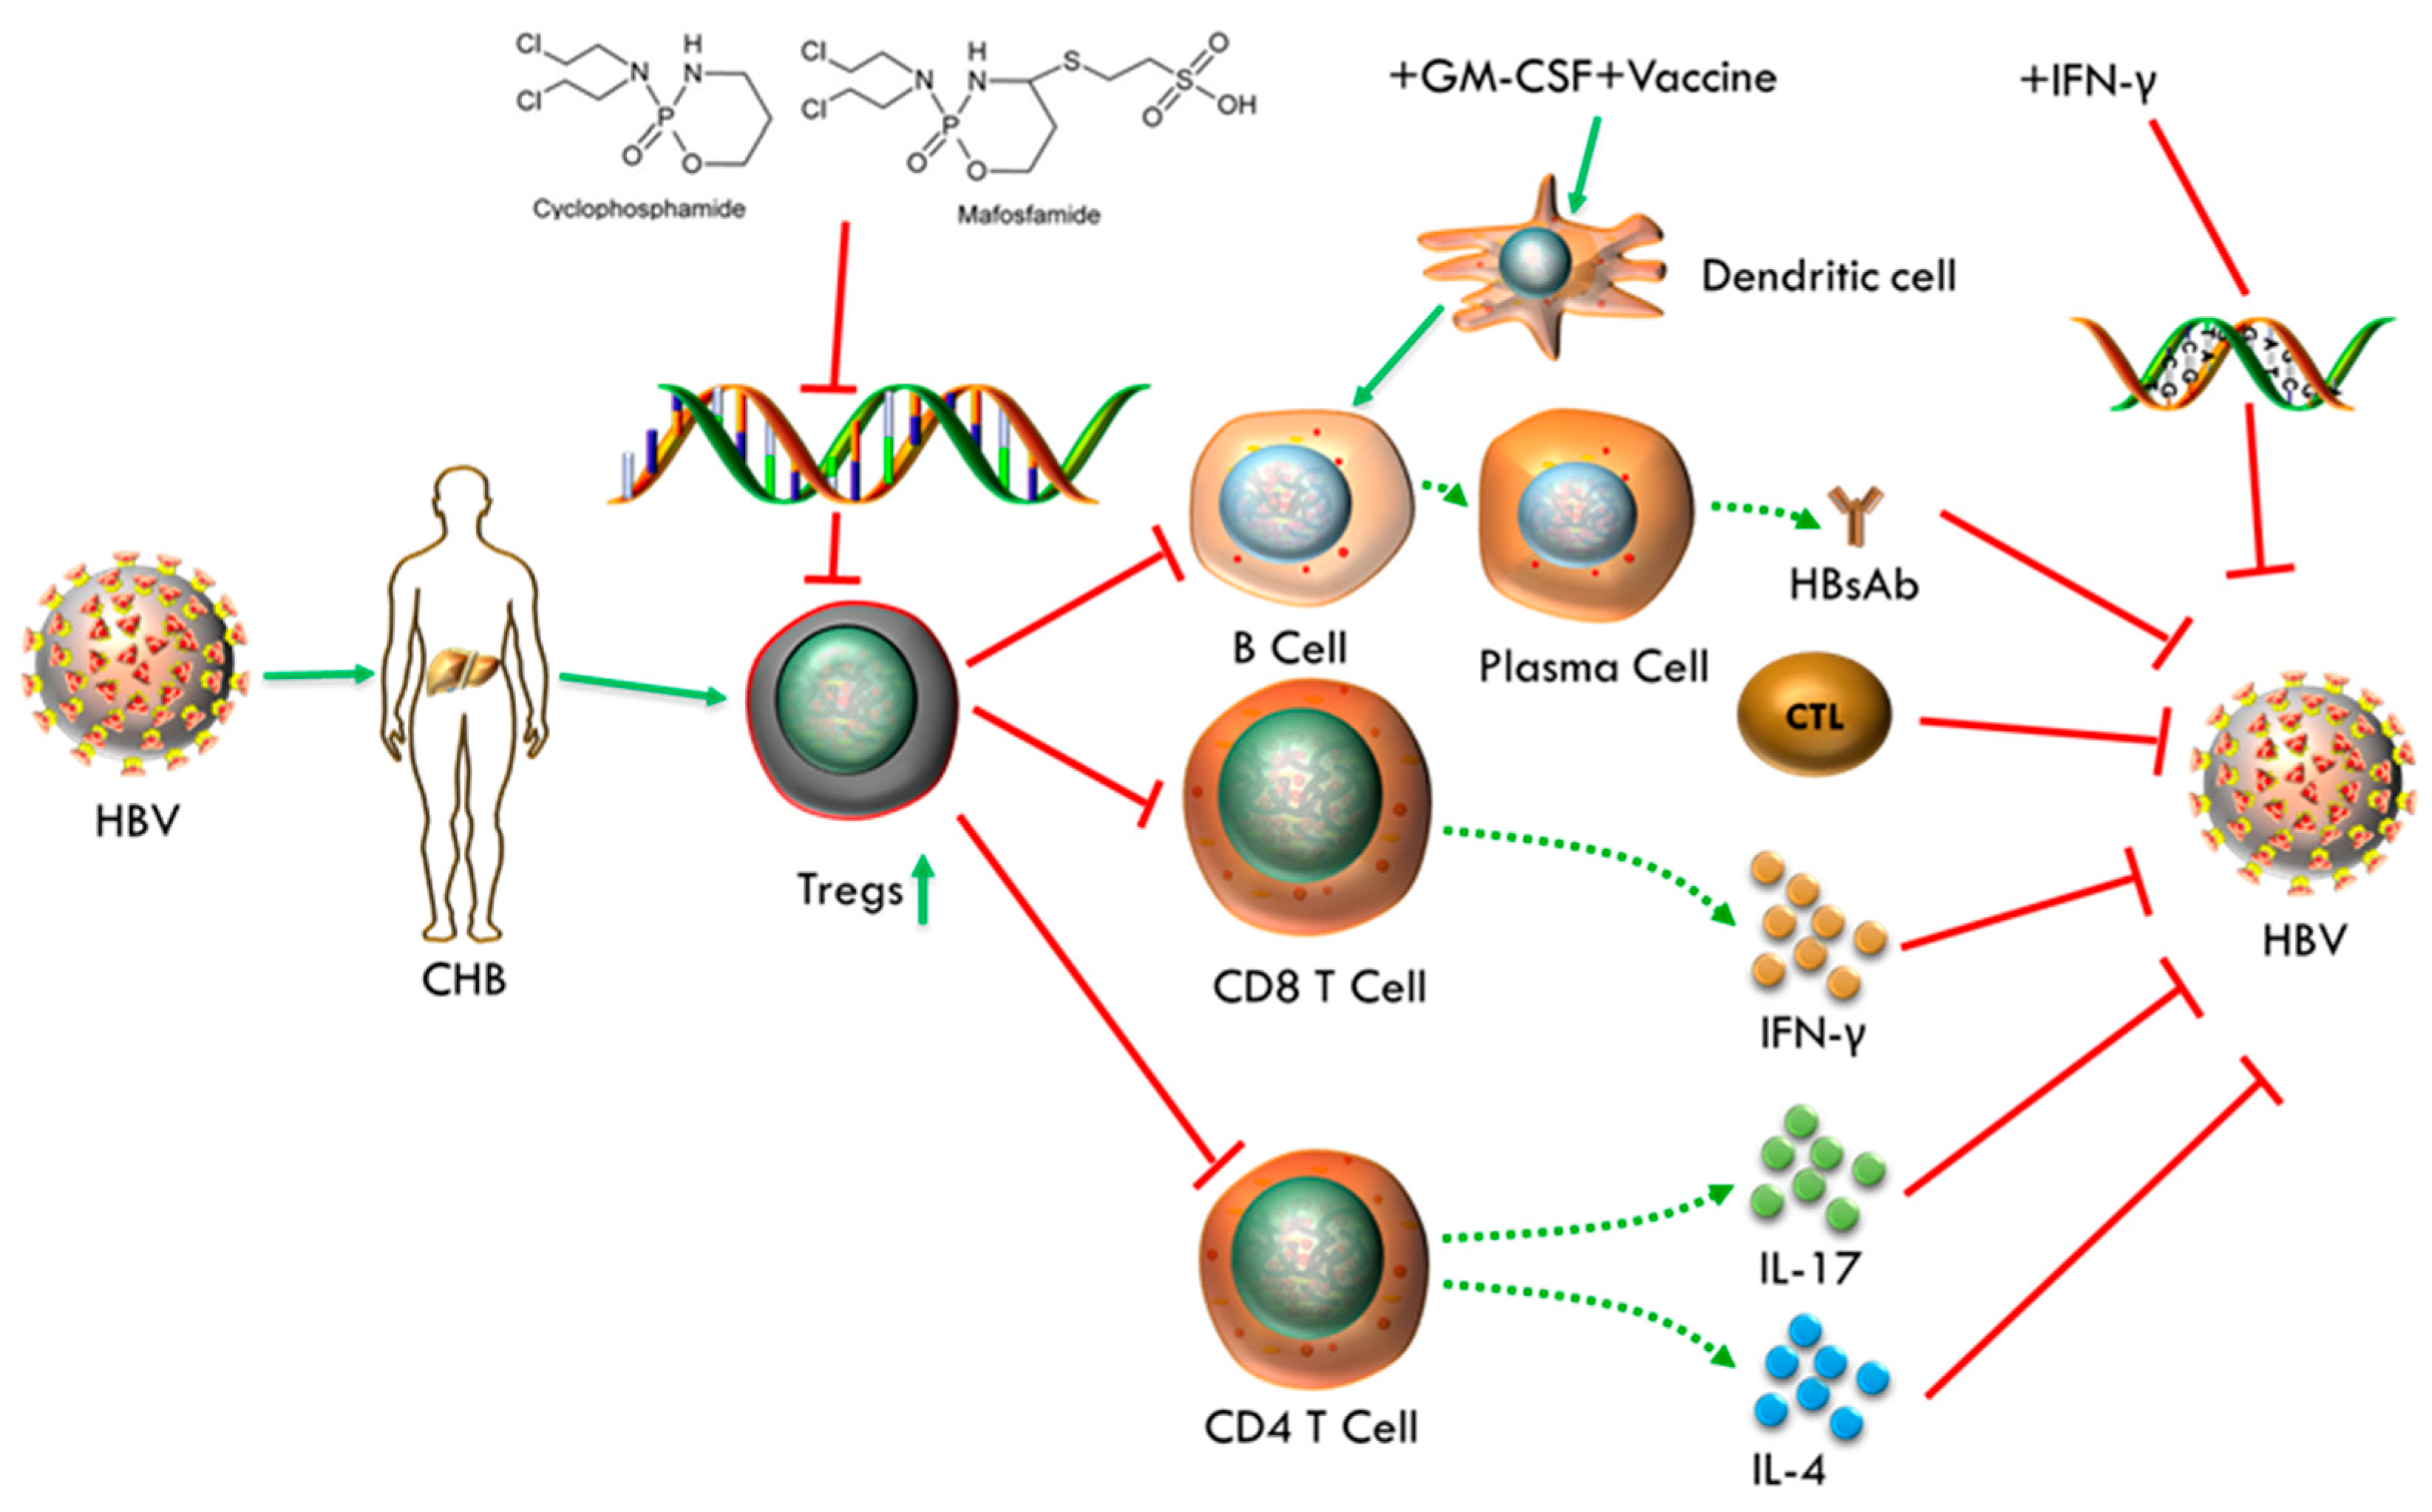
The involved mechanisms, that underlie the benefits of our therapeutic strategy, may be includes following facts. MAF acts as an adjuvant and immunomodulator to remove excess Treg induced by chronic HBV infection, which results in relieving immunosuppression and breaking immune tolerance. Then DCs activated by GM-CSF potentiate the recognition and presentation of HBV antigens, and HBV vaccine was responsible for antibody induction. In addition, IFN-γ was involved in inhibiting HBV DNA replication and enhancing antiviral immune response. They work synergistically to strengthen the anti-HBV response and make the goal of functional cure for CHB infection achievable. Despite the fact that levels of HBV DNA have not a remarkable drop due to the limited duration of IFN-α and failure of destroying the HBV cccDNA and integrated DNA, the increasing trend of serum HBV DNA was interrupted to avoid further deterioration after treatment. In order to cure CHB infection completely, we need to further design therapeutic methods targeted for HBV cccDNA and integrated DNA, including the combined use of gene silencing technology (RNAi) or crisper cas9 technology.
Supplementary Materials
The following supporting information can be downloaded at: Preprints.org.
Author Contributions
Conceptualization and Experimental designs and interpretations: B.W.; Experimental performances, Data Analysis, Interpretation, and Manuscript Writing: Q.L.; Manuscript Editing: B.W. and Y.Z.; Funding Acquisition: B.W. and Y. Z. All authors have read and agreed to the published version of the manuscript.
Funding
The project leading to these results has received funding from the Chinese National Natural Science Foundation (81991492 and 82041039), partly supported by a grant from the major project of Study on Pathogenesis and Epidemic Prevention Technology System (2021YFC2302500) by the Ministry of Science and Technology of China and Project supported by Shanghai Municipal Science and Technology Major Project (ZD2021CY001) to B.W and Y.Z.
Institutional Review Board Statement
The study was conducted according to the guidelines of the Institutional Animal Care and Use Committee of Fudan University in China. All animal experiments were approved by the Committee of Experimental Animals of SHMC with protocol number 20201116-001.
Data Availability Statement
Data sharing will be available on request.
Acknowledgments
We would like to thank W.D.Z., G.Z, S.R.Z., S.S.Z, C.X.S. at Fudan University for providing the indispensable assistance on experiments. Additionally, we thank S.H.S. at Fudan University for FACS service. We also thank B.L. of IPS, China North Pharmaceutical Group, Huashan Hospital and Huaqiao Hospital providing the experimental materials.
Conflicts of Interest
The authors declare no conflict of interest.
References
- Lok, A.S.; McMahon, B.J. Chronic hepatitis B. Hepatology 2001, 34, 1225–1241. [Google Scholar] [CrossRef] [PubMed]
- WHO| Hepatitis, B. 2021. Available online: https://www.who.int/en/news-room/fact-sheets/detail/hepatitis-b.
- Mills, KH. Regulatory T cells: friend or foe in immunity to infection? Nat Rev Immunol 2004; 4:841-855.
- Liyanage, U.K.; Moore, T.T.; Joo, H.-G.; Tanaka, Y.; Herrmann, V.; Doherty, G.; Drebin, J.A.; Strasberg, S.M.; Eberlein, T.J.; Goedegebuure, P.S.; et al. Prevalence of Regulatory T Cells Is Increased in Peripheral Blood and Tumor Microenvironment of Patients with Pancreas or Breast Adenocarcinoma. J. Immunol. 2002, 169, 2756–2761. [Google Scholar] [CrossRef] [PubMed]
- Woo, E.Y.; Chu, C.S.; Goletz, T.J.; Schlienger, K.; Yeh, H.; Coukos, G.; Rubin, S.C.; Kaiser, L.R.; June, C.H. Regulatory CD4(+)CD25(+) T cells in tumors from patients with early-stage non-small cell lung cancer and late-stage ovarian cancer. . 2001, 61, 4766–4772. [Google Scholar] [PubMed]
- Stoop, J.N.; van der Molen, R.G.; Baan, C.C.; van der Laan, L.J.W.; Kuipers, E.J.; Kusters, J.G.; Janssen, H.L.A. Regulatory T cells contribute to the impaired immune response in patients with chronic hepatitis B virus infection. J. Hepatol. 2005, 41, 771–778. [Google Scholar] [CrossRef]
- Guoping Peng, Shuping Li, Wei Wu, et al. Circulating CD4+ CD25+ regulatory T cells correlate with chronic hepatitis B infection. Immunology. 2008, 123, 57–65.
- Shimizu, J.; Yamazaki, S.; Sakaguchi, S. Induction of Tumor Immunity by Removing CD25+CD4+ T Cells: A Common Basis Between Tumor Immunity and Autoimmunity. J. Immunol. 1999, 163, 5211–5218. [Google Scholar] [CrossRef]
- Sutmuller RP, van Duivenvoorde LM, van Elsas A, et al. Synergism of cytotoxic T lymphocyte associated antigen 4 blockade and depletion of CD25+regulatory T cells in antitumor therapy reveals alternative pathways for suppression of autoreactive cytotoxic T lymphocyte responses. J Exp Med. 2001; 194:823-832.
- Motoyoshi, Y.; Kaminoda, K.; Saitoh, O.; Hamasaki, K.; Nakao, K.; Ishii, N.; Nagayama, Y.; Eguchi, K. Different mechanisms for anti-tumor effects of low- and high-dose cyclophosphamide. Oncol. Rep. 2006, 16, 141–146. [Google Scholar] [CrossRef]
- Emadi, A.; Jones, R.J.; Brodsky, R.A. Cyclophosphamide and cancer: golden anniversary. Nat. Rev. Clin. Oncol. 2009, 6, 638–647. [Google Scholar] [CrossRef] [PubMed]
- Sistigu, A.; Viaud, S.; Chaput, N.; Bracci, L.; Proietti, E.; Zitvogel, L. Immunomodulatory effects of cyclophosphamide and implementations for vaccine design. Semin. Immunopathol. 2011, 33, 369–383. [Google Scholar] [CrossRef]
- Joy, M.S.; La, M.; Wang, J.; Bridges, A.S.; Hu, Y.; Hogan, S.L.; Frye, R.F.; Blaisdell, J.; Goldstein, J.A.; Dooley, M.A.; et al. Cyclophosphamide and 4-hydroxycyclophosphamide pharmacokinetics in patients with glomerulonephritis secondary to lupus and small vessel vasculitis. Br. J. Clin. Pharmacol. 2012, 74, 445–455. [Google Scholar] [CrossRef]
- Goldstein, M.; Roos, W.P.; Kaina, B. Apoptotic death induced by the cyclophosphamide analogue mafosfamide in human lymphoblastoid cells: Contribution of DNA replication, transcription inhibition and Chk/p53 signaling. Toxicol. Appl. Pharmacol. 2008, 229, 20–32. [Google Scholar] [CrossRef] [PubMed]
- Julie Helft, Jan Bottcher, Probir Chakravarty et al. GM-CSF Mouse Bone Marrow Cultures Comprise a Heterogeneous Population of CD11c+MHC II+ Macrophages and Dendritic Cells. Immunity. 2015, 42, 1197–1211.
- Becher, B.; Tugues, S.; Greter, M. GM-CSF: From Growth Factor to Central Mediator of Tissue Inflammation. Immunity 2016, 45, 963–973. [Google Scholar] [CrossRef]
- Zhan, Y.; Xu, Y.; Lew, A.M. The regulation of the development and function of dendritic cell subsets by GM-CSF: More than a hematopoietic growth factor. Mol. Immunol. 2012, 52, 30–37. [Google Scholar] [CrossRef]
- Lucifora, J.; Xia, Y.; Reisinger, F.; Zhang, K.; Stadler, D.; Cheng, X.; Sprinzl, M.F.; Koppensteiner, H.; Makowska, Z.; Volz, T.; et al. Specific and Nonhepatotoxic Degradation of Nuclear Hepatitis B Virus cccDNA. Science 2014, 343, 1221–1228. [Google Scholar] [CrossRef] [PubMed]
- K Gibbert, JF Schlaak, D Yang et al. , IFN-a subtypes: distinct biological activities in antiviral therapy. Br J Pharmacol. 2013, 168, 1048–1058.
- Zhao, W.; Zhao, G.; Zhang, S.; Wang, X.; Yu, X.; Wang, B. Clearance of HBeAg and HBsAg of HBV in mice model by a recombinant HBV vaccine combined with GM-CSF and IFN-α as an effective therapeutic vaccine adjuvant. Oncotarget 2018, 9, 34213–34228. [Google Scholar] [CrossRef]
- Xianzheng Wang, Aihua Dong, Jingjing Xiao et al. , Overcoming HBV immune tolerance to eliminate HBsAg-positive hepatocytes via pre-administration of GM-CSF as a novel adjuvant for a hepatitis B vaccine in HBV transgenic mice. Cell Mol Immunol. 2016, 13, 850–861.
- Margherita Coccia, Catherine Collignon, Caroline Hervé et al. Cellular and molecular synergy in AS01-adjuvanted vaccines results in an early IFN-γ response promoting vaccine immunogenicity. Nature partner journals Vaccines, (2017) 2:25.
- Li, H.-J.; Zhai, N.-C.; Song, H.-X.; Yang, Y.; Cui, A.; Li, T.-Y.; Tu, Z.-K. The Role of Immune Cells in Chronic HBV Infection. J. Clin. Transl. Hepatol. 2015, 3, 277–283. [Google Scholar] [CrossRef]
- Guidotti, L.G.; Inverso, D.; Sironi, L.; Di Lucia, P.; Fioravanti, J.; Ganzer, L.; Fiocchi, A.; Vacca, M.; Aiolfi, R.; Sammicheli, S.; et al. Immunosurveillance of the Liver by Intravascular Effector CD8 + T Cells. Cell 2015, 161, 486–500. [Google Scholar] [CrossRef]
- Isogawa, M.; Furuichi, Y.; Chisari, F.V. Oscillating CD8+ T Cell Effector Functions after Antigen Recognition in the Liver. Immunity 2005, 23, 53–63. [Google Scholar] [CrossRef] [PubMed]
- Guidotti, L.G.; Ishikawa, T.; Hobbs, M.V.; Matzke, B.; Schreiber, R.; Chisari, F.V. Intracellular Inactivation of the Hepatitis B Virus by Cytotoxic T Lymphocytes. Immunity 1996, 4, 25–36. [Google Scholar] [CrossRef] [PubMed]
- K Gibbert, JF Schlaak, D Yang and U Dittmer, IFN-a subtypes: distinct biological activities in antiviral therapy. British Journal of Pharmacology, 2013, 168, 1048–1058. [CrossRef] [PubMed]
- Caterina Lapenta, Stefano M. Santini, Massimo Spada et al. IFN-a-conditioned dendritic cells are highly efficient in inducing cross-priming CD8+ T cells against exogenous viral antigens. Eur. J. Immunol. 2006. 36: 2046-2060.
- Jianjun Gao, Lewis Zhichang Shi, Hao Zhao et al. Loss of IFN-gama Pathway Genes in Tumor Cells as a Mechanism of Resistance to Anti-CTLA-4 Therapy. 2016, Cell 167, 397-404.
- McClary, H.; Koch, R.; Chisari, F.V.; Guidotti, L.G. Relative Sensitivity of Hepatitis B Virus and Other Hepatotropic Viruses to the Antiviral Effects of Cytokines. J. Virol. 2000, 74, 2255–2264. [Google Scholar] [CrossRef] [PubMed]
- Watashi, K.; Liang, G.; Iwamoto, M.; Marusawa, H.; Uchida, N.; Daito, T.; Kitamura, K.; Muramatsu, M.; Ohashi, H.; Kiyohara, T.; et al. Interleukin-1 and Tumor Necrosis Factor-α Trigger Restriction of Hepatitis B Virus Infection via a Cytidine Deaminase Activation-induced Cytidine Deaminase (AID). J. Biol. Chem. 2013, 288, 31715–31727. [Google Scholar] [CrossRef] [PubMed]
- Puro, R.; Schneider, R.J. Tumor Necrosis Factor Activates a Conserved Innate Antiviral Response to Hepatitis B Virus That Destabilizes Nucleocapsids and Reduces Nuclear Viral DNA. J. Virol. 2007, 81, 7351–7362. [Google Scholar] [CrossRef] [PubMed]
- Sakaguchi, S.; Sakaguchi, N.; Asano, M.; Itoh, M.; Toda, M. Immunologic self-tolerance maintained by activated T cells expressing IL-2 receptor alpha-chains (CD25). Breakdown of a single mechanism of self-tolerance causes various autoimmune diseases. J. Immunol. 1995, 155, 1151–1164. [Google Scholar] [CrossRef] [PubMed]
- Zhong Fang, Jin Li, Xiaoyu Yu et al. Polarization of Monocytic Myeloid-Derived Suppressor Cells by Hepatitis B Surface Antigen Is Mediated via ERK/IL-6/STAT3 Signaling Feedback and Restrains the Activation of T Cells in Chronic Hepatitis B Virus Infection. J Immunol. 2015, 195, 4873–4883.
- Ornella Franzese, Patrick T F Kennedy, Adam J Gehring et al. Polarization of Monocytic Myeloid-Derived Suppressor Cells by Hepatitis B Surface Antigen Is Mediated via ERK/IL-6/STAT3 Signaling Feedback and Restrains the Activation of T Cells in Chronic Hepatitis B Virus Infection. J Virol. 2005, 79, 3322–3328.
Figure 1.
Production and verification of mice infected with rAAV8-1.3HBV. (A) Production and confirmation of CHB mice using rAAV8-1.3HBV. (B) Levels of CD4+CD25+Foxp3+ Tregs from the peripheral blood of mice infected with rAAV8-1.3HBV were compared to Tregs from healthy mice. (C) Liver sections were stained with H&E, anti-HBsAg, and anti-HBcAg-FITC, respectively. (D) Serum levels of HBsAg, HBeAg, ALT, and HBV DNA were evaluated using ELISA and qPCR in mice that had been infected with rAAV8-1.3HBV as well as animals that were healthy.
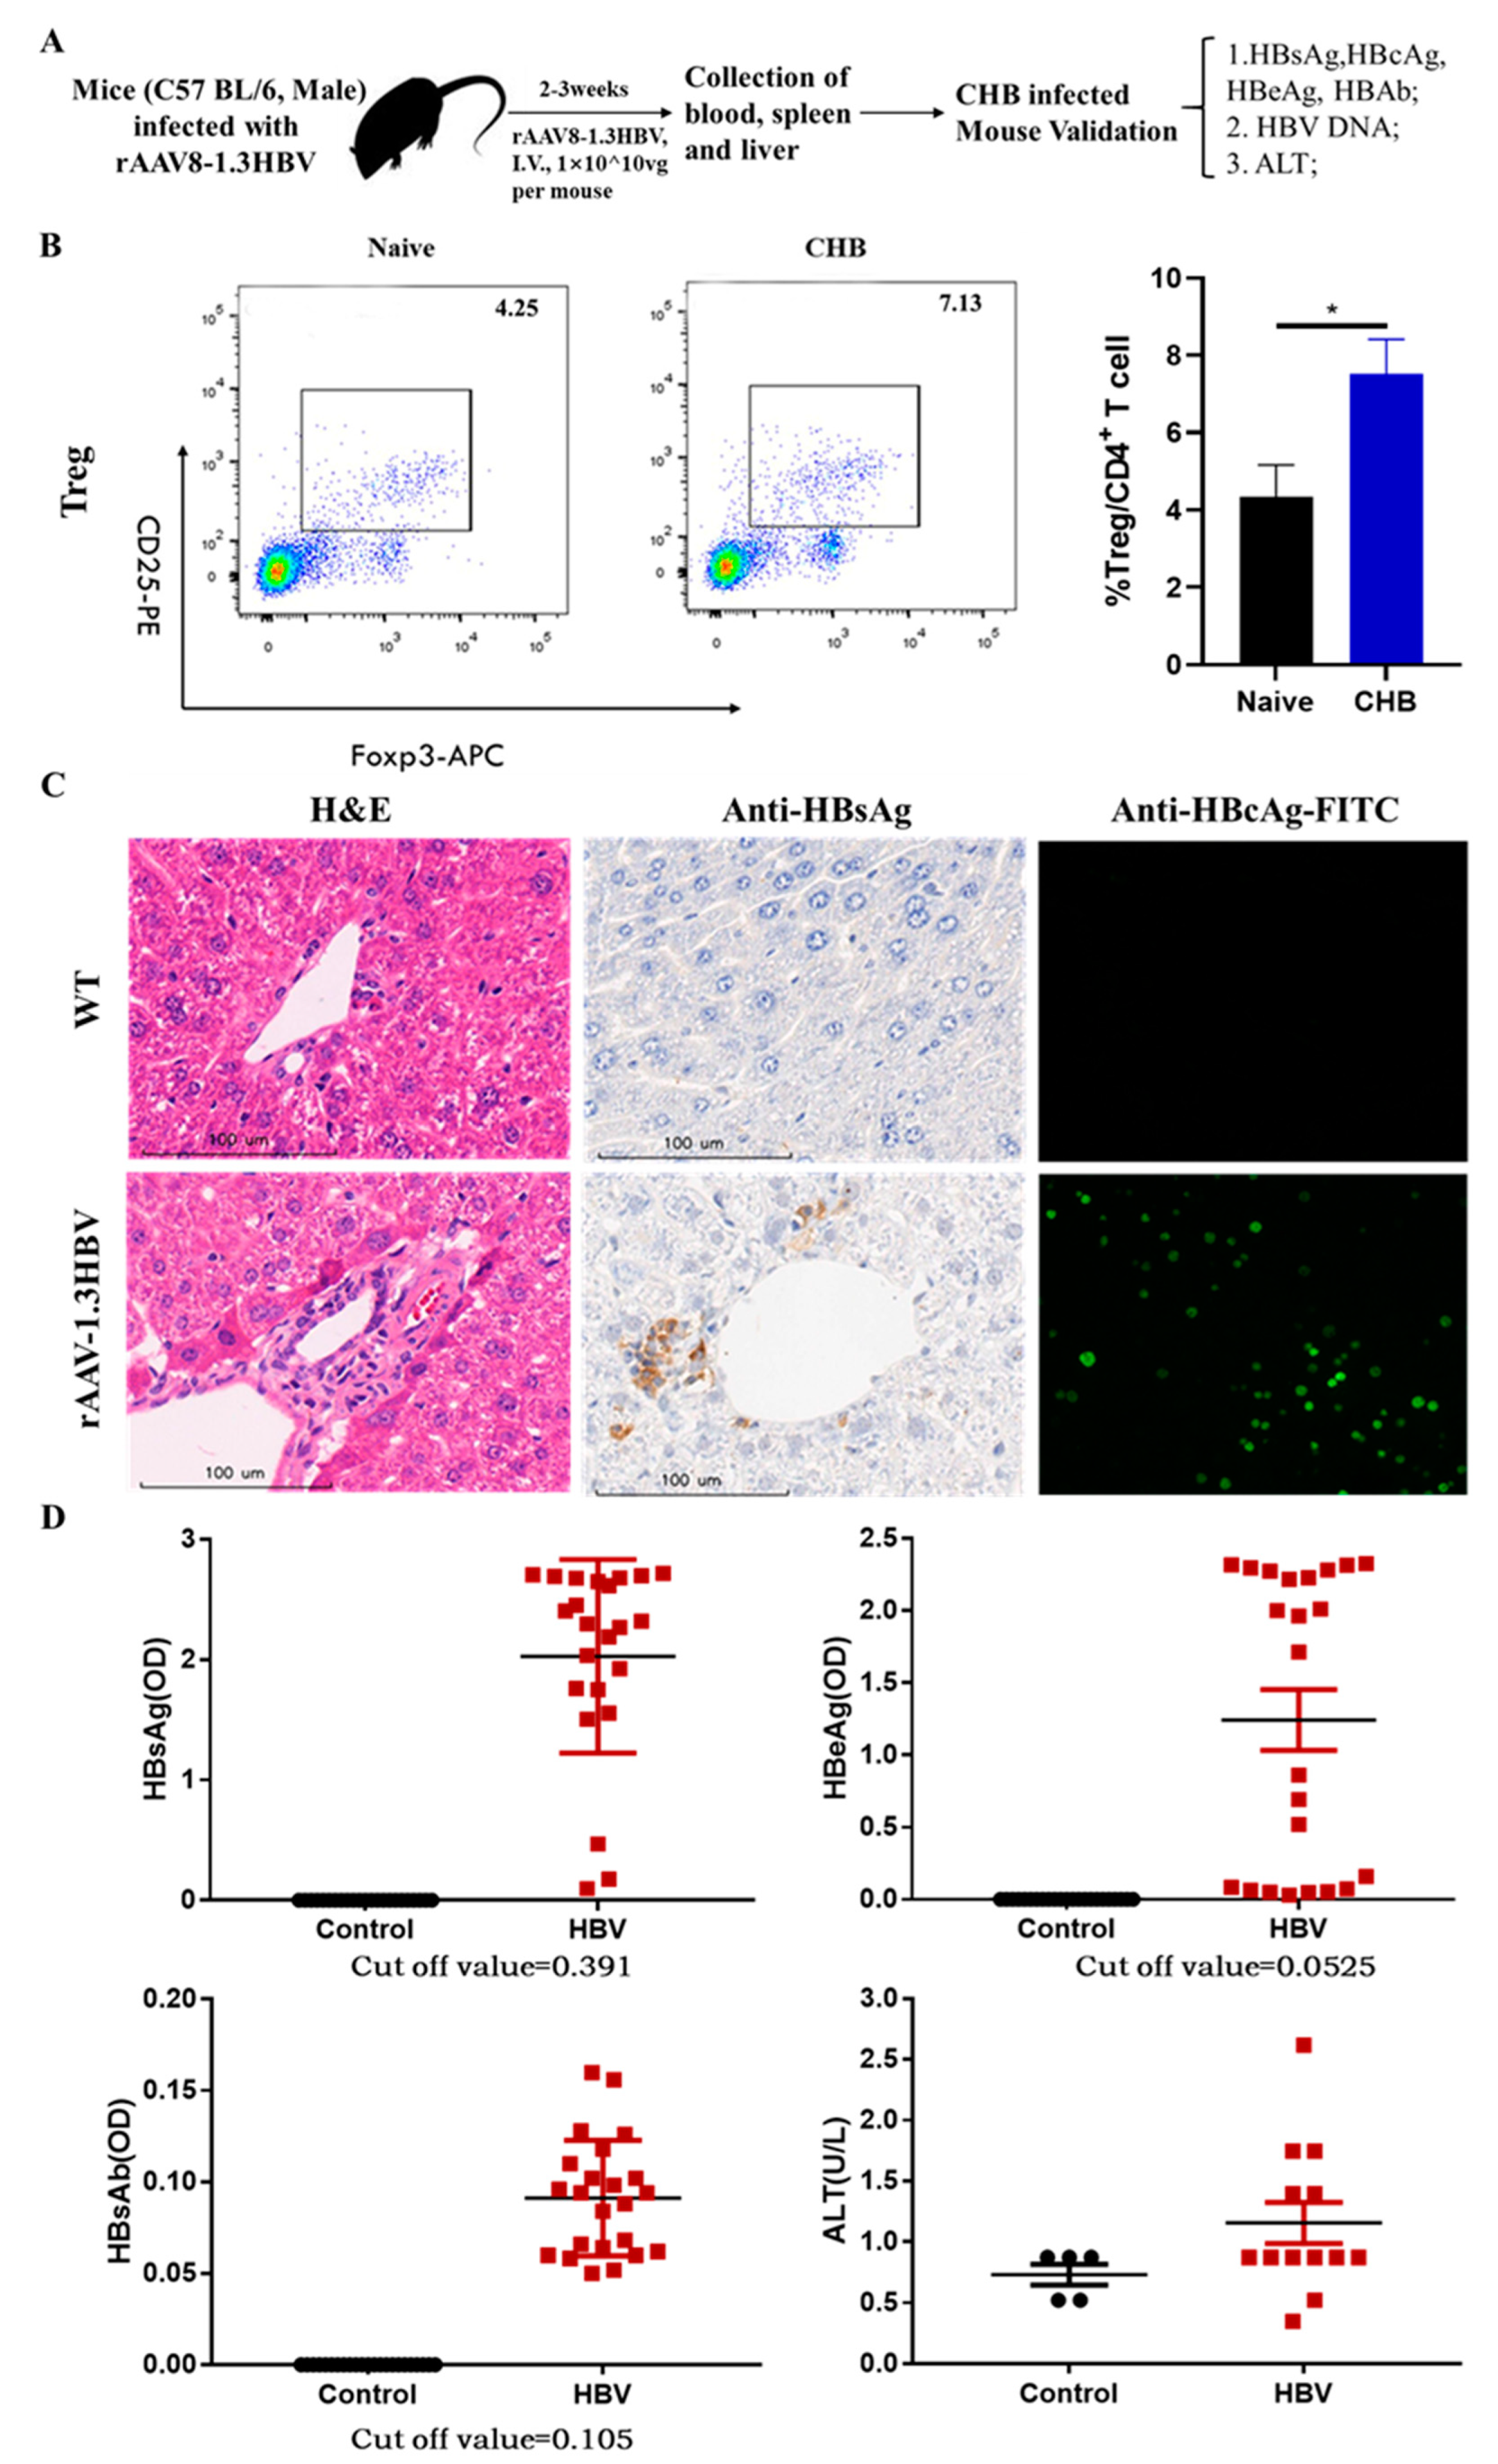
Figure 2.
Determine the optimal MAF concentration for use as an adjuvant. The regimens were administered according to the scheme, and blood samples were taken at regular intervals (every two days). (B) The data collected from the FCM were analyzed using FlowJo-V10.
Figure 2.
Determine the optimal MAF concentration for use as an adjuvant. The regimens were administered according to the scheme, and blood samples were taken at regular intervals (every two days). (B) The data collected from the FCM were analyzed using FlowJo-V10.
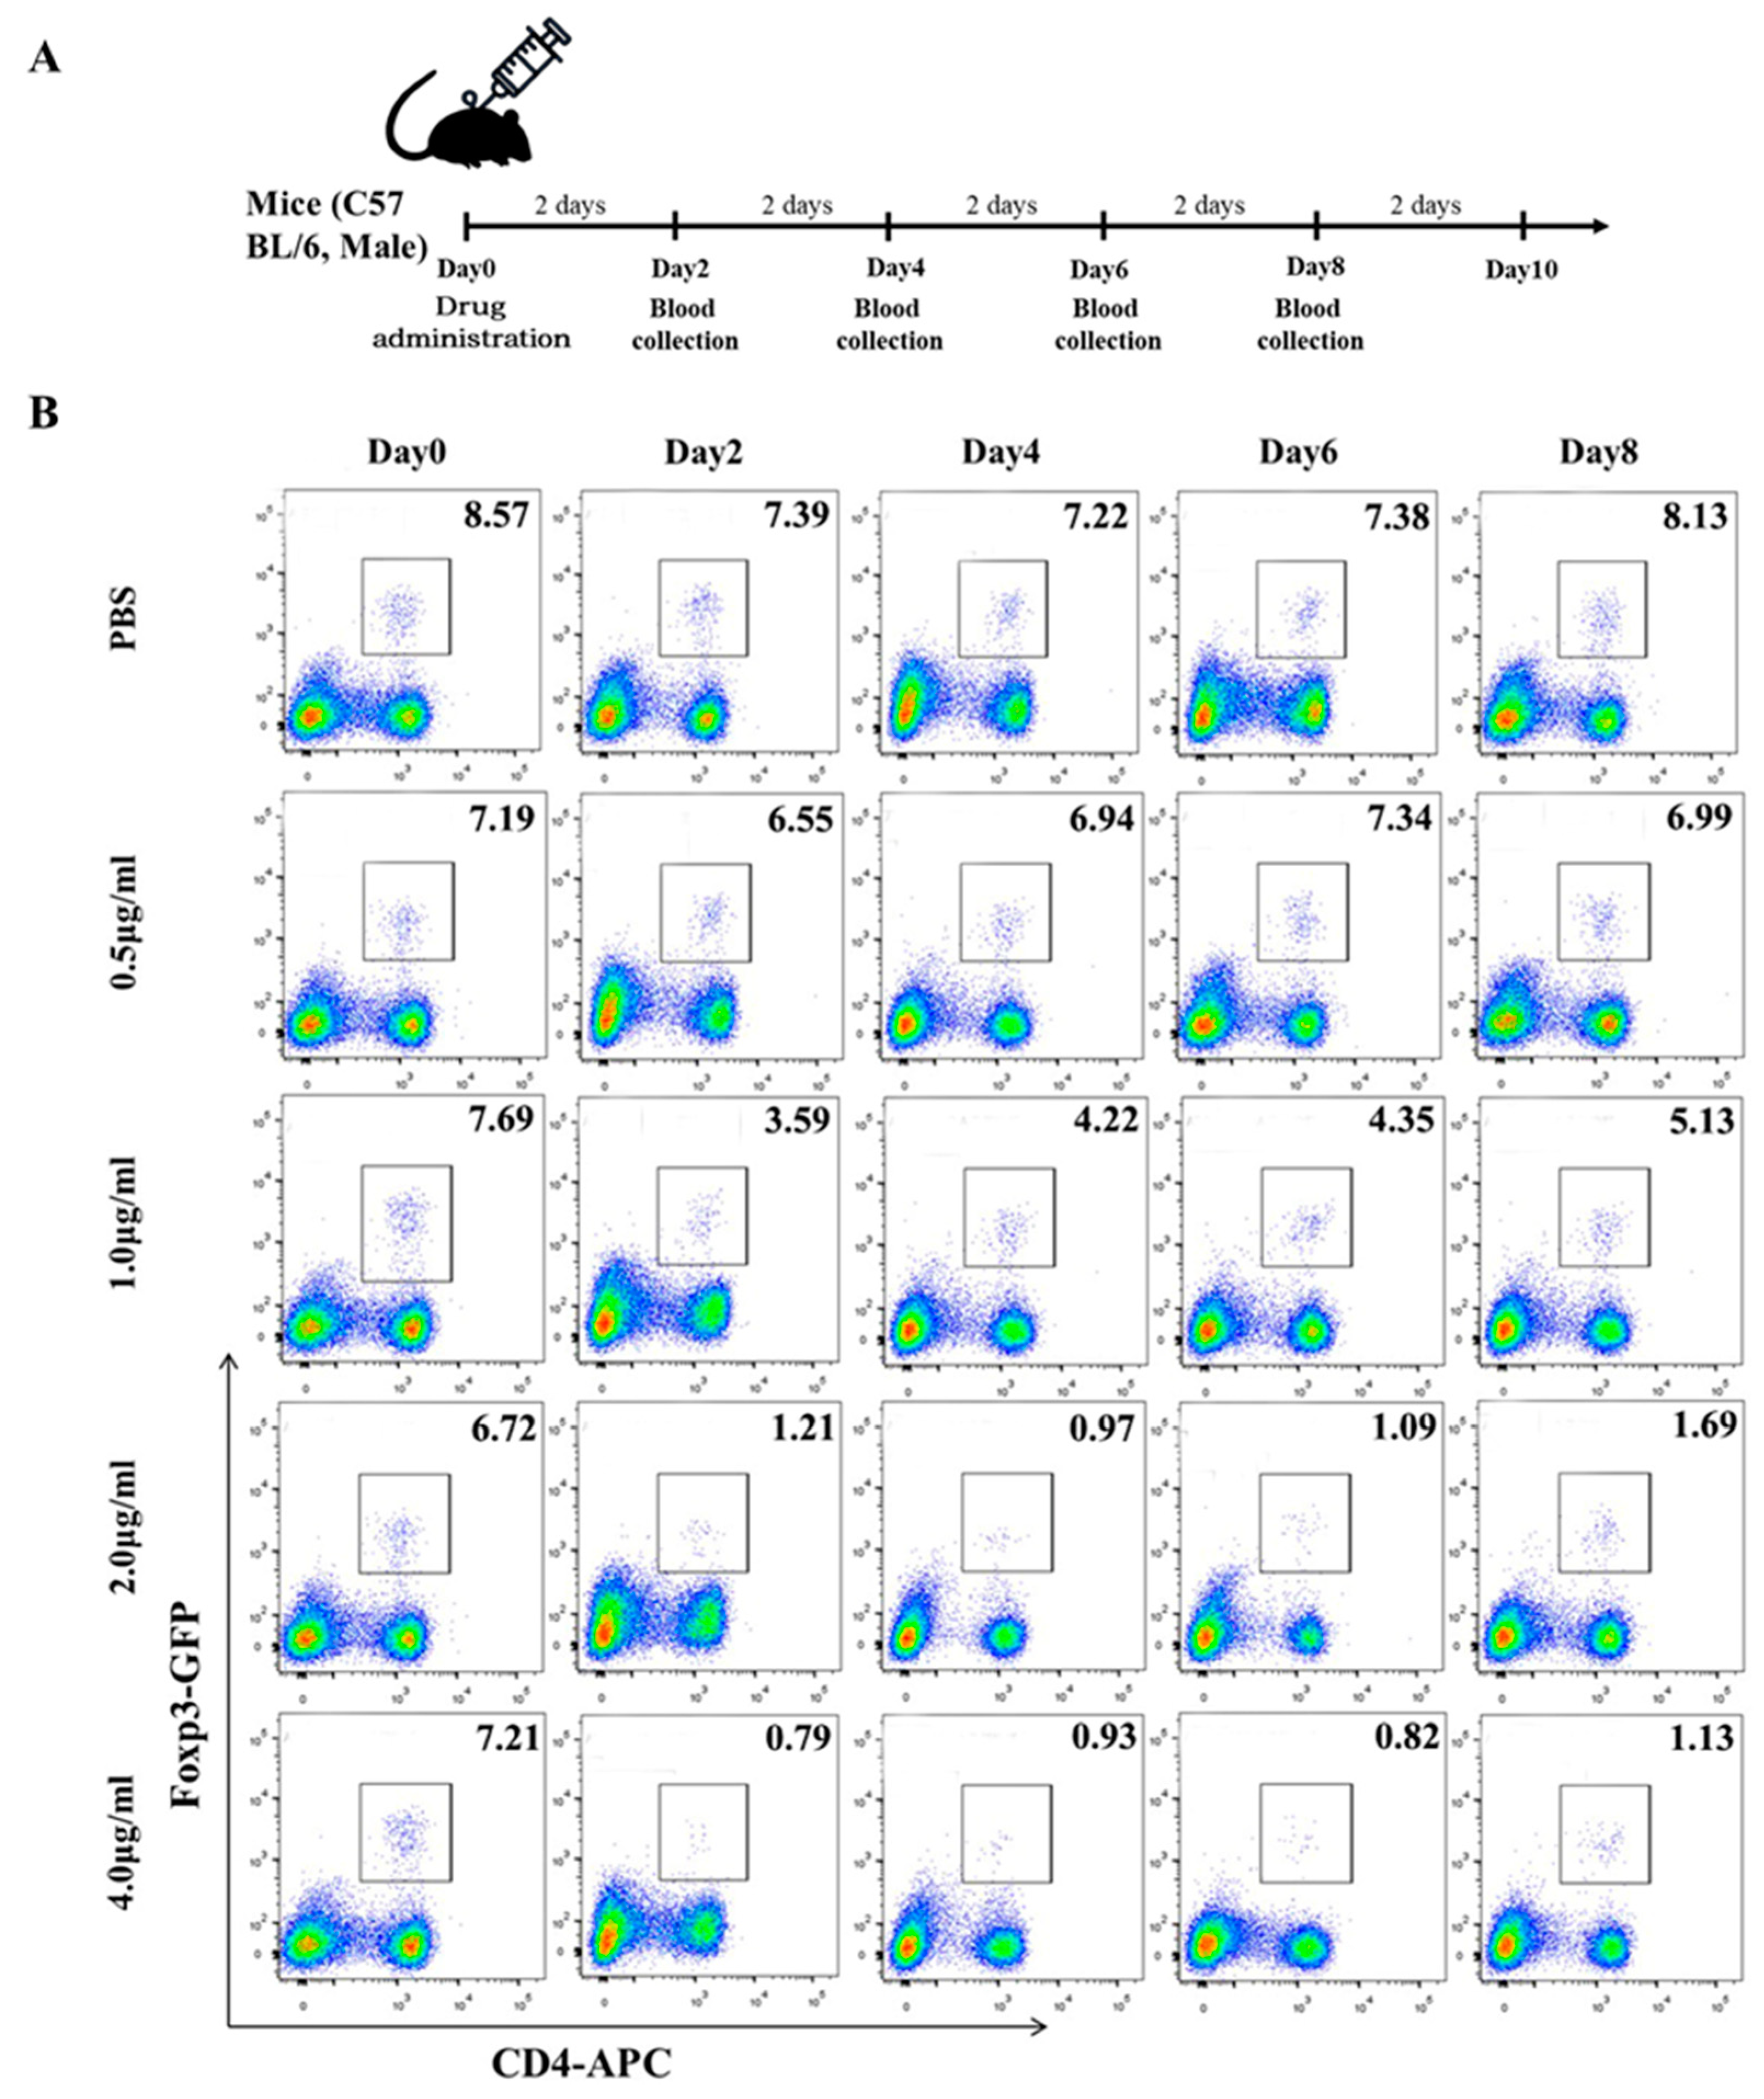
Figure 3.
Determine the optimal MAF concentration for use as an adjuvant. (A) the difference in the percentage of Tregs that were present before and after the injection of MAF at each dose (B) Treg percentage changes following the injection of MAF at 2 ug/ml. (C) a graph displaying the general trend of the mice's weight after MAF was given. (D) the difference in weight between mice before and after the administration of MAF.
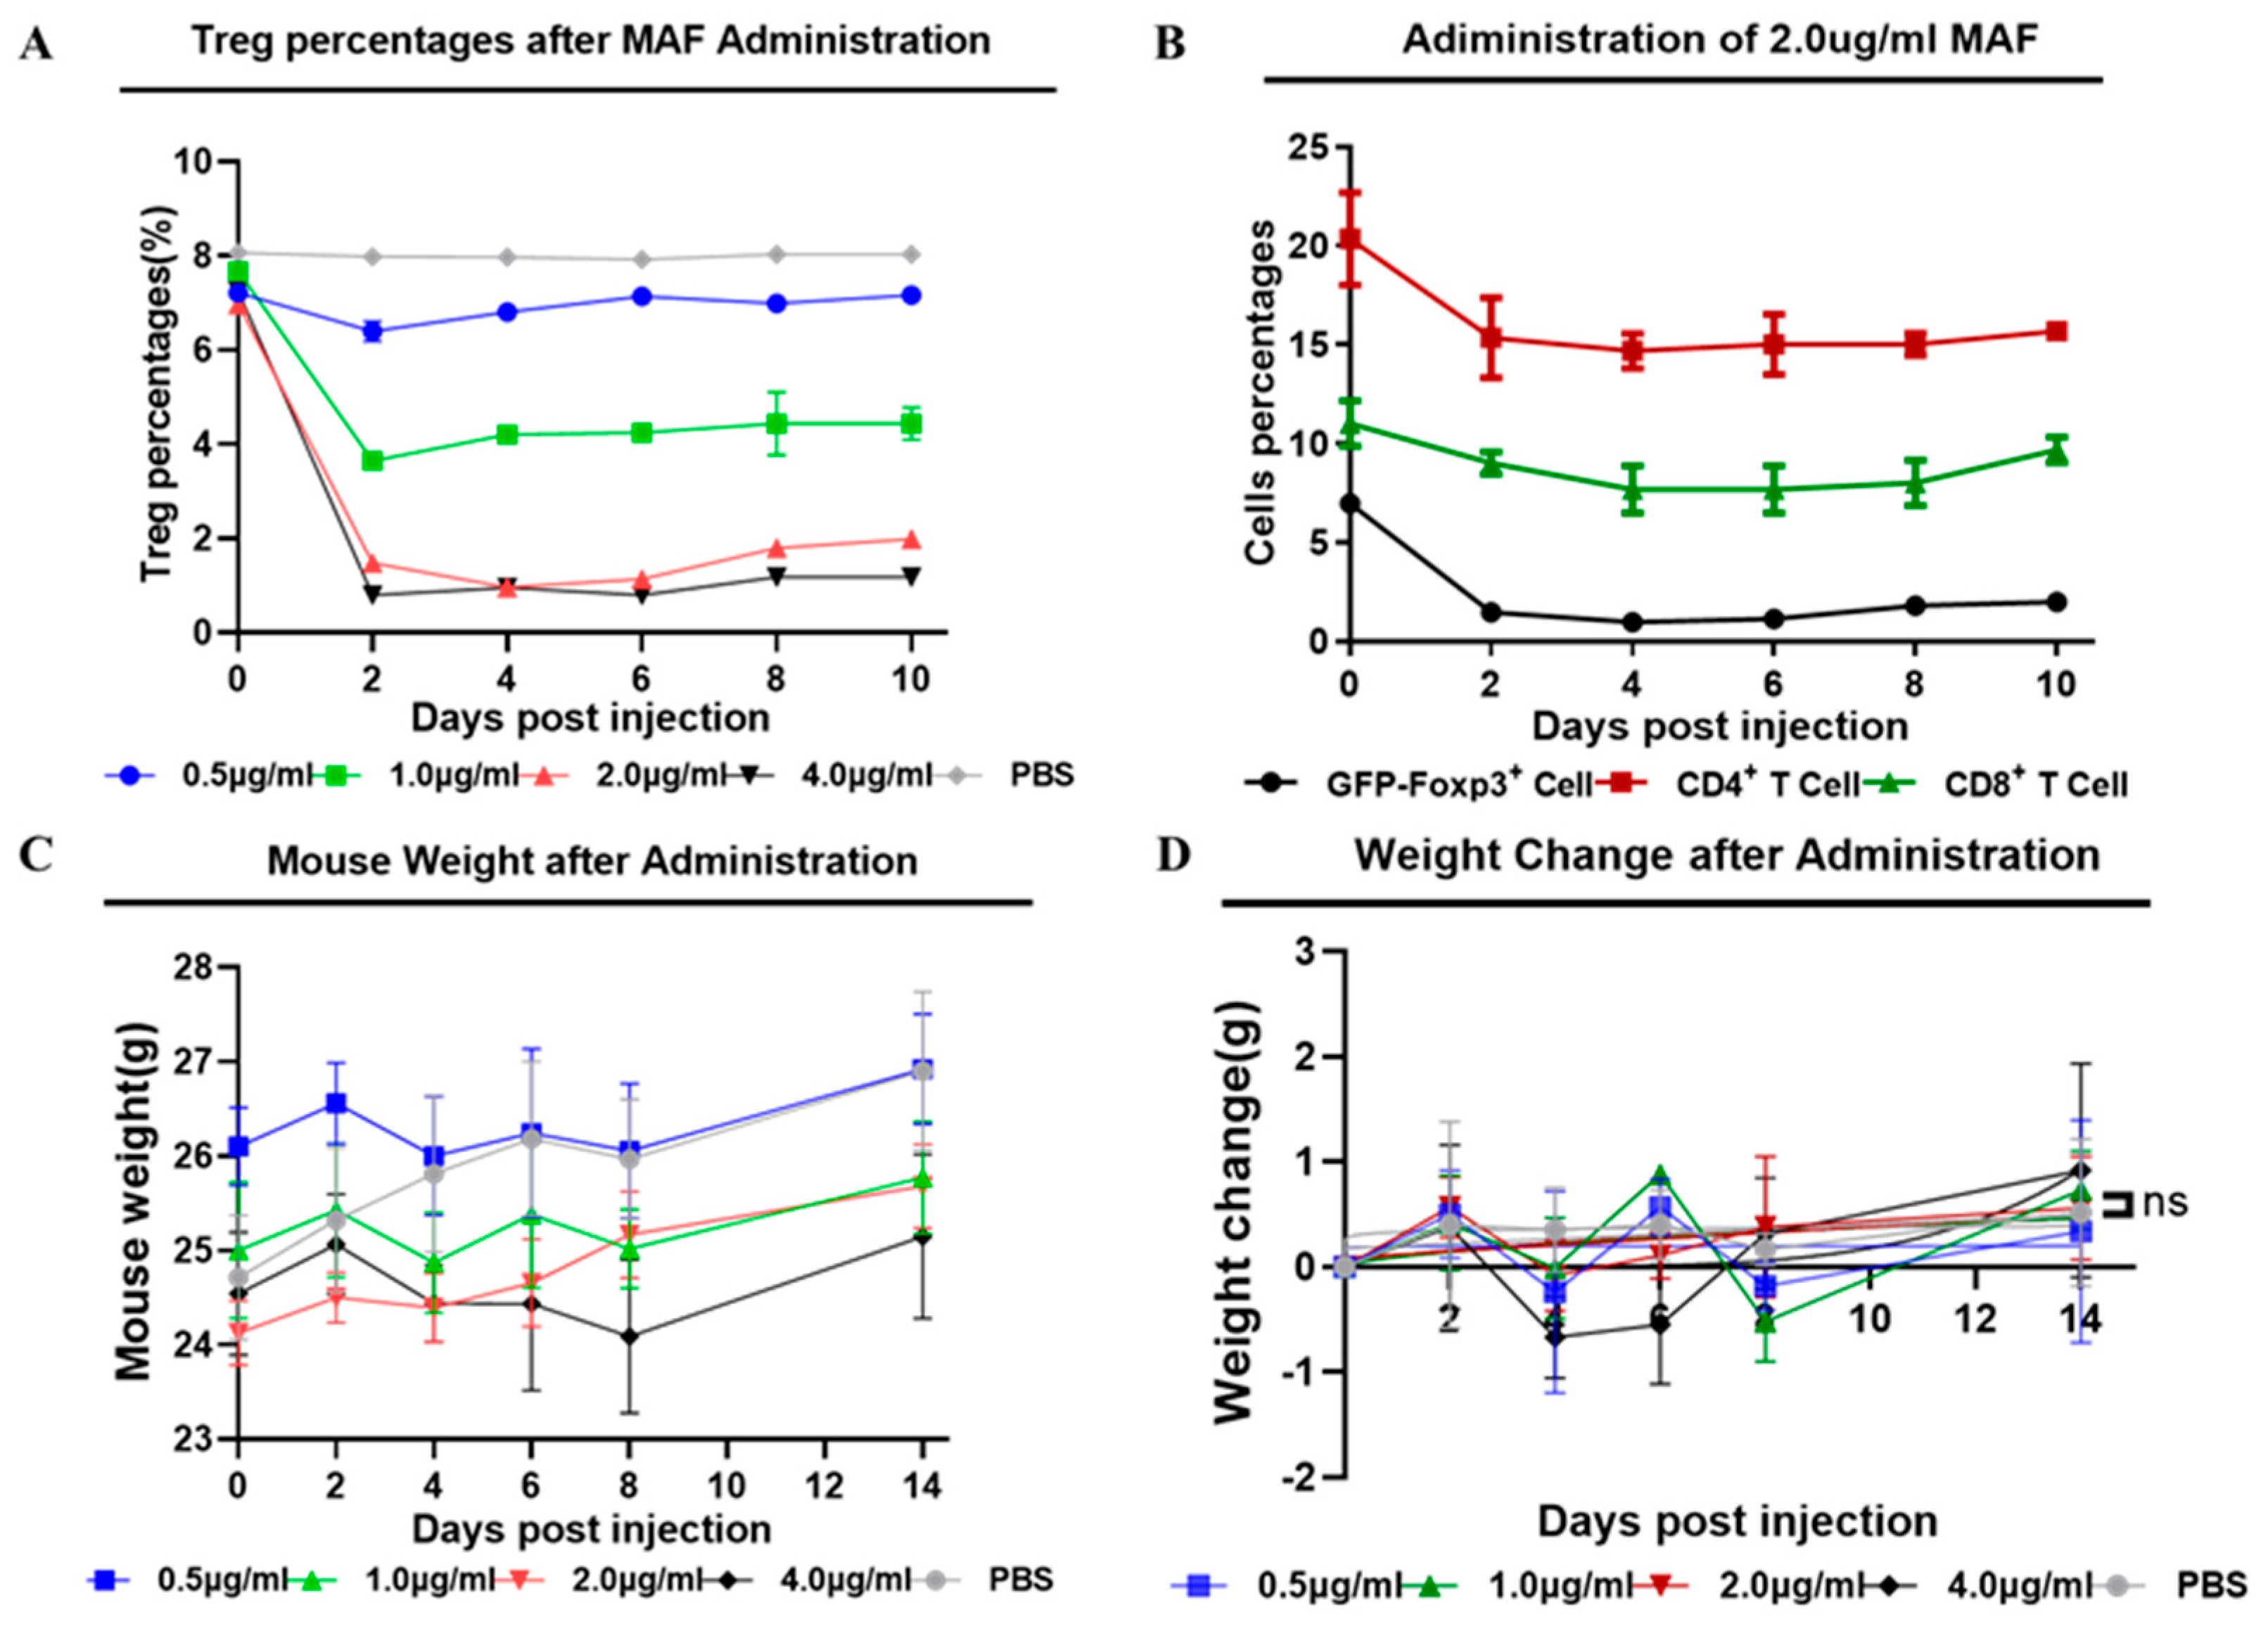
Figure 4.
DCs and DTH responses were measured post-immunization. (A) A flowchart of the vaccination process, along with the associated regimen. (B) Mouse footpad swelling was assessed using a vernier caliper. (C) (D) DCs from the peripheral blood were examined using FCM. (E) The level of costimulatory molecules that were expressed on DCs was determined. (a: PBS, b: GMI-HBVac, c: CTX, d: CTX+GMI-HBVac, e: MAF, f: MAF+GMI-HBVac).
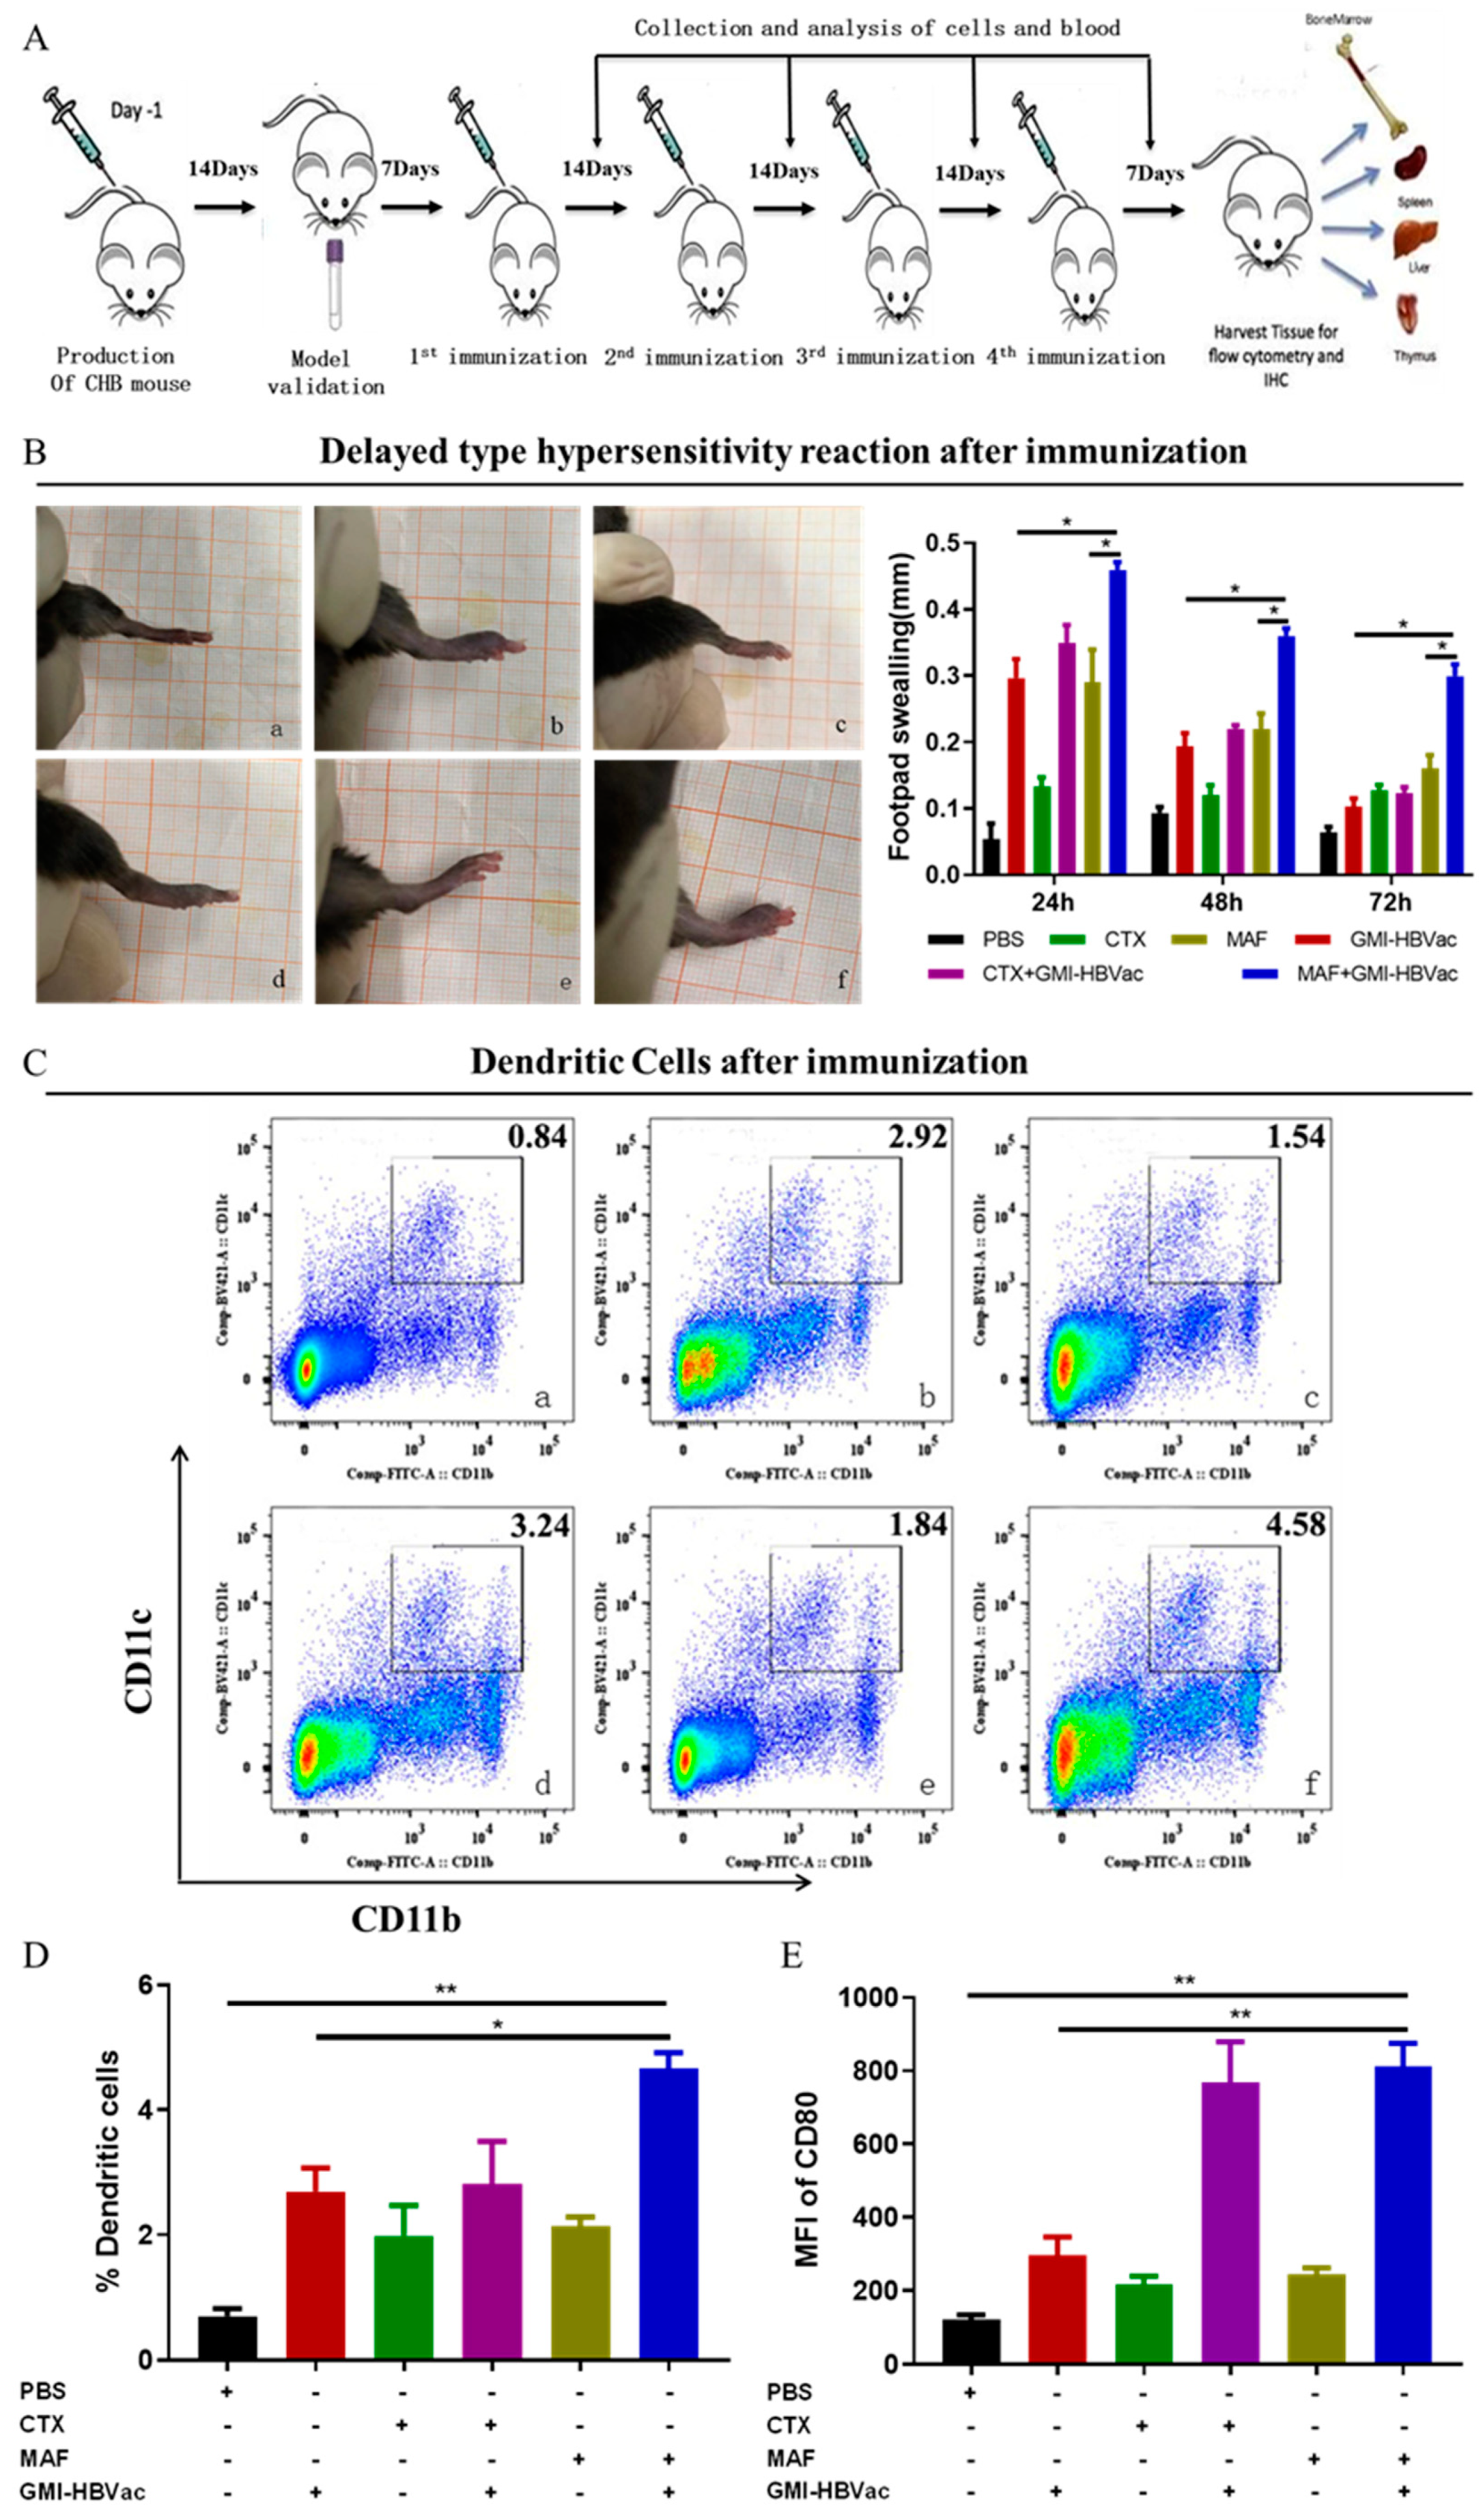
Figure 5.
The immunization of rAAV8-1.3HBV-infected mice with MAF+GMI-HBVac enhances the immune response in the periphery. (A) (B) IFN-γ+CD8+ T cells following vaccination of mice after receiving a vaccination were examined by FCM. (C) IFN-γ+CD4+ T cells following vaccination of mice. (D) IL-4+CD4+ T cells following vaccination of mice. (E) the functionality of CTL following immunization Target cells were isolated from the spleen of naive mice, pulsed in vitro with an HBsAg peptide (S208-215: ILSPFLPL) or an OVA peptide (OVA257-264: SIINFEKL), and then labeled with a high concentration of CFSE for the cells that had been pulsed by HBsAg peptides and a low concentration of CFSE for the cells that had been These two types of marked cells were combined in an equal ratio before being intravenously adopted by immunocompromised individuals. After an incubation period of 8 hours looking for specific cytolytic reactions, the reduction of CSFE was measured by flow cytometric analysis. (F) The proliferation of CD4+ T lymphocytes isolated from splenocytes was analyzed by flow cytometric microscopy after being activated in vitro with an HBsAg peptide. (G) The proliferation of CD8+ T lymphocytes isolated from splenocytes was analyzed by flow cytometric microscopy after being activated in vitro with an HBsAg peptide. (a: PBS, b: GMI-HBVac, c: CTX, d: CTX+GMI-HBVac, e: MAF, f: MAF+GMI-HBVac).
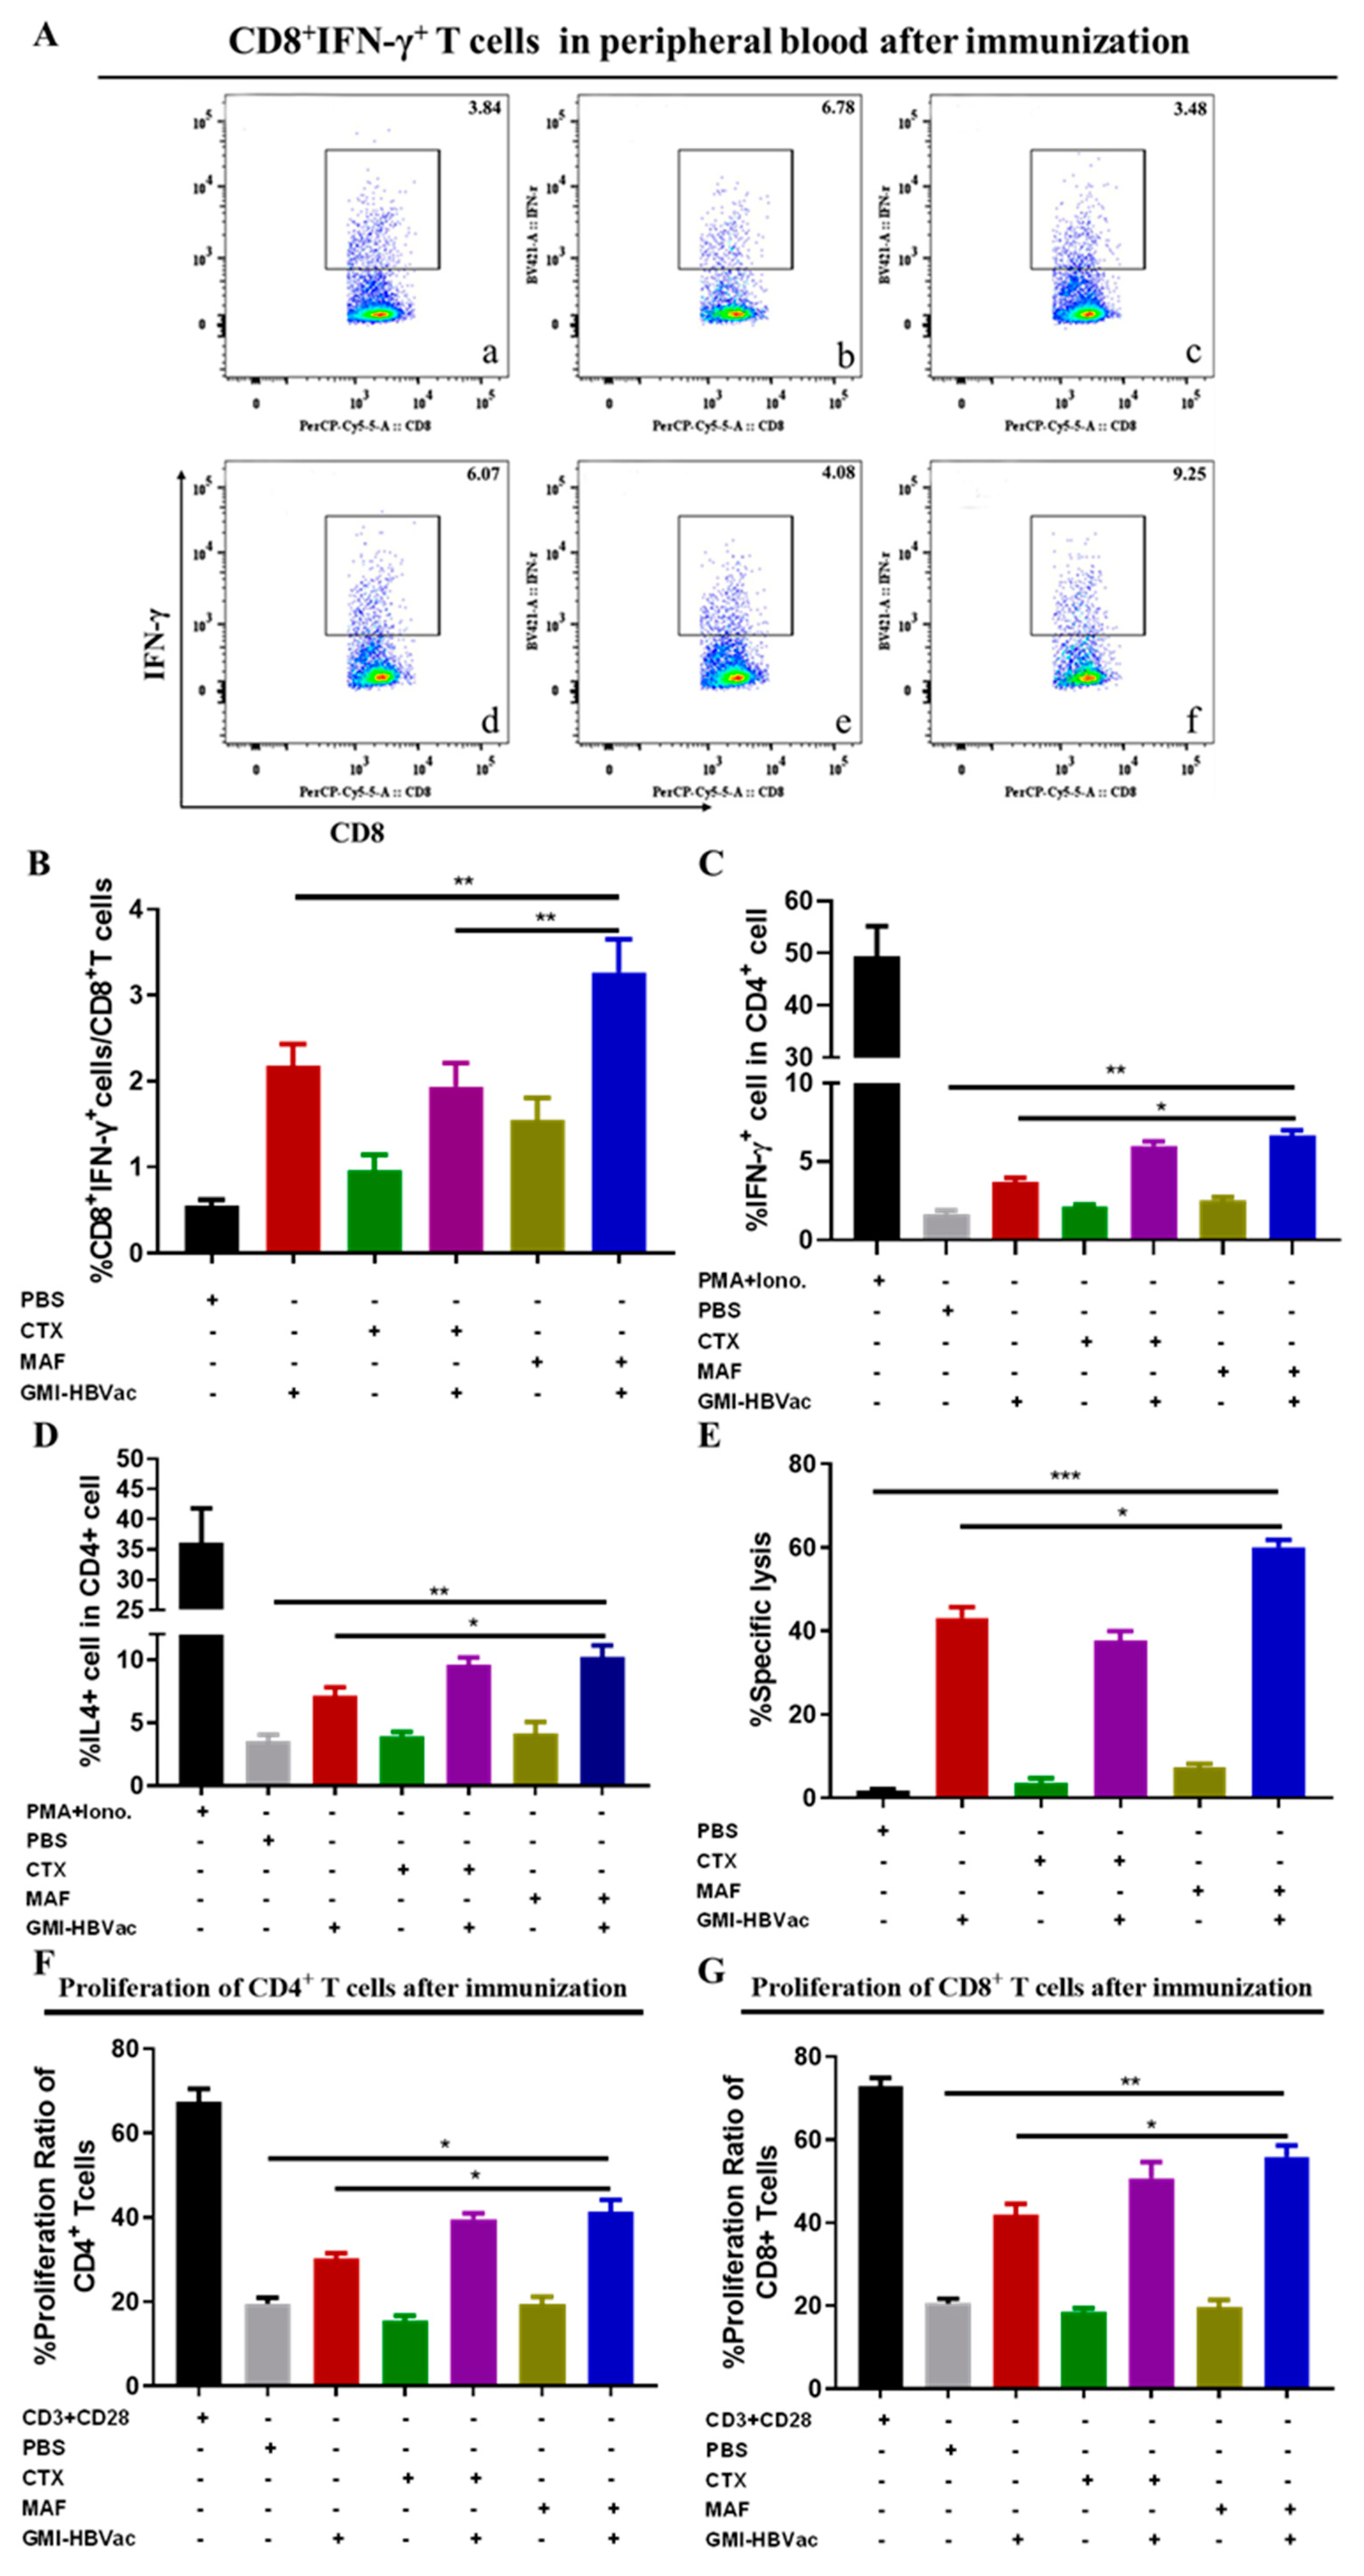
Figure 6.
Immunization with MAF+GMI-HBVac leads to an increased number of T cells populating in the livers of mice that have been infected with rAAV8-1.3HBV. (A) An immunohistochemical analysis of liver tissue was carried out, and specific anti-CD4 antibodies were used to stain the tissue (as red arrow pointed). (B) An immunohistochemical analysis of liver tissue was carried out, and specific anti-CD8 antibodies were used to stain the tissue (as red arrow pointed). (a: PBS, b: GMI-HBVac, c: CTX, d: CTX+GMI-HBVac, e: MAF, f: MAF+GMI-HBVac).
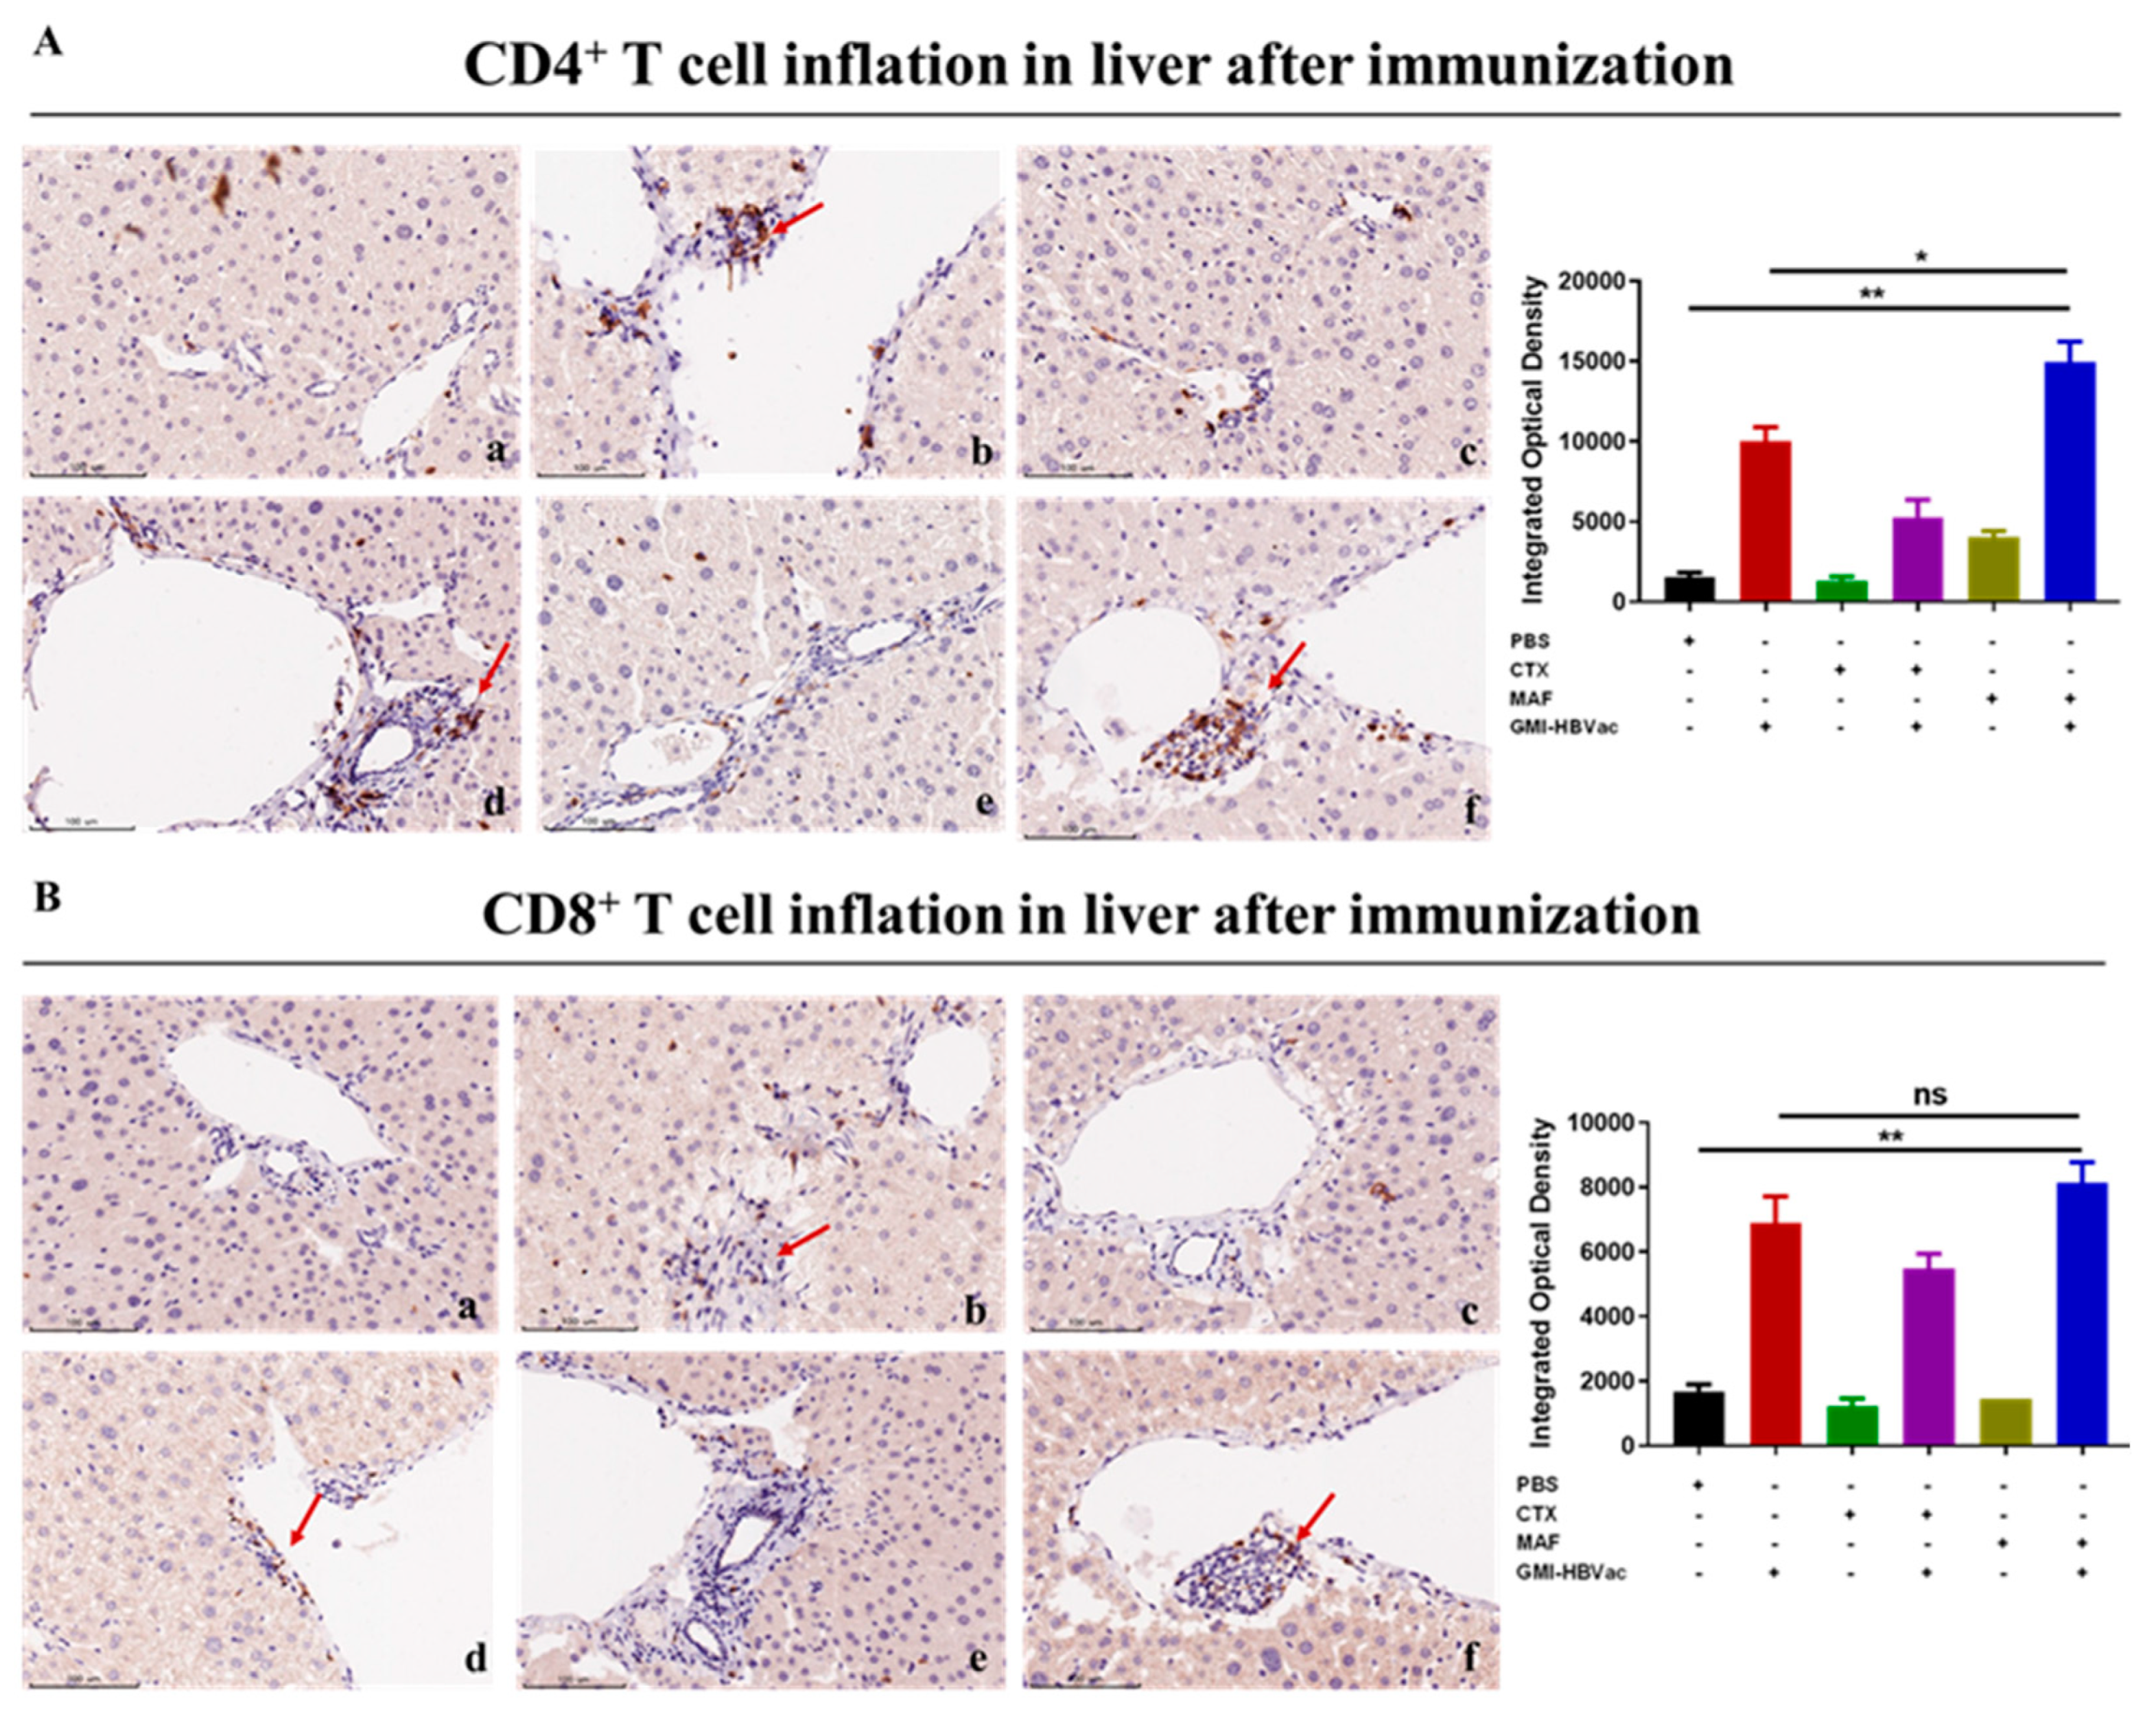
Figure 7.
Immunization with MAF+GMI-HBVac boosts the immune response in the liver of mice that have been infected with rAAV8-1.3HBV. (A) The liver tissue was stained with immunofluorescence by labeling CD8 and HBcAg. This procedure was performed. (B) Labeling of IFN-γ and HBcAg was conducted in order to perform immunofluorescence staining of liver tissue. (The red fluorescent symbol represents CD8 or IFN-γ, while the green fluorescent symbol represents HBcAg.).
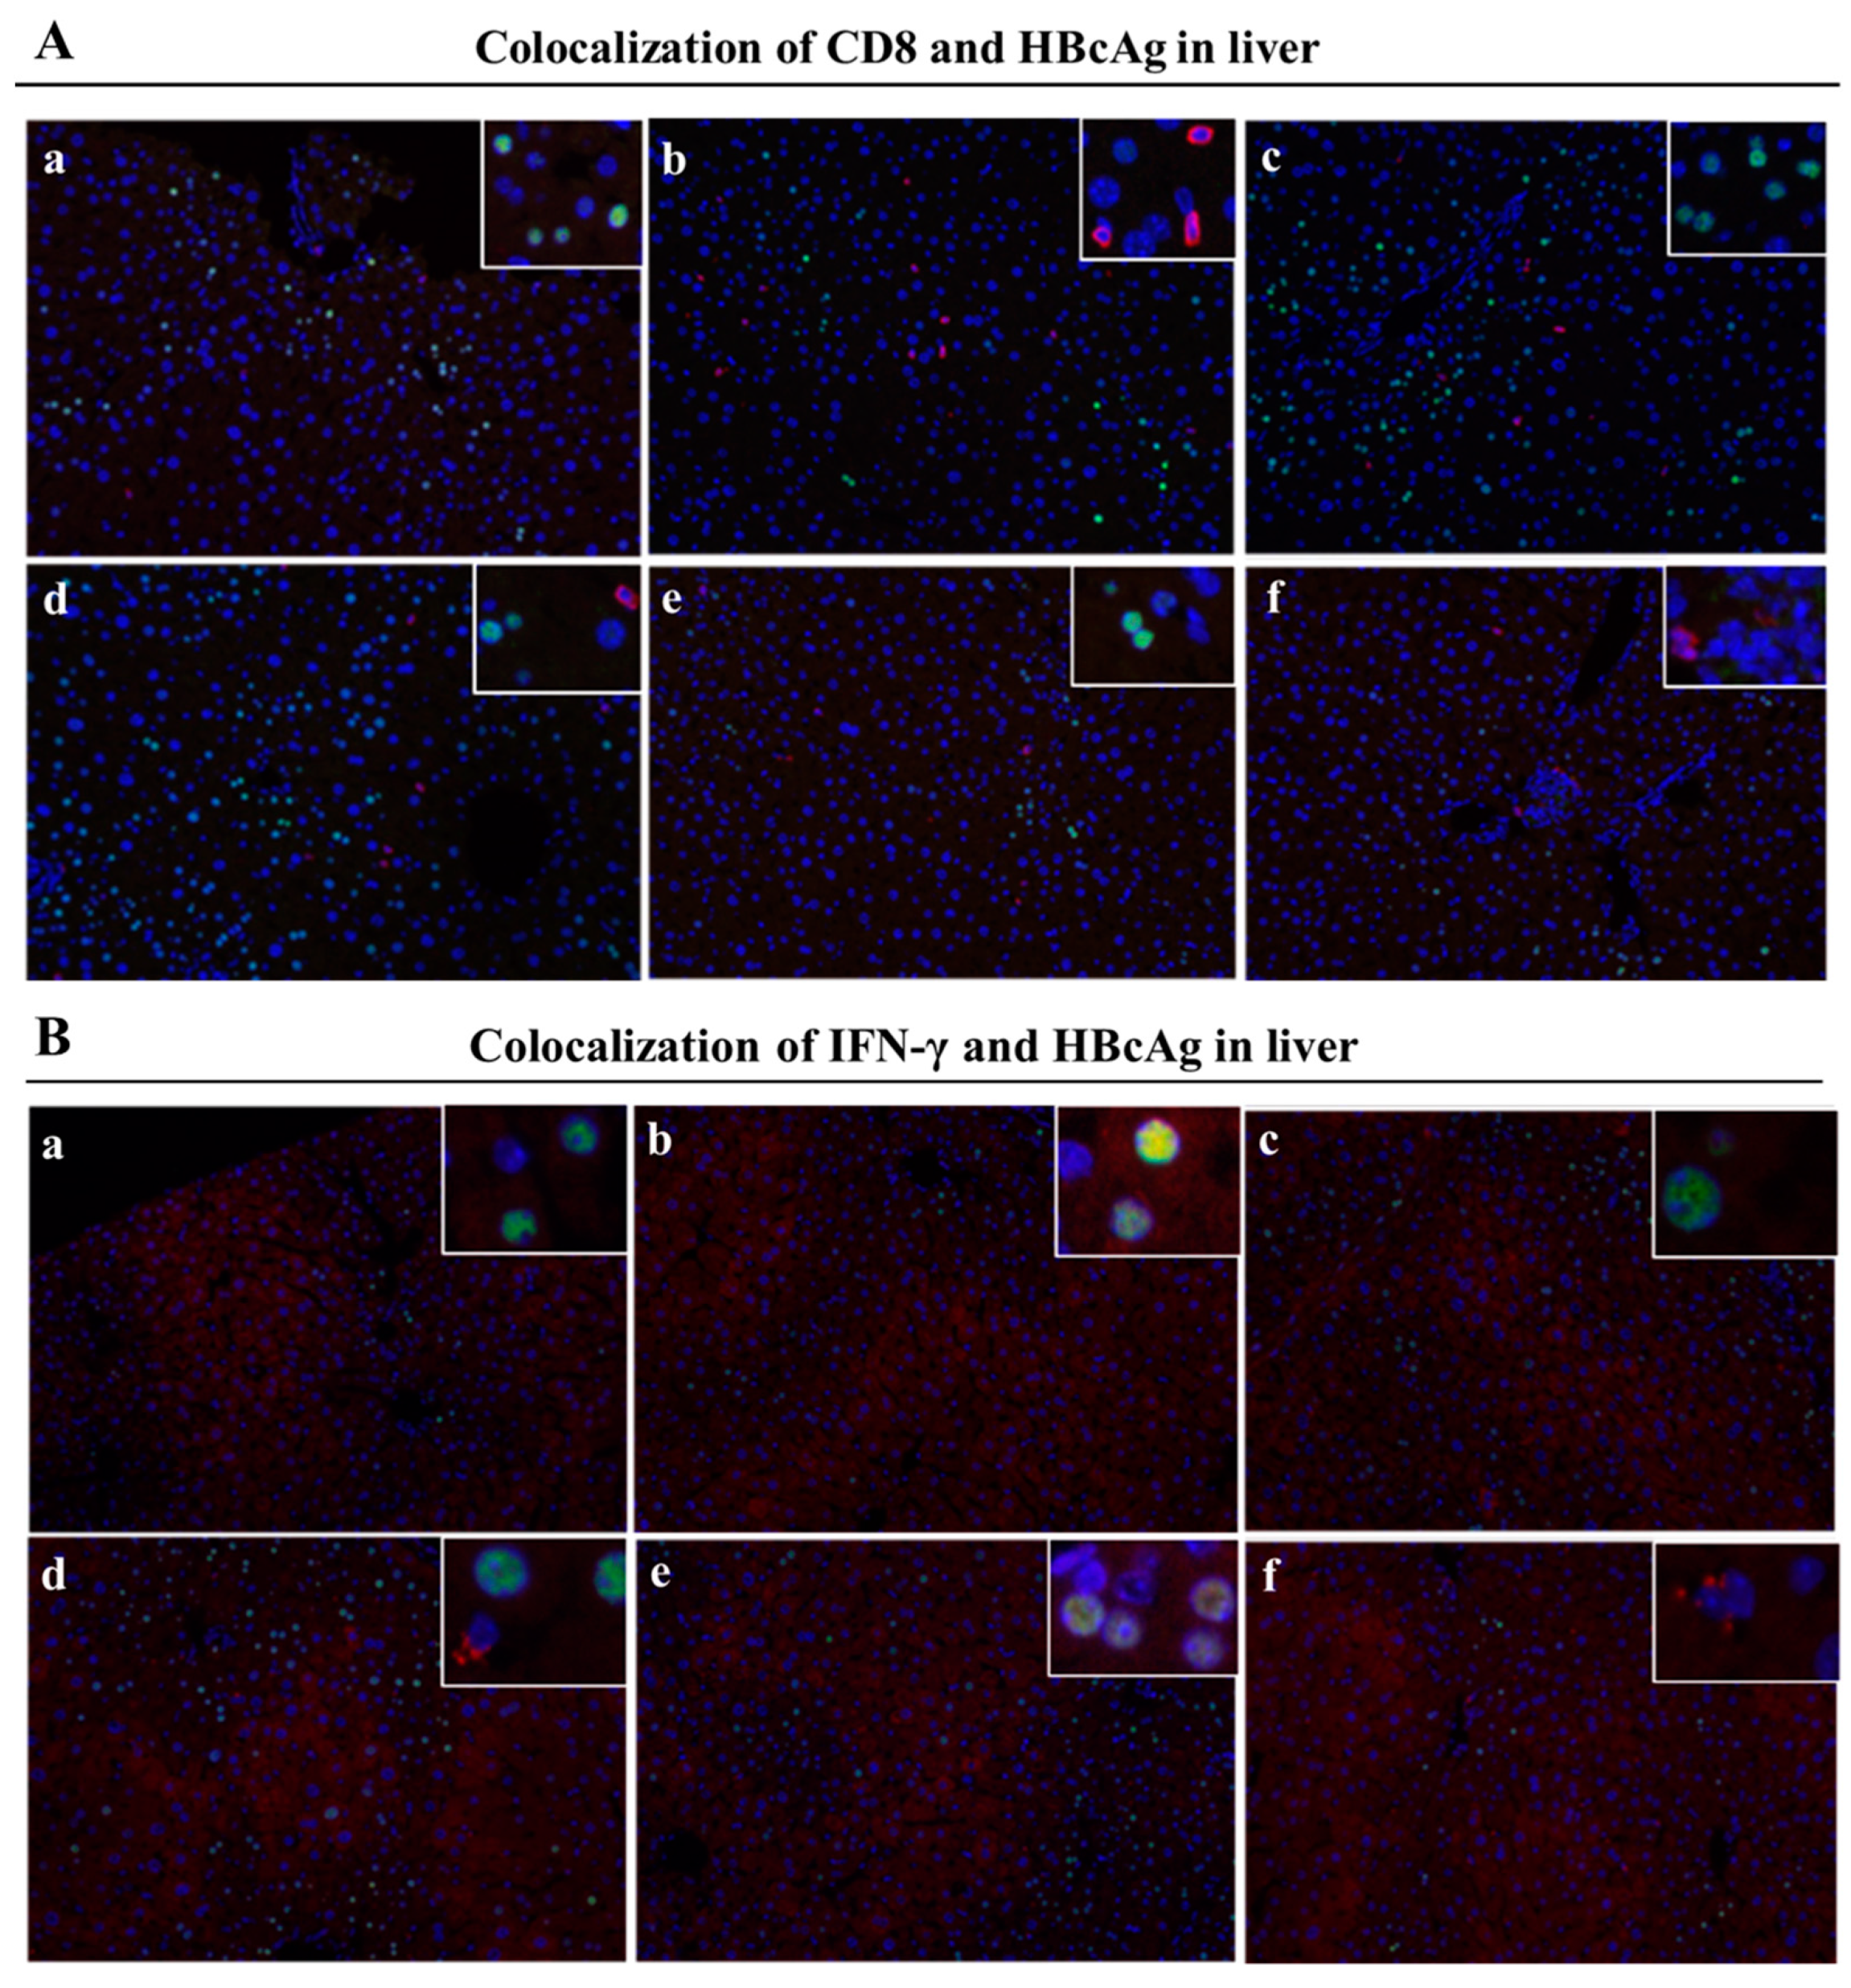
Figure 8.
Liver HBV antigen clearance was enhanced in rAAV8-1.3HBV infected mice after treatment with the corresponding regimen. (A) An immunohistochemistry experiment was carried out on liver tissue taken from mice that had been infected with rAAV8-1.3HBV using anti-HBsAg antibodies (as red arrow pointed). (B) An immunohistochemistry experiment was carried out on liver tissue taken from mice that had been infected with rAAV8-1.3HBV using anti-HBcAg antibodies (as red arrow pointed). (C) After being immunized, the liver of mice that had been infected with rAAV8-1.3HBV was stained with H&E. (a: PBS, b: GMI-HBVac, c: CTX, d: CTX+GMI-HBVac, e: MAF, f: MAF+GMI-HBVac).
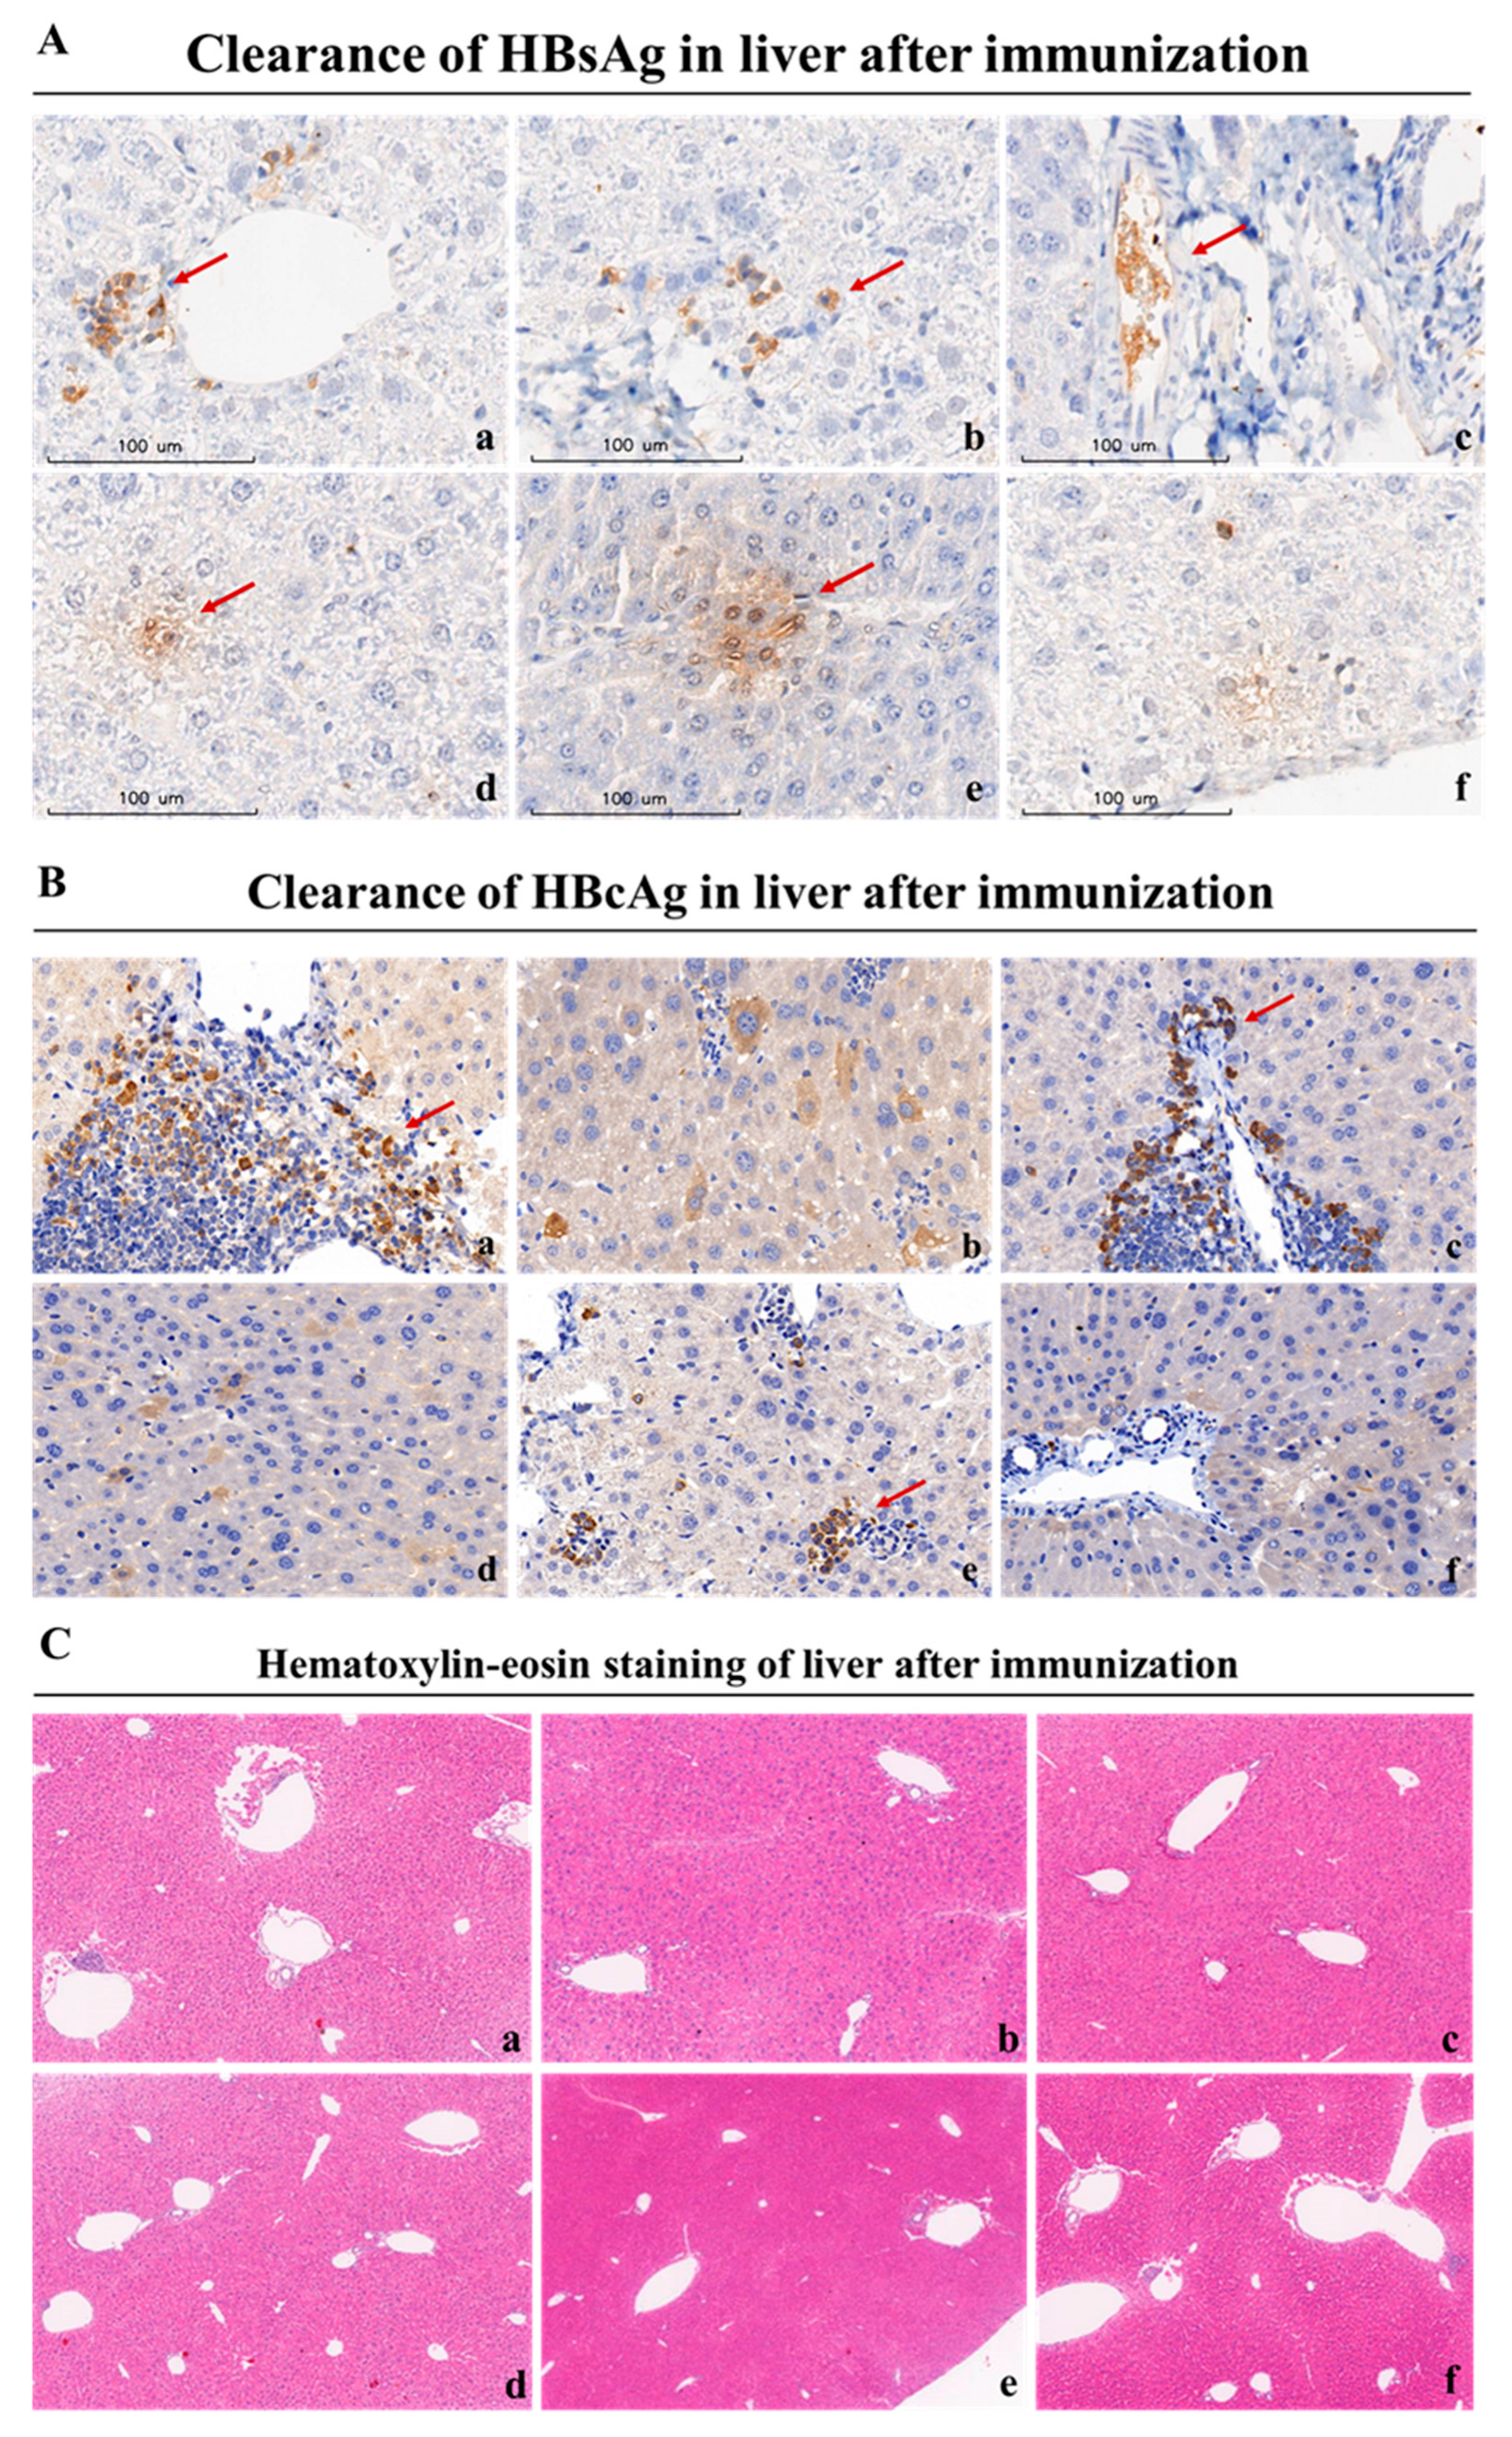
Figure 9.
The administration of the regimen led to HBV antigen seroclearance in rAAV8-1.3HBV-infected animals. (A) The serum HBsAg levels of mice were determined by ELISA. (B) Serum HBeAg was determined by ELISA. (C) HBsAb levels in the serum were determined by ELISA. (D) HBV DNA in the serum was quantified using Q-PCR. (E) The serum ALT was evaluated using an ALT test kit. (a: PBS, b: GMI-HBVac, c: CTX, d: CTX+GMI-HBVac, e: MAF, f: MAF+GMI-HBVac).
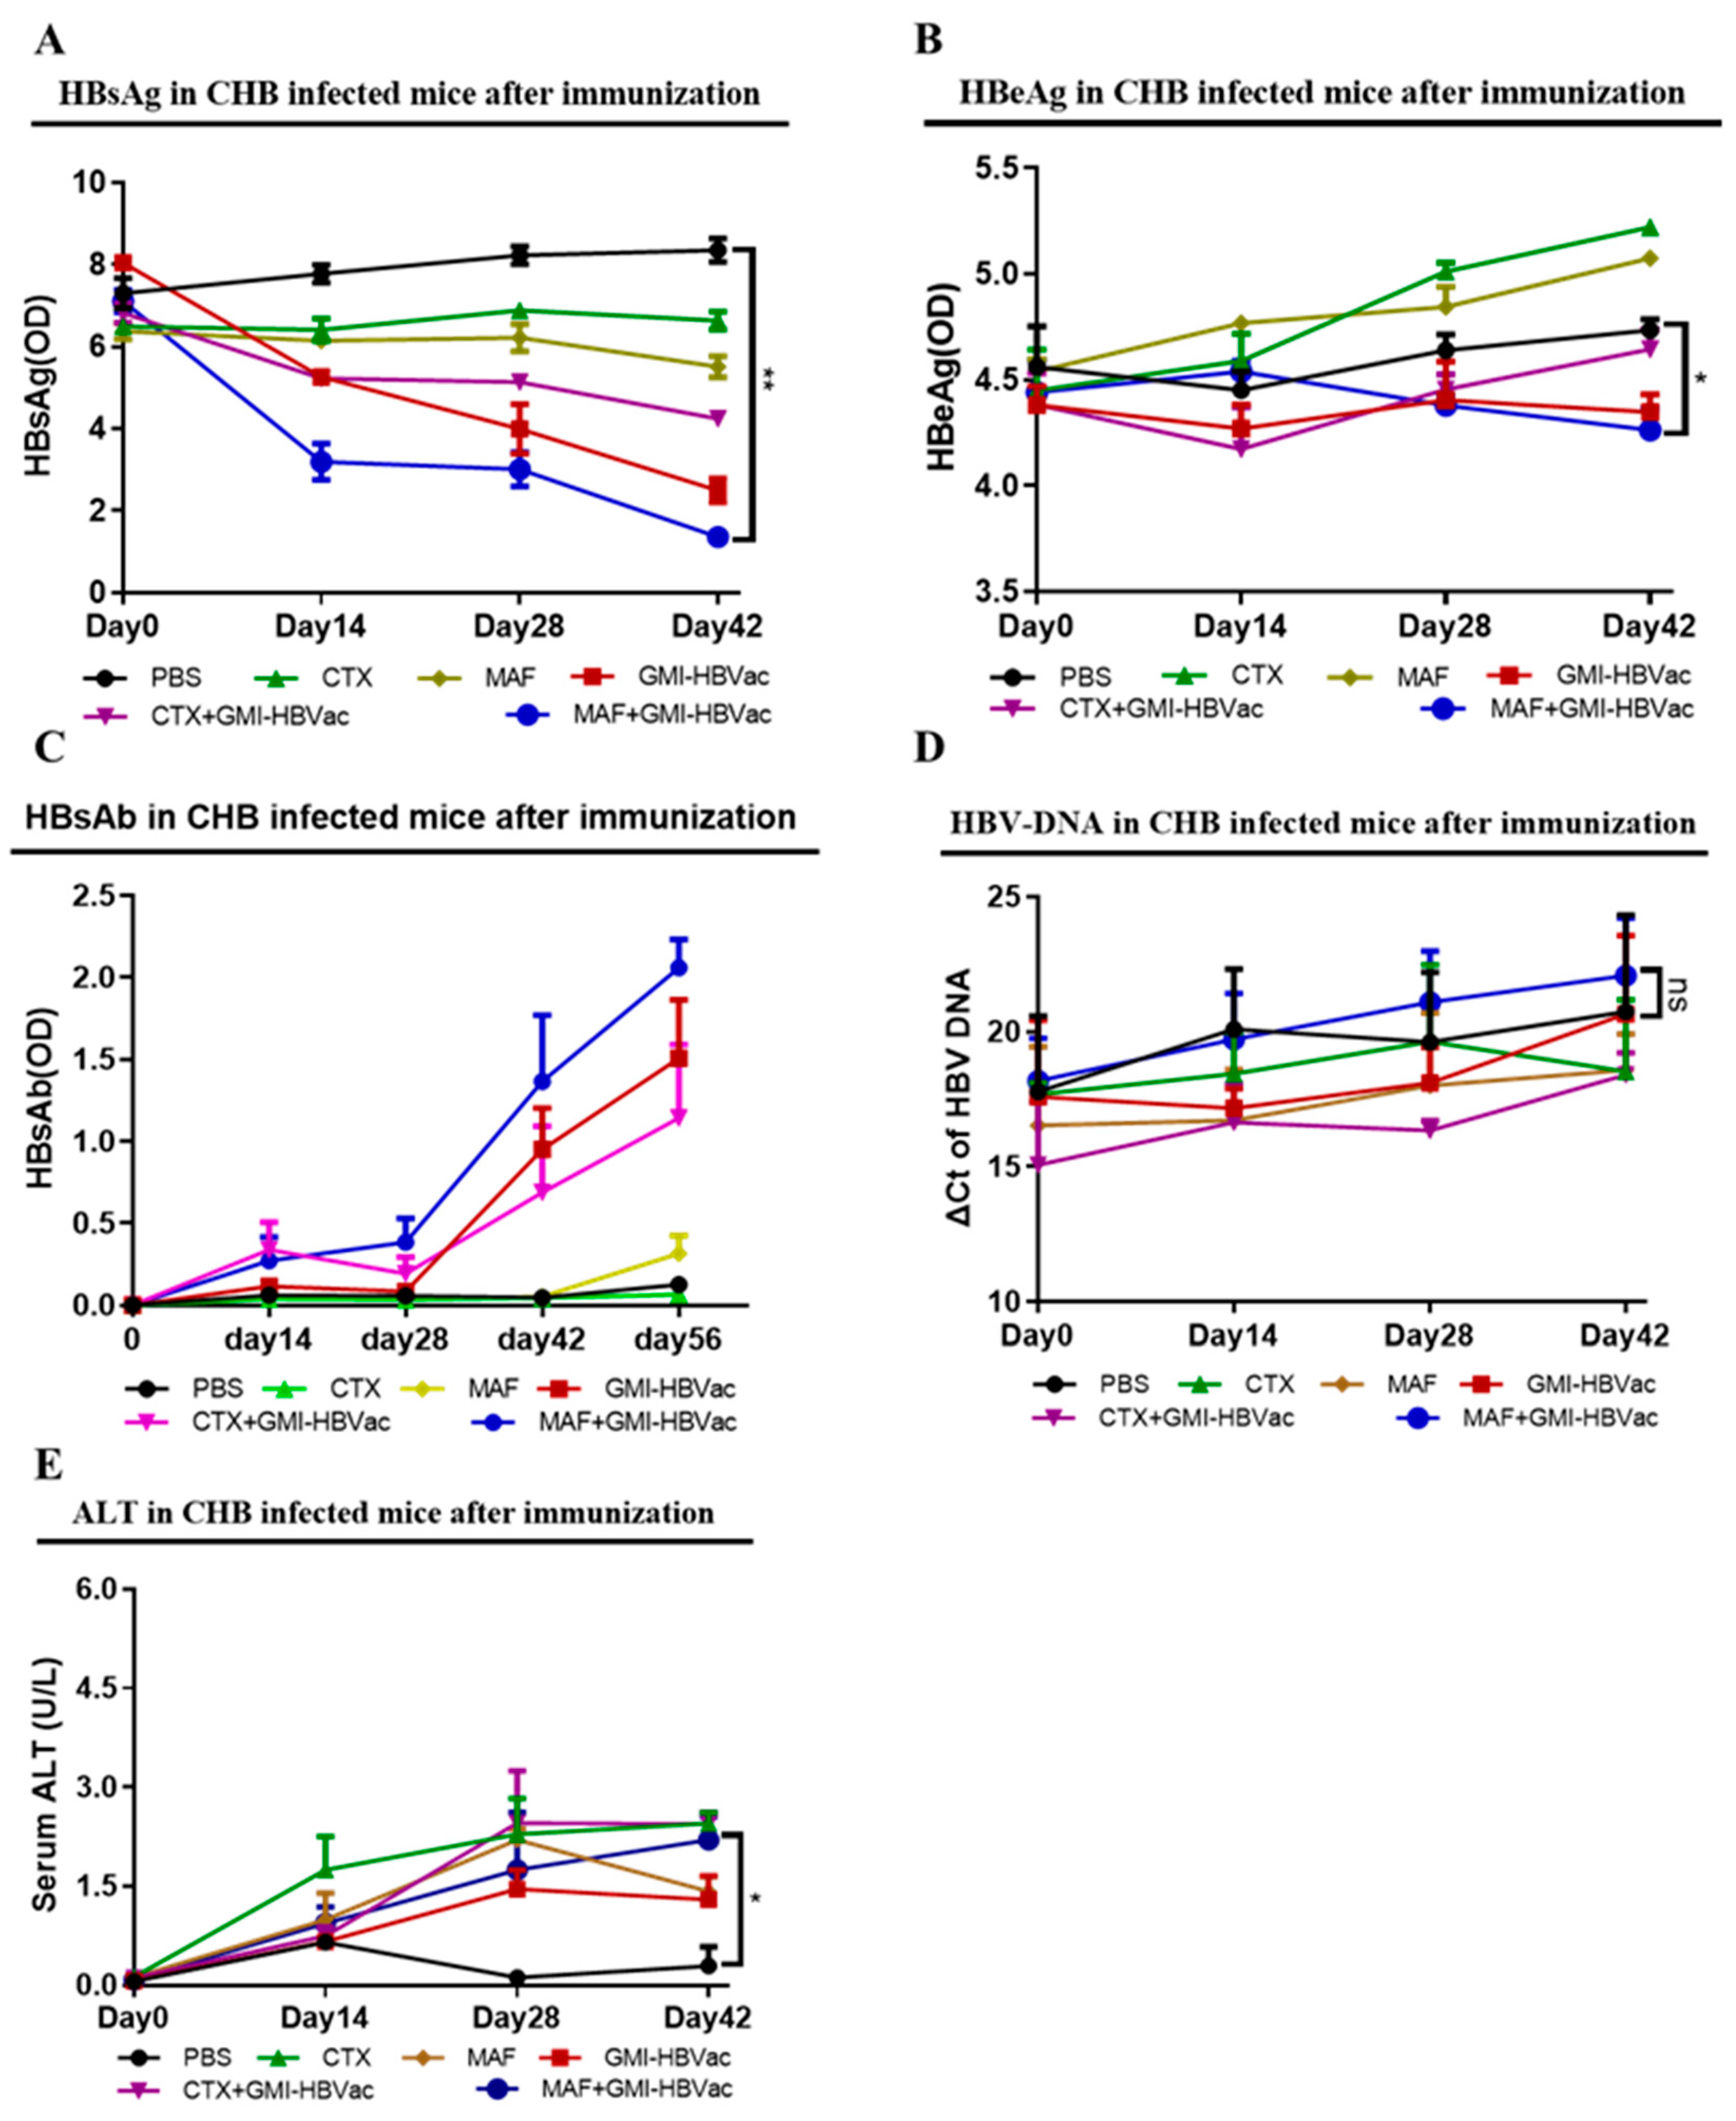

Table 1.
Regimens for immunization.
| Group | Dose |
| PBS | 150ul |
| GM-CSF+IFN-α+rHBVvac (GMI-HBVac) | 10μg+10000IU+1μg |
| CTX | 15mg/kg |
| CTX+GMI-HBVac | 15mg/kg+10μg+10000IU+1μg |
| MAF | 2μg/ml |
| MAF+GMI-HBVac | 2μg/ml+10μg+10000IU+1μg |
Disclaimer/Publisher’s Note: The statements, opinions and data contained in all publications are solely those of the individual author(s) and contributor(s) and not of MDPI and/or the editor(s). MDPI and/or the editor(s) disclaim responsibility for any injury to people or property resulting from any ideas, methods, instructions or products referred to in the content. |
© 2023 by the authors. Licensee MDPI, Basel, Switzerland. This article is an open access article distributed under the terms and conditions of the Creative Commons Attribution (CC BY) license (http://creativecommons.org/licenses/by/4.0/).
Copyright: This open access article is published under a Creative Commons CC BY 4.0 license, which permit the free download, distribution, and reuse, provided that the author and preprint are cited in any reuse.


