
Submitted:
28 February 2023
Posted:
28 February 2023
You are already at the latest version
Abstract
Functional magnetic resonance imaging (fMRI) is an indirect measure of neural activity with the hemodynamic response function (HRF) coupling it with unmeasured neural activity. The HRF, modulated by several non-neural factors, is variable across brain regions, individuals and populations. Yet, a majority of resting-state fMRI connectivity studies continue to assume a non-variable HRF. In this article, with supportive prior evidence, we argue that HRF variability cannot be ignored as it substantially confounds within-subject connectivity estimates and between-subjects connectivity group differences. We also discuss its clinical relevance with connectivity impairments confounded by HRF aberrations in several disorders. We present limited data on HRF differences between women and men, which resulted in a 15.4% median error in functional connectivity estimates in a group-level comparison. We also discuss the implications of HRF variability for fMRI studies in the spinal cord. There is a need for more dialogue within the community on the HRF confound, and we hope that our article is a catalyst in the process.
Keywords:
BOLD fMRI
; HRF
; resting state connectivity
; aging
; sex differences
; confound
1. Introduction
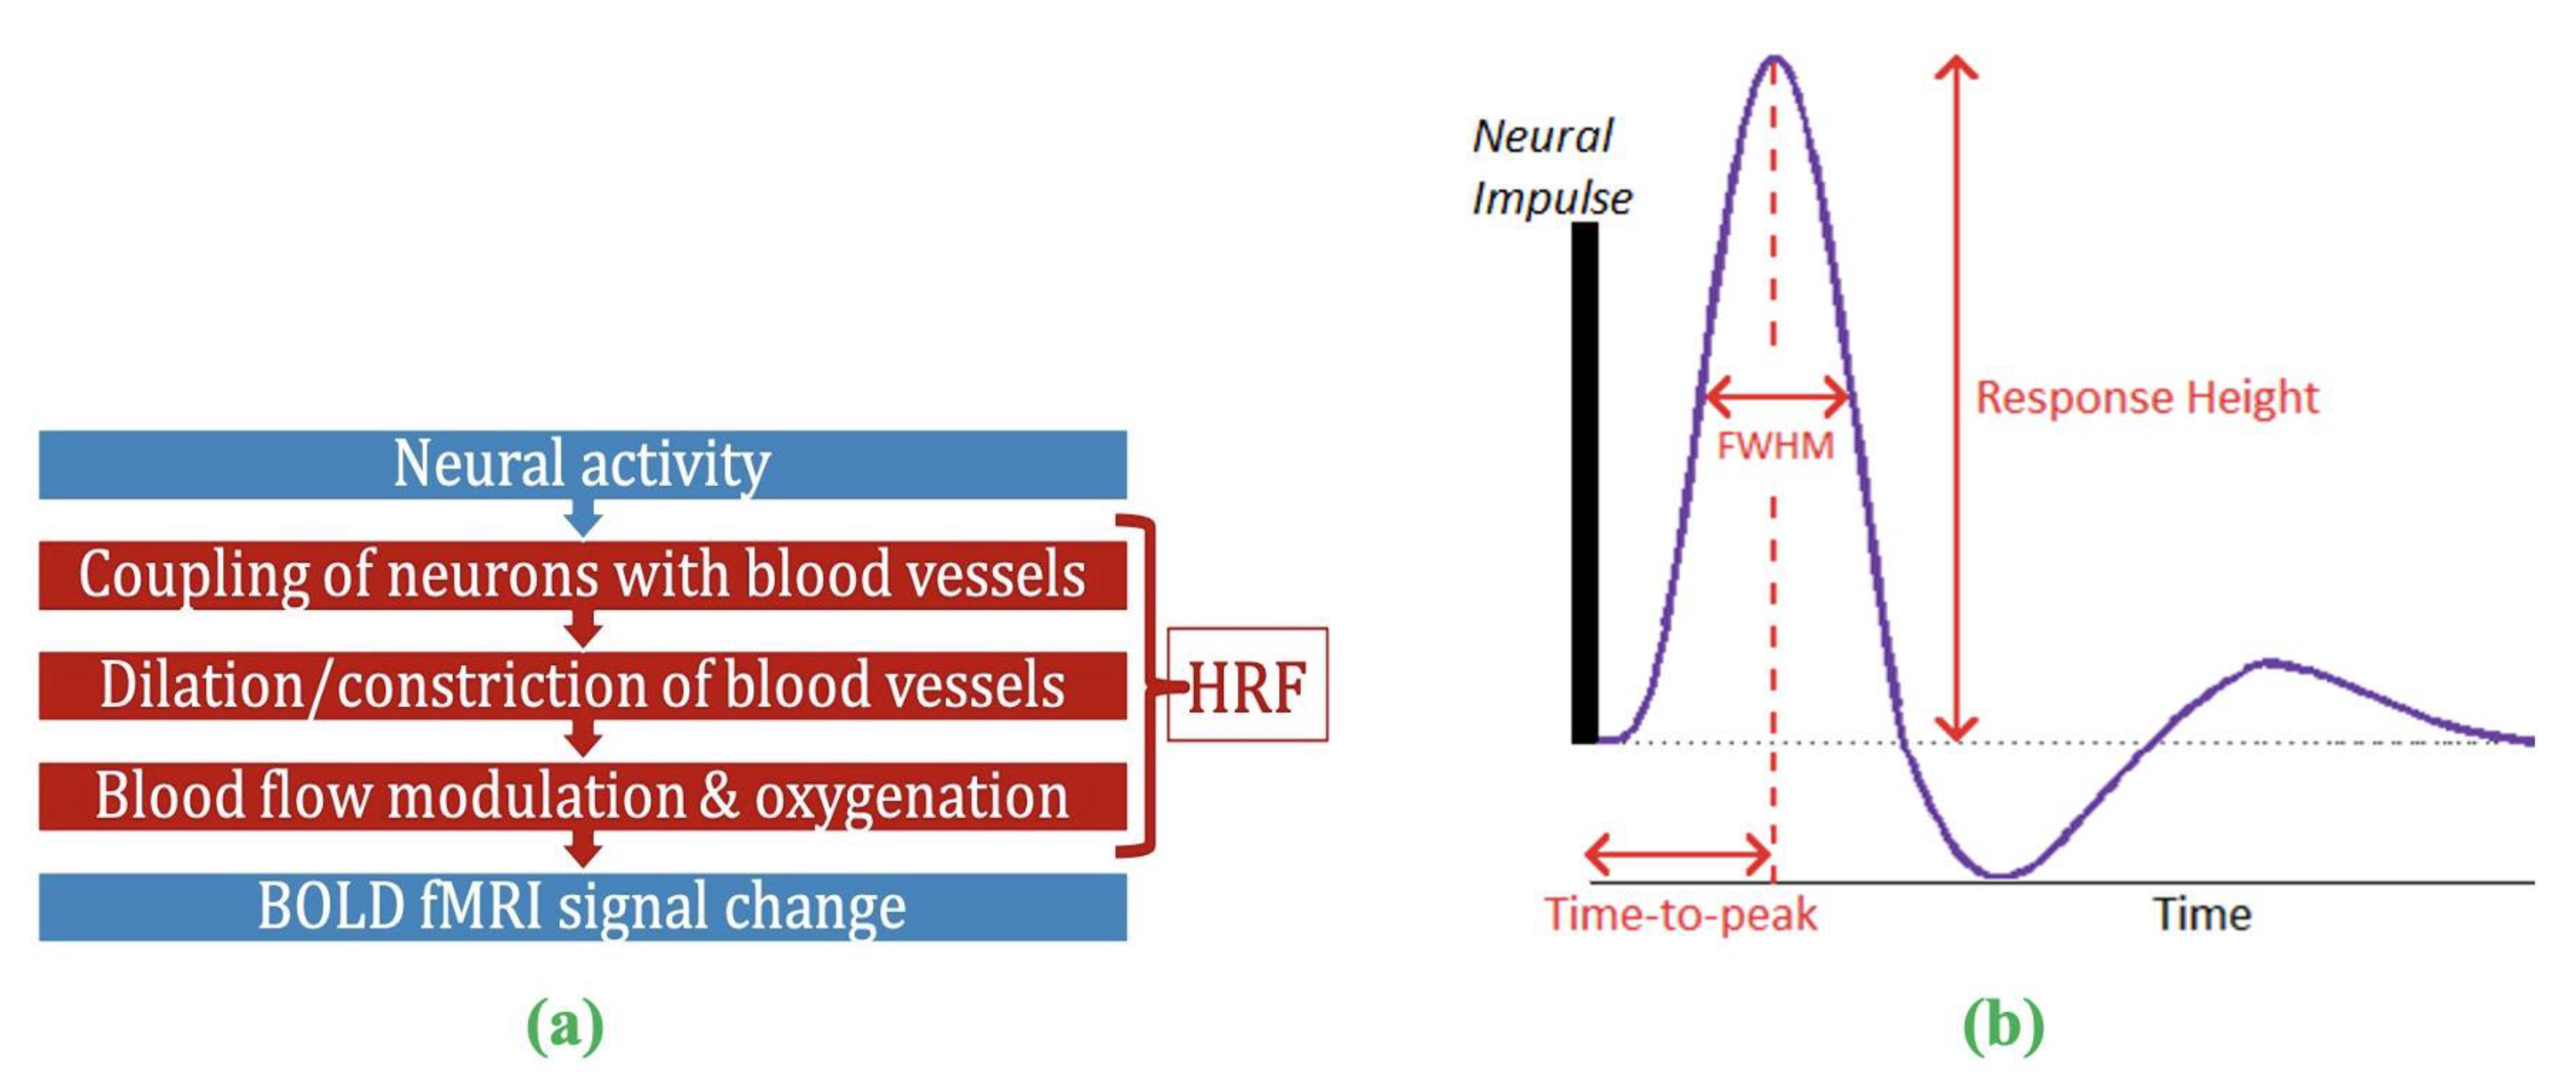
Functional magnetic resonance imaging (fMRI) has contributed significantly to the advancement of neuroscience, psychiatry, and neurology over the past three decades [1,2,3]. While neural activity can be directly measured in vivo through invasive procedures, blood oxygenation level-dependent (BOLD) fMRI is a complex, indirect measure of neural activity [4] (Fig.1a), measuring local blood oxygenation variations in response to active neurons. Dilation and constriction of blood vessels modulate this process, which, in turn, is modulated through numerous non-neural and neural factors that are difficult to delineate [5]. The combination of factors that lie between neural activity and BOLD is the hemodynamic response function (HRF) [6,7]. HRF shape is characterized by its amplitude (response height, RH), latency (time-to-peak, TTP) and width (full-width at half max, FWHM) (Fig.1b). Representing neurovascular coupling in the BOLD signal, the HRF is modulated by several non-neural factors [5,8] such as hematocrit, variable size/density of vasculature, global magnetic susceptibilities, alcohol/caffeine/lipid ingestion, pulse/respiration differences, and partial volume imaging of veins [8,9,10,11,12,13,14,15]. The HRF shape varies across the brain and individuals [9,10,16].
The current ‘perspective’ article focuses on this HRF variability (HRFv) and its impact on fMRI data processing and subsequent outcome measures within the scope of human fMRI research. This topic is important because thousands of human fMRI studies are published each year, but a significant portion of those do not account for HRFv. Resting-state fMRI (rs-fMRI) and connectivity studies dominate that list. Thus, there is a need for more dialogue within the community on HRFv. We argue that HRFv causes a measurable impact on the BOLD time series, which, if ignored, will confound fMRI outcomes such as connectivity. We substantiate our argument with prior human HRFv research, including those focusing on rs-fMRI connectivity. We also present limited new data (to substantiate our 'perspective’) on HRFv across two important demographic variables: age and sex. Lastly, to cover structures of the central nervous system beyond the brain, we also discuss the implications of HRFv for spinal cord fMRI.
Figure 1.
(a) FMRI is an indirect measure of neural activity. What stands between them is the hemodynamic response function (HRF). (b) The HRF is the BOLD response to a neural impulse. It has a peak (response height) occurring sometime after the neural impulse (time-to-peak) (HRF width = FWHM). The HRF always has this shape (biological), but these parameters are variable.
2. The problem of HRF variability
HRFv was first demonstrated in 1998 [10] and further examined in later years [9,17,18,19]. The HRF of a given brain region was identified to be different across individuals, and within a given individual, it was different across brain regions. Non-neural factors affecting the HRF is not merely the concern because a variable known HRF could be accounted for. Instead, the concern is that we do not understand these variable factors (and thus the HRF). The issue is alleviated in task fMRI studies by often modeling the HRF confound as time/dispersion derivatives of the canonical HRF in a general linear model (GLM) framework, which works well since BOLD is time-locked to an external stimulus. However, the outlook is different in rs-fMRI studies, which mostly ignore HRFv. The notion of HRF not being variable enough to be a serious confound was challenging to test, if not impossible, a few years ago because of the inability to estimate the HRF from rs-fMRI data. Necessary technical advancements (e.g., point-process theory [20,21]) have now resulted in rs-fMRI deconvolution techniques that are capable of HRF estimation from resting-state fMRI data [22,23,24,25]. We take a closer look at these techniques next.
3. HRF estimation from resting-state fMRI data
HRF estimation can be straightforward with two known quantities (fMRI and neural activity) and one unknown (HRF). This is possible with simultaneous fMRI and invasive recordings (e.g., [26,27]), which is hardly feasible in humans. Obtaining simultaneous rs-EEG/fMRI data and considering EEG as the neural input to deconvolve fMRI (using AFNI’s 3dDeconvolve [28]) is problematic because generative fMRI models do not consider scalp EEG as properly representing BOLD-inducing neural activity [4]. A viable alternative is estimating HRF latency from a hypercapnic challenge because breath-hold causes vasodilation and modulates cerebral blood flow (CBF) [29,30,31] in the absence of neural activity, allowing us to measure vascular latency. Chang et al. [32] utilized this to correct for vascular latency prior to connectivity analysis. The disadvantage is that an additional breath-hold scan is not always feasible or available. Breath-hold is prone to subjective performance and can be challenging in those with some neurological diseases [33,34]. Moreover, it only measures one aspect of HRF shape (TTP), while the entire HRF impacts BOLD.
To circumvent these concerns, an alternative is to perform blind deconvolution; that is, solve the mathematically ill-posed inverse problem of having two unknowns (HRF and neural activity) and one known (fMRI). This is feasible because the natural limits and biophysics of HRF and fMRI are well understood. HRF estimation then becomes a constrained optimization exercise. Such deconvolution techniques primarily focusing on task fMRI data [35,36,37,38,39,40,41,42] are generally robust to HRF misspecification within a narrow physiological range, but are not viable for estimating voxel-specific HRFs in the entire brain, especially in rs-fMRI data. Whole-brain HRF estimation is preferable with rs-fMRI data because, with task fMRI, a given task does not activate the entire brain uniformly [43], and even among activated voxels, the BOLD response is mostly non-uniform [44], sometimes leading to biologically implausible HRF estimates [43]. Some techniques that might, in principle, be viable for rs-fMRI have never been tested using rs-fMRI data [45,46].
This leaves us with four rs-fMRI deconvolution techniques that have been more widely adopted: (i) Wu et al.’s [22] data-driven rsHRF method [47], (ii) parametric generative state-space models proposed within the stochastic dynamic causal modeling (DCM) framework [48,49,23], (iii) physiologically informed DCM [24] (developed for task fMRI but can be extended to rs-fMRI), and (iv) Total Activation [25] (estimates an “activity-inducing signal” from BOLD, from which it is possible in principle to estimate the HRF by Wiener deconvolution), which has been applied in the brain [50,51] as well as spinal cord [52]. Notably, a substantial number of studies examining HRFv (described later) utilized Wu et al.’s technique [22], hence we describe it briefly here. The Wu et al. technique models rs-fMRI data as event-related time series, with events modeled as point-processes [53]. Then it estimates the best-fit HRF in a least-squares sense, using the BOLD time series at identified events. Finally, the latent neural time series is estimated using Wiener deconvolution from the measured BOLD and the estimated HRF [54]. This technique has been validated using simulations, non-invasive and invasive data [20,22,55,47], and has been applied in many recent papers [55,56,57,58,59,60,61,62]. HRFs separated by four weeks demonstrated moderate test-retest reliability (ICC=0.51) [63], which is impressive by current neuroimaging standards [64]. We next present the impact of HRFv on rs-fMRI data.
4. The confound of HRF variability on connectivity estimates
We focus here on functional connectivity (FC) [65] because most rs-fMRI studies investigate FC, or metrics derived from FC such as dynamic connectivity and graph measures. It is, however, notable that the HRF confound has also been investigated for effective connectivity models such as DCM [48], Granger causality [66,67,68,69,45], and multivariate dynamical system models [70,71,72]. Effective connectivity estimated from fMRI data is viable [66,73] as well as accurate [23,26,74,75] only after deconvolution.
FC studies have, however, largely ignored HRFv either with the assumption that the HRF is similar enough among brain regions and individuals or due to the unavailability of HRF estimation methods. Recent evidence suggests that these assumptions must be re-evaluated. Although researchers have been aware, since the early days of fMRI, that BOLD measures blood oxygenation and not neural activity, the magnitude of HRF confound on FC is being investigated only recently with the availability of deconvolution techniques. We take a closer look at these. It has been demonstrated that the HRF is variable [9,10,55,76,77] and recent reports suggest that ignoring it can introduce confounds in FC estimates [55,57,59,78,79]. In fact, our study reported significant HRFv in the brain’s default mode network (DMN) that confounded FC by about 14.7% [55]. This error in FC estimates due to HRFv (FC-error) was smaller for within-lobe FC (12.6%) vs. between-lobes (15.6%), perhaps due to more variable vasculature in the latter case.
The HRF is not only different across individuals, but also different across clinical populations due to impairments in various factors contributing to HRFv. Our prior work has highlighted this in autism [78], post-traumatic stress disorder (PTSD) [57], obsessive-compulsive disorder (OCD) [63], bipolar disorder and schizophrenia [80]. They also demonstrated that HRF impairments are significant enough to confound FC group differences; and sometimes the confound was of a similar order of magnitude as FC impairments in these diseases. Other labs have made similar observations. For example, another study found that HRF alterations confound FC [81]. HRFv also confounded rat FC [82]. Using variable HRFs that are person-specific (vs. fixed HRF) improved connectivity estimates [83]. Taken together, emerging evidence indicates that HRFv is concerning for rs-fMRI connectivity and clinical applications.
5. The importance of studying HRF variability
Non-invasive measurements are not as ‘clean’ as invasive ones. There is always an effort to make fMRI data as ‘clean’ as possible by maximizing relative variance from neural sources. Examples of such efforts include minimizing physiological/thermal noise through ultra-high-field imaging (7T) [84], improved acquisition sequences [85,86], and better denoising [21,87]. Today we are in a reproducibility crisis in functional imaging [88,89,90], indicating that further advancements are needed to make this technology clinically more useful. We still do not understand the substantial intra- and inter-subject variability of fMRI outcomes. Further characterization of this variability is timely to maximize the percentage variance in BOLD explained by the underlying neural activity.
Effective modeling of HRFv could potentially contribute to this effort. Like head motion or physiological noise, HRFv is an undesirable confound reducing fMRI data fidelity. We predict that minimizing HRFv in fMRI data will improve data quality and enhance clinical discovery. Concerns about the HRF confound also exist among the broader neuroscience community. Examples include the viewpoint of cellular neuroscientists [29], special issue articles on HRFv [91], studies on non-neural factors and BOLD [92], and investigating the link between fMRI and neural activity [93].
6. Clinical research and HRF variability
Evidence suggests that HRFv is relevant for clinical and geriatric research. HRFs in older adults are different from their younger counterparts. Older adults have longer TTP and shorter RH, largely due to vascular factors [94]. Such change is associated with Alzheimer’s disease as well [95]. Longer TTP is also linked to reduced intelligence [96]. Aberrant HRFs have been observed in stress [97], mild traumatic brain injury [98], aging [94,99,100], isolated cervical dystonia [101], and levels of consciousness [102,103]. Such HRF changes are concerning because they are at least partly driven by non-neural factors and can confound FC group differences. Although studying non-neural factors in brain disorders is a valid enterprise, attributing FC group differences entirely to neural activity is problematic. HRFv in neurological disorders is yet to be investigated; however, our prior work in psychiatric conditions (autism [78], PTSD [57], schizophrenia and bipolar [80]) demonstrated that HRF impairments in these conditions invariably confounds FC group differences, and the confound can sometimes be of the same order of magnitude as group differences. Taken together, HRFv has implications across a spectrum of cognitive, psychiatric and geriatric domains, and perhaps also in other cases in which HRFv has yet to be investigated.
7. Demographic variables and HRF variability
Non-neural factors that affect the HRF also differ across two highly relevant variables – age and sex. Aging causes vascular degradation; blood vessels of older adults are stiffer and less pulsatile, typically resulting in weaker BOLD responses to the same magnitude of neural activity (i.e., shorter RH) as well as longer time for peak BOLD activity (longer TTP) [94,99,100]. There is evidence for altered HRF in older adults [94,99], although the confound of HRFv on young vs. old FC group differences has not yet been studied. There is motivation to hypothesize that accounting for HRFv is essential for minimizing these vascular and other non-neural age-related confounds in rs-fMRI data. In fact, a recent report [99] noted that “vascular confounds in fMRI studies are common. Despite over 10,000 BOLD-fMRI papers on aging, fewer than 20 have applied techniques to correct for vascular effects.”
Factors affecting the HRF also differ between women and men. Men have lower CBF independent of neural activity [104,105], which affects the HRF [6,106]. Other factors that exhibit sex differences include vascular physiology [107], capillary microcirculation [108], and overall cerebral hemodynamics [109]. Ignoring these factors by assuming a fixed canonical HRF is a potential confound in rs-fMRI studies that report data from both sexes, and/or perform women vs. men group comparisons. Despite this, HRF sex differences have never been directly studied. Hence, we next present limited data in this context.
8. Results on HRF differences between sexes and their impact on connectivity
We utilized 7T rs-fMRI data from our earlier HRF study (N=47, 22F/25M, healthy adults) [55] (data made public [110]) (please refer to these publications for data details). Kindly note that since this is a perspective article, we have not presented comprehensive results, but we hope that the results herein will encourage extensive follow-up studies. Briefly, upon standard pre-processing, we extracted mean region-of-interest (ROI) time series from DMN regions defined by the Power-Petersen atlas [1] and estimated FC between all DMN ROI pairs using Pearson’s correlation [64,111]. This procedure was repeated for two separate pipelines: data with deconvolution (DC) and no deconvolution (NDC), which differed only in HRFv. We also obtained HRF parameters for each ROI during deconvolution.
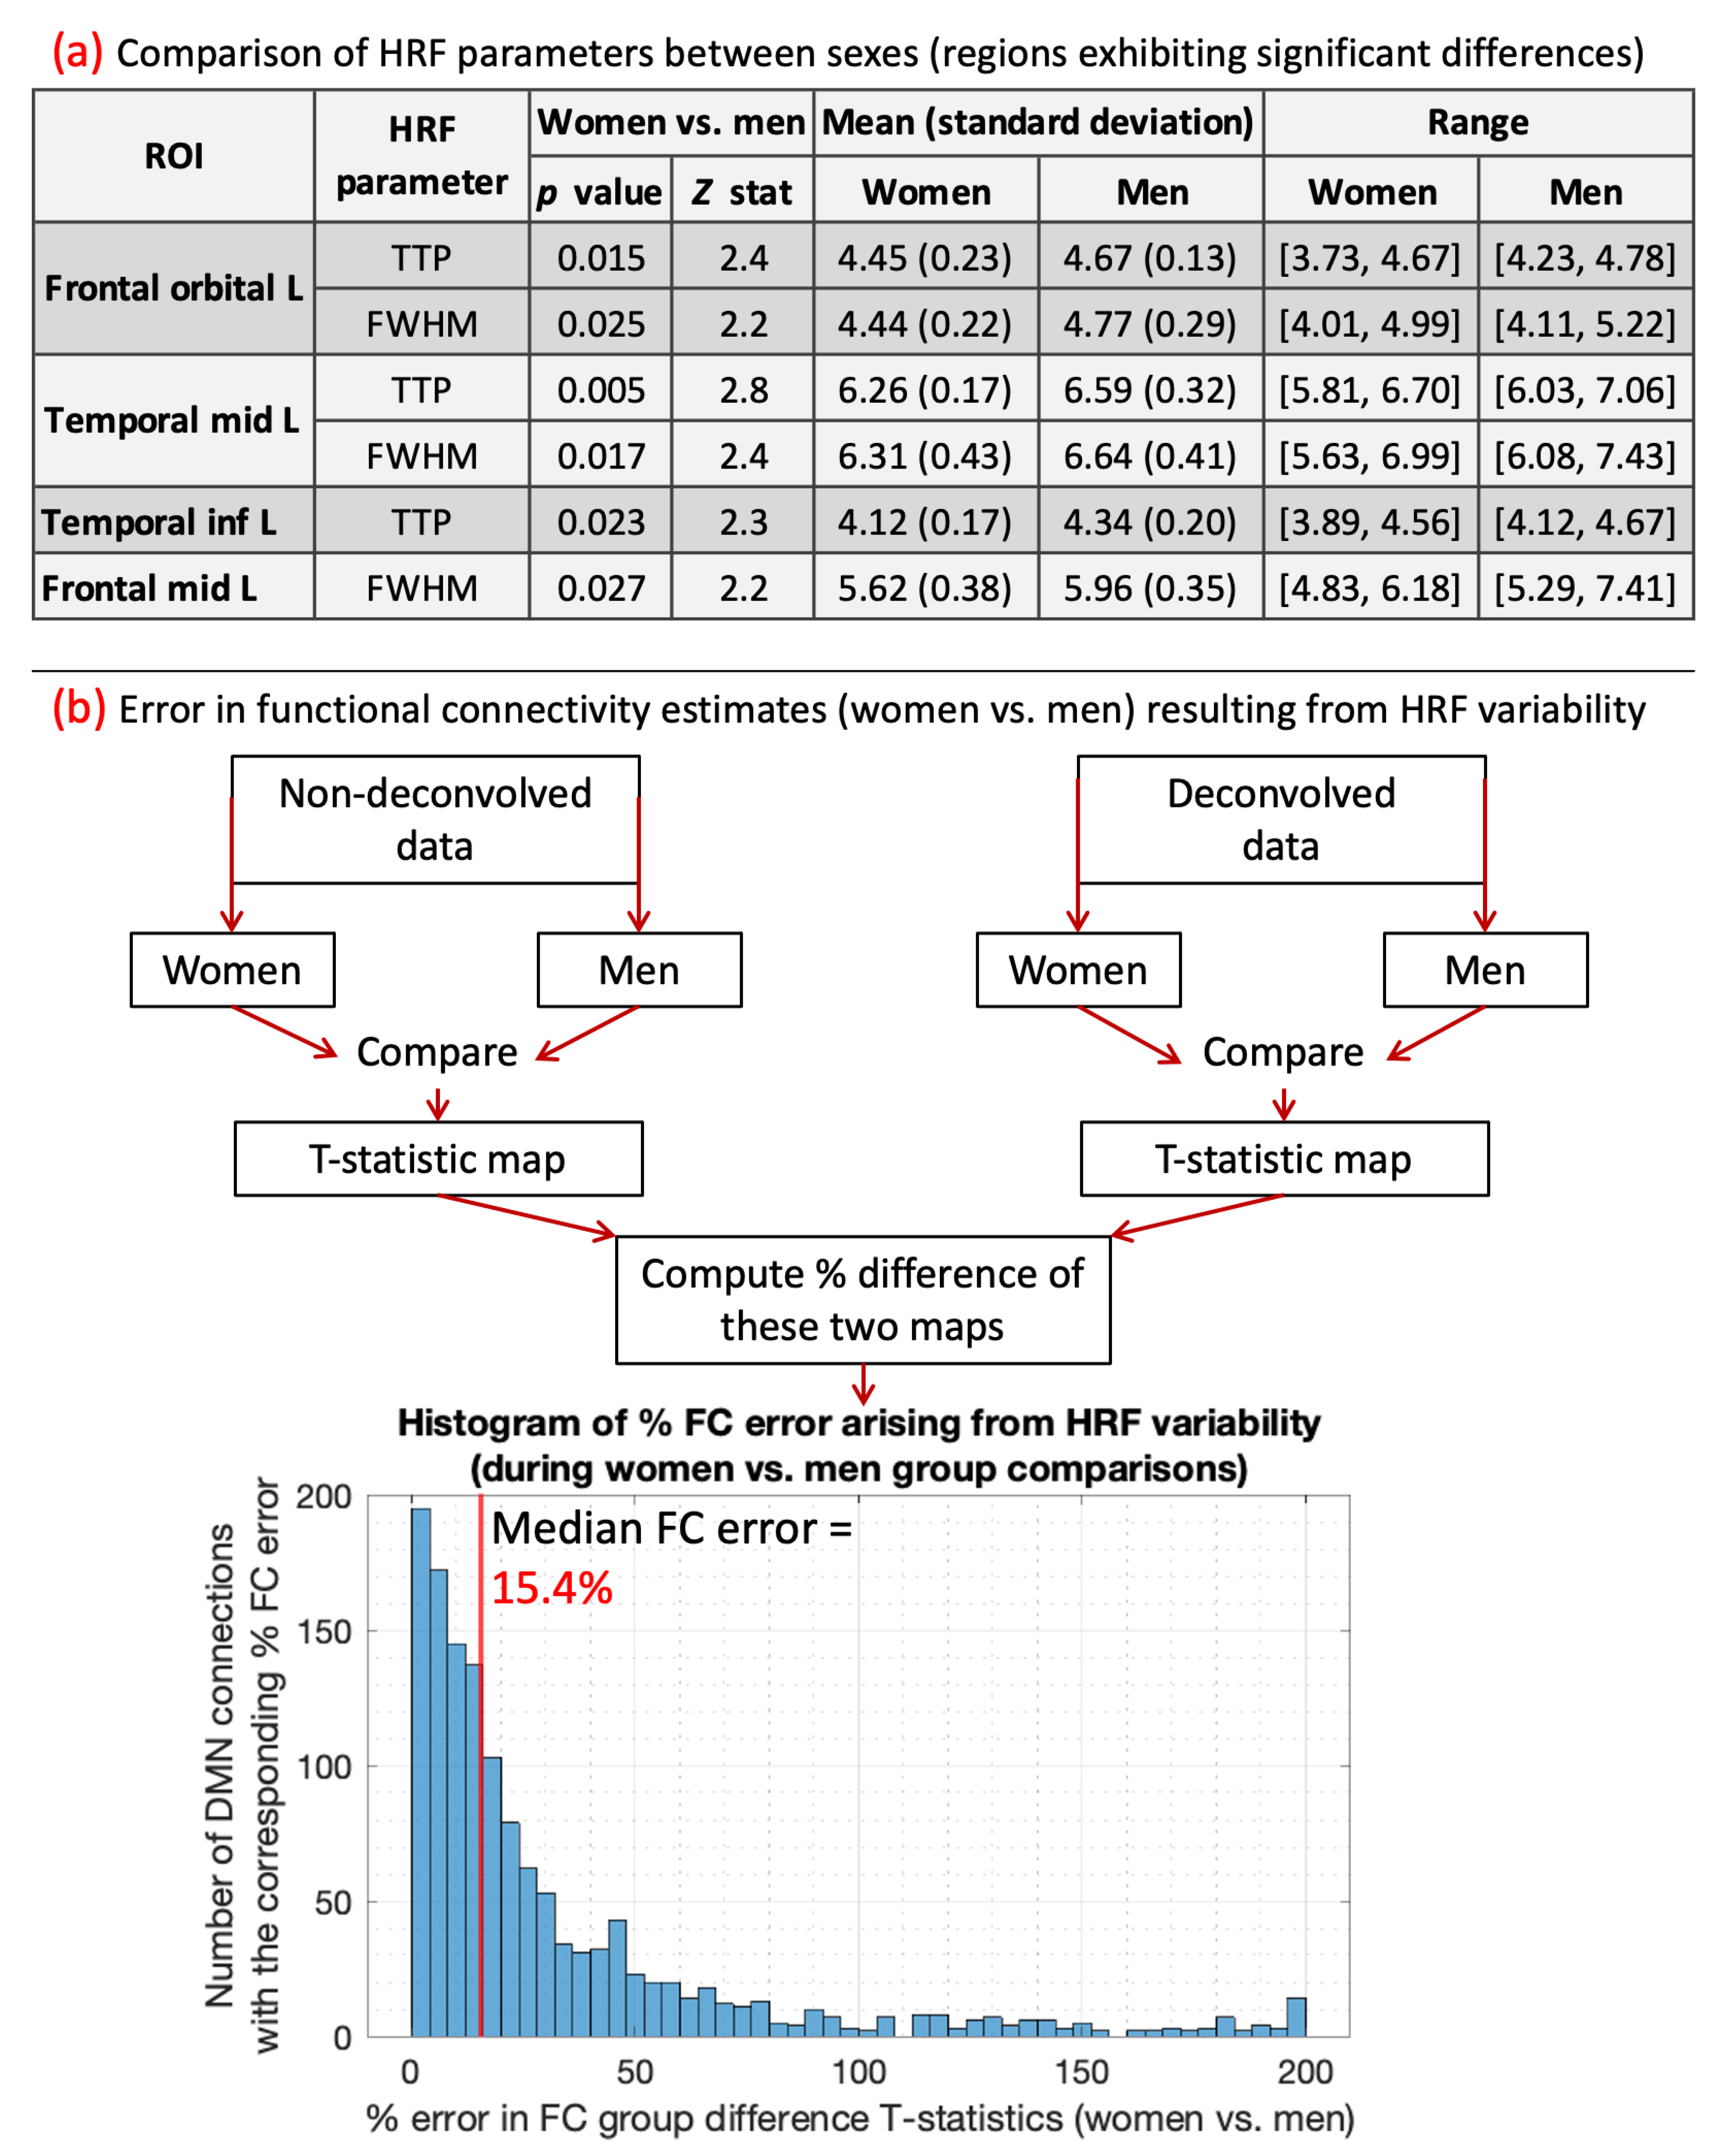
We compared ROI-level HRF parameters between men and women (p<0.05, FDR corrected). T-test was used for RH, and Wilcoxon rank-sum test was used for discrete variables (TTP, FWHM). There were no RH differences, but men had significantly longer TTP and/or FWHM in four regions (Table 1). Longer TTP/FWHM in men could be due to CBF and vascular differences between sexes [104,105,106,107,108,109]. The mean values averaged across all ROIs and subjects were as follows: RH (women=5.01, men=4.77), TTP (women=5.61s, men=5.73s), FWHM (women=5.62s, men=5.79s).
Next, we computed the error in FC group difference T-stats resulting from HRF differences. For this, women vs. men FC stats were performed separately for DC and NDC pipelines, and the percentage difference in resulting statistical maps was computed (Fig.2). HRF differences between sexes resulted in a 15.4% median FC error. After thresholding (p<0.05, FDR corrected), all three identified FCs were false positives (FC of temporal_inf_L/frontal_sup_L/fusiform_L with temporal_mid_L). Although only four regions and three connections exhibited significant HRF and FC differences, respectively, it must not be inferred that the rest of the regions or connections were unaffected by HRFv. These HRF/FC differences were large enough to be detected for our sample size and data quality, but that does not mean that the difference can be ignored in the other connections. The testament to this fact is that HRF differences between sexes resulted in 15.4% median FC error with contribution even from a vast number of regions/FCs outside of the significant ones (Fig.2). Our prior work has demonstrated the same [55,57,78,80]. Taken together, a measurable portion of sex differences in DMN were attributable to HRFv.
As a secondary result not related to sex differences, we also report whole-brain-level average metrics of variability in HRF parameters within and between healthy young adult subjects, because these were not reported in our earlier publication [55], but they support our conclusions and encourage future work. Of course, for the nature of this article, these results could be more complex and extensive. Using the same FC data, we (i) computed within-subjects variability of each HRF parameter as the mean percentage difference between all ROI pairs; and (ii) computed between-subjects variability of each HRF parameter as the mean percentage difference between all pairs of subjects. We used a t-test for RH and a rank-sum test for TTP/FWHM (p<0.05, FDR corrected). Within-subjects, we found on average 14.1% RH variability, 13.5% TTP and 13.4% FWHM variability. L/R orbitofrontal had the largest HRF difference with other regions (86%/65% RH, 43%/24% TTP, 42%/24% FWHM variability), perhaps due to susceptibility [11] and/or vascular [99] differences. Temporal lobe had larger variability than other lobes in RH (p=0.034), TTP (p=0.039) and FWHM (p=0.037). Between-lobe variability was higher than within-lobe in RH (p=0.039), TTP (p=0.028) and FWHM (p=0.041) (possibly due to vastly different vasculature across lobes). Between-subjects HRFv (RH: 29.8%, TTP: 28.5%, FWHM: 28.1%) was larger than within-subjects. The occipital lobe varied significantly less across subjects than other lobes in RH (p=0.048) and TTP (p=0.045).
Figure 2.
A flowchart illustrating our analysis and the final result obtained. The histogram shows the distribution of % FC error arising from men vs. women HRF differences. The median FC error was 15.4%, with a 95% confidence interval of [1.5% – 131.6%].
Figure 2.
A flowchart illustrating our analysis and the final result obtained. The histogram shows the distribution of % FC error arising from men vs. women HRF differences. The median FC error was 15.4%, with a 95% confidence interval of [1.5% – 131.6%].
9. The HRF in the spinal cord
The central nervous system (CNS), which includes the brain and spinal cord, is a single continuous entity. But prior HRF literature is exclusively focused on the brain. Cord rs-fMRI studies have so far not accounted for HRFv, except for a recent study [52]. If systematic brain HRF changes in pathological conditions translate to the cord, it is concerning because the cord is clinically relevant for several neurological diseases (e.g., multiple sclerosis [112], chronic pain [113], amyotrophic lateral sclerosis [114], transverse myelitis [115], ataxia [116], and spinal cord injury [117]). Cord impairments are being discovered in other pathologies (Alzheimer’s disease [118] and cerebral palsy [119]), suggesting that more disorders could involve the cord than we currently understand. HRFv could confound cord FC impairments in these diseases. Hence, characterizing HRFv in the spinal cord is clinically relevant and novel.
10. Discussion and conclusions
Herein we described prior evidence for HRFv and its confound on rs-fMRI FC and elaborated on this research's importance and clinical relevance. Unexplained variability in BOLD is a more significant concern today than before because connectivity is used in sophisticated contexts such as dynamics [120], single-subject-level prediction [121], laminar fMRI [122], and precision medicine [123]. HRFv matters to a larger extent for all the desired ‘precision’ and fidelity expected of rs-fMRI today. With fast fMRI acquisition becoming prevalent [86,124], accounting for HRFv is even more critical [16] to determine the neural/vascular origin of fMRI timing differences. Thus far, FC error arising only from spatial HRFv has been quantified, and only in parts of the brain and in small samples [55]. We provided limited data for FC error between sexes. Further research is required to quantify HRFv and FC error across various within- and between-subject comparison scenarios and demographic variables.
In summary, measurements of FC often involve unexplained variance between 40% (ML prediction) and 70% (behavioral association) [121,123]. While the underlying prediction/association models may be statistically significant and perform above chance, there is still a sizeable unexplained variance. We, therefore, argue that the HRF confound, typically in the range of 10–30%, may explain a part of this variance and thus should be commonly accounted for during rs-fMRI data pre-processing.
Author Contributions
D.R.: Conceptualization, Methodology, Software, Data Analysis, Investigation, Visualization, Writing - Original Draft, Reviewing and Editing. R.L.B.: Investigation, Writing - Reviewing and Editing, Supervision. G.D.: Conceptualization, Methodology, Data Acquisition, Investigation, Writing - Reviewing and Editing, Supervision.
Funding
The National Institutes of Health (NIH) provided support through grants R01EB027779 and R21EB031211 (RLB), and R01EY025978 (GD). Support was also received through the Athinoula A. Martinos Center for Biomedical Imaging (RLB) and the Auburn University MRI Research Center (GD). The content is solely the responsibility of the authors and does not necessarily represent the official views of the NIH.
Data Availability Statement
The source data used in this article is already publicly available [110]. Data specifically related to the presented results can be made available upon reasonable request to the corresponding author.
Conflicts of Interest
The authors declare that the research was conducted in the absence of any commercial or financial relationships that could be construed as a potential conflict of interest.
References
- Power, J.D.; Cohen, A.L.; Nelson, S.M.; Wig, G.S.; Barnes, K.A.; Church, J.A.; Vogel, A.C.; Laumann, T.O.; Miezin, F.M.; Schlaggar, B.L.; et al. Functional network organization of the human brain. Neuron 2011, 72, 665–678. [Google Scholar] [CrossRef] [PubMed]
- Nathan, P.J.; Phan, K.L.; Harmer, C.J.; Mehta, M.A.; Bullmore, E.T. Increasing pharmacological knowledge about human neurological and psychiatric disorders through functional neuroimaging and its application in drug discovery. Curr. Opin. Pharmacol. 2014, 14, 54–61. [Google Scholar] [CrossRef] [PubMed]
- Rosazza, C.; Minati, L. Resting-state brain networks: Literature review and clinical applications. Neurol. Sci. 2011, 32, 773–785. [Google Scholar] [CrossRef] [PubMed]
- Logothetis, N.K.; Pauls, J.; Augath, M.; Trinath, T.; Oeltermann, A. Neurophysiological investigation of the basis of the fMRI signal. Nature 2001, 412, 150–157. [Google Scholar] [CrossRef] [PubMed]
- Biessmann, F.; Murayama, Y.; Logothetis, N.; Müller, K.; Meinecke, F. Improved decoding of neural activity from fMRI signals using non-separable spatiotemporal deconvolutions. Neuroimage 2012, 61, 1031–1042. [Google Scholar] [CrossRef]
- Kim, J.H.; Ress, D. Arterial impulse model for the BOLD response to brief neural activation. Neuroimage 2016, 124, 394–408. [Google Scholar] [CrossRef]
- Duarte, J.V.; Pereira, J.M.; Quendera, B.; Raimundo, M.; Moreno, C.; Gomes, L.; Carrilho, F.; Castelo-Branco, M. Early disrupted neurovascular coupling and changed event level hemodynamic response function in type 2 diabetes: An fMRI study. J. Cereb. Blood Flow Metab. 2015, 35, 1671–1680. [Google Scholar] [CrossRef]
- Yang, H.S.; Liang, Z.; Yao, J.F.; Shen, X.; Frederick, B.D.; Tong, Y. Vascular effects of caffeine found in BOLD fMRI. J. Neurosci. Res. 2019, 97, 456–466. [Google Scholar] [CrossRef]
- Handwerker, D.A.; Ollinger, J.M.; M. D'Esposito Variation of BOLD hemodynamic responses across subjects and brain regions and their effects on statistical analyses. Neuroimage 2004, 21, 1639–1651. [Google Scholar] [CrossRef]
- Aguirre, G.K.; Zarahn, E.; D'esposito, M. "The variability of human, BOLD hemodynamic responses. Neuroimage 1998, 8, 360–369. [Google Scholar] [CrossRef]
- Buxton, R. Introduction to Functional Magnetic Resonance Imaging: Principles and Techniques. Energy 2002, 24, 523. [Google Scholar]
- Levin, J.; Ross, M.; Mendelson, J.; Kaufman, M.; Lange, N.; Maas, L.; Mello, N.; Cohen, B. ; Renshaw, Reduction in BOLD fMRI response to primary visual stimulation following alcohol ingestion. Psychiatry Res. 1998, 82, 135–146. [Google Scholar] [CrossRef]
- Noseworthy, M.D.; Alfonsi, J.; Bells, S. Attenuation of brain BOLD response following lipid ingestion. Hum. Brain Mapp. 2003, 20, 116–121. [Google Scholar] [CrossRef]
- Tong, Y.; Frederick, B.D. Tracking cerebral blood flow in BOLD fMRI using recursively generated regressors. Hum. Brain Mapp. 2014, 35, 5471–5485. [Google Scholar] [CrossRef]
- Bernier, M.; Cunnane, S.C.; Whittingstall, K. The morphology of the human cerebrovascular system. Hum. Brain Mapp. 2018, 39, 4962–4975. [Google Scholar] [CrossRef]
- Lewis, L.D.; Setsompop, K.; Rosen, B.R.; Polimeni, J.R. Stimulus-dependent hemodynamic response timing across the human subcortical-cortical visual pathway identified through high spatiotemporal resolution 7T fMRI. Neuroimage 2018, 181, 279–291. [Google Scholar] [CrossRef]
- Miezin, F.M.; Maccotta, L.; Ollinger, J.M.; Petersen, S.E.; Buckner, R.L. Characterizing the hemodynamic response: Effects of presentation rate, sampling procedure, and the possibility of ordering brain activity based on relative timing. Neuroimage 2000, 11, 735–759. [Google Scholar] [CrossRef]
- de Zwart, J.A.; Silva, A.C.; van Gelderen, P.; Kellman, P.; Fukunaga, M.; Chu, R.; Koretsky, A.P.; Frank, J.A.; Duyn, J.H. Temporal dynamics of the BOLD fMRI impulse response. Neuroimage 2005, 24. [Google Scholar] [CrossRef]
- Badillo, S.; Vincent, T. ; Ciuciu, Group-level impacts of within- and between-subject hemodynamic variability in fMRI. Neuroimage 2013, 82, 433–448. [Google Scholar] [CrossRef]
- Tagliazucchi, E.; Balenzuela, P.; Fraiman, D.; Chialvo, D.R. Criticality in large-scale brain fMRI dynamics unveiled by a novel point process analysis. Front. Physiol. 2012, 3, 15. [Google Scholar] [CrossRef]
- Power, J.D.; Schlaggar, B.L.; Petersen, S.E. Recent progress and outstanding issues in motion correction in resting state fMRI. Neuroimage 2015, 105, 536–551. [Google Scholar] [CrossRef] [PubMed]
- Wu, G.R.; Liao, W.; Stramaglia, S.; Ding, J.R.; Chen, H.; Marinazzo, D. A blind deconvolution approach to recover effective connectivity brain networks from resting state fMRI data. Med. Image Anal. 2013, 17, 365–374. [Google Scholar] [CrossRef] [PubMed]
- Havlicek, M.; Friston, K.J.; Jan, J.; Brazdil, M.; Calhoun, V.D. Dynamic modeling of neuronal responses in fMRI using cubature Kalman filtering. Neuroimage 2011, 56, 2109–2128. [Google Scholar] [CrossRef] [PubMed]
- Havlicek, M.; Roebroeck, A.; Friston, K.; Gardumi, A.; Ivanov, D.; Uludag, K. Physiologically informed dynamic causal modeling of fMRI data. Neuroimage 2015, 122, 355–372. [Google Scholar] [CrossRef] [PubMed]
- Karahanoğlu, F.I.; Caballero-Gaudes, C.; Lazeyras, F.; Van de Ville, D. Total activation: fMRI deconvolution through spatio-temporal regularization. Neuroimage 2013, 73, 121–134. [Google Scholar] [CrossRef]
- David, O.; Guillemain, I.; Saillet, S.; Reyt, S.; Deransart, S.; Segebarth, C.; Depaulis, A. Identifying neural drivers with functional MRI: An electrophysiological validation. PLoS Biol. 2008, 23, 2683–2697. [Google Scholar] [CrossRef]
- Wang, Y.; Katwal, S.; Rogers, B.; Gore, J.; Deshpande, G. Experimental Validation of Dynamic Granger Causality for Inferring Stimulus-evoked Sub-100ms Timing Differences from fMRI. IEEE Trans. Neural. Syst. Rehabil. Eng. 2017, 25, 539–546. [Google Scholar] [CrossRef]
- Feige, B.; Spiegelhalder, K.; Kiemen, A.; Bosch, O.G.; van Elst, L.T.; Hennig, J.; Seifritz, E.; Riemann, D. Distinctive time-lagged resting-state networks revealed by simultaneous EEG-fMRI. Neuroimage 2017, 145, 1–10. [Google Scholar] [CrossRef]
- Hall, C.N.; Howarth, C.; Kurth-Nelson, Z.; Mishra, A. Interpreting BOLD: Towards a dialogue between cognitive and cellular neuroscience. Philos. Trans. R Soc. Lond. B 2016, 371, 20150348. [Google Scholar] [CrossRef]
- Thomason, M.E.; Foland, L.C.; Glover, G.H. Calibration of BOLD fMRI using breath holding reduces group variance during a cognitive task. Hum. Brain Mapp. 2007, 28, 59–68. [Google Scholar] [CrossRef]
- McDonough, I.M.; Bender, A.; Patihis, L.; Stinson, E.A.; Letang, S.K.; Miller, W.S. The Trouble Interpreting fMRI Studies in Populations with Cerebrovascular Risk: The Use of a Subject-Specific Hemodynamic Response Function in a Study of Age, Vascular Risk, and Memory. bioRxiv 2019, 512343. [Google Scholar]
- Chang, C.; Thomason, M.E.; Glover, G.H. Mapping and correction of vascular hemodynamic latency in the BOLD signal. Neuroimage 2008, 43, 90–102. [Google Scholar] [CrossRef]
- Spano, V.R.; Mandell, D.M.; Poublanc, J.; Sam, K.; Battisti-Charbonney, A.; Pucci, O.; Han, J.S.; Crawley, A.P.; Fisher, J.A.; Mikulis, D.J. CO2 blood oxygen level-dependent MR mapping of cerebrovascular reserve in a clinical population: Safety, tolerability, and technical feasibility. Radiology 2013, 266, 592–598. [Google Scholar] [CrossRef]
- Urback, A.L.; MacIntosh, B.J.; Goldstein, B.I. Cerebrovascular reactivity measured by functional magnetic resonance imaging during breath-hold challenge: A systematic review. Neurosci. Biobehav. Rev. 2017, 79, 27–47. [Google Scholar] [CrossRef]
- Gitelman, D.R.; Penny, W.D.; Ashburner, J.; Friston, K.J. Modeling regional and psychophysiologic interactions in fMRI: The importance of hemodynamic deconvolution. Neuroimage 2003, 19, 200–207. [Google Scholar] [CrossRef]
- Gaudes, C.C.; Petridou, N.; Francis, S.T.; Dryden, I.L.; Gowland, P.A. Paradigm free mapping with sparse regression automatically detects single-trial functional magnetic resonance imaging blood oxygenation level dependent responses. Hum. Brain Mapp. 2013, 34, 501–518. [Google Scholar]
- Gaudes, C.C.; Petridou, N.; Dryden, I.L.; Bai, L.; Francis, S.T.; Gowland, P.A. Detection and characterization of single-trial fMRI bold responses: Paradigm free mapping. Hum. Brain Mapp. 2011, 32, 1400–1418. [Google Scholar] [CrossRef]
- Hernandez-Garcia, L.; Ulfarsson, M.O. Neuronal event detection in fMRI time series using iterative deconvolution techniques. Magn. Reson. Imaging 2011, 29, 353–364. [Google Scholar] [CrossRef]
- Bush, K.; Cisler, J. Decoding neural events from fMRI BOLD signal: A comparison of existing approaches and development of a new algorithm. Magn. Reson. Imaging 2013, 31, 976–989. [Google Scholar] [CrossRef]
- Bush, K.; Cisler, J.; Bian, J.; Hazaroglu, G.; Hazaroglu, O.; Kilts, C. Improving the precision of fMRI BOLD signal deconvolution with implications for connectivity analysis. Magn. Reson. Imaging 2015, 33, 1314–1323. [Google Scholar] [CrossRef]
- Khalidov, I.; Fadili, J.; Lazeyras, F.; Van De Ville, D.; Unser, M. Activelets: Wavelets for sparse representation of hemodynamic responses. Signal Process. 2011, 91, 2810–2821. [Google Scholar] [CrossRef]
- Lopes, R.; Lina, J.M.; Fahoum, F.; Gotman, J. Detection of epileptic activity in fMRI without recording the EEG. Neuroimage 2012, 60, 1867–1879. [Google Scholar] [CrossRef] [PubMed]
- Taylor, A.J.; Kim, J.H.; Ress, D. Characterization of the hemodynamic response function across the majority of human cerebral cortex. Neuroimage 2018, 173, 322–331. [Google Scholar] [CrossRef] [PubMed]
- Gonzalez-Castillo, J.; Saad, Z.; Handwerker, D.; Inati, S.; Brenowitz, N. ; Bandettini, Whole-brain, time-locked activation with simple tasks revealed using massive averaging and model-free analysis. Proc. Natl. Acad. Sci. USA 2012, 109, 5487–5492. [Google Scholar] [CrossRef]
- Sreenivasan, K.R.; Havlicek, M.; Deshpande, G. Non-parametric hemodynamic deconvolution of fMRI using homomorphic filtering. IEEE Trans. Med. Imaging 2015, 34, 1155–1163. [Google Scholar] [CrossRef]
- Cherkaoui, H.; Moreau, T.; Halimi, A. ; Ciuciu, Sparsity-based Blind Deconvolution of Neural Activation Signal in FMRI. In Proceedings of the IEEE International Conference on Acoustics, Speech and Signal Processing (ICASSP), Brighton, UK; 2019. [Google Scholar]
- Wu, G.; Colenbier, N.; Van Den Bossche, S.; Clauw, K.; Johri, A.; Tandon, M.; Marinazzo, D. rsHRF: A toolbox for resting-state HRF estimation and deconvolution. Neuroimage 2021, 244, 118591. [Google Scholar] [CrossRef]
- Friston, K.J.; Harrison, L.; Penny, W. Dynamic causal modelling. Neuroimage 2013, 19, 1273–1302. [Google Scholar] [CrossRef]
- Friston, K.J.; Kahan, J.; Biswal, B.; Razi, A. A DCM for resting state fMRI. Neuroimage 2014, 94, 396–407. [Google Scholar] [CrossRef]
- Karahanoğlu, F.I.; Van De Ville, D. Transient brain activity disentangles fMRI resting-state dynamics in terms of spatially and temporally overlapping networks. Nat. Commun. 2015, 6, 7751. [Google Scholar] [CrossRef]
- Zöller, D.; Sandini, C.; Schaer, M.; Eliez, S.; Bassett, D.S.; Van De Ville, D. Structural control energy of resting-state functional brain states reveals less cost-effective brain dynamics in psychosis vulnerability. Hum. Brain Mapp. 2021, 42, 2181–2200. [Google Scholar] [CrossRef]
- Kinany, N.; Pirondini, E.; Micera, S.; Van De Ville, D. Dynamic Functional Connectivity of Resting-State Spinal Cord fMRI Reveals Fine-Grained Intrinsic Architecture. Neuron 2020, 108, 424–435. [Google Scholar] [CrossRef]
- Saad, Z.S.; Gotts, S.J.; Murphy, K.; Chen, G.; Jo, H.J.; Martin, A.; Cox, R.W. Trouble at rest: How correlation patterns and group differences become distorted after global signal regression. Brain Connect. 2012, 2, 25–32. [Google Scholar] [CrossRef]
- Glover, G. Deconvolution of impulse response in event-related BOLD fMRI. Neuroimage 1999, 9, 416–429. [Google Scholar] [CrossRef]
- Rangaprakash, D.; Wu, G.-R.; Marinazzo, D.; Hu, X.; Deshpande, G. Hemodynamic response function (HRF) variability confounds resting-state fMRI functional connectivity. Magn. Reson. Med. 2018, 80, 1697–1713. [Google Scholar] [CrossRef]
- Rangaprakash, D.; Deshpande, G.; Daniel, T.; Goodman, A.; Robinson, J.; Salibi, N.; Katz, J.; Denney, T.; Dretsch, M. Compromised Hippocampus-Striatum Pathway as a Potential Imaging Biomarker of Mild Traumatic Brain Injury and Posttraumatic Stress Disorder. Hum. Brain Mapp. 2017, 38, 2843–2864. [Google Scholar] [CrossRef]
- Rangaprakash, D.; Dretsch, M.N.; Yan, W.; Katz, J.S.; Denney, T.S.; Deshpande, G. Hemodynamic variability in soldiers with trauma: Implications for functional MRI connectivity studies. NeuroImage Clin. 2017, 16, 409–417. [Google Scholar] [CrossRef]
- Boly, M.; Sasai, S.; Gosseries, O.; Oizumi, M.; Casali, A.; Massimini, M.; Tononi, G. Stimulus set meaningfulness and neurophysiological differentiation: A functional magnetic resonance imaging study. PLoS ONE 2015, 10, e0125337. [Google Scholar] [CrossRef]
- Rangaprakash, D.; Dretsch, M.N.; Yan, W.; Katz, J.S.; Denney, T.S.; Deshpande, G. Hemodynamic response function parameters obtained from resting-state functional MRI data in soldiers with trauma. Data Brief 2017, 14, 558–562. [Google Scholar] [CrossRef]
- Amico, E.; Gomez, F.; Di Perri, C.; Vanhaudenhuyse, A.; Lesenfants, D.; Boveroux, P.; Bonhomme, V.; Brichant, J.F.; Marinazzo, D.; Laureys, S. Posterior cingulate cortex-related co-activation patterns: A resting state FMRI study in propofol-induced loss of consciousness. PLoS ONE 2014, 9, e100012. [Google Scholar] [CrossRef]
- Lamichhane, B.; Adhikari, B.M.; Brosnan, S.F.; Dhamala, M. The neural basis of perceived unfairness in economic exchanges. Brain Connect. 2014, 4, 619–630. [Google Scholar] [CrossRef]
- Rangaprakash, D.; Dretsch, M.N.; Venkatraman, A.; Katz, J.S.; Denney, T.S.; Deshpande, G. Identifying Disease Foci from Static and Dynamic Effective Connectivity Networks: Illustration in Soldiers with Trauma. Hum. Brain Mapp. 2018, 39, 264–287. [Google Scholar] [CrossRef] [PubMed]
- Rangaprakash, D.; Tadayonnejad, R.; Deshpande, G. ; J. O'Neill; Feusner, J. FMRI hemodynamic response function (HRF) as a novel marker of brain function: Applications for understanding obsessive-compulsive disorder pathology and treatment response. Brain Imaging Behav. [CrossRef]
- Noble, S.; Scheinost, D.; Constable, R. A decade of test-retest reliability of functional connectivity: A systematic review and meta-analysis. Neuroimage 2019, 203, 116157. [Google Scholar] [CrossRef]
- Power, J.; Cohen, A.; Nelson, S.; Wig, G.; Barnes, K.; Church, J.; Vogel, A.; Laumann, T.; Miezin, F.; Schlaggar, B.; et al. Functional network organization of the human brain. Neuron 2011, 72, 665–678. [Google Scholar] [CrossRef] [PubMed]
- Deshpande, G.; Sathian, K.; Hu, X. Effect of hemodynamic variability on Granger causality analysis of fMRI. Neuroimage 2010, 52, 884–896. [Google Scholar] [CrossRef] [PubMed]
- Lacey, S.; Stilla, R.; Sreenivasan, K.; Deshpande, G.; Sathian, K. Spatial imagery in haptic shape perception. Neuropsychologia 2014, 60, 144–158. [Google Scholar] [CrossRef]
- Feng, C.; Deshpande, G.; Liu, C.; Gu, R.; Luo, Y.-J.; Krueger, F. Diffusion of responsibility attenuates altruistic punishment: A functional magnetic resonance imaging effective connectivity study. Hum. Brain Mapp. 2015, 37, 663–677. [Google Scholar] [CrossRef]
- Hampstead, B.M.; Khoshnoodi, M.; Yan, W.; Deshpande, G.; Sathian, K. Patterns of effective connectivity between memory encoding and retrieval differ between patients with mild cognitive impairment and healthy older adults. Neuroimage 2016, 124, 997–1008. [Google Scholar] [CrossRef]
- Ryali, S.; Supekar, K.; Chen, T.; Menon, V. Multivariate dynamical systems models for estimating causal interactions in fMRI. Neuroimage 2011, 54, 807–823. [Google Scholar] [CrossRef]
- Ryali, S.; Chen, T.; Supekar, K.; Tu, T.; Kochalka, J.; Cai, W.; Menon, V. Multivariate dynamical systems-based estimation of causal brain interactions in fMRI: Group-level validation using benchmark data, neurophysiological models and human connectome project data. J. Neurosci. Methods 2016, 268, 142–153. [Google Scholar] [CrossRef]
- Ryali, S.; Shih, Y.Y.; Chen, T.; Kochalka, J.; Albaugh, D.; Fang, Z.; Supekar, K.; Lee, J.H.; Menon, V. Combining optogenetic stimulation and fMRI to validate a multivariate dynamical systems model for estimating causal brain interactions. Neuroimage 2016, 132, 398–405. [Google Scholar] [CrossRef]
- Handwerker, D.A.; Gonzalez-Castillo, J.; M. D'Esposito; Bandettini, P.A. The continuing challenge of understanding and modeling hemodynamic variation in fMRI. Neuroimage 2012, 62, 1017–1023. [Google Scholar] [CrossRef]
- Havlicek, M.; Jan, J.; Brazdil, M.; Calhoun, V. Dynamic Granger causality based on Kalman filter for evaluation of functional network connectivity in fMRI data. Neuroimage 2010, 53, 65–77. [Google Scholar] [CrossRef]
- Wang, Y.; David, O.; Hu, X.; Deshpande, G. Can Patel's τ accurately estimate directionality of connections in brain networks from fMRI? Magn. Reson. Med. 2017, 78, 2003–2010. [Google Scholar] [CrossRef]
- Tak, S.; Polimeni, J.R.; Wang, D.J.; Yan, L.; Chen, J.J. Associations of resting-state fMRI functional connectivity with flow-BOLD coupling and regional vasculature. Brain Connect. 2015, 5, 137–146. [Google Scholar] [CrossRef]
- Bright, M.G.; Whittaker, J.R.; Driver, I.D.; Murphy, K. Vascular physiology drives functional brain networks. Neuroimage 2020, 217, 116907. [Google Scholar] [CrossRef]
- Yan, W.; Rangaprakash, D.; Deshpande, G. Aberrant hemodynamic responses in Autism: Implications for resting state fMRI functional connectivity studies. NeuroImage Clin. 2018, 19, 320–330. [Google Scholar] [CrossRef]
- Yan, W.; Rangaprakash, D.; Deshpande, G. Hemodynamic response function parameters obtained from resting state BOLD fMRI data in subjects with Autism Spectrum Disorder and matched healthy controls. Data Brief 2017, 14, 558–562. [Google Scholar]
- Deshpande, G.; Rangaprakash, D.; Yan, W.; Liddle, P.; Palaniyappan, L. Characterization of Hemodynamic Alterations in Schizophrenia and Bipolar Disorder and their Effect on Resting-state Functional Connectivity. In Proceedings of the Schizophrenia International Research Society Conference (SIRS), Florence, Italy, April 2018. [Google Scholar]
- Archila-Meléndez, M.E.; Sorg, C.; Preibisch, C. Modeling the impact of neurovascular coupling impairments on BOLD-based functional connectivity at rest. Neuroimage 2020, 218, 116871. [Google Scholar] [CrossRef]
- Peng, S.L.; Chen, C.M.; Huang, C.Y.; Shih, C.T.; Huang, C.W.; Chiu, S.C.; Shen, W.C. Effects of Hemodynamic Response Function Selection on Rat fMRI Statistical Analyses. Front. Neurosci. 2019, 13, 400. [Google Scholar] [CrossRef]
- Duffy, K.A.; Fisher, Z.F.; Arizmendi, C.A.M.P.; Hopfinger, J.; Cohen, J.R.; Beltz, A.M.; Lindquist, M.A.; Hallquist, M.N.; Gates, K.M. Detecting Task-Dependent Functional Connectivity in Group Iterative Multiple Model Estimation with Person-Specific Hemodynamic Response Functions. Brain Connect. 2021. [Google Scholar] [CrossRef]
- Barry, R.L.; Vannesjo, S.J.; By, S.; Gore, J.C.; Smith, S.A. Spinal cord MRI at 7T. Neuroimage 2018, 168, 437–451. [Google Scholar] [CrossRef] [PubMed]
- Islam, H.; Law, C.; Weber, K.A.; Mackey, S.C.; Glover, G.H. Dynamic per slice shimming for simultaneous brain and spinal cord fMRI. Magn. Reson. Med. 2019, 81, 825–838. [Google Scholar] [CrossRef] [PubMed]
- Barth, M.; Breuer, F.; Koopmans, P.; Norris, D.; Poser, B. Simultaneous multislice (SMS) imaging techniques. Magn. Reson. Med. 2016, 75, 63–81. [Google Scholar] [CrossRef]
- Glover, G.H.; Li, T.Q.; Ress, D. Image-based method for retrospective correction of physiological motion effects in fMRI: RETROICOR. Magn. Reson. Med. 2000, 44, 162–167. [Google Scholar] [CrossRef] [PubMed]
- Gorgolewski, K.J.; Poldrack, R.A. A Practical Guide for Improving Transparency and Reproducibility in Neuroimaging Research. PLoS Biol. 2016, 14, e1002506. [Google Scholar] [CrossRef]
- Poldrack, R.A.; Baker, C.I.; Durnez, J.; Gorgolewski, K.J.; Matthews, P.M.; Munafò, M.R.; Nichols, T.E.; Poline, J.B.; Vul, E.; Yarkoni, T. Scanning the horizon: Towards transparent and reproducible neuroimaging research. Nature reviews. Neuroscience 2017, 18, 115–126. [Google Scholar]
- Osmanlıoğlu, Y.; Alappatt, J.A.; Parker, D.; Verma, R. Analysis of Consistency in Structural and Functional Connectivity of Human Brain. in Proceedings. IEEE Int. Symp. Biomed. Imaging 2020. [Google Scholar]
- Ekstrom, A.D. Regional variation in neurovascular coupling and why we still lack a Rosetta Stone. Philosophical transactions of the Royal Society of London. Ser. B Biol. Sci. 2021, 376, 20190634. [Google Scholar] [CrossRef]
- Das, A.; Murphy, K.; Drew, P.J. Rude mechanicals in brain haemodynamics: Non-neural actors that influence blood flow. Philosophical transactions of the Royal Society of London. Ser. B Biol. Sci. 2021, 376, 20190635. [Google Scholar] [CrossRef]
- Mishra, A.; Hall, C.N.; Howarth, C.; Freeman, R.D. Key relationships between non-invasive functional neuroimaging and the underlying neuronal activity. Philosophical transactions of the Royal Society of London. Ser. B Biol. Sci. 2021, 376, 20190622. [Google Scholar] [CrossRef]
- West, K.L.; Zuppichini, M.D.; Turner, M.P.; Sivakolundu, D.K.; Zhao, Y.; Abdelkarim, D.; Spence, J.S.; Rypma, B. BOLD hemodynamic response function changes significantly with healthy aging. Neuroimage 2019, 188, 198–207. [Google Scholar] [CrossRef]
- Shan, Z.Y.; Vinkhuyzen, A.; Thompson, P.M.; McMahon, K.L.; Blokland, G.; de Zubicaray, G.I.; Calhoun, V.; Martin, N.G.; Visscher, P.M.; Wright, M.J.; et al. Genes influence the amplitude and timing of brain hemodynamic responses. Neuroimage 2016, 124, 663–671. [Google Scholar] [CrossRef]
- Anderson, A.E.; Diaz-Santos, M.; Frei, S.; Dang, B.H.; Kaur, P.; Lyden, P.; Buxton, R.; Douglas, P.K.; Bilder, R.M.; Esfandiari, M.; et al. Hemodynamic latency is associated with reduced intelligence across the lifespan: An fMRI DCM study of aging, cerebrovascular integrity, and cognitive ability. Brain Struct. Funct. 2020, 225, 1705–1717. [Google Scholar] [CrossRef]
- Elbau, I.G.; Brücklmeier, B.; Uhr, M.; Arloth, J.; Czamara, D.; Spoormaker, V.I.; Czisch, M.; Stephan, K.E.; Binder, E.B.; Sämann, P.G. The brain's hemodynamic response function rapidly changes under acute psychosocial stress in association with genetic and endocrine stress response markers. Proc. Natl. Acad. Sci. USA 2018, 115, E10206–E10215. [Google Scholar] [CrossRef]
- Mayer, A.R.; Toulouse, T.; Klimaj, S.; Ling, J.M.; Pena, A.; Bellgowan, P.S. Investigating the properties of the hemodynamic response function after mild traumatic brain injury. J. Neurotrauma 2014, 31, 189–197. [Google Scholar] [CrossRef]
- Tsvetanov, K.A.; Henson, R.; Rowe, J.B. Separating vascular and neuronal effects of age on fMRI BOLD signals. Philosophical transactions of the Royal Society of London. Ser. B Biol. Sci. 2021, 376, 20190631. [Google Scholar] [CrossRef]
- Yabluchanskiy, A.; Nyul-Toth, A.; Csiszar, A.; Gulej, R.; Saunders, D.; Towner, R.; Turner, M.; Zhao, Y.; Abdelkari, D.; Rypma, B.; et al. Age-related alterations in the cerebrovasculature affect neurovascular coupling and BOLD fMRI responses: Insights from animal models of aging. Psychophysiology 2020, e13718. [Google Scholar] [CrossRef]
- Berman, B.D.; Groth, C.L.S.E.; Sillau, S.H.; Sutton, B.; Legget, K.T.; Tregellas, J.R. Hemodynamic responses are abnormal in isolated cervical dystonia. J. Neurosci. Res. 2020, 98, 692–703. [Google Scholar] [CrossRef]
- Wu, G.R.; Di Perri, C.; Charland-Verville, V.; Martial, C.; Carrière, M.; Vanhaudenhuyse, A.; Laureys, S.; Marinazzo, D. Modulation of the spontaneous hemodynamic response function across levels of consciousness. Neuroimage 2019, 200, 450–459. [Google Scholar] [CrossRef]
- Gemma, M.; de Vitis, A.; Baldoli, C.; Calvi, M.R.; Blasi, V.; Scola, E.; Nobile, L.; Iadanza, A.; Scotti, G.; Beretta, L. Functional magnetic resonance imaging (fMRI) in children sedated with propofol or midazolam. J. Neurosurg. Anesthesiol. 2009, 21, 253–258. [Google Scholar] [CrossRef]
- Ibaraki, M.; Shinohara, Y.; Nakamura, K.; Miura, S.; Kinoshita, F.; Kinoshita, T. Interindividual variations of cerebral blood flow, oxygen delivery, and metabolism in relation to hemoglobin concentration measured by positron emission tomography in humans. J. Cereb. Blood Flow Metab. 2010, 30, 1296–1305. [Google Scholar] [CrossRef] [PubMed]
- Aanerud, J.; Borghammer, P.; Rodell, A.; Jónsdottir, K.Y.; Gjedde, A. Sex differences of human cortical blood flow and energy metabolism. J. Cereb. Blood Flow Metab. 2017, 37, 2433–2440. [Google Scholar] [CrossRef]
- Golestani, A.M.; Wei, L.L.; Chen, J.J. Quantitative mapping of cerebrovascular reactivity using resting-state BOLD fMRI: Validation in healthy adults. Neuroimage 2016, 138, 147–163. [Google Scholar] [CrossRef] [PubMed]
- Boese, A.C.; Kim, S.C.; Yin, K.J.; Lee, J.P.; Hamblin, M.H. Sex differences in vascular physiology and pathophysiology: Estrogen and androgen signaling in health and disease. American journal of physiology. Heart Circ. Physiol. 2017, 313, H524–H545. [Google Scholar] [CrossRef] [PubMed]
- Huxley, V.H.; Kemp, S.S. Sex-Specific Characteristics of the Microcirculation. Adv. Exp. Med. Biol. 2018, 1065, 307–328. [Google Scholar]
- Barnes, J.N. Sex-specific factors regulating pressure and flow. Exp. Physiol. 2017, 102, 1385–1392. [Google Scholar] [CrossRef]
- Rangaprakash, D.; Wu, G.-R.; Marinazzo, D.; Hu, X.; Deshpande, G. Parameterized hemodynamic response function data of healthy individuals obtained from resting-state functional MRI in a 7T MRI scanner. Data Brief 2018, 17, 1175–1179. [Google Scholar] [CrossRef]
- Mejia, A.F.; Nebel, M.B.; Barber, A.D.; Choe, A.S.; Pekar, J.J.; Caffo, B.S.; Lindquist, M.A. Improved estimation of subject-level functional connectivity using full and partial correlation with empirical Bayes shrinkage. Neuroimage 2018, 172, 478–491. [Google Scholar] [CrossRef]
- Conrad, B.N.; Barry, R.L.; Rogers, B.P.; Maki, S.; Mishra, A.; Thukral, S.; Sriram, S.; Bhatia, A.; Pawate, S.; Gore, J.C.; et al. Multiple sclerosis lesions affect intrinsic functional connectivity of the spinal cord. Brain 2018, 141, 1650–1664. [Google Scholar] [CrossRef]
- Reckziegel, D.; Vachon-Presseau, E.; Petre, B.; Schnitzer, T.; Baliki, M.; Apkarian, A. Deconstructing biomarkers for chronic pain: Context- and hypothesis-dependent biomarker types in relation to chronic pain. Pain 2019, 160, S37–S48. [Google Scholar] [CrossRef]
- de Albuquerque, M.; Branco, L.M.; Rezende, T.J.; de Andrade, H.M.; Nucci, A.; França, M.C. Longitudinal evaluation of cerebral and spinal cord damage in Amyotrophic Lateral Sclerosis. Neuroimage Clin. 2017, 14, 269–276. [Google Scholar] [CrossRef]
- Cacciaguerra, L.; Meani, A.; Mesaros, S.; et al. Brain and cord imaging features in neuromyelitis optica spectrum disorders. Ann. Neurol. 2019, 85, 371–384. [Google Scholar] [CrossRef]
- Faber, J.; Schaprian, T.; Berkan, K.; Reetz, K.; França, M.C.; de Rezende, T.; Hong, J.; Liao, W.; van de Warrenburg, B.; et al. Regional Brain and Spinal Cord Volume Loss in Spinocerebellar Ataxia Type 3. Mov. Disord. 2021, in press. [CrossRef]
- Freund, P.; Seif, M.; Weiskopf, N.; et al. MRI in traumatic spinal cord injury: From clinical assessment to neuroimaging biomarkers. Lancet Neurol. 2019, 18, 1123–1135. [Google Scholar] [CrossRef]
- Lorenzi, R.M.; Palesi, F.; Castellazzi, G.; Vitali, P.; Anzalone, N.; Bernini, S.; Ramusino, M.C.; Sinforiani, E.; Micieli, G.; Costa, A.; et al. Unsuspected Involvement of Spinal Cord in Alzheimer Disease. Front. Cell. Neurosci. 2020, 14, 6. [Google Scholar] [CrossRef]
- Trevarrow, M.P.; Baker, S.E.; Wilson, T.W.; Kurz, M.J. Microstructural changes in the spinal cord of adults with cerebral palsy. Dev. Med. Child Neurol. 2021, in press. [CrossRef]
- Preti, M.; Bolton, T.; Van De Ville, D. The dynamic functional connectome: State-of-the-art and perspectives. Neuroimage 2016, 160, 41–54. [Google Scholar] [CrossRef]
- Jollans, L.; Boyle, R.; Artiges, E.; Banaschewski, T.; Desrivières, S.; Grigis, A.; Martinot, J.L.; Paus, T.; Smolka, M.N.; Walter, H.; et al. Quantifying performance of machine learning methods for neuroimaging data. Neuroimage 2019, 199, 351–365. [Google Scholar] [CrossRef]
- Finn, E.S.; Huber, L.; Bandettini, P.A. Higher and deeper: Bringing layer fMRI to association cortex. Prog. Neurobiol. 2020, 101930. [Google Scholar] [CrossRef]
- Finn, E.S.; Shen, X.; Scheinost, D.; Rosenberg, M.D.; Huang, J.; Chun, M.M.; Papademetris, X.; Constable, R.T. Functional connectome fingerprinting: Identifying individuals using patterns of brain connectivity. Nat. Neurosci. 2015, 18, 1664–1671. [Google Scholar] [CrossRef]
- Preibisch, C.; Castrillón, J.; Bührer, M.; Riedl, V. Evaluation of Multiband EPI Acquisitions for Resting State fMRI. PLoS ONE 2015, 10, e0136961. [Google Scholar] [CrossRef] [PubMed]
Disclaimer/Publisher’s Note: The statements, opinions and data contained in all publications are solely those of the individual author(s) and contributor(s) and not of MDPI and/or the editor(s). MDPI and/or the editor(s) disclaim responsibility for any injury to people or property resulting from any ideas, methods, instructions or products referred to in the content. |
© 2023 by the authors. Licensee MDPI, Basel, Switzerland. This article is an open access article distributed under the terms and conditions of the Creative Commons Attribution (CC BY) license (http://creativecommons.org/licenses/by/4.0/).
Copyright: This open access article is published under a Creative Commons CC BY 4.0 license, which permit the free download, distribution, and reuse, provided that the author and preprint are cited in any reuse.


