Submitted:
28 February 2023
Posted:
28 February 2023
You are already at the latest version
Abstract
The holy town of Joshimath, gateway to the India-China border and religious places like Badrinath, Hemkunt Sahab, Valley of flowers in the Uttarakhand state of India experienced cracks in many of the residential and commercial buildings in the month of November-December 2022 which created panic and relocation of people. The reason(s) for the subsidence is still not known but using the InSAR technology and data from Sentinel-1, SAR data for the region was processed using HyP3 and MintPy for January-December 2022 to understand when the phenomenon started and how much uplift/subsidence the area has underwent in the last one year, as no such study is available till today. The entire town can be classified into two zones with respect to the annual subsidence values. Severe subsidence has been observed in the North and East regions whereas most of the southern region experienced moderate to low subsidence. Since the town is built on the debris of an old landslide, the subsidence may be attributed to the change in the course of the underground water channels due to heavy and continuous construction happening in the region and also due to drop in the water table. The results shows that the subsidence in the region was ongoing since June (from January till May, almost negligible vertical movement was recorded) which accelerated after September (when an uplift was recorded which lasted till October), while the subsidence peaked in the month of December with recorded subsidence of as much as 10 cm in some areas located around the Joshimath town, where most of the residential and commercial buildings are located.
Keywords:
Joshimath
; InSAR
; HyP3
; MintPY
INTRODUCTION
Joshimath, a city of Chamoli district in Indian state of Uttarakhand is witnessing subsidence from many years. But in the first week of January 2023, approximately 670 of 4500 buildings started developing cracks which created social panic. Immediately people were evacuated to safer places to prevent any human life loss. The town is situated at a height of 6150 ft, in the north Himalayas along the Rishikesh-Badrinath National Highway (NH-7) bordered by Karmanasa and Dhaknala rivers to the west and east respectively and surrounded by Dhauliganga and Alaknanda rivers. It also lies between the Malari Fault (MF) in the north and Main Central Thrust (MCT) in the south. The region has experienced several earthquakes and have reported horizontal movements. The Badrinath GPS station (almost 20km in NNW direction from Badrinath town) has reported a movement of 34.7±1.2 mm/yr in ITRF14 (1). The authors arrived at a compressive strain rate of -0.06 µ strain per year towards NE-SW and a mean dilation of -0.07 µ strain per year. In February 2022, the region further south of the Joshimath, experienced a flash flood due to glacier avalanche leading to damage to the hydro-electric project and loss of human life. The town also serves as a base for many trekking routes in the surrounding Himalayas, such as the Nanda Devi Sanctuary and the Valley of Flowers National Park. The town receives moderate to heavy rainfall during the monsoon season and heavy snowfall during the winter. The location of the area of interest is demonstrated in Fig. 1.
Figure 1.
Location of Area of Interest in India (a) India (b) Uttarakhand (c) Joshimath (d) Seismo tectonics of Uttarakhand (2).
Figure 1.
Location of Area of Interest in India (a) India (b) Uttarakhand (c) Joshimath (d) Seismo tectonics of Uttarakhand (2).
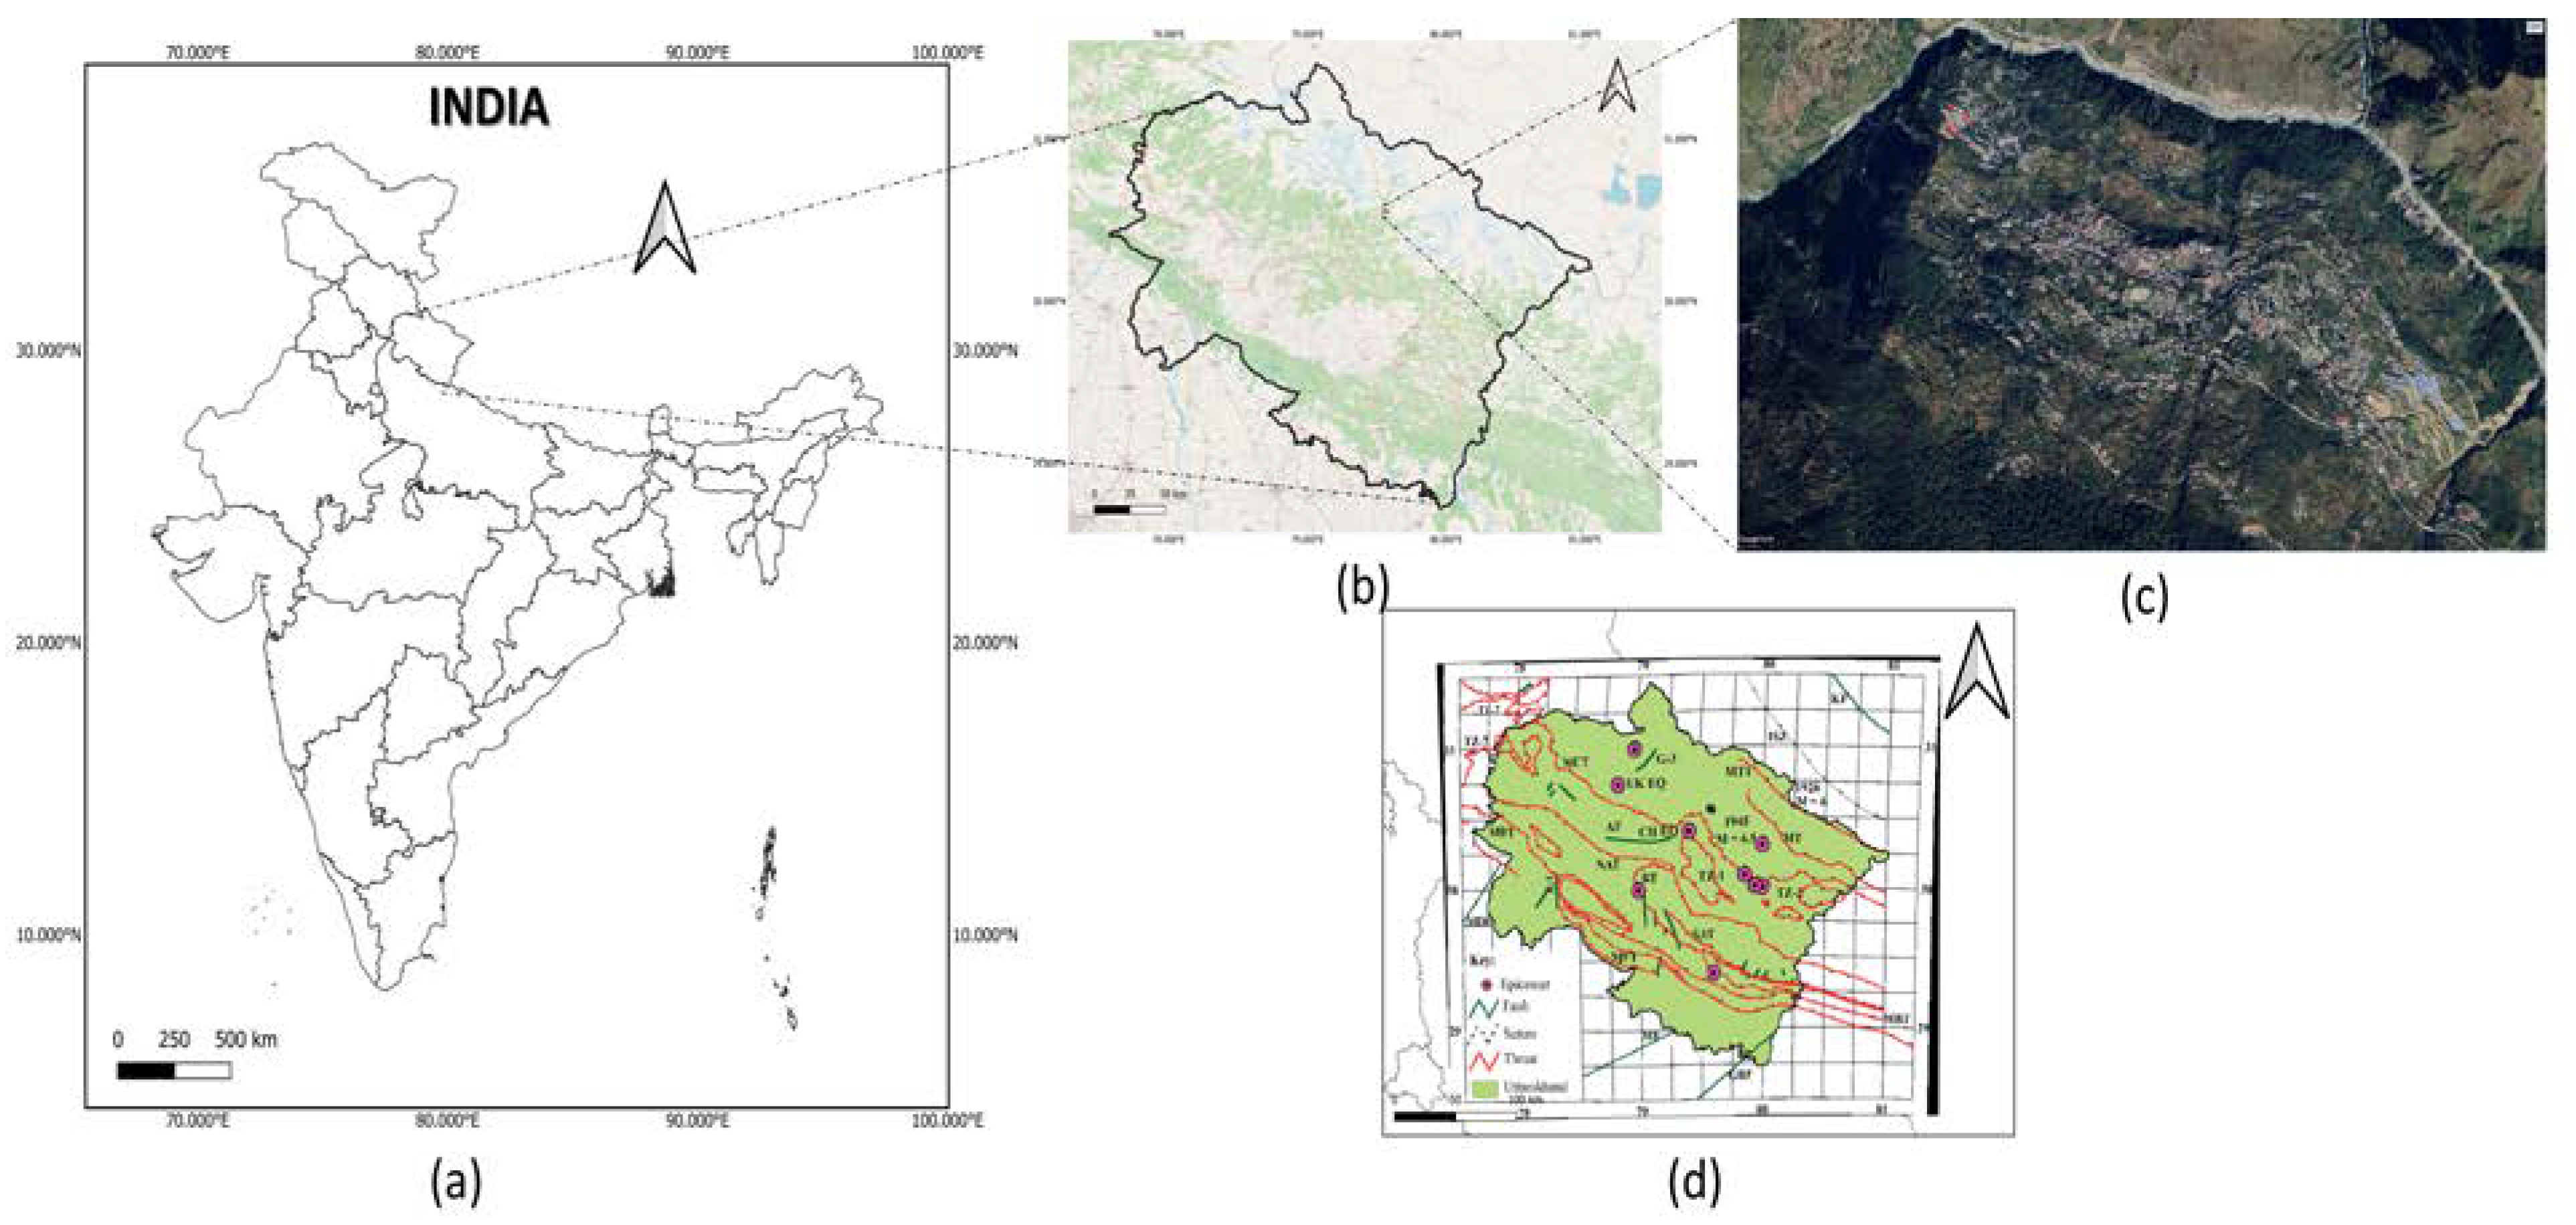
Geologically the place is situated in the lesser Himalayas and lies in the tectonic fore deep (3) within seismic hazard zone of V. The lithology of Joshimath includes Garnet mica gneiss, staurolite & kyanite gneisses and Garnet amphibolite (3). Based upon the ESRI Land Use Land Cover of the Area of 2020, derived from ESA Sentinel-2 imagery at 10m resolution (4), majority of the southern part is covered by trees and rangelands whereas the northern part of the area is covered with ice, due to presence of Himalayas. The region started experiencing subsidence from the early November 2022 and in early December to mid-December 2022, the houses started developing cracks. To understand when and how the subsidence started in the region, we processed the Sentinel-1 SAR data.
DATA PROCESSING
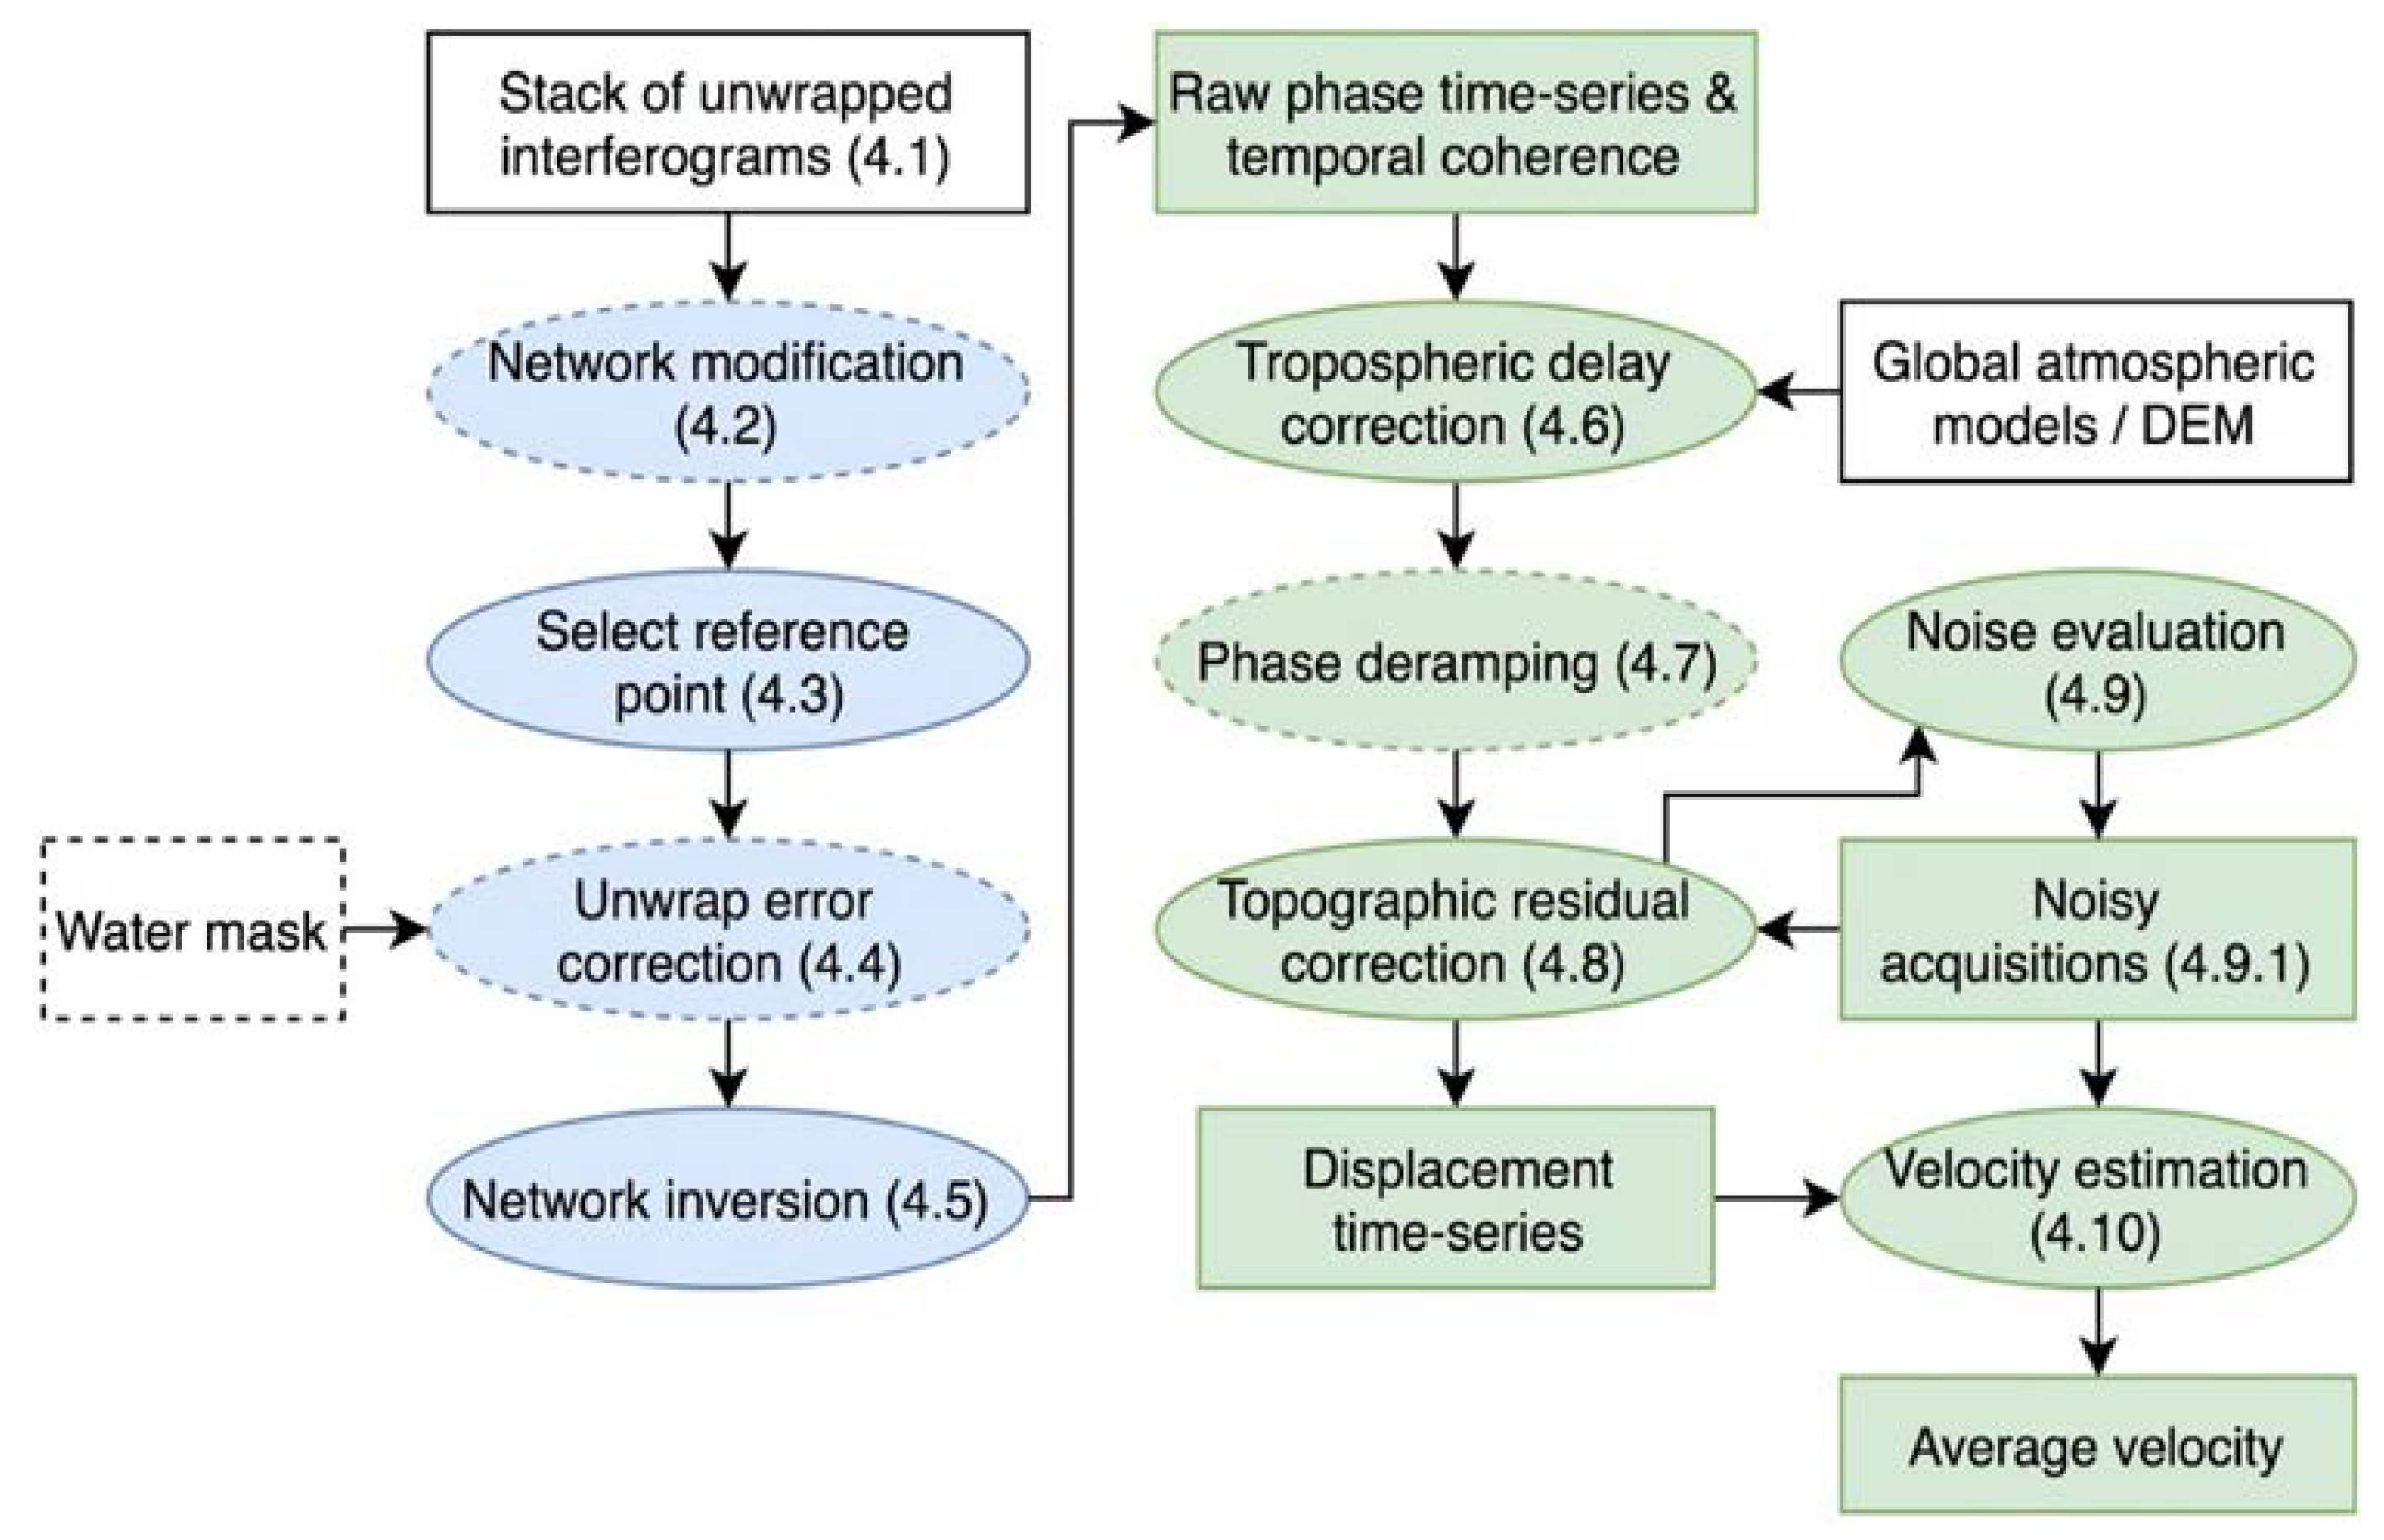
The Sentinel-1 SAR data of the region for the past one year (January 2022 to January 2023) was processed to study the surface vertical displacement of Joshimath town using Hyp3 and MintPy and the analysis of generated interferograms. The IW – Interferometric Wide swath mode images of swath width 250 km were used to generate interferograms (5). 30 images of flight direction ascending orbit with polarization VV+VH were used in the study. The workflow for the time series analysis is presented in Fig.2. Interferograms acquired using ASF HyP3 were processed using MintPy (6) to get the desired results. SAR satellites observe obliquely downward not directly below; hence the ascending orbit indicates the observation from west direction and descending orbit indicates the observation from east direction (7). The displacement is calculated by counting the number of fringes in the resultant interferogram and multiplying it with the half wavelength of the SAR (the wavelength of SAR C-band is 5.54 cm).
Figure 2.
Workflow of InSAR time series analysis (7).
RESULTS AND DISCUSSION
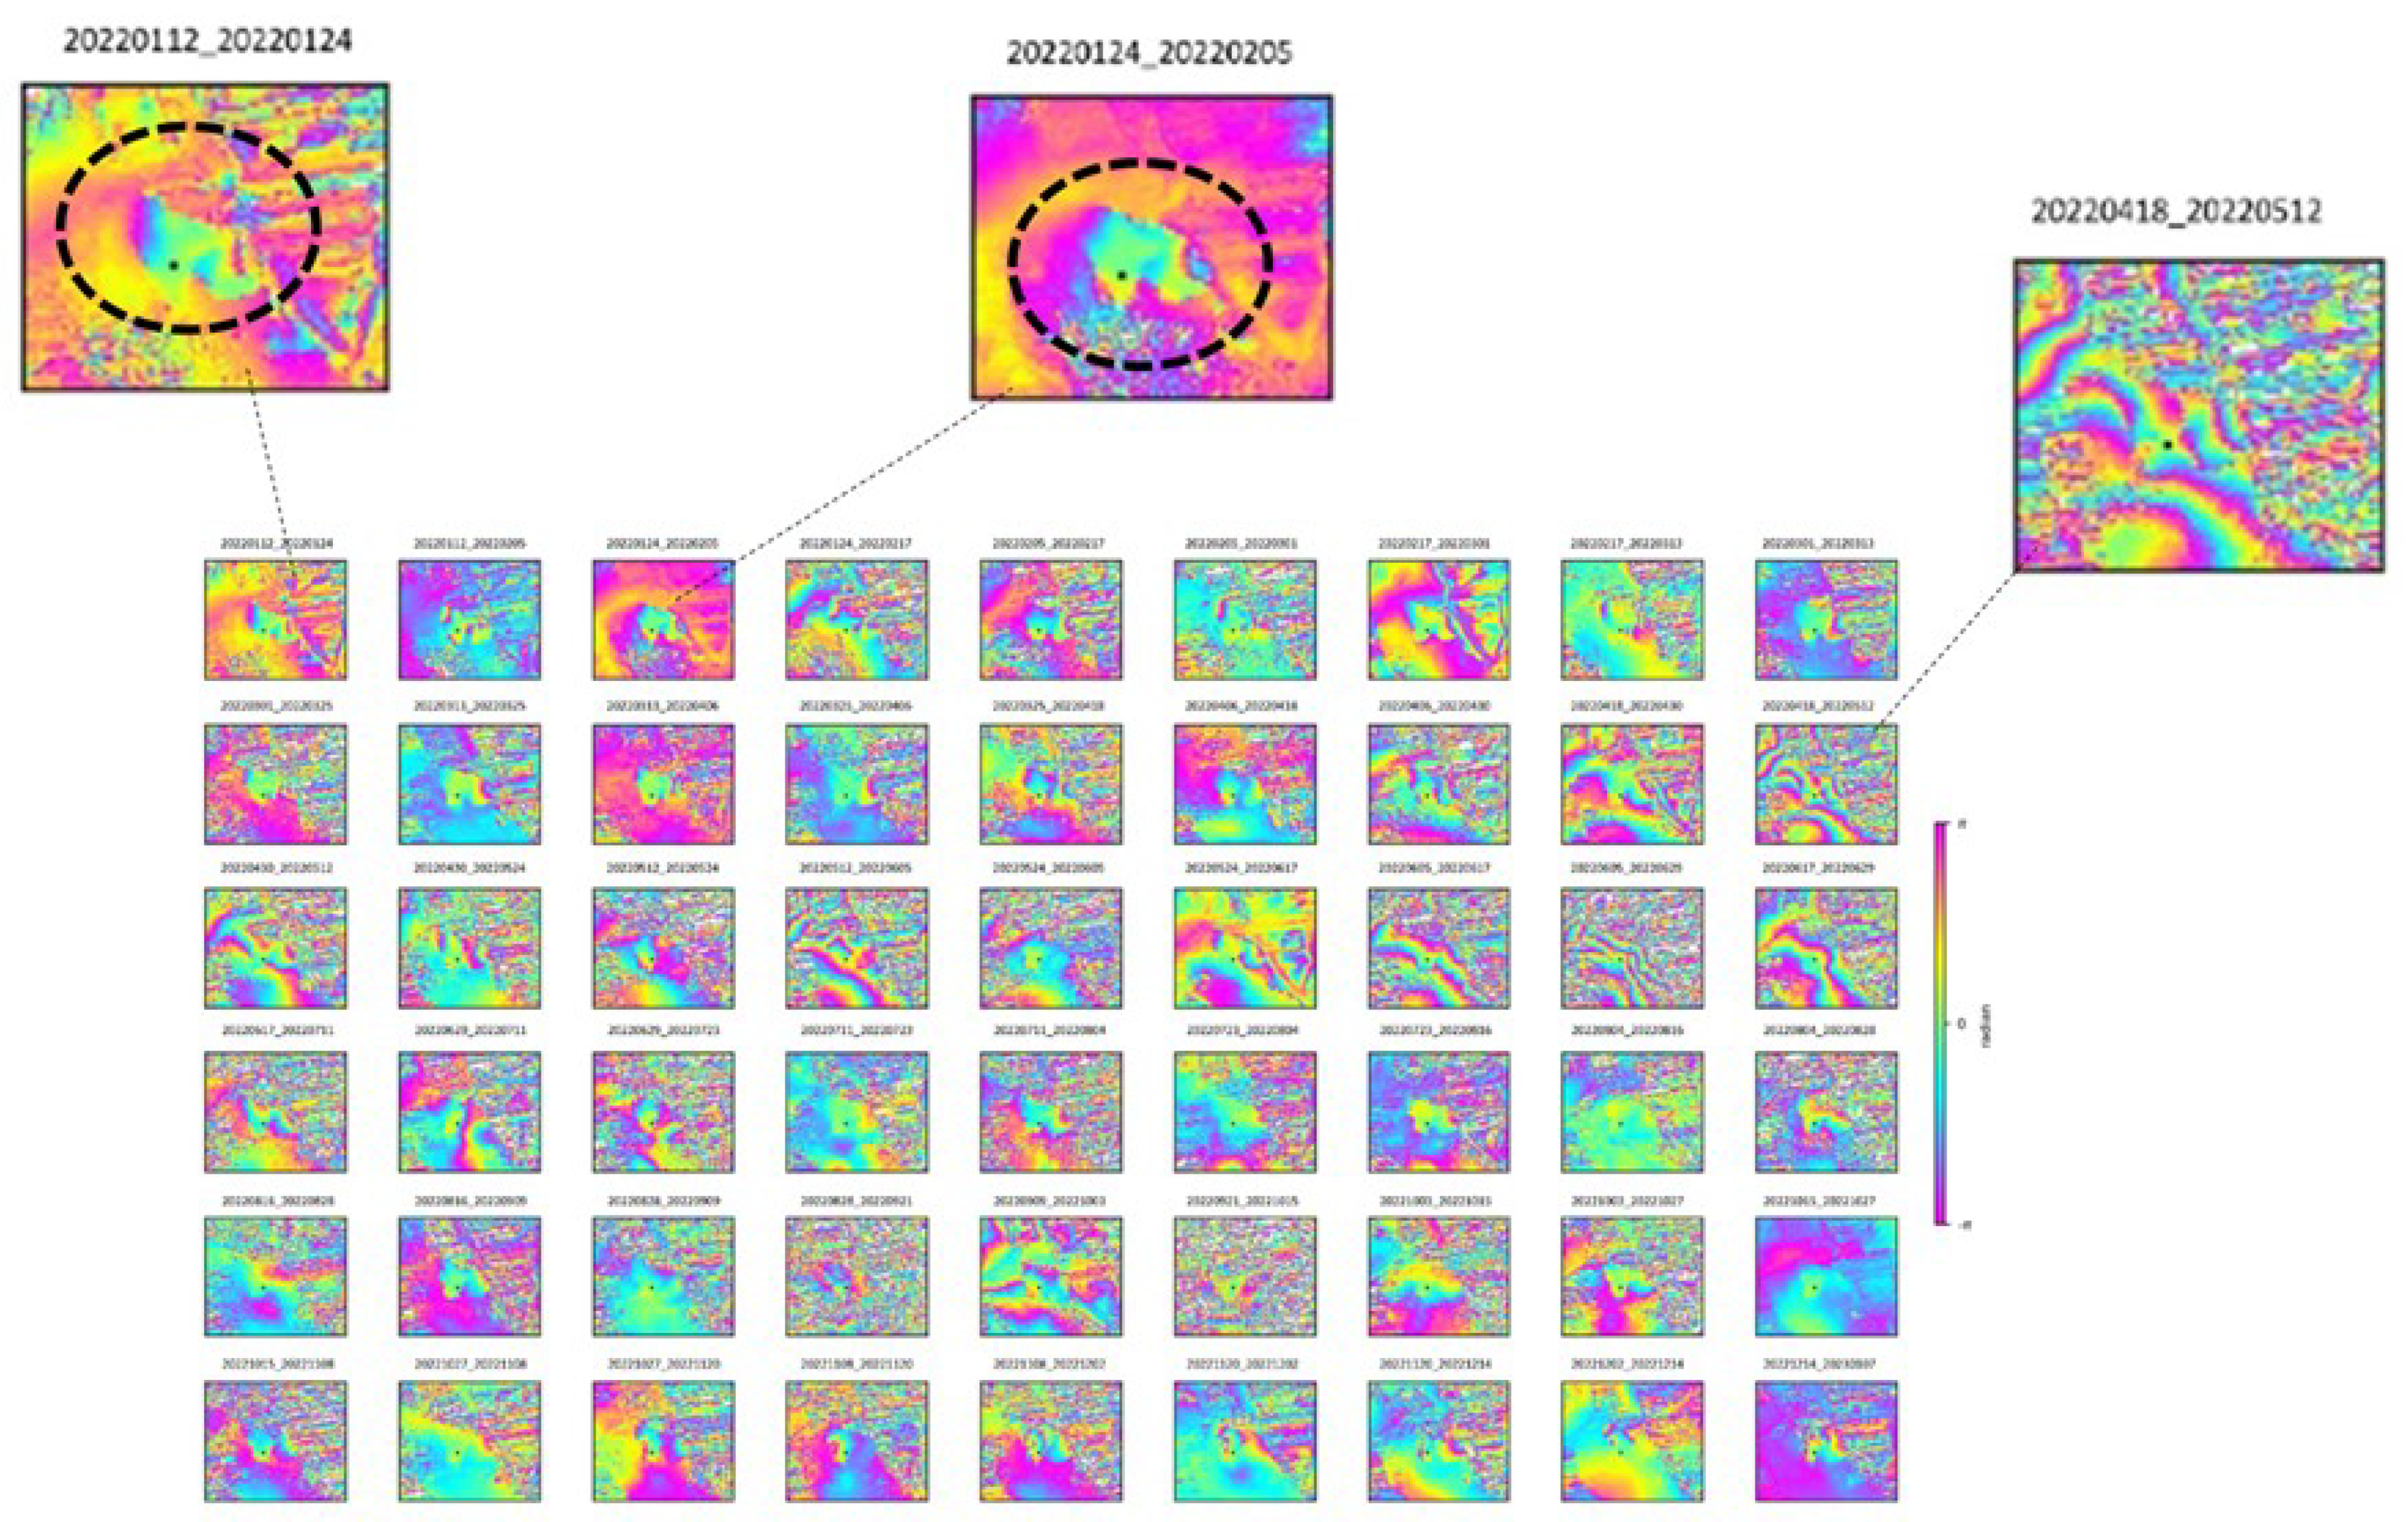
Fig. 3 visualizes all the interferograms generated between two acquisitions with a temporal baseline of 24 days. A hole like structure can be seen in the interferogram for the months of January to March 2022, which indicates a significant movement in the ground surface. In the later interferograms, a maximum of 2 fringes can be noticed. With each fringe leading to 2.7 cm of movement, the 2 fringes would lead to a LOS displacement of 5.4 cm approximately. Maximum LOS displacement was noticed between these following interferograms (highlighted in the Fig. 3): 20220418_20220512, 20220512_20220605, 20220524_20220617, 20220605_20220617 and 20220605_20220629. The above mentioned interferograms are for the acquisitions in the months of April, May and June which are the months of summer. By the end of the year, the movement is observed to decrease but did not reach zero. The lowering of water table during summer, might be one of the reasons for observed subsidence but can only be done through having the data of rainfall and groundwater table measurements of the area. With most of the surrounding areas covered in snow, the groundwater levels are inaccessible.
Figure 3.
Interferograms generated for the ROI using SAR images acquired from January 2022 to January 2023.
Figure 3.
Interferograms generated for the ROI using SAR images acquired from January 2022 to January 2023.
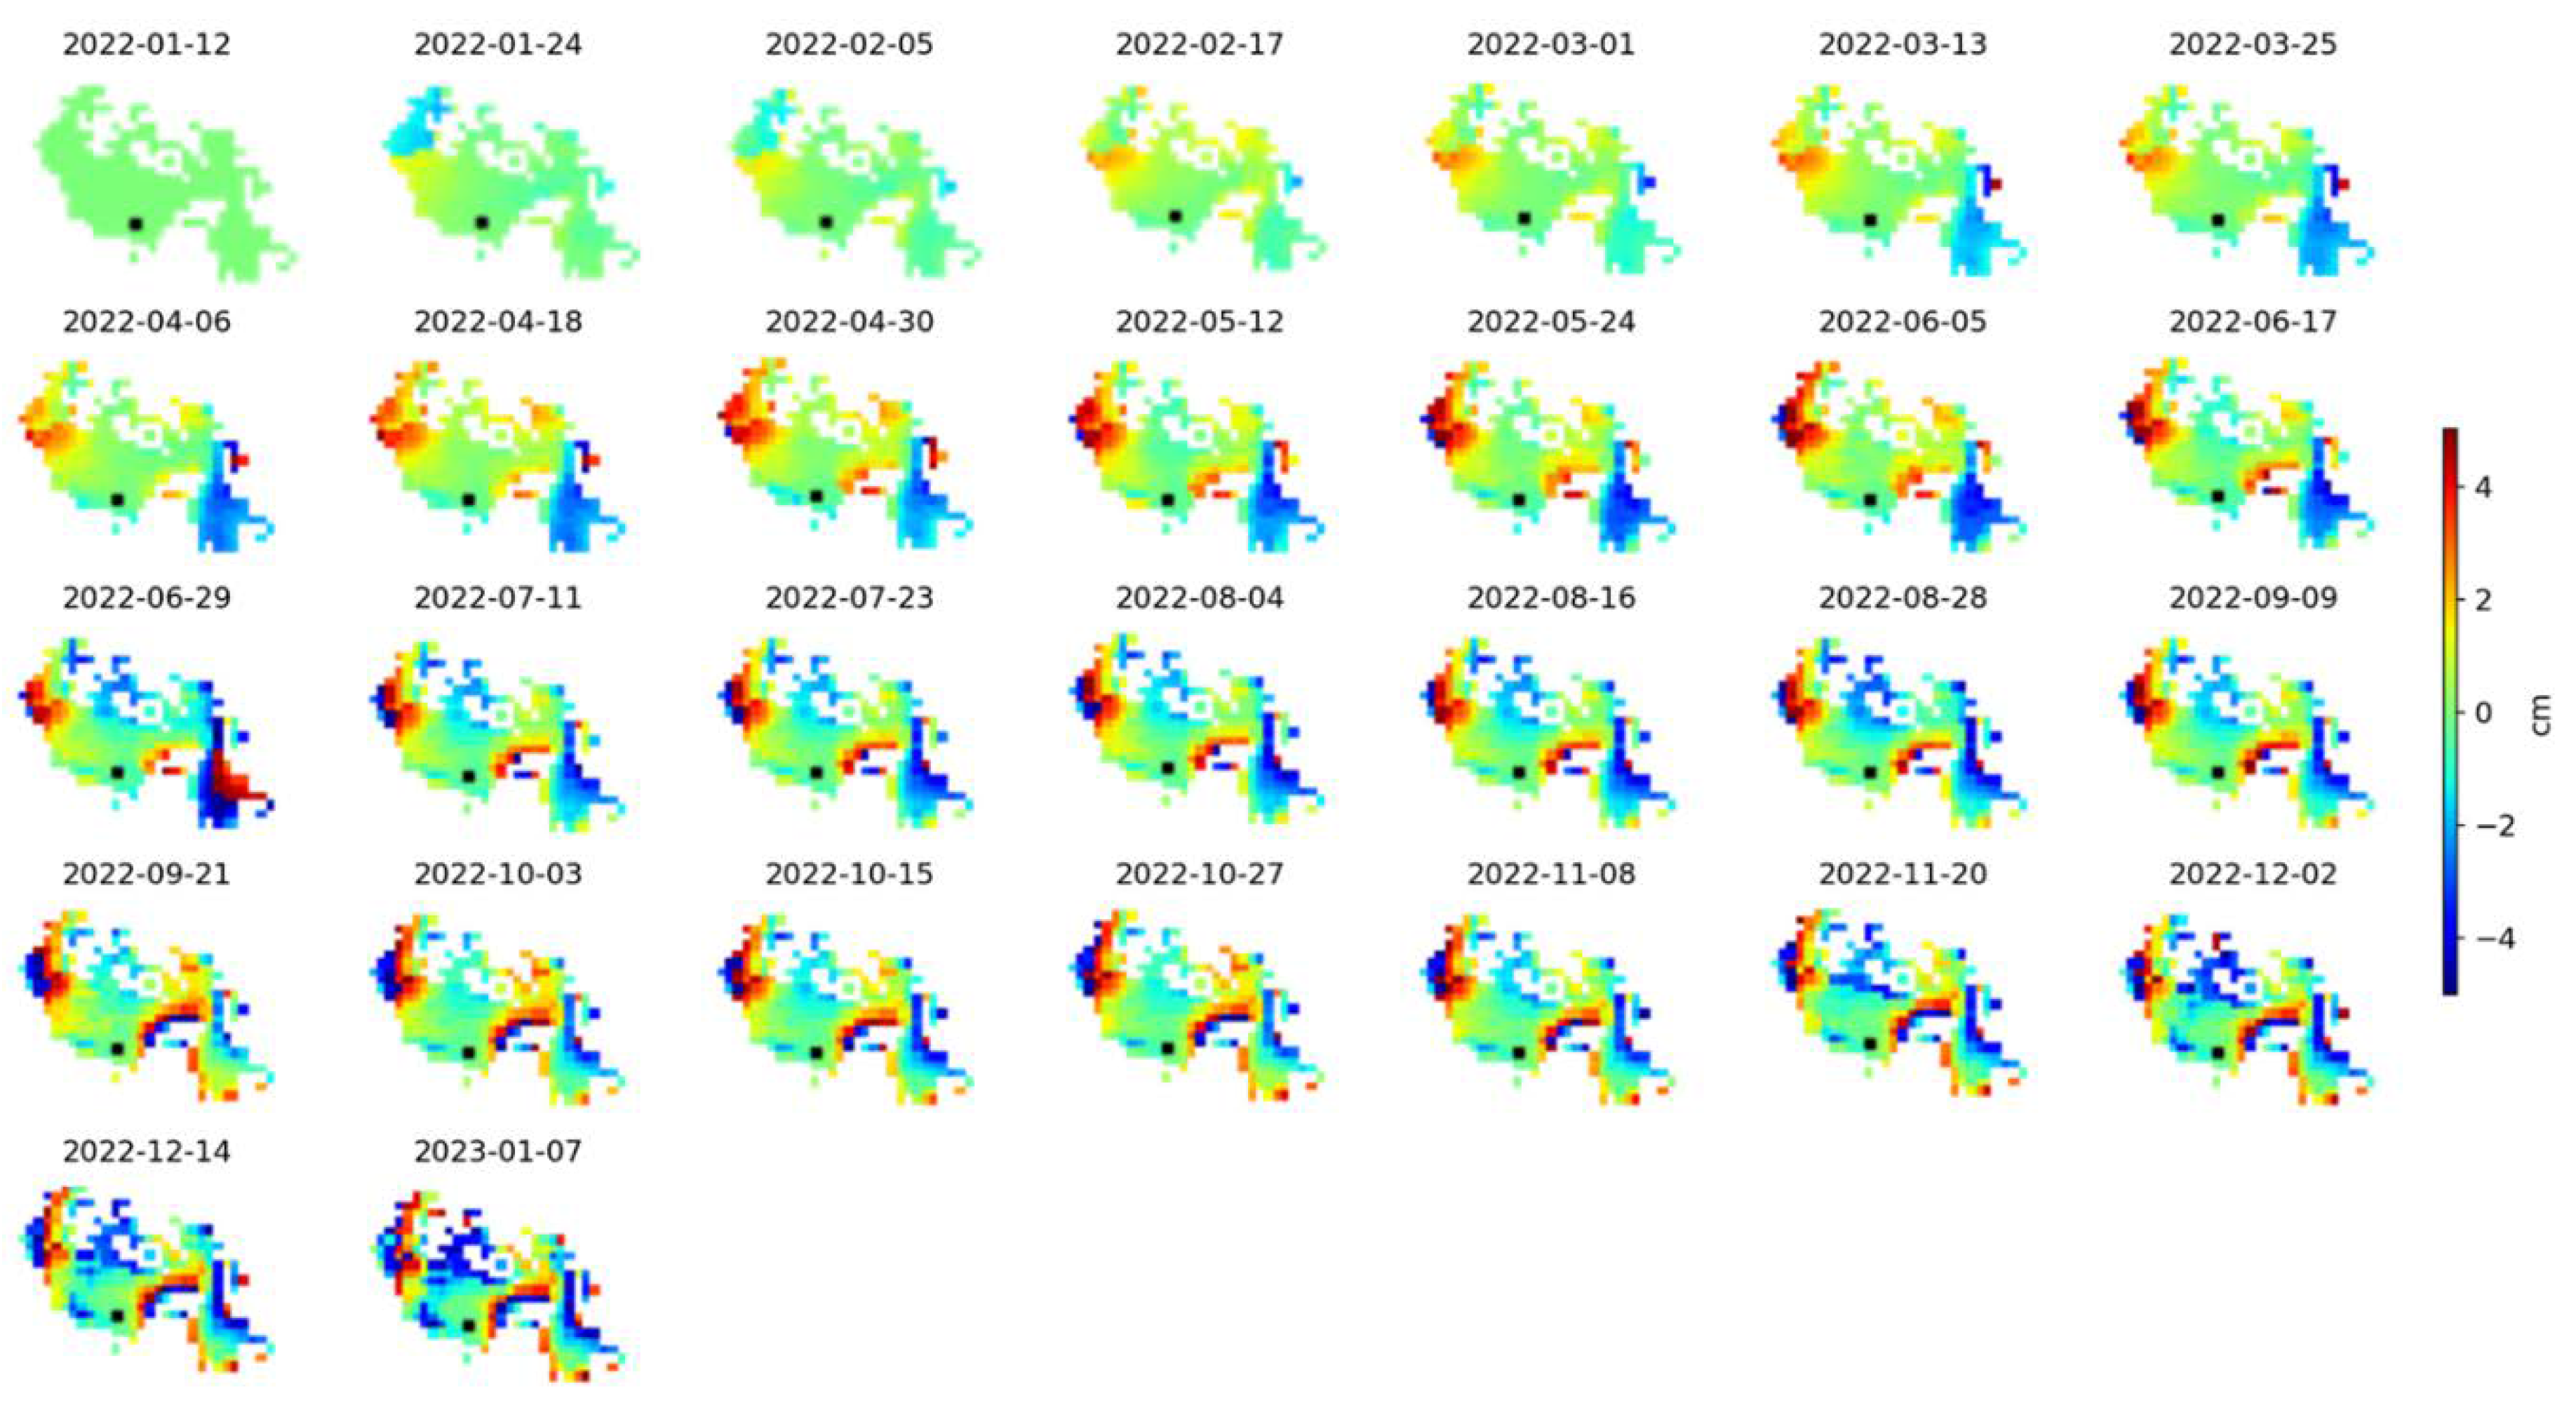
The Line of Sight (LOS) displacement map for the area of interest is displayed in the Fig 4. With the path of the Sentinel imagery used in the study being ascending, the LOS displacement is from west to east. The color combination in the Fig.4 means as follows, “Red” for movement towards the satellite and “Blue” for movement away from the satellite. With the image acquired on 12 January 2022 acting as the first image, the displacement is zero. But the displacement in the southeast portion of the region starts from the month of March and continues till the end of the year. The northern area of the region is observed to experience the displacement from the month of June.
Figure 4.
LOS Displacement timeseries for the ROI.
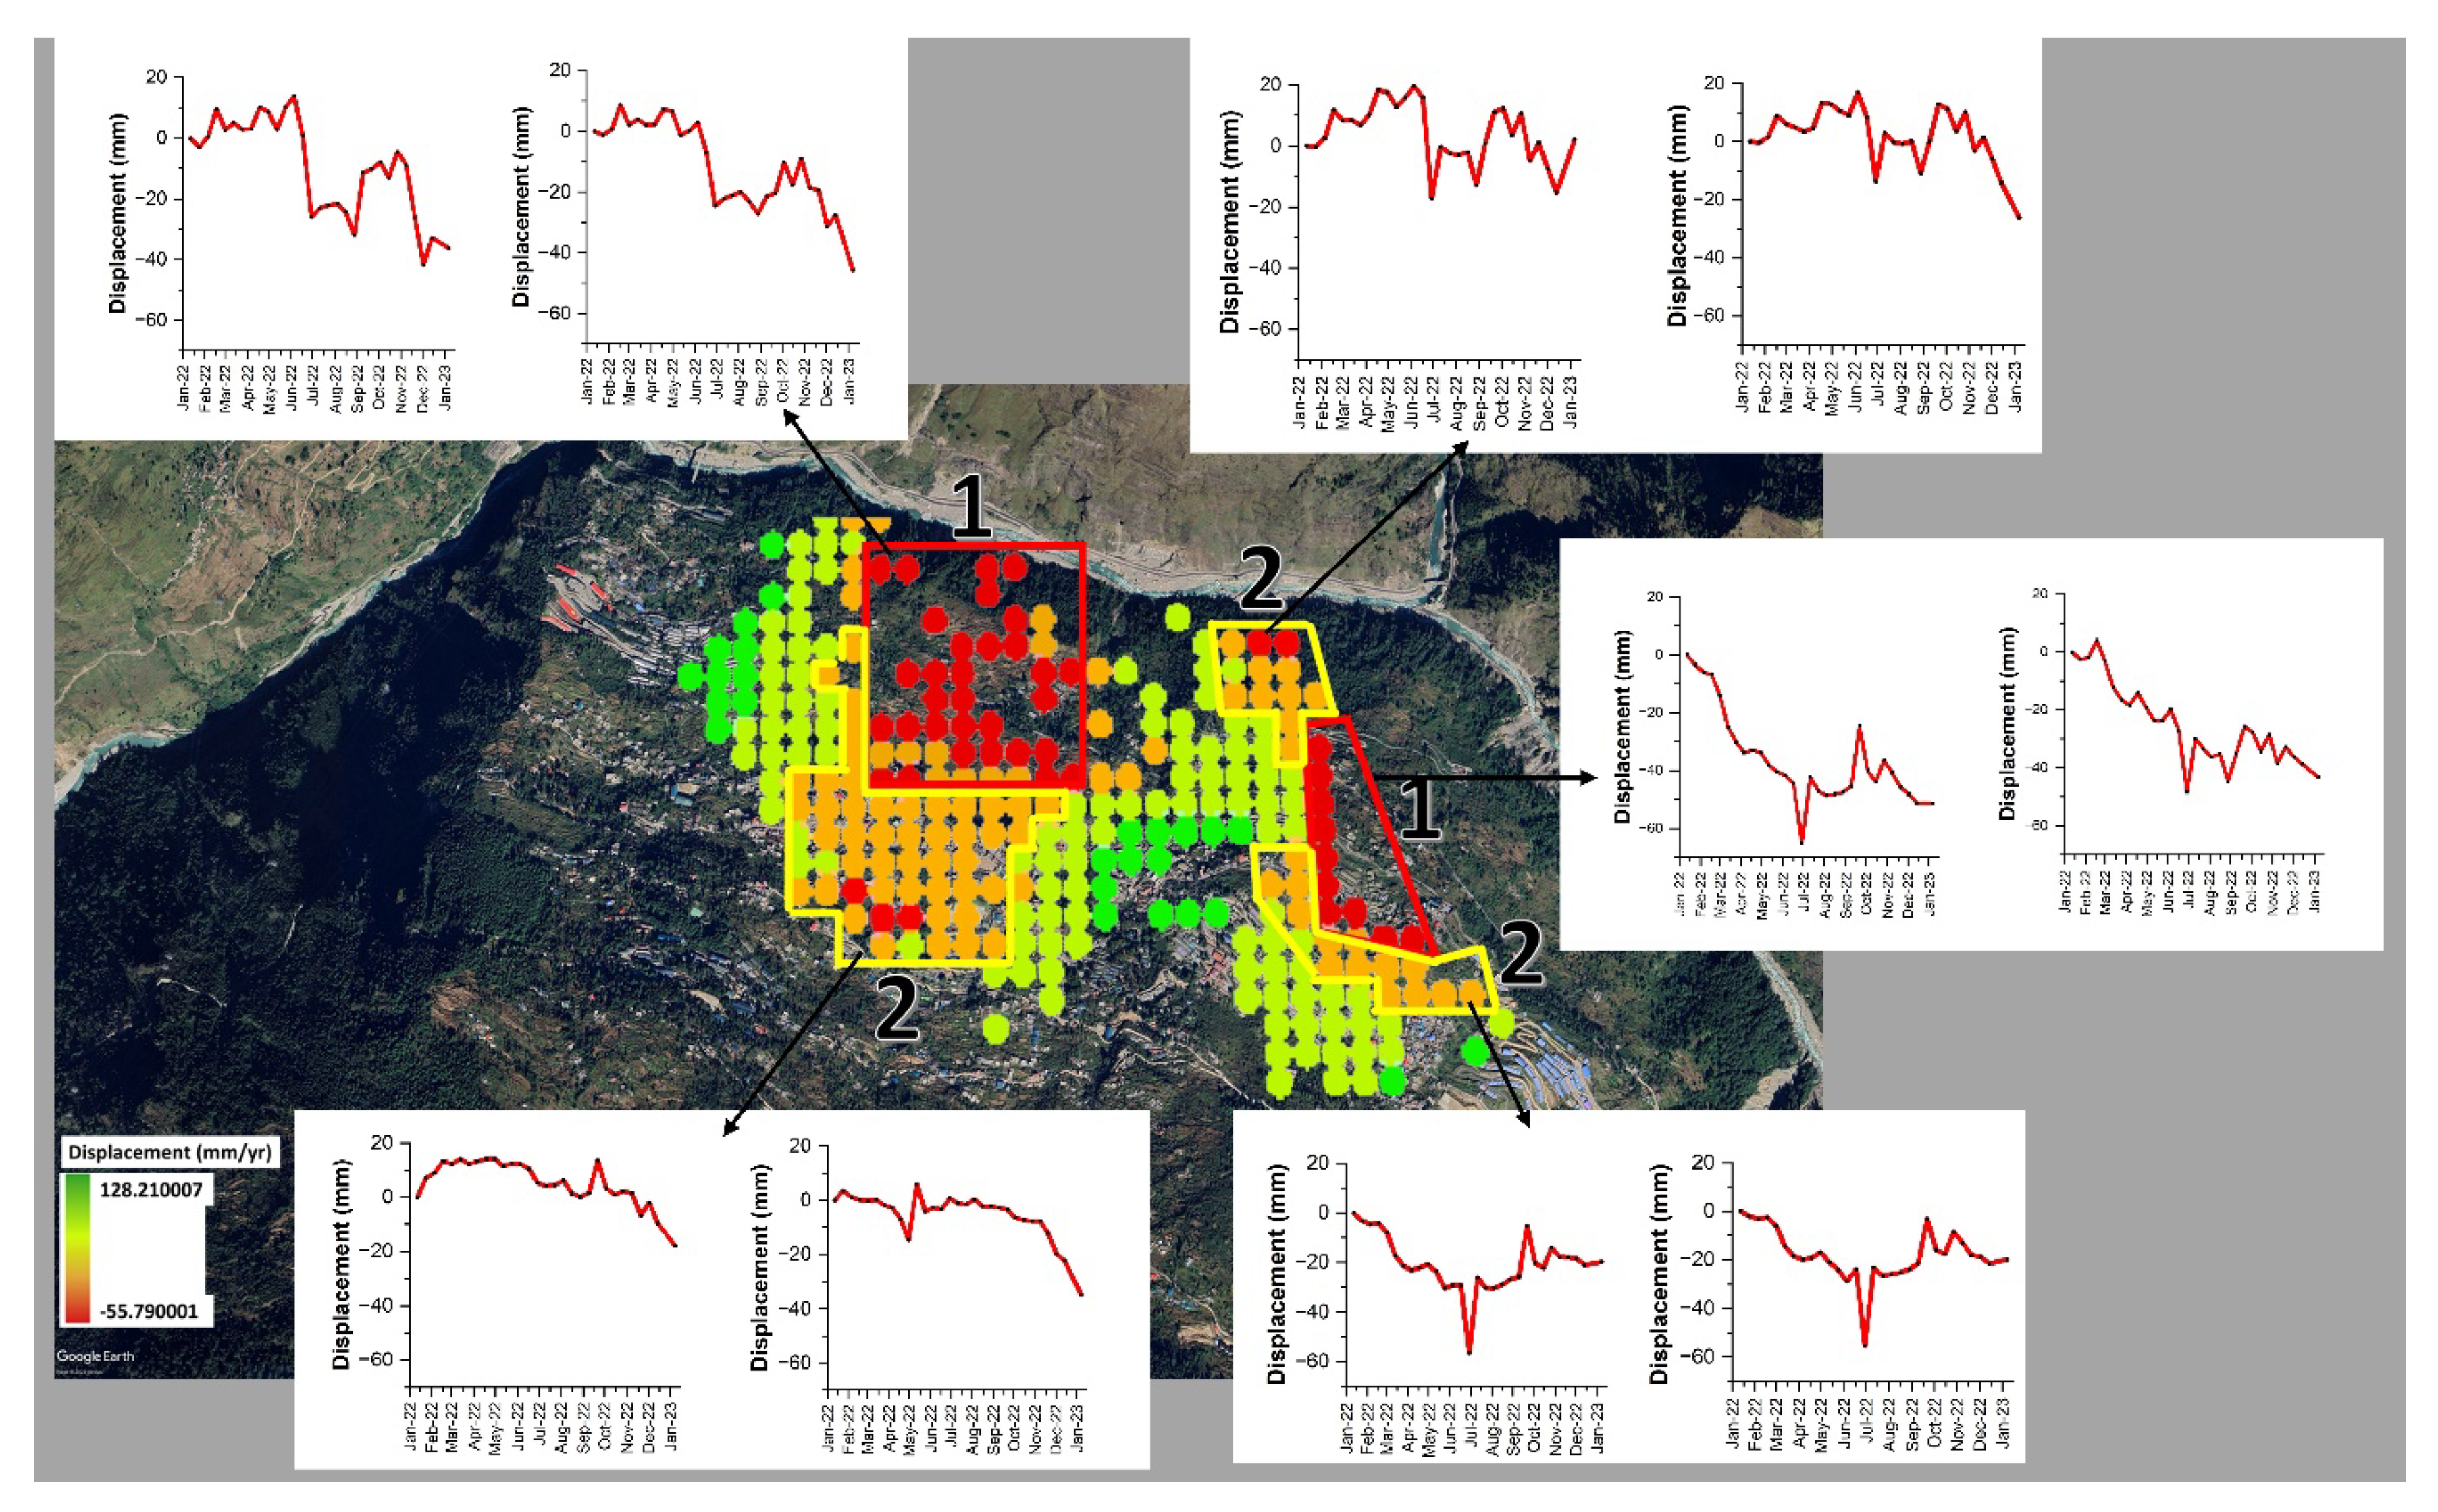
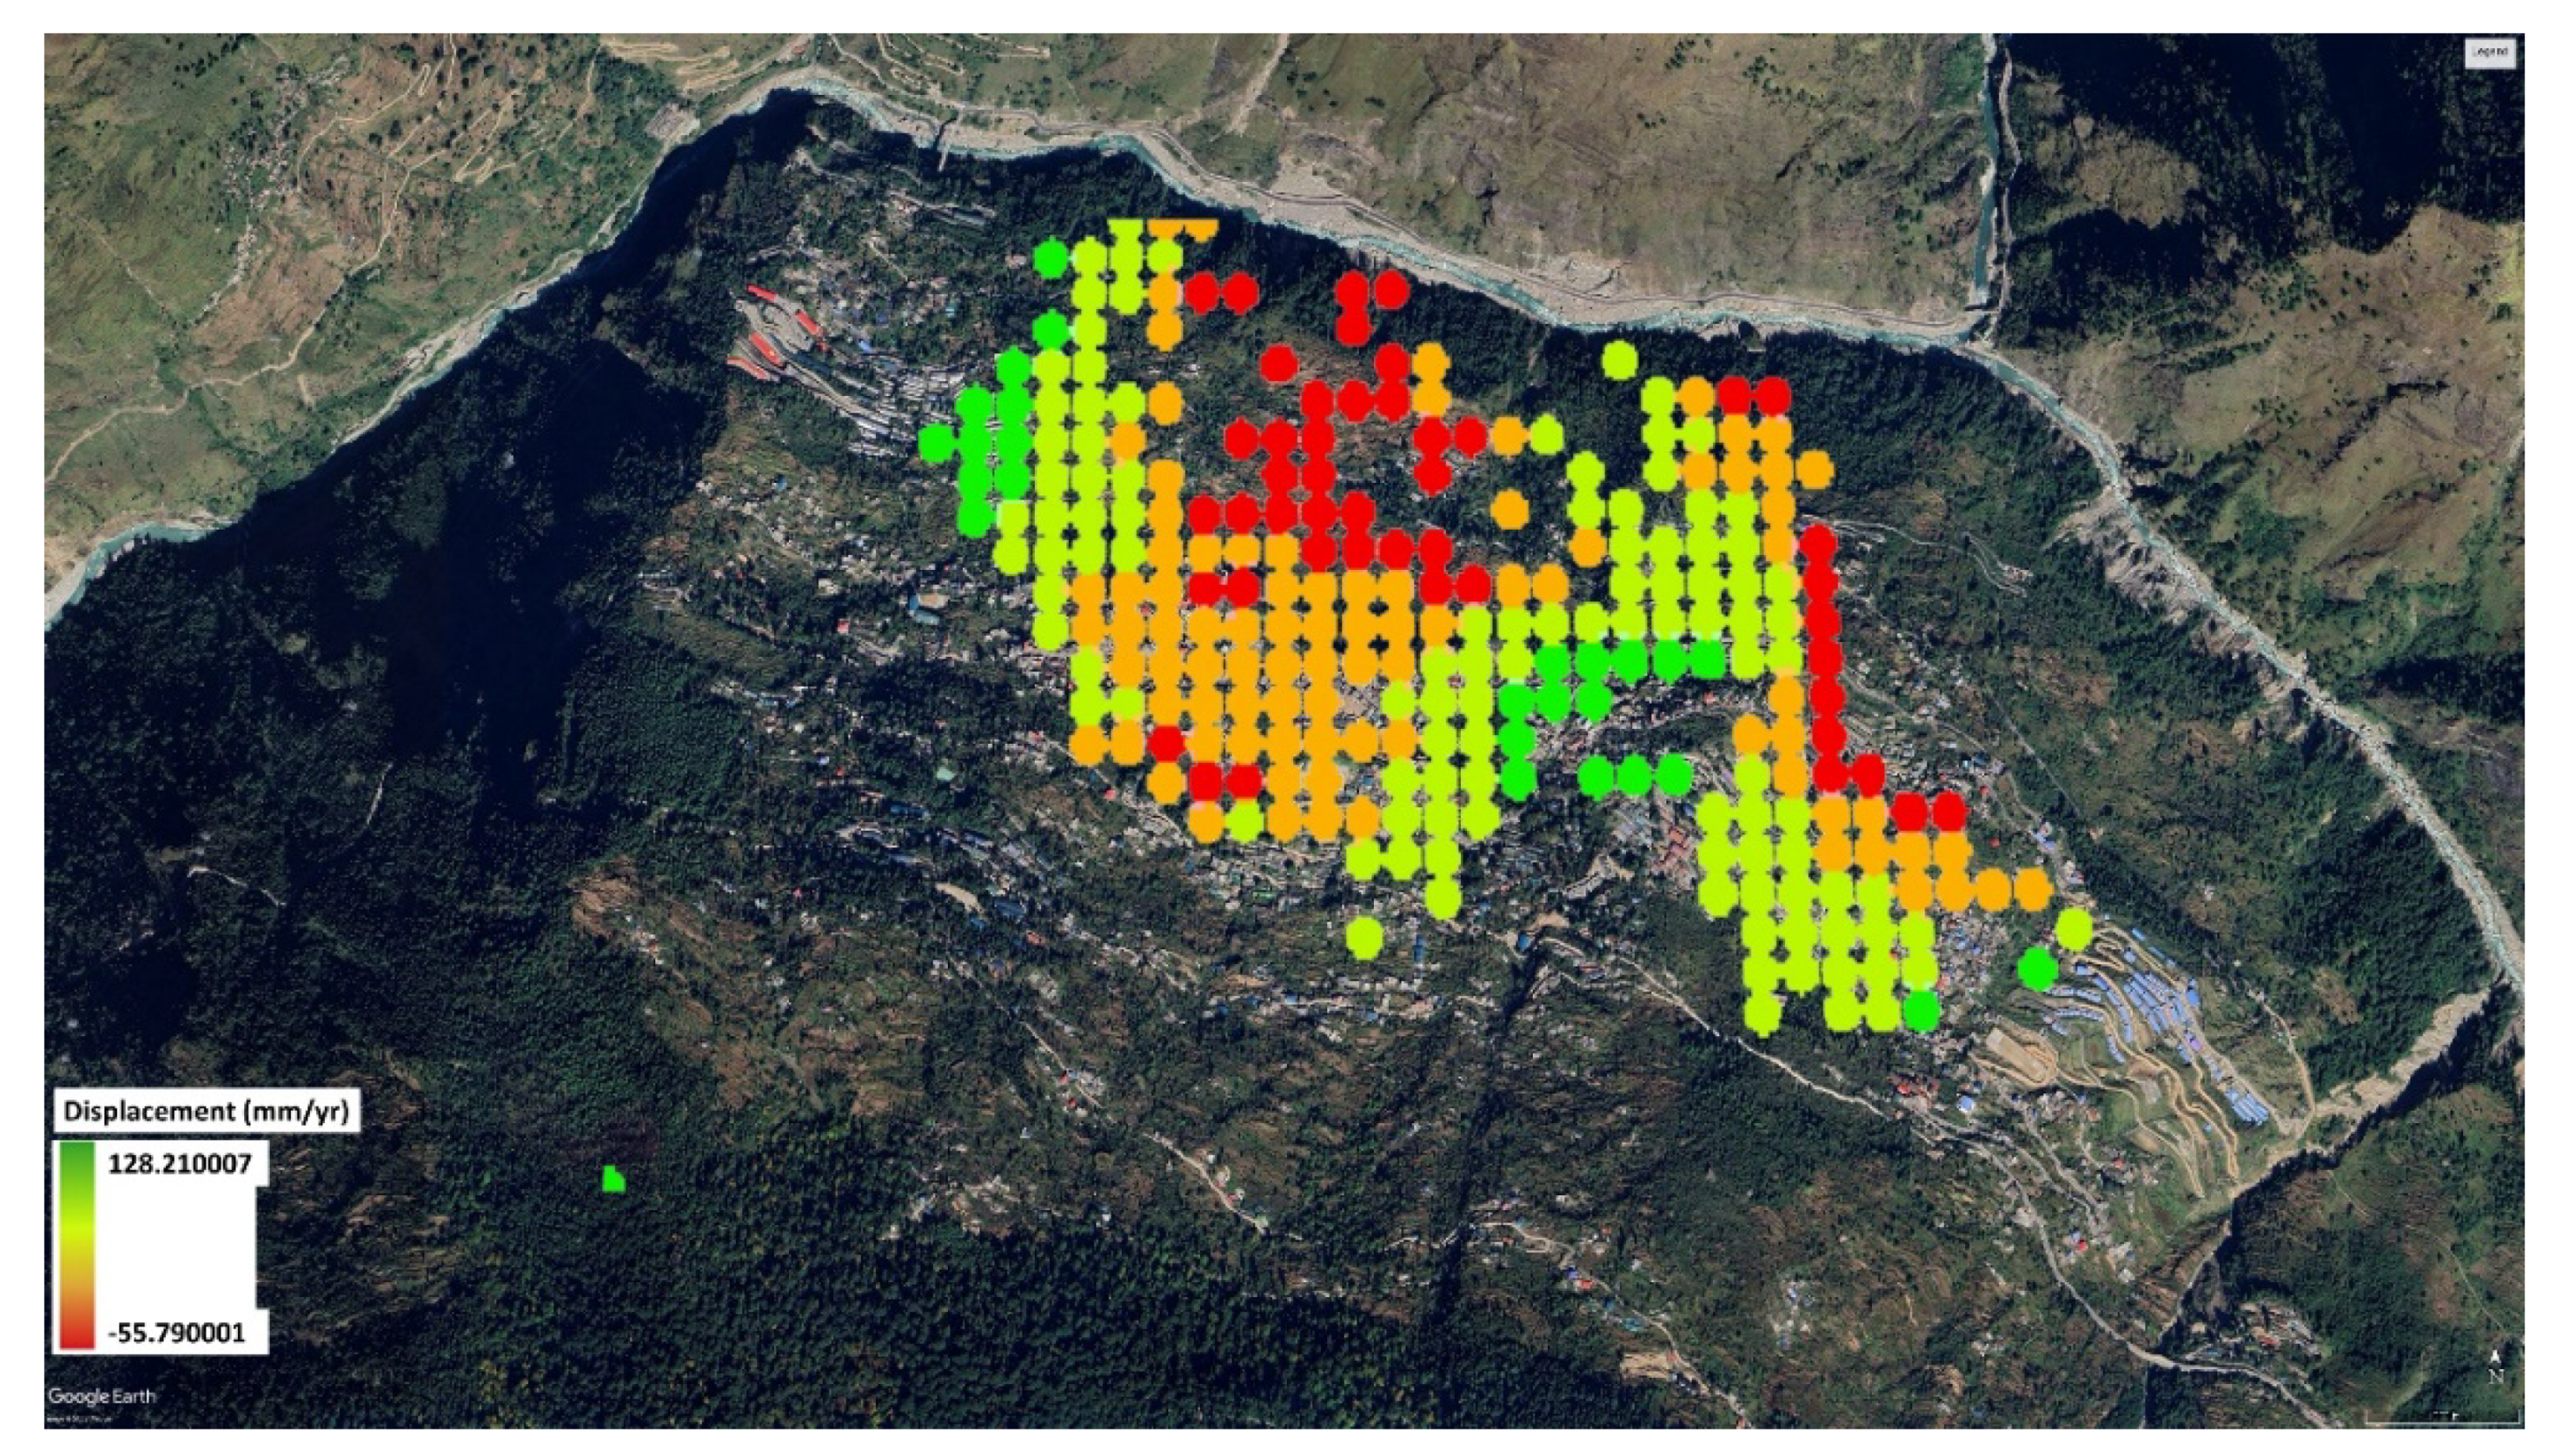
The InSAR calculated velocity of the displacement was extracted for each of the pixel overlaid on Google Earth, for the town area in the year of 2022 and is visualized in Fig. 5. The values ranged from 12.8 cm/yr to -5 cm/yr. Various parts of the region experience different rates of displacement. The northern part of the region shows higher rate of subsidence.
Figure 5.
Displacement Velocity for the year 2022 visualized in Google Earth.
While the highest uplift observed within the Joshimath town area 10.7 cm, the maximum subsidence observed is 6.5 cm in the northern and eastern part of the town. The time series vertical movement for all the pixels which are experiencing subsidence in the town were plotted (Fig S1- S11.). Few of the time series plots from the region experiencing maximum subsidence is illustrated in Fig.6. The results show that the area started experiencing subsidence from the month of June, as almost all the time-series map shows a drop in values from June onwards, albeit the magnitude is less in some of the regions. Since June, the subsidence followed with varying rates till September. However, major parts of the region experienced an uplift in the month of September which continued till October, after which the subsidence continued and a sudden subsidence of almost 10 mm was observed in December. A sudden ground subsidence of around 10 mm developed cracks in the buildings of larger magnitude which caused panic and government intervention for relocation of people and demolition of damaged buildings.
We have classified the subsided area of Joshimath into two categories based upon the rate of subsidence it has experienced in the last one year. Category 1 (denoted by numeral 1 in Fig.6) is the region which underwent a subsidence rate of 20 mm/yr to 65.50 mm/yr, whereas the Category 2 (denoted by numeral 2 in the Fig. 6) which observed a subsidence from 0 to ~20 mm/yr.
Figure 6.
Categories 1 and 2 of the subsidence rates with time series of vertical movement.
CONCLUSION
The area of Joshimath started experiencing cracks on the walls of buildings and other man-made structures in the last week of December 2022 and first week of January 2023. However, the results indicate that the damage to the manmade structures is not a result of subsidence in one month. The creep due to subsidence was being developed since the beginning of the year 2022 but major subsidence happened in the months of July and September, which went unnoticed as it did not translate into cracks in the buildings. There were reports suggesting that the region underwent a subsidence of up to 6 cm in the month of December, which is similar to our results, however, no one has reported any time series of subsidence and when it all started.
While the reasons for this remain unknown till now, probable causes, scientist are attributing to, would be groundwater extraction, changes in the course of underground water channels. Being situated in proximity of major tectonic discontinuities, Joshimath has been showing signs of distress due to the burgeoning anthropogenic pressure. The area reportedly shows signs of continuous ground subsidence and the same has been recorded earlier (9,10,11). As the town in built upon the debris of an old landslide and is sinking, as per the Mishra committee report (12) which recommended banning of heavy construction, any change during the underground channels and unorganized and haphazard construction would lead to subsurface instability and hence subsidence. This seems to be the most plausible cause of subsidence as of now. More studies are needed, which shall be done in due course of time, would lead to more clarity on the causes.
It has been observed in several parts of the world that the groundwater extraction does causes subsidence (2). This could be another plausible cause of subsidence of Joshimath. Because the groundwater data for the region is unavailable at this point of time, the authors were not able to test their hypothesis. Further analysis and comparison of the subsidence/uplift with the groundwater table levels could provide a better understanding of the causes and reasons for subsidence. The subsidence in the region needs to be monitored on a continuous basis along with other parameters to understand the phenomenon better and work for remedial measures so that similar disaster does not recur. It is also very important to monitor other similar areas which may be undergoing subsidence but has not reported any major subsidence, before the phenomenon cause huge losses of resources.
The study not only focuses on the subsidence in the region of Joshimath, but also highlights the method and the need to study similar places with rigorous data collection and processing to reduce the human and economic losses. According to the authors best knowledge, there have been very few studies which used HyP3 products in MintPy to produce time series of displacement. The method is quick and easy unlike any other traditional SAR data processing software. This method helps in quickly analyzing a disaster hit place and take appropriate steps.
Supplementary Materials
Materials and Methods; Supplementary Text; Figs. S1 to S11; Table S1; References (01-42).
Author Contributions
(1) Data processing, Visualization and writing the draft–S.D.P; (2) Conceptualization, Supervision, Analysis, and final draft – S.P.
Funding
This research received no specific grant from any funding agency in the public, commercial, or not-for-profit sectors.
Acknowledgments
We acknowledge the use of ASF DAAC HyP3 2021 using the hyp3_gamma plugin version 5.1.1 running GAMMA release 20210701. Contains modified Copernicus Sentinel data 2019, processed by ESA.
Conflicts of Interest
Authors declare that they have no competing interests.
Data and Materials Availability
We used publicly available data. The Sentinel-1 SAR data is available and can be processed through ASF HyP3 (7). MintPy, which was used to acquire the time series is also publicly available (6). All other data are available in the main text or the Supplementary Materials.
References
- Kannaujiya, S.; Yadav, R.K.; Champati ray, P.K.; Sarkar, T.; Sharma, G.; Chauhan, P.; Pal, S.K.; Roy, P.N. S.; Gautam, P.K.; Taloor, A.K.; et al. Unraveling seismic hazard by estimating prolonged crustal strain buildup in Kumaun-Garhwal, Northwest Himalaya using GPS measurements. J. Asian Earth Sci. 2022, 223, 104993. [Google Scholar] [CrossRef]
- Kumar, P.; Kumar, A.; Sinvhal, A. Assessment of seismic hazard in Uttarakhand Himalaya. Disaster Prev. Manag. Int. J. 2011, 20, 531–542. [Google Scholar] [CrossRef]
- CHAMOLI DISTRICT AT A GLANCE. 2006. Available online: http://cgwb.gov.in/District_Profile/Uttarakhand/Chamoli.pdf (accessed on 16 January 2023).
- Karra, K.; Kontgis, C.; Statman-Weil, Z.; Mazzariello, J.C.; Mathis, M.; Brumby, S.P. Global land use/land cover with Sentinel 2 and deep learning. In Proceedings of the IEEE Xplore, 1 July 2021. [Google Scholar] [CrossRef]
- Vincent, P.; Bourbigot, M.; Johnsen, H.; Piantanida, R.; Hajduch, G. Sentinel-1 ESA Unclassified for Official Use Sentinel-1 Product Specification. 2020. Available online: https://sentinel.esa.int/documents/247904/1877131/Sentinel-1-Product-Specification (accessed on 16 January 2023).
- Yunjun, Z.; Fattahi, H.; Amelung, F. Small baseline InSAR time series analysis: Unwrapping error correction and noise reduction. Comput. Geosci. 2019, 133, 104331. [Google Scholar] [CrossRef]
- Hu, B.; Li, Z. Time-Series InSAR Technology for Ascending and Descending Orbital Images to Monitor Surface Deformation of the Metro Network in Chengdu. IEEE J. Sel. Top. Appl. Earth Obs. Remote Sens. 2021, 14, 12583–12597. [Google Scholar] [CrossRef]
- Hogenson, K.; Kristenson, H.; Kennedy, J.; Johnston, A.; Rine, J.; Logan, T.; Zhu, J.; Williams, F.; Herrmann, J.; Smale, J.; Meyer, F. Hybrid Pluggable Processing Pipeline (HyP3): A cloud-native infrastructure for generic processing of SAR data [Computer software]. 2020. [Google Scholar] [CrossRef]
- Heim, A.; Gansser, A. Central Himalayas—Geological observations of Swiss expedition, 1936. Mem. Soc. Helv. Sci. Nat. 1939, 73, 1–245. [Google Scholar]
- Auden, J.B. Traverses in the Himalaya. Rec. Geol. Surv. India, 1935, 69, 123–167. [Google Scholar]
- Valdiya, K.S. Aspects of Tectonics—Focus on South Central Asia; (Tata McGraw Hill Publ. Co.: Delhi, India, 1984; p. 319. [Google Scholar]
- Mishra Commission. Report of the Commission Set up by the Government of India Vide Letter No. 142/23-5/44/76 dated 08.04.1976; 1964. [Google Scholar]
Disclaimer/Publisher’s Note: The statements, opinions and data contained in all publications are solely those of the individual author(s) and contributor(s) and not of MDPI and/or the editor(s). MDPI and/or the editor(s) disclaim responsibility for any injury to people or property resulting from any ideas, methods, instructions or products referred to in the content. |
© 2023 by the authors. Licensee MDPI, Basel, Switzerland. This article is an open access article distributed under the terms and conditions of the Creative Commons Attribution (CC BY) license (http://creativecommons.org/licenses/by/4.0/).
Copyright: This open access article is published under a Creative Commons CC BY 4.0 license, which permit the free download, distribution, and reuse, provided that the author and preprint are cited in any reuse.


