
Submitted:
02 March 2023
Posted:
03 March 2023
You are already at the latest version
Abstract
Brain magnetic resonance imaging (MRI) offers a unique lens to study neuroanatomic support of human neurocognition and intelligence. A core mystery is the MRI explanation of individual differences in neurocognition and intelligence. The past four decades have seen great advancement in studying this century-long mystery, but the sample size and population-level studies limit the explanation at the individual level. The recent rise of big data and artificial intelligence offers novel opportunities. Yet, data sources, harmonization, study design, and interpretation need to be carefully considered. This review aims to summarize past work, discuss rising opportunities and challenges, and facilitate further investigations on machine intelligence inferring human intelligence.
Keywords:
Neurocognition
; MRI
; Intelligence
; Brain
Introduction
Neurocognition refers to the mental process of learning, solving problems, remembering, and appropriately using information from memory.1 On the other hand, intelligence refers to different mental abilities such as problem-solving, logic, reasoning, and planning. Intelligence describes neurocognition quality in people.2–4 A person’s neurocognition and intelligence are important factors in this person’s education, career, social status, health, and longevity.5 Yet, how can we explain the substantial differences among people in their neurocognition and intelligence? Can we effectively measure a person’s neurocognition and intelligence? Can we predict a person’s future course of neurocognition and intelligence, in normal and disease? Seeking answers to these questions is at the core of neuroscience research for over a century. The hope is to identify and boost each individual’s potential (different people are “smart” in different ways),6 and to early intervene and improve outcomes for those vulnerable.7,8
Besides genetic factors,9 differences in neuroanatomy and brain connectivity are widely believed to contribute to individual variability of neurocognition and intelligence.6 Early studies (the 1900s) related neurocognitive functions to brain structures in post-mortem brains.10 The invention of magnetic resonance imaging (MRI) in 1977 has allowed for in vivo three-dimensional (3D) study of brain structure and function. Advancement in MRI analytics in the past 4 decades further brings the automated, quantitative, and sophisticated investigation of neuroanatomy11,12, white matter integrity13,14, and brain circuit connectivity15, which are all found correlated to neurocognitive and intelligence test scores.6,11 Sample sizes, however, were often dozens to lower hundreds; findings were not always consistent; and population-level associations have not yet been reliably translated into individual prediction.
With very recent availability in big data brain MRI (over 1,000 or even 10,000 individuals),16 coupled with the rise of artificial intelligence (AI),17 offers promises to revolutionize MRI inference of neurocognition and intelligence. While opportunities arise, open issues on the data source, merging, harmonization, analytics, target test scores, study design, and interpretations need to be considered. While there is a recent review,18 which mostly focused on discussing existing MRI studies that correlate brain biology to human intelligence, this review comprehensively discusses existing MRI studies focusing on human neurocognition and intelligence predictive tasks, open issues, and rising opportunities. The aim is to facilitate further studies of machine intelligence inferring human intelligence.
Measurement of Human Intelligence and Neurocognition
Assessment of intelligence is often approximated by the assessment of neurocognitive abilities.2–4 Intelligence is positively correlated to the processing speed,4 executive functions,19,20 general memory,21 and working memory,22 as these neurocognitive abilities are assessed as broad abilities in a typical intelligence assessment system (see Box 1).
Box 1. Measuring intelligence and neurocognition based on the CHC theory.
Cattell–Horn–Carroll’s (CHC) Theory for Human Intelligence: The CHC theory23 is widely accepted as a backbone for many of today’s tests for human intelligence and neurocognition. The CHC theory divides human intelligence into three stratums24, as first laid out by Carroll in 1993 and later enriched by Cattel and Horn,25, and other researchers. As Fig 1 shows, the very top stratum in the CHC theory is a general intelligence (g),26 named by Spearman26 in 1904. The general intelligence g is a fundamental ability that supports all domains of neurocognitive abilities.26 It can be further divided into “broad abilities” (middle stratum). These broad abilities first include general fluid () and crystallized () intelligence factors, the so-called gF-gC model as proposed by Cattell et al in 1963.27 refers to the ability of reasoning and solving new problems while refers to the knowledge and experience accumulated over time. The broad abilities in the middle stratum also include short-term memory and learning ability (), long-term retrieval ability (), visual perception (), auditory perception (), cognitive speediness (), and processing speed (). Each of these broad abilities is subdivided into narrow abilities (the bottom stratum in Figure 1). The original 1993 version of the CHC theory has several variations in the 2010s28 and its history has been detailed online.29
Figure 1.
The Cattell-Horn-Carrol (CHC) Theory divides the general intelligence g (top stratum), which is hard to measure, into 8-10 broad abilities (middle stratum) and over 60 narrow abilities (bottom stratum), which are more measurable. Measuring these narrow abilities is the core of many of today’s neurocognitive and intelligence tests.
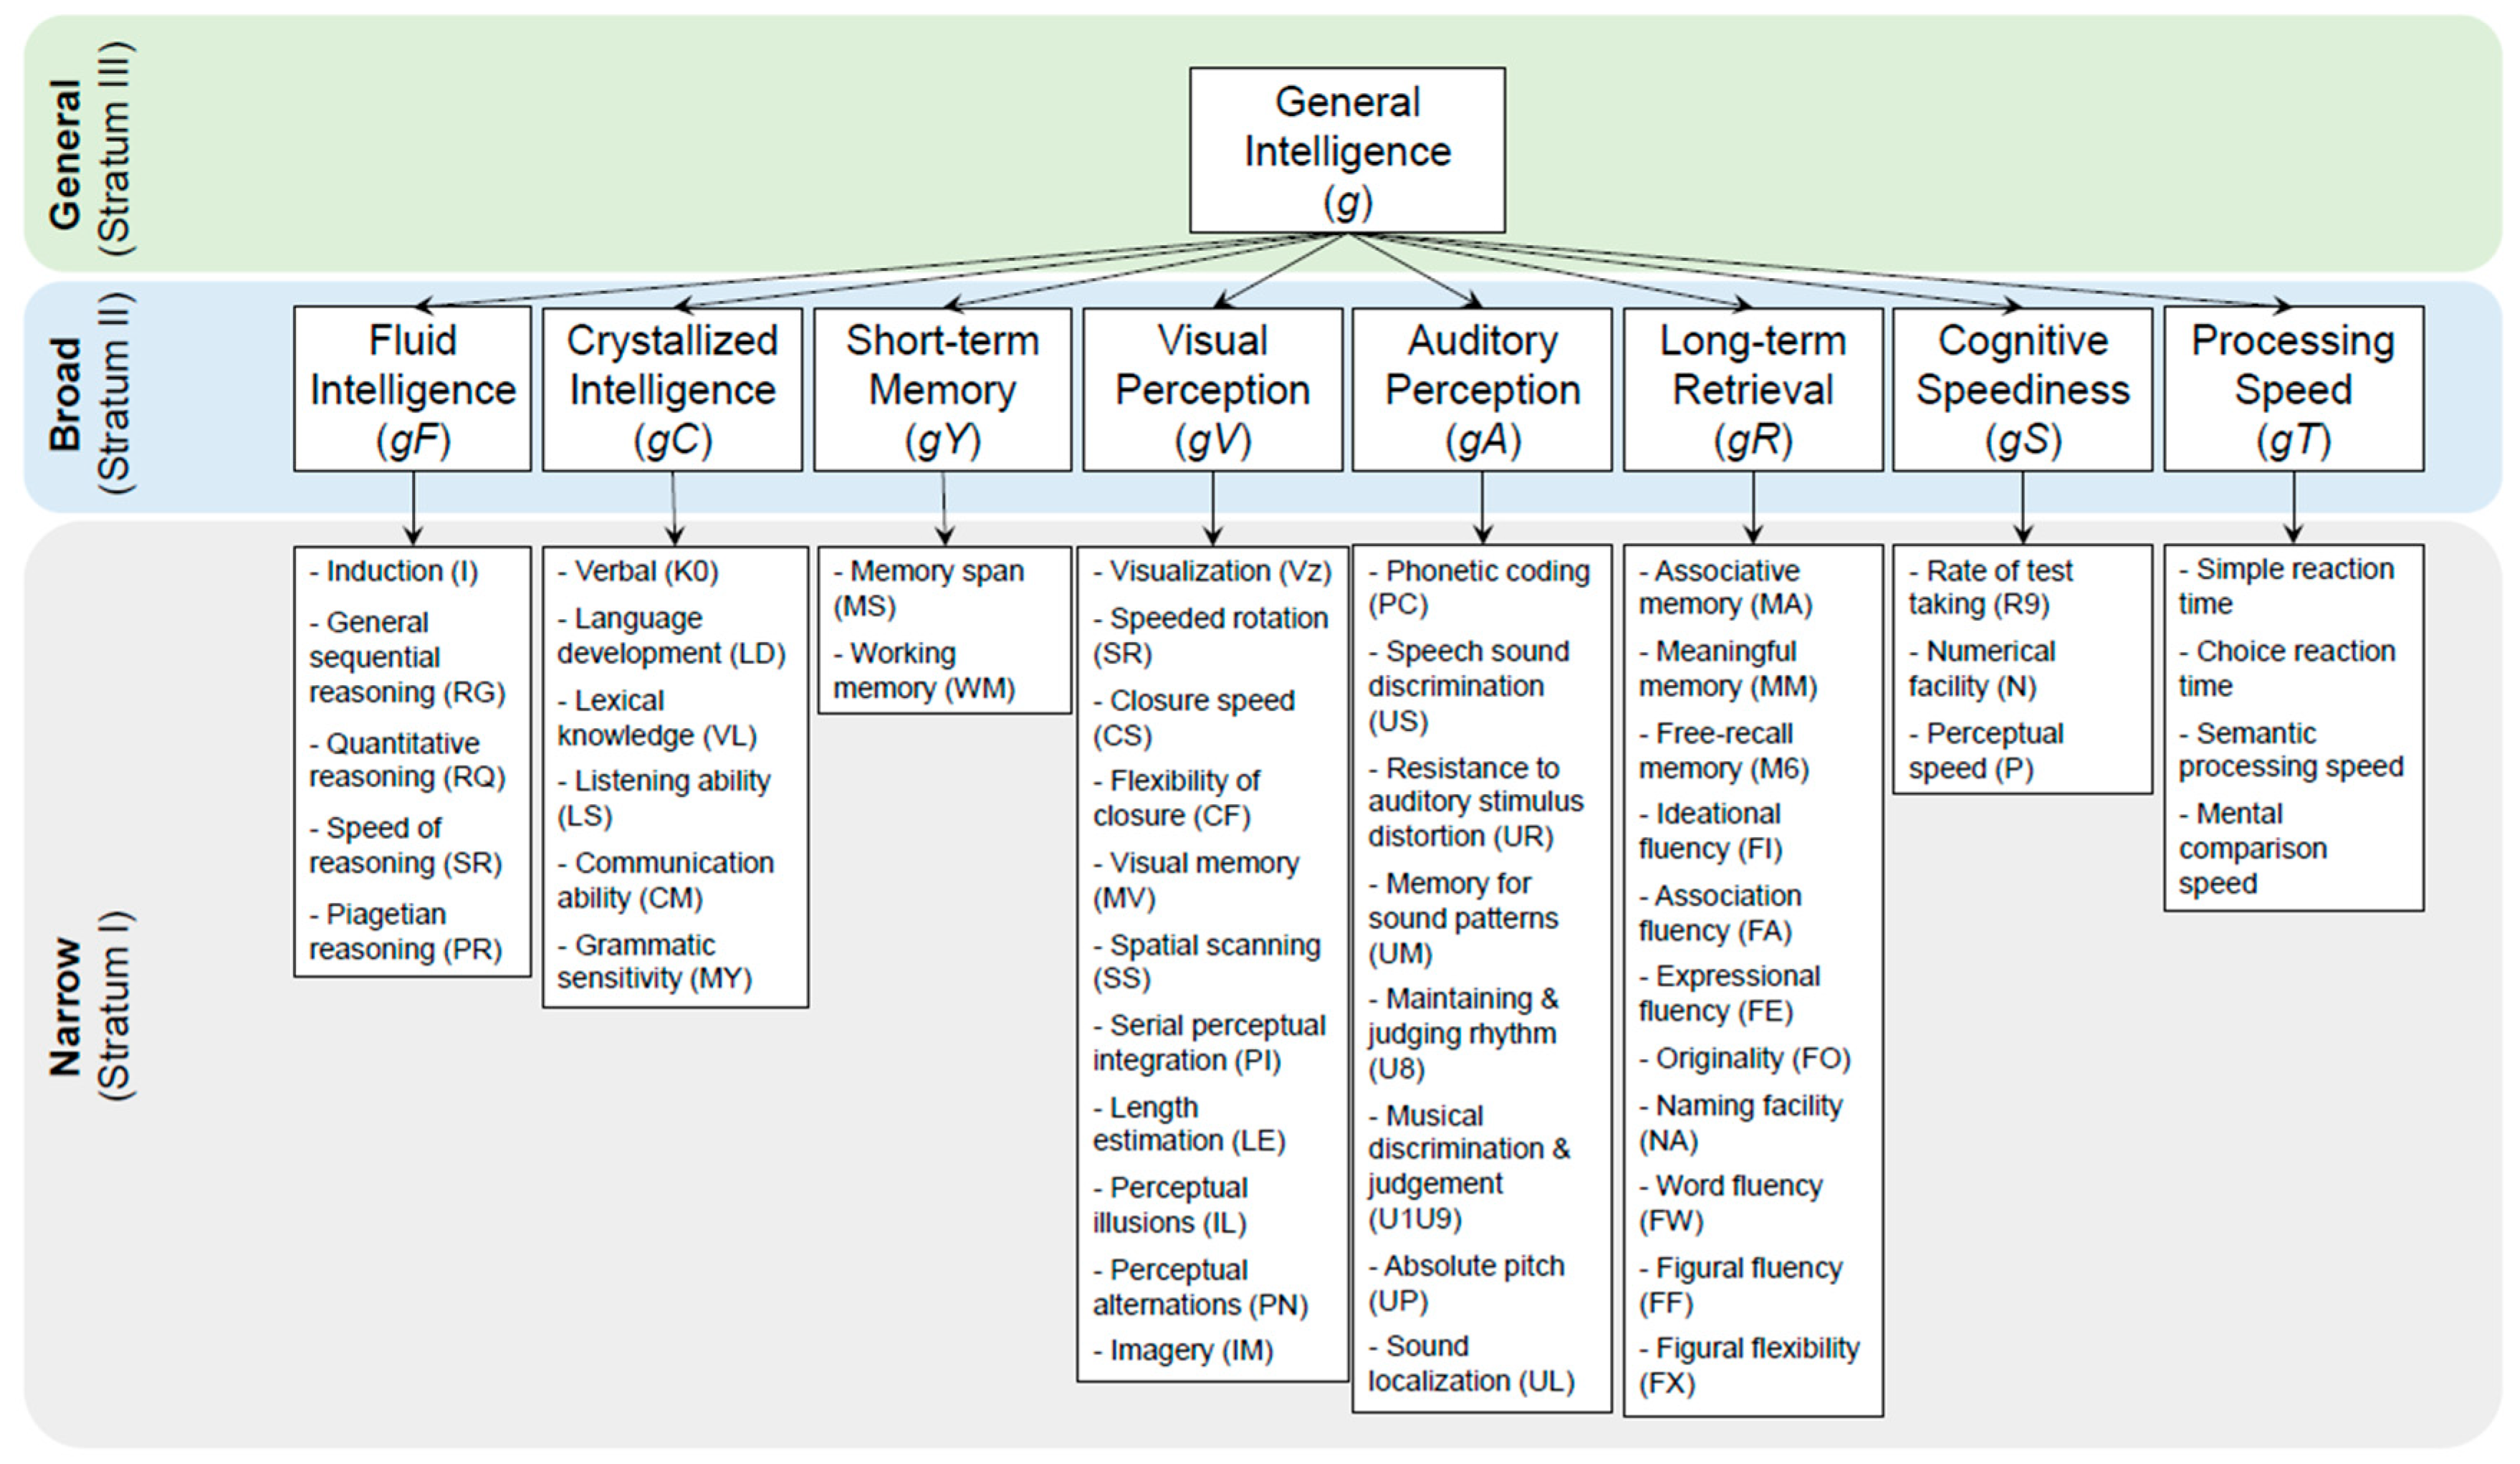
Intelligence and Neurocognition Tests: The CHC theory turns the difficult task of measuring the general intelligence g into more feasible tests of measuring 8-10 broad abilities and over 60 narrow abilities (middle and bottom stratum). Many of today’s intelligence and neurocognitive tests are designed to score these narrow abilities (bottom stratum in the CHC theory).23,30 Wechsler Adult Intelligence Scale IV (WAIS-IV)31, for example, assesses five different broad abilities (gC, gS, gV, gF, and gY) to estimate the full-scale intelligence quotient (FSIQ) as a proxy of g. Specifically, WAIS-IV tests the narrow abilities such as vocabulary, comprehension, similarities, information, and arithmetic, to assess the broad ability gC; other narrow abilities such as symbol search, coding, and cancellation to assess the broad ability gS; narrow abilities such as visual puzzles, block design, and picture completion to assess the broad ability gV; narrow abilities figure weights, arithmetic matrix, and reasoning to assess the broad ability gF; and other narrow abilities such as digit span, and letter-number sequencing to assess the broad ability gY.32 Similar sub-factoring for IQ scoring is also used for other popular scoring systems such as Wechsler Intelligence Scale for Children-V (WISC-V),33 Wechsler Abbreviated Scale of Intelligence-II (WASI-II),34 Woodcock-Johnson Tests of Cognitive Abilities-III (WJ-III)35, Mullen Scales of Early Learning (MSEL),36 and Bayley Scales of Infant Development (BSID)37, and others.
Cognitive Test Batteries: Although FSIQ is a good indicator of overall cognitive ability, it is also a composite score of different broad abilities. Thus, the FSIQ score often does not express the extent of cognitive impairment in single domains. Further, a deficit in one subtest (i.e., a deficit in one broad ability) is often compensated by a better performance in another subtest during FSIQ scoring.38 Hence, to examine a specific broad ability, different cognitive test batteries are widely used. Like conventional IQ tests, cognitive test batteries score human cognitive performance in several domains using subtests. Many domains overlap with the CHC's broad abilities, however, they also include additional domains like executive function and language performance.39 For example, the neuropsychological assessment battery (NAB)40 assesses five cognitive domains such as attention, language, memory, spatial, and executive functions. Another popular and widely used test battery, the NIH toolbox of neurocognitive battery (NIH-TCB)41 is designed to measure executive function, attention, episodic memory, language, processing speed, and working memory (see Figure 2).42
Theories linking brain structure and neurocognitive function
Neuroimaging studies since the 1980s have given rise to theories about brain structure-function mapping. Examples include network neuroscience theory (NNT),43 lateral prefrontal cortex theory (LPFCT),44 multiple-demand theory (M-DT),45 and process overlap theory (POT).46 Among these popular theories is the Parieto-Frontal Integration Theory (P-FIT), proposed by Jung and Haier in 2007, after reviewing 37 structure-function neuroimaging studies.47 The P-FIT theory, as detailed in Box 2, is influential as it offers insights that human intelligence/ neurocognition resides in large-scale connected brain regions known as brain networks.48
Box 2. The P-FIT Theory for Distributed Brain Network underlying Human Intelligence.
The P-FIT theory emphasizes network integrity most in the sustenance of human intelligence.18 The P-FIT theory involves four information processing stages, each involving different Brodmann areas (BAs) in the connected brain networks47,49 (see Figure 3):
Stage 1. It is assumed that humans first gather and process sensory information predominantly in the occipital and temporal areas. Early processing of sensory information happens in the extrastriate cortex (BAs 18 and 19). Recognition, imagery, and elaboration happen in the fusiform gyrus (BA 37). Analysis and elaboration of auditory information syntax happen in Wernicke’s area (BA 22).
Stage 2. This stage involves the structural symbolism, abstraction, and elaboration of the basic sensory information (in Stage 1) in the angular gyrus (BA 39), supramarginal gyrus (BA 40), and superior parietal lobule (BA 7).
Stage 3. This stage involves the interaction between parietal areas and frontal lobes (BAs 6, 9,10, 45, 46, and 47). This interaction supports problem-solving, evaluation, and hypothesis testing.
Stage 4. Once the best solution is reached, the anterior cingulate (BA 32) gets engaged for response selection and inhibition of competing responses.
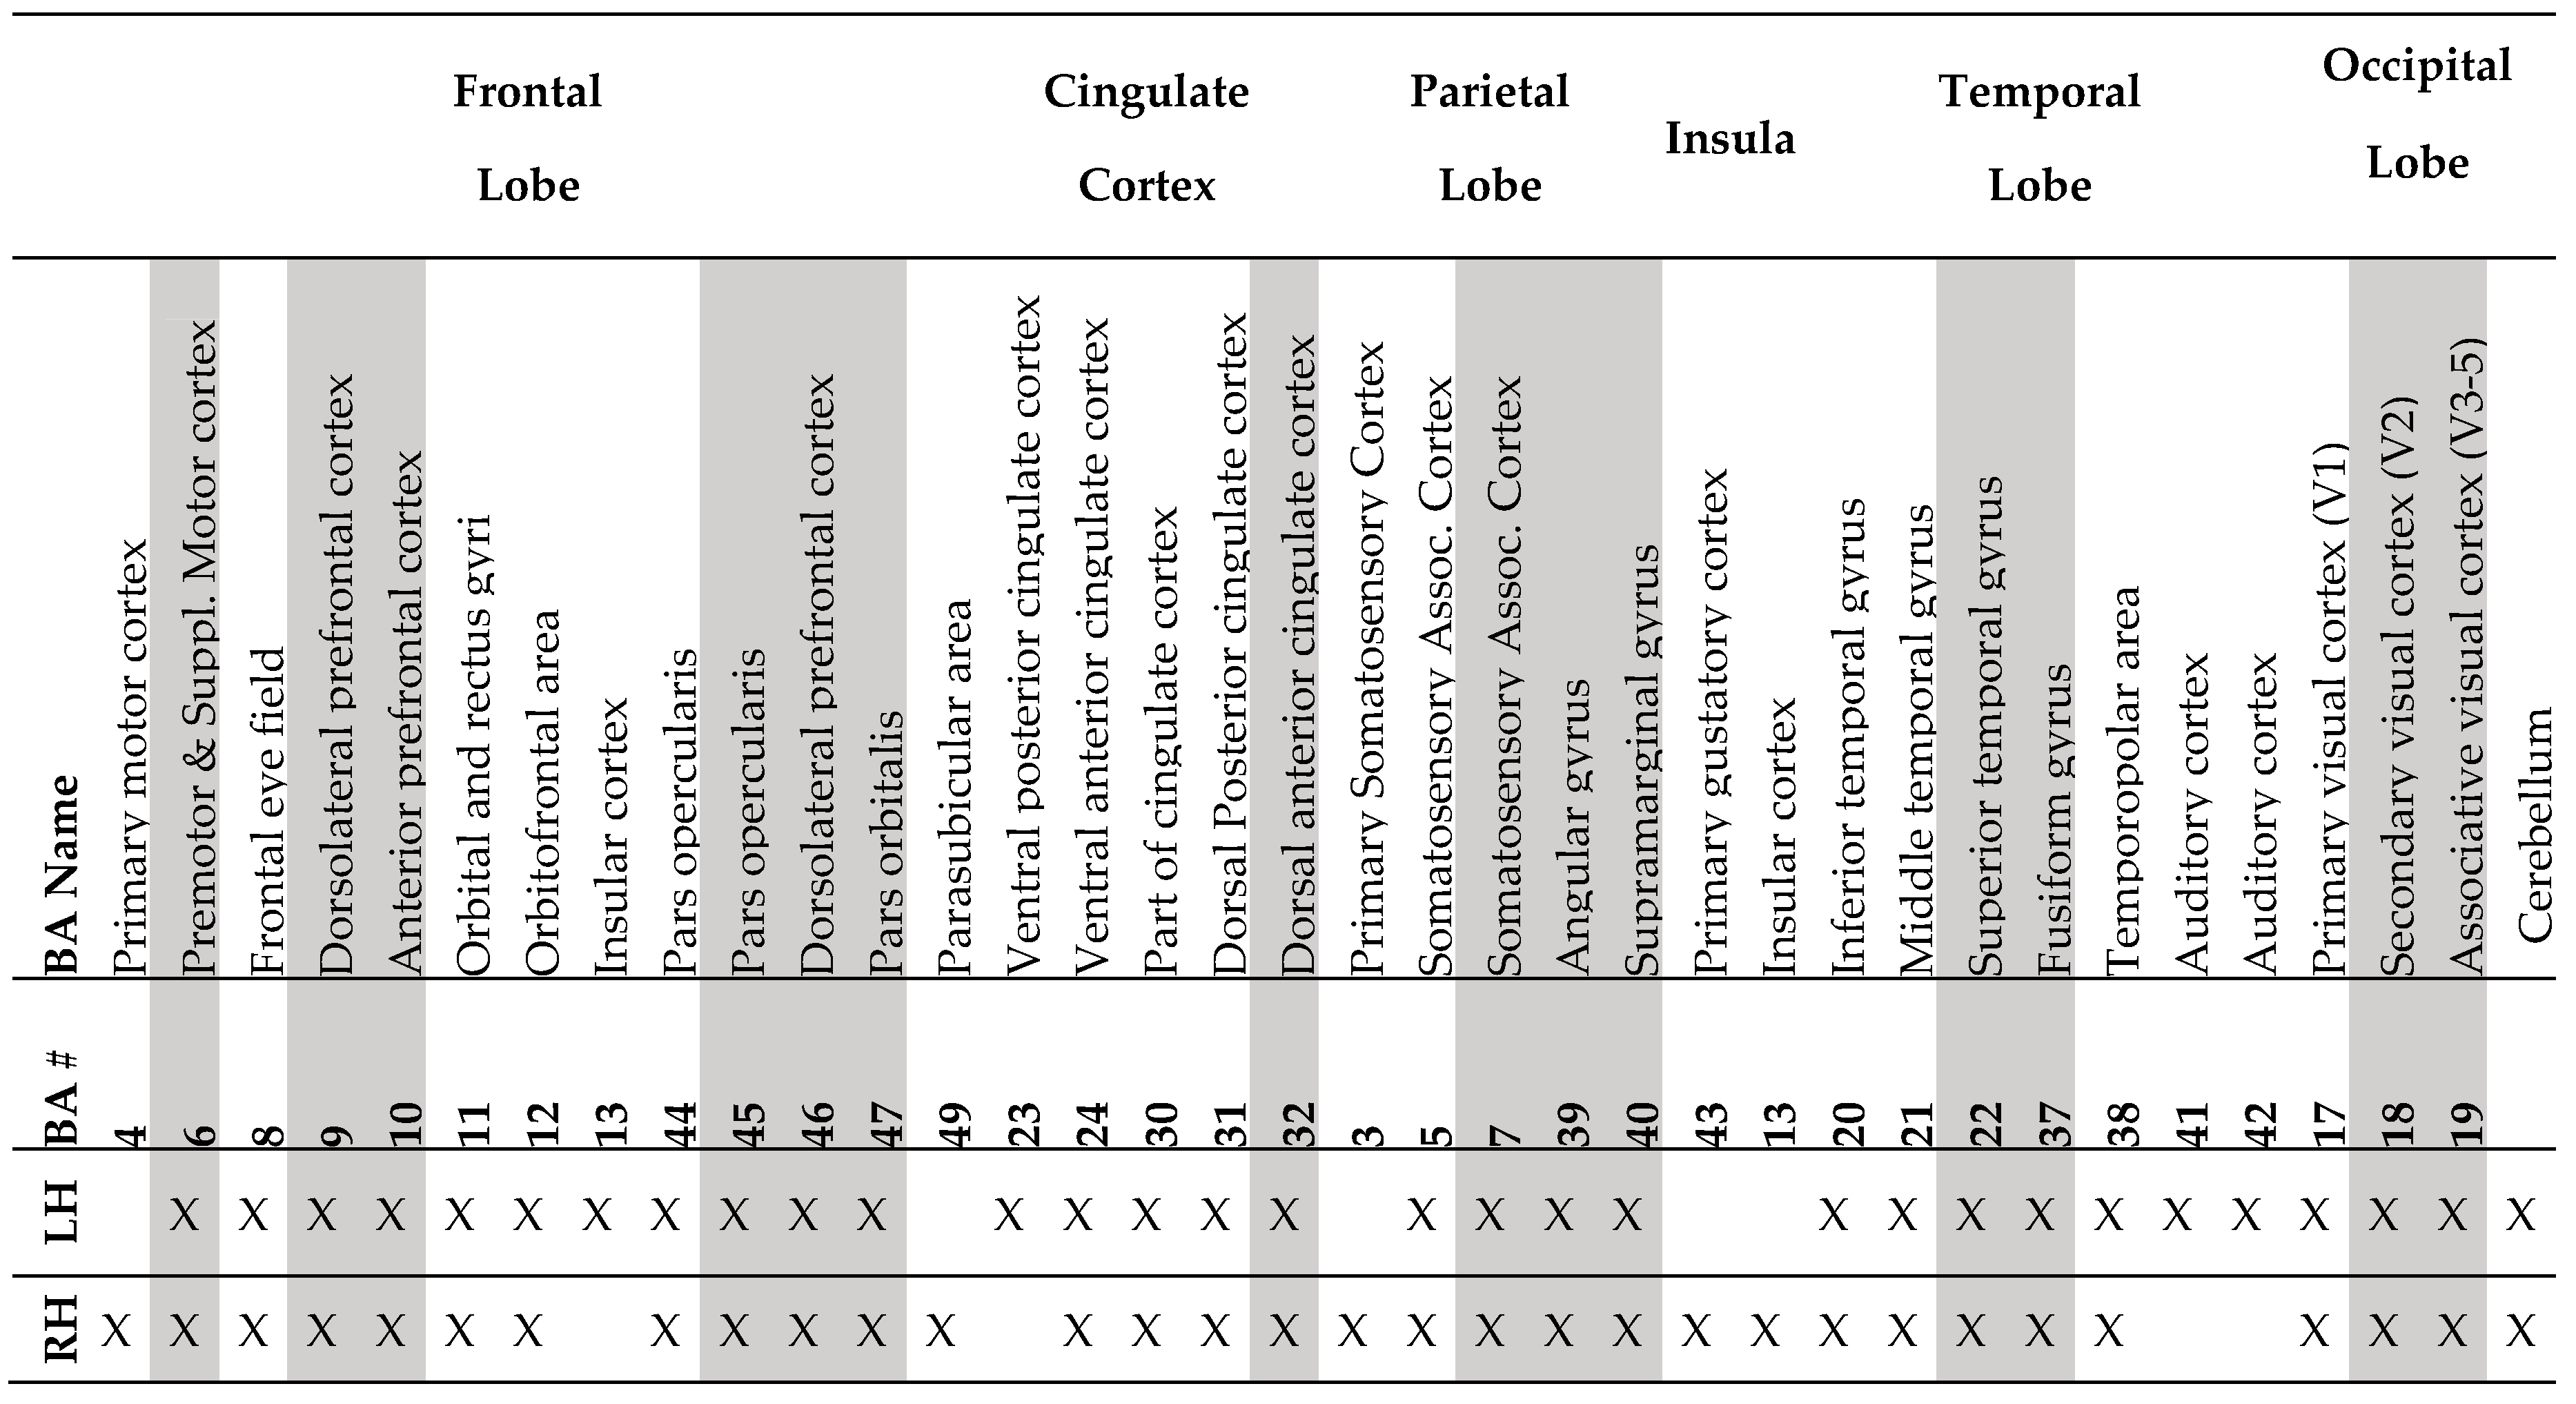
The P-FIT theory emphasizes that the whole process (Stages 1-4) depends upon the fidelity of underlying white matter connectivity. White matter facilitates rapid and error-free data transmission from the posterior to frontal brain regions. Note that the P-FIT model considers only those Brodmann areas, which appeared in more than 25% of the total 37 studies Jung and Haier47 reviewed. Table 1 covers a full spectrum of Brodmann areas that Jung and Haier have summarized47.
Figure 3.
Sensory information processing stages by the P-FIT model. Brodmann area (BA) numbers are color coded to correspond to different stages of information processing.
Figure 3.
Sensory information processing stages by the P-FIT model. Brodmann area (BA) numbers are color coded to correspond to different stages of information processing.
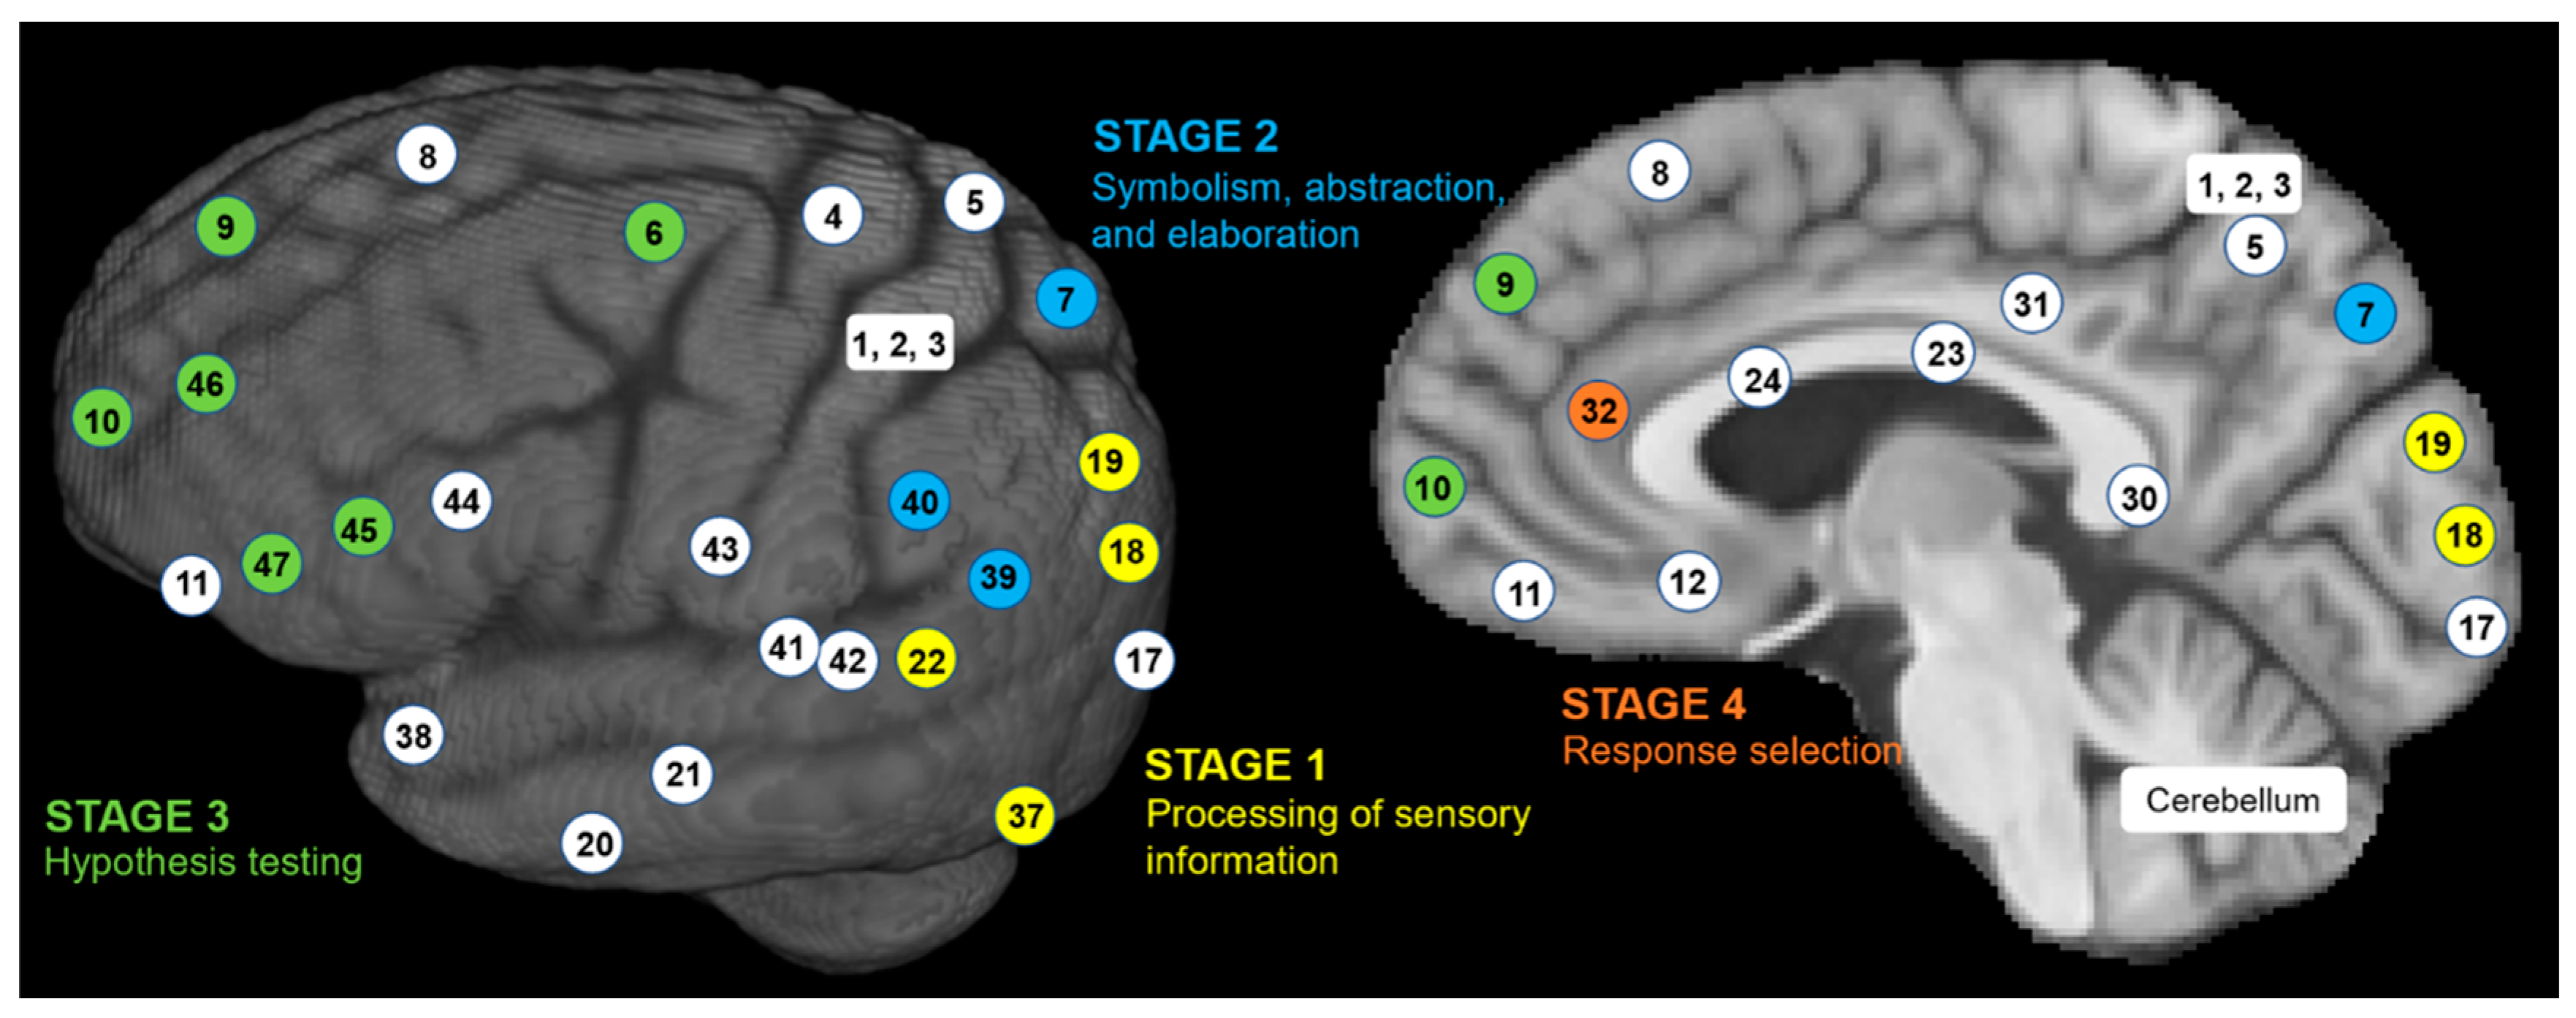

Table 1.
Brodmann areas were found to be related to human cognition and intelligence in a total of 37 studies over 1,557 subjects, reported by Jung and Haier in 200747. Only shaded columns of Bas comprise the P-FIT model. Acronyms- BA: Brodmann Area, LH: Left Hemisphere, RH: Right Hemisphere.
Table 1.
Brodmann areas were found to be related to human cognition and intelligence in a total of 37 studies over 1,557 subjects, reported by Jung and Haier in 200747. Only shaded columns of Bas comprise the P-FIT model. Acronyms- BA: Brodmann Area, LH: Left Hemisphere, RH: Right Hemisphere.
Structural MRI to Infer Intelligence and Neurocognition
Typical brain MRIs include structural, diffusion, functional, and other sequences. This section starts with structural MRI (sMRI) and its inference of human intelligence and neurocognition. sMRI includes T1-, T2-weighted MRI (T1/T2-MRI), proton density, and other sequences. Subsections below will introduce morphometric features from sMRI (see review for more details50) and their use of them to infer neurocognition and intelligence.
Regional Brain Volume to Infer Neurocognition/Intelligence. Software packages such as FreeSurfer,51 FSL,52 AFNI,53 and others (see review54) allow us to automatically segment the T1- or T2-weighted brain MRIs into hemispheres (left and right), tissue types (white matter, gray matter, cerebrospinal fluid), and regions using single/multi-atlas55 or machine learning56 approaches. The volumes of these structures have been used to correlate with neurocognition or intelligence test scores.
Early studies argued that the attentional control mechanism, the linkage between sensory discrimination and intelligence,57 corresponds to the volumes in brain regions such as lateral fronto-parietal cortex58 (includes BAs 6, 8, 9), dorsal anterior cingulate58,59 (includes BA 32), and lateral posterior cerebellum.58 As summarized in Table 3 of the supplementary materials, recent structural MRI-based predictive methods55,60–70 that used brain regional volumes found that the fronto-parietal (includes BAs 6, 8, and 9), cingulo opercular (includes BAs 22, 41, and 42), visual (includes BAs 17, 18, and 19), somatosensory (includes BAs 1, 2, 3, 5, and 7), right posterior cingulate gyrus (BAs 23, 31), left caudate nucleus, entorhinal white matter (BA 28), globus pallidus, precentral gyrus (BA 4), corpus callosum, left/right hippocampus, parahippocampal gyrus (BA 34), thalamus, precentral gyrus (BA 4), caudate nucleus, pons, and motor (includes BAs 4 and 6) cortex areas are related to the fluid intelligence in adolescents. This study predicted the residual fluid intelligence score of more than 3500 adolescents with a mean square error (MSE) ranging from 92 to 101 (for a range of true residual fluid intelligence score of [-40, 30]),55,60–69 or a correlation of 10% (p <0.05),70 which further strengthens the arguments from the previous studies58,71,72 as well as the P-FIT theory. Another study73 involving a comparatively smaller adult data cohort (N = 211) reported a positive correlation of overall gray matter volume with fluid intelligence (r = 0.16; p < 0.01), working memory (r = 0.21; p < 0.01), and quantitative reasoning (r = 0.26; p < 0.01). Similar findings are reported for an infant data cohort,74 where the pre-term fetal growth restricted (P-FGR) infants group had lower mean gray matter, white matter, thalamic, cerebellar white matter, and hippocampal volumes compared to that of pre-term appropriate gestational age (PT-AGA) and term AGA (T-AGA). This difference in brain volumes is reflected in the mean FSIQ scores of PT-FGR and PT-AGA groups, 80 and 103, respectively.74 Insight test battery (ITB)-based cognitive scores can also be predicted (p < 0.001) from gray matter volumes in the right insula, right middle cingulate cortex/precuneus (BAs 13, 14, 16, 4).75 Another study76 used relative gray matter volume per voxels from the region of fronto-parietal network (includes BAs 6, 8, and 9), default mode network (includes BAs 38, 25, 23, 31, and 4), dorsal attention network (includes BAs 17, 18, 19, 8, 7, and 6), and cerebellum in principal component analysis (PCA) and showed an MSE and correlation between the actual and estimated FSIQ is 320 (p = 0.279) and r = 0.11, respectively (for true residual FSIQ in the range of [39, 136]). The caudate also plays a vital role in the rewarding system of human reinforcement learning during making a choice and action,77,78 and a significant positive correlation (r = 0.24; p = 0.01) between the caudate volume and FSIQ is also reported.79
Cortical Surface Metrics to Infer Neurocognition/Intelligence. In addition to the regional brain volumes, metrices on cortical surface also play a vital role in inferring human intelligence. Automated software such as FreeSurfer can reconstruct brain cortical surfaces, and extract cortical surface areas, cortical thickness, cortical folding curvatures, and gyrification indices. Previous studies reported that information integration and processing happen in the parahippocampal gyrus (includes BA 34) and precuneus/cuneus cortex11,80 (includes BAs 4, 19), visual identification and recognition happen in the ventral temporal cortex81,82 and integration and retrieval of semantic knowledge happen in the medial temporal lobes83 (includes BA 38).
Table 3.
Summary of sMRI studies correlating regional brain volumes with neurocognition/intelligence. Acronyms- ANCOVA: Analysis of Covariance, ABCD: Adolescent Brain Cognitive Development, NKI: Nathan S. Kline Institute for Psychiatric Research, NIH-TCB: NIH toolbox of neurocognitive battery, PCA: Principal Component Analysis, LASSO: Least Absolute Shrinkage and Selection Operator, SVM: Support Vector Machine, SVR: Support Vector Regression, RF: Random Forest, LR: linear regression, RR: ridge regression, MLP: multi-layer perceptron, CNN: Convolutional Neural Network, ROI: Region of Interest, KNN: K-Nearest Neighbors, MSE: Mean Square Error, RMSE: Root MSE, WASI: Weschler Abbreviated Scale of Intelligence, WISC: Wechsler Intelligence Scale for Children, WAIS: Wechsler Adult Intelligence Scale, FSIQ: Full-scale Intelligent Quotient, BOMAT: Bochum Matrices Test, T1-w: T1-weighted MRI, T2-w: T2-weighted MRI, P-FGR: Pre-term Fetal Growth Restricted, PT-AGA: Pre-term Appropriate Gestational Age, T-AGA: Term AGA, DTI: Diffusion Tensor Imaging, ICV: intracranial volume, WM: white matter, GM: gray matter, CSF: cerebrospinal fluid, N/A: not available, not mentioned. Probable BAs are not specified for either left or right hemisphere.
| Study | Year | N |
Age (years) |
Dataset | MRI type | MRI features | Regions | Probable BAs |
IQ/ Neuro. Test |
Normal/ Abnormal |
Method |
Correlation/ Finding |
| Saha et al.70 | 2021 | 7709 | 9-10 | ABCD | T1-w | CNN learned features and volumes of manually identified brain regions | GM regions of left/right hippocampus, parahippocampal gyrus, thalamus, precentral gyrus and caudate nucleus; WM region of the pons. | 34, 4 | NIH-TCB | Normal | CNN and MLP | Correlation between the actual and predicted gF = 0.1 (p < 0.05) |
| Hilger et al.76 | 2020 | 380 | 18-60 | NKI-Rockland-Enhanced | T1-w | GM volume per voxel | Frontoparietal network, default mode network, Dorsal attention network, and cerebellum | 38, 25, 23, 31, 4, 17, 18, 19, 8, 7, 6, 9 | WASI | Normal | PCA | MSE and correlation between the actual and estimated FSIQ is 320 (p = 0.279) and 0.11, respectively (for true residual FSIQ in the range of [39, 136]) |
| Chiang et al.60 | 2019 | 8669 | 9-10 | ABCD | T1-w | Total volume, mean signal intensity, and entropy | Visual, frontoparietal, somatosensory, motor, default mode network, and cingulo opercular network. | 6, 8, 9, 22, 41, 42, 17, 18, 19, 1, 2, 3, 5, 7, 4 | NIH-TCB | Normal | CNN, and LASSO | Mean Square Error (gF) = 95.38 (for true residual gF in the range of [-40, 30]) |
| Shrivastava et al.61 | 2019 | 8669 | 9-10 | ABCD | T1-w | Volume, mean intensity, and count of GM voxels | Gyrus rectus, hippocampus, inferior frontal gyrus, middle frontal gyrus, postcentral gyrus, precentral gyrus, precuneus, superior frontal gyrus and supramarginal gyrus. | 11, 44, 45, 47, 4, 1, 2, 3, 10, 12, 40 | NIH-TCB | Normal | CNN, SVR, RF, gradient boosting, and XGBoost | Mean Square Error (gF) = 93.68 (for true residual gF in the range of [-40, 30]) |
| Ren et al.62 | 2019 | 8669 | 9-10 | ABCD | T1-w | ROI volumes | GM | 11, 44, 45, 47, 4, 1, 2, 3, 10, 12, 40 | NIH-TCB | Normal | Bagging and boosting of LR, RR, RF, envelope-based reduced-rank regression, LASSO, Elastic-Net regressor, and KNN | Mean Square Error (gF) = 92.99 (for true residual gF in the range of [-40, 30]) |
| Tamez-Pena et al.63 | 2019 | 8669 | 9-10 | ABCD | T1-w | ROI volumes | GM, WM, CSF, and cerebellum | 11, 44, 45, 47, 4, 1, 2, 3, 10, 12, 40 | NIH-TCB | Normal | Ensemble of SVM, RF, and bootstrapped step wise model selection | Mean Square Error (gF) = 100.89 (for true residual gF in the range of [-40, 30]) |
| Brueggeman et al.64 | 2019 | 8669 | 9-10 | ABCD | T1-w | 122 ROI volumes | GM, WM, CSF | 11, 44, 45, 47, 4, 1, 2, 3, 10, 12, 40 | NIH-TCB | Normal | RF | Mean Square Error (gF) = 92.49 (for true residual gF in the range of [-40, 30]) |
| Mihalik et al.65 | 2019 | 8669 | 9-10 | ABCD | T1-w | Voxel intensities and probabilistic tissue-type labels | GM, WM | 11, 44, 45, 47, 4, 1, 2, 3, 10, 12, 40 | NIH-TCB | Normal | Kernel ridge regressor | Mean Square Error (gF) = 92.13 (for true residual gF in the range of [-40, 30]) |
| Ranjbar et al.66 | 2019 | 8669 | 9-10 | ABCD | T1-w | 122 ROI volumes | GM, WM, CSF | 11, 44, 45, 47, 4, 1, 2, 3, 10, 12, 40 | NIH-TCB | Normal | CNN and RF | Mean Square Error (gF) = 93.64 (for true residual gF in the range of [-40, 30]) |
| Wlaszczyk et al.67 | 2019 | 8669 | 9-10 | ABCD | T1-w | ROI volumes, signal intensity, anterior and posterior cross-sectional area from corpus callosum | GM and corpus callosum |
11, 44, 45, 47, 4, 1, 2, 3, 10, 12, 40 | NIH-TCB | Normal | RF | Mean Square Error (gF) = 92.93 (for true residual gF in the range of [-40, 30]) |
| Zhang-James et al.55 | 2019 | 8669 | 9-10 | ABCD | T1-w | 122 ROI volumes | GM, WM, CSF | 11, 44, 45, 47, 4, 1, 2, 3, 10, 12, 40 | NIH-TCB | Normal | Nu SVM | Mean Square Error (gF) = 95.63 (for true residual gF in the range of [-40, 30]) |
| Kao et al.68 | 2019 | 8669 | 9-10 | ABCD | T1-w | 122 ROI volumes | GM, WM, CSF | 11, 44, 45, 47, 4, 1, 2, 3, 10, 12, 40 | NIH-TCB | Normal | StackNet consisting of random forest, random tree, ridge regressor, and gradient boosting | Mean Square Error (gF) = 94.25 (for true residual gF in the range of [-40, 30]) |
| Li et al.69 | 2019 | 8669 | 9-10 | ABCD | T1-w | ROI volumes, # detected surface holes, the globus pallidus volume, the mean curvatures of precentral gyrus, postcentral gyrus, and banks of Superior Temporal Sulcus | Right posterior cingulate gyrus, left caudate nucleus, entorhinal white matter, globus pallidus, precentral gyrus, postcentral gyrus, and superior temporal sulcus | 23, 31, 28, 4, 1, 2, 3, 22 | NIH-TCB | Normal | BlockPC-XGBoost | Mean Square Error (gF) = 93.16 (for true residual gF in the range of [-40, 30]) |
| Morsing et al.74 | 2018 | 74 | 7-8 | Skane University Hospital in Lund, Sweden | T1-w | ROI volumes | ICV, GM, WM, CSF, and thalamus. | N/A | WISC-III | P-FGR, PT-AGA, and T-AGA | Chi-square and ANOVA | The mean (SD) FSIQ was 80 (17) in the PT-FGR group and 103 (12) in the PT-AGA group |
| Ogawa et al. 75 | 2018 | 232 | 21-69 | Advanced Telecommunication Research Institute International, Kyoto | T1-w | GM volume | Right insula, right middle cingulate cortex/precuneus | 13, 14, 16, 4 | Insight test battery (ITB) | Normal | Pearson correlation | ITB score was positively correlated with the GM volumes in the mentioned region (p < 0.001) |
| Paul et al.73 | 2016 | 211 | 18-44 | University of Illinois Urbana-Champaign | T2-w | Volume fractions across tissue types | GM, WM, CSF | 23, 31 | BOMAT, Number Series, and Letter Set | Normal | Bivariate correlation | GM volume is found positively correlated with quantitative reasoning (r = 0.26; p < 0.01) and working memory (r = 0.21; p < 0.01), and gF (r = 0.16; p < 0.01) |
|
Grazioplene et al.
79 |
2015 | 517 | 18-40 | University of Minnesota, University of New Mexico in Albuquerque, Yale University | T1-w MPRAGE | Caudate volume | Caudate nucleus | N/A | WAIS-III, WAIS-IV, WASI |
Normal | LR | Regression of IQ onto bilateral caudate volume indicated a significant positive correlation between caudate volume and FSIQ (r = 0.24; p = 0.01) |
Cortical metrics are often combined with regional volumes to predict neurocognition. Studies using the ABCD dataset predicted the residual fluid intelligence score of more than 4500 adolescents with an MSE ranging from 93 to 95 (for a range of true residual fluid intelligence score of [-40, 30]), as summarized in Table 4 of the supplementary materials. These studies used cortical thicknesses, curvatures, and surface areas in conjugation with the regional volumes from the left middle temporal gyrus (BA 21), the right superior temporal gyrus (BA 22), left/right parahippocampal gyrus (BA 34), pons white matter, hippocampus, posterior cingulate gyrus (BAs 23, 31), cuneus (BA 19), left lingual gyrus (BA 19), left middle frontal gyrus (BA 10), supramarginal gyrus (BA 40), right fusiform gyrus (BA 37), superior temporal gyrus (BA 22), right anterior cingulate gyrus (BAs 24, 32, 33), and other brain structures.84–89
Significant positive correlations were also observed between the Reynolds intellectual assessment scales (RIAS) composite IQ scores and cortical gray matter volumes in the orbitofrontal gyrus (BAs 11, 12) (r = 0.41; p = 0.03), transverse temporal gyri (BAs 41, 42) (r = 0.42; p = 0.02), left superior temporal gyrus (BA 22) (r = 0.41; p = 0.04), and right anterior cingulate gyrus (BAs 24, 32, 33) (r = 0.42; p = 0.03).90 The local gyrification and surface area in the superior parietal (BA 7), left supramarginal (BA 40), left caudal middle frontal (BA 22), left pars-opercularis (BA 44), left inferior temporal (BA 20), right inferior and middle temporal (BA 21), right medial orbitofrontal (BAs 11, 12), and right rostral middle frontal (BA 10) regions are also found correlated to gF (r = 0.29; p < 0.001) and (r = 0.22; p < 0.001), respectively, and to gC (r = 0.28; p < 0.001) and (r = 0.28; p < 0.001), respectively, on a healthy young dataset (age = 21-35 years).91 In another study,92 significant positive relationship between cortical thickness in the superior parietal lobe (BA 7) and FSIQ, PIQ, and VIQ is seen at a cluster-forming threshold (CFT) of p < 0.05. Similarly, positive relationship between cortical volume in the inferior parietal lobe (BAs 39, 40) and FSIQ and PIQ is seen at a CFT of p < 0.05. Additionally, cortical volume is found positively associated with VIQ in the left insula (BAs 13, 14, 16) and FSIQ within the inferior frontal gyrus (BAs 44, 45, 47).92
Mullen scales of early learning (MSEL) cognitive ability such as visual reception, fine motor, receptive language, expressive language, and early learning composite, has also been found positively correlated with cortical thickness (r = 0.14, p = 0.025; r = 0.186, p = 0.002; r = 0.147, p = 0.016; r = 0.120, p = 0.049, respectively) of the infants at age 1 year, especially in the bilateral superior frontal and middle frontal gyri (BA 10), right medial superior frontal gyrus (BA 10), right occipital superior gyrus (BA 19), bilateral superior parietal cortices (BA 7), left primary motor cortex (BA 4), bilateral anterior cingulate (BAs 24, 32, 33) and precuneus (BA 4), and right superior and middle temporal cortices (BA 22) areas.93 Similar findings are also reported for MSEL-based future (at 4 years of age) cognitive score prediction using sMRI brain features at birth such as cortical thickness, mean curvature, local gyrification index, vertex area, vertex volume, sulcal depth in string distance and sulcal depth in Euclidean distance with a mean root square error of 0.067-0.18.94–96
Better FSIQ level has also been reported for thinner parietal association cortices, especially left/right inferior parietal (BAs 39, 40) and left/right superior parietal (BA 7) cortices.97 Overall FSIQ has been found98–100 correlated (r = 0.3~0.7; p < 0.01) with the cortical thickness, surface area, sulcal depth, curvature from the left and right parahippocampal gyrus (BA 34), left olfactory cortex (BA 35), right fusiform gyrus (BA 37), bilateral transverse temporal gyri (BAs 41, 42), bilateral thalamus, left parahippocampal gyrus (BA 34), left hippocampus, right opercular part of inferior frontal gyrus (BAs 44, 45, 47), left anterior cingulate gyrus (BAs 24, 32, 33), right amygdala, left lingual gyrus (BA 19), left superior parietal lobule (BA 7), right inferior parietal lobule (BAs 39, 40), left angular gyrus (BA 39), left paracentral lobule, and left caudate nucleus (BAs 1-4).
Voxel- and Surface-based Morphometry to Infer Neurocognition/Intelligence. VBM101 and SBM102 allows the correlation of MRI volume or surface metrics at the voxel or surface vertex level. They are extensions of the correlation at the regional or surface area levels.103 In Table 5 of the supplementary materials, we summarized existing VBM and SBM-based neurocognitive predictive studies.
Table 4.
Summary of sMRI studies correlating cortical surface metrices with neurocognition/intelligence. Acronyms- ABCD: Adolescent Brain Cognitive Development, NIH-TCB: NIH toolbox of neurocognitive battery, LASSO: Least Absolute Shrinkage and Selection Operator, SVM: Support Vector Machine, SVR: Support Vector Regression, CNN: Convolutional Neural Network, ROI: Region of Interest, KNN: K-Nearest Neighbors, MSEL: Mullen Scale of Early Learning, PMAT: Penn Progressive Matrices, RIAS: Reynolds Intellectual Assessment Scales, RPM: Raven’s Advanced Progressive Matrices Set, GM: Gross Motor, VR: Visual Reception, FM: Fine Motor, RL: Receptive Language, EL: Expressive Language, ELC: Early Learning Composite, CFT: Cluster Forming Threshold, RMSE: Root Mean Square Error, WISC: Wechsler Intelligence Scale for Children, WAIS: Wechsler Adult Intelligence Scale, ABIDE: Autism Brain Imaging Data Exchange, BOLD: Blood-oxygenation Level-dependent, T1-w: T1-weighted MRI, T2-w: T2-weighted MRI, DWI: Diffusion-weighted Imaging. Probable BAs are not specified for either left or right hemisphere.
| Study | Year | N |
Age (years) |
Dataset | MRI type | MRI features | Regions | Probable BAs |
IQ/ Neuro. Test |
Normal/ Abnormal |
Method |
Correlation/ Finding |
| Zhang et al.96 | 2020 | 23 | 0-4 | UNC Chapel Hill Early Brain Development Study | T1-w, T2-w |
Cortical thickness, mean curvature, local gyrification index, vertex area, vertex volume, sulcal depth in string distance, and sulcal depth in Euclidean distance | Parcellation of the cerebral cortex into 70 anatomically meaningful ROIs | Not specified | VR, FM, RL, EL, and ELC (MSEL) | Normal | CNN | RMSE between the predicted and actual VR, FM, RL, and EL scores is 0.067 |
| Li et al.90 | 2020 | 68 | 8 | Arkansas Children's Nutrition Center | T1-w | Gray matter volume, surface area, and cortical thickness | Orbitofrontal gyrus, transverse temporal gyri, left superior temporal gyrus, and right anterior cingulate gyrus | 11, 12, 41, 42, 22, 24, 32, 33 | RIAS | Normal | Spearman’s correlation test | RIAS scores showed significant correlations (r = [0.38-0.44], p = [0.005-0.046]) with cortical metrices |
| Tadayon et al.91 | 2020 | 740 | 21-35 | HCP | T1-w | Cortical thickness, cortical surface area, and cortical gyrification | Superior parietal, left supramarginal, left caudal middle frontal, left pars-opercularis, left inferior temporal, right inferior and middle temporal, right medial orbitofrontal, and right rostral middle frontal regions | 7, 40, 22, 44, 20, 21, 11, 12, 10 | PMAT and NIH-TCB | Normal | Linear regression | Correlation between the local gyrification, and surface area with gF and gC are 0.29 and 0.22 (p < 0.001), 0.28 and 0.28 (p < 0.001), respectively |
| Oxtoby et al.84 | 2019 | 8669 | 9-10 | ABCD | T1-w | Cortical morphology as graph | A structural co-variance network graph considers small cortical regions (3 voxels cubed) as nodes, and structural similarity (morphology) between nodes as edges. | 11, 44, 45, 47, 4, 1, 2, 3, 10, 12, 40 | NIH-TCB | Normal | Event-based model of progression, and SVR | Mean Square Error (gF) = 93.83 (for true residual gF in the range of [-40, 30]) |
| Rebsamen et al.85 | 2019 | 8669 | 9-10 | ABCD | T1-w | Subcortical volumes, cortical thicknesses, curvatures, and surface areas | Middle temporal gyrus, superior temporal gyrus | 21, 22 | NIH-TCB | Normal | SVR | Mean Square Error (gF) = 93.03 (for true residual gF in the range of [-40, 30]) |
| Valverde et al.86 | 2019 | 8669 | 9-10 | ABCD | T1-w | 122 ROI volumes in the gray matter, white matter, and cerebrospinal fluid, 78 contrast and 78 cortical thickness measures, gender, age, and scanner manufacturer | Gray matter, white matter, and cerebrospinal fluid | Not specified | NIH-TCB | Normal | Fully connected neural network | Mean Square Error (gF) = 94.02 (for true residual gF in the range of [-40, 30]) |
| Pölsterl et al.87 |
2019 | 8669 | 9-10 | ABCD | T1-w | Cortical thickness and volumes of 122 ROIs in the gray matter, white matter, and cerebrospinal fluid | Left/right parahippocampal gyrus, pons white matter, hippocampus, posterior cingulate gyrus, cuneus, left lingual gyrus, left middle frontal gyrus, supramarginal gyrus, right fusiform gyrus, superior temporal gyrus, right anterior cingulate gyrus, etc. |
34, 23, 31, 19, 10, 40, 37, 22, 24, 32, 33 | NIH-TCB | Normal | An ensemble of gradient boosted trees, and a linear ridge regressor. | Mean Square Error (gF) = 94.25 (for true residual gF in the range of [-40, 30]) |
| Pölsterl et al.88 | 2019 | 8669 | 9-10 | ABCD | T1-w | Cortical thickness and volumes of 122 ROIs in the gray matter, white matter, and cerebrospinal fluid | Left/right parahippocampal gyrus, pons white matter, hippocampus, posterior cingulate gyrus, cuneus, left lingual gyrus, left middle frontal gyrus, supramarginal gyrus, right fusiform gyrus, superior temporal gyrus, right anterior cingulate gyrus, etc. |
34, 23, 31, 19, 10, 40, 37, 22, 24, 32, 33 | NIH-TCB | Normal | AutoML ensembles of 14 classifiers | Mean Square Error (gF) = 94.25 (for true residual gF in the range of [-40, 30]) |
| Guerdan et al.89 | 2019 | 8669 | 9-10 | ABCD | T1-w | Volume, elongation, surface area, roundness, and flatness of grey matter ROIs. | Gray matter, white matter, and cerebrospinal fluid |
Not specified | NIH-TCB | Normal | LASSO, ridge regressor, SVR, gradient boosting, and AdaBoost regressors. | Mean Square Error (gF) = 94.48 (for true residual gF in the range of [-40, 30]) |
| Girault et al.93 | 2019 | 487 | 1-2 | University of North Carolina (UNC) Chapel Hill Early Brain Development Study | T1-w, T2-w |
Cortical thickness, and surface area | Bilateral superior frontal and middle frontal gyri, right medial superior frontal gyrus, right occipital superior gyrus, bilateral superior parietal cortices, left primary motor cortex, bilateral anterior cingulate and precuneus, and right superior and middle temporal cortices areas | 10, 19, 7, 4, 24, 32, 33. 22 |
GM, VR, FM, RL, EL, and ELC (MSEL) | Normal | Pearson correlation, Linear mixed effect model | Correlations between average cortical thickness at age 1 and GM, FM, EL, and RL scores at age 1 (r = 0.137, p = 0.025; r = 0.186, p = 0.002; r = 0.147, p = 0.016; r = 0.120, p = 0.049, respectively), |
| Adeli et al.94 | 2019 | 24 | 0-4 | UNC Chapel Hill Early Brain Development Study | T1-w, T2-w, DWI |
Cortical thickness, mean curvature, local gyrification index, vertex area, vertex volume, sulcal depth in string distance, and sulcal depth in Euclidean distance | Parcellation of the cerebral cortex into 70 anatomically meaningful ROIs | Not specified | VR, FM, RL, EL, and ELC (MSEL) | Normal | Multi-task multi-linear regression | RMSE between the predicted and actual VR, FM, RL, and EL scores is 0.18. |
| Zhang et al.95 | 2018 | 23 | 0-4 | UNC Chapel Hill Early Brain Development Study | T1-w, T2-w |
Cortical thickness, mean curvature, local gyrification index, vertex area, vertex volume, sulcal depth in string distance, and sulcal depth in Euclidean distance | Parcellation of the cerebral cortex into 70 anatomically meaningful ROIs | Not specified | VR, FM, RL, EL, and ELC (MSEL) | Normal | Multi-task multi-linear regression | RMSE between the predicted and actual VR, FM, RL, and EL score is 0.158. |
| Bajaj et al.92 | 2018 | 56 | 18-45 | McLean Hospital and Partners Healthcare, and the U.S. Army Human Research Protections Office | T1-w | Cortical thickness, cortical surface area, cortical volume, and cortical gyrification | Posterior frontal, superior and inferior parietal lobes, left insula, and inferior frontal gyrus | 7, 39, 40, 13, 14, 16, 44, 45, 47 | WASI-II | Normal | Generalized linear model | Significant positive relationships between thicker cortex and higher IQ at a liberal CFT of p < 0.05 as well as at a strict CFT of p < 0.01 is observed. |
| Wang et al. 99 | 2015 | 164 | 6-15 | ABIDE | T1-w | Cortical thickness, surface area, sulcal depth, curvature |
Bilateral transverse temporal gyri, bilateral thalamus, left parahippocampal gyrus, left hippocampus, right opercular part of inferior frontal gyrus, left anterior cingulate gyrus, right amygdala, left lingual gyrus, left superior parietal lobule, right inferior parietal lobule, left angular gyrus, left paracentral lobule, and left caudate nucleus |
41, 42, 34, 44, 45, 47, 32, 7, 40, 39, 1, 2, 3, 4 | - | Normal | Multi/single kernel support vector regressor | Correlation between the actual and estimated IQ is 68.4% |
| Squeglia et al.97 | 2013 | 185 | 12-14 | San Diego area public middle schools | T1-w | Cortical thickness | Left and right inferior parietal cortices, and left and right superior parietal cortices | 39, 40, 7 | WISC-III, WAIS-IV |
Normal | Hierarchical linear regressions | For both males and females, thinner parietal association cortices corresponded with better neurocognitive functioning above and beyond age alone. |
| Yang et al. 98 | 2013 | 78 | 17-27 | Seoul National University, Catholic University of Korea | T1-w | Cortical thickness, surface area, sulcal depth and absolute mean curvature in 78 parcellated ROIs | Cerebral cortex |
34, 35, 37 | WAIS | Normal | Partial least square regression |
Correlation between the Actual and predicted FSIQ is 30% (p < 0.01) |
| Choi et al. 100 | 2008 | 225 | 20.9±2.9 | Seoul National University, Catholic University of Korea | T1-w | The thickness of the gray matter of the cerebral cortex | Gray matter of cerebral cortex | 38, 20, 21, 40 | WASI, RPM-II | Normal | Multivariate regression model | gC is correlated to cortical thickness and gF is related to BOLD signals. |
Table 5.
Summary of sMRI study using brain morphometry in inferring/relating to human neurocognition and intelligence. Acronyms- COPD: Chronic Obstructive Pulmonary Disorder, OCD: Obsessive Compulsive Disorder, DD: Developmental Dyslexia, FA: fractional anisotropy, VBM: Voxels-based Morphometry, MDD: major Depressive Disorder, NCANDA: National Consortium on Alcohol and Neurodevelopment in Adolescence, WASI: Weschler Abbreviated Scale of Intelligence, WISC: Wechsler Intelligence Scale for Children, WAIS: Wechsler Adult Intelligence Scale, FSIQ: Full-scale Intelligent Quotient, VIQ: Verbal IQ, PIQ: Performance IQ, ANCOVA: Analysis of Covariance, T1-w: T1-weighted MRI.
| Study | Year | N |
Age (years) |
Dataset | MRI type | MRI features | Regions | Probable BAs |
IQ/ Neuro. Test |
Normal/ Abnormal |
Method |
Correlation/ Finding |
| Hidese et al.104 | 2020 | 266 | 45.6±12.9 | Volunteer data from Kodaira city, Tokyo | T1-w, DTI |
Regional gray matter volumes in the VBM and the white matter FA values in the DTI | Left gyrus rectus and anterior cingulate gyrus, left posterior insula, left superior and middle frontal gyri | 11, 24, 32, 33, 13, 14, 16, 10 | WAIS-III | Normal | Pearson correlation | VIQ correlated positively with the specified brain regional volumes with p < 0.005. |
| McDermott et al.105 | 2019 | 623 | 5-25 | National Institute of Mental Health Intramural Research Program | T1-w | Surface-based shape | Left inferior and middle temporal, left inferior parietal, and left medial frontal regions | 20, 21, 39, 40, 25 | WASI, WISC, WAIS | Normal | Linear mixed-effect model | Positive associations (β > 100; p < 0.001) between FSIQ and cortical anatomy is observed. |
| Ramsden et al.106 | 2011 | 33 | 14.1±1.0 | Department of Psychological Sciences, Birkbeck College, University of London | T1-w | Changes in gray matter density | Motor speech area, and anterior cerebellum | 4, 6 | WISC, WAIS | Normal | Linear regression | Correlation between change in VIQ and change in grey matter density were 0.876 (p < 0.01) for high, 0.797 (p < 0.05) for average and 0.660 (p < 0.05) for low ability groups, respectively. For PIQ, correlation was 0.492 (p > 0.05) for high, 0.788 (p < 0.05) for average and 0.715 (p < 0.01) for low ability groups, respectively. |
Briefly, VBM-based gray matter volumes in the left gyrus rectus (BA 11) and anterior cingulate gyrus (BAs 24, 32, 33), left posterior insula (BAs 13, 14, 16), left superior and middle frontal gyri (BA 10) are found to be positively correlated (p < 0.005) to VIQ scores.104 Similarly SBM-base shape features in the left inferior and middle temporal (BAs 20, 21), left inferior parietal (BAs 39, 40), and left medial frontal (BA 25) regions showed positive associations (β > 100; p < 0.001) with FSIQ.105 Another study106 divided their study population into average (FSIQ = [80, 119]), low, and high (FSIQ > 119) groups, and observed that the correlation between the change in VIQ and change in the grey matter density in the motor area (BAs 4, 6) and anterior cerebellum is 0.876 (p < 0.01) for high ability, 0.797 (p < 0.05) for average ability and 0.660 (p < 0.05) for low ability groups, respectively. Similarly, the corresponding effects were seen for PIQ as 0.492 (p > 0.05) for high ability, 0.788 (p < 0.05) for average ability, and 0.715 (p < 0.01) for low ability groups.
Deep Features from sMRI to Infer Intelligence/Neurocognition. Regional, surface-area, voxel, and vertex-level features, as described above, are so-called handcrafted or hand-engineered features. They carry neuroanatomic meanings and are easy to interpret. On the other hand, the rise of deep learning extracts tens of thousands or even millions of “deep features” from the whole MRI or image patches. Those deep features are extracted from convolutions of images with filters (3×3×3, 5×5×5, or other sizes). Several studies60,66,107–110 used a convolutional neural network (CNN), a specific type of image-based deep learning technique, on T1-MRI to predict fluid intelligence in adolescents. They predicted the residual fluid intelligence score of more than 4500 adolescents with an MSE ranging from 92 to 103 (for a range of true residual fluid intelligence score of [-40, 30]), as summarized in Table 6 of the supplementary materials. However, the interpretation of deep features is difficult. A potential solution is to choose brain regions beforehand and those regions to deep learning models. For example, Zou et al.109 used regions from bilateral transverse temporal gyri (BAs 41, 42), bilateral thalamus, left parahippocampal gyrus (BA 34), left hippocampus, right opercular part of inferior frontal gyrus (BAs 44, 45, 47), left anterior cingulate gyrus (BAs 24, 32, 33), right amygdala, left lingual gyrus (BA 19), left superior parietal lobule (BA 7), right inferior parietal lobule (BAs 39, 40), left angular gyrus (BA 39), left paracentral lobule, and left caudate nucleus (BAs 1-4) in their deep learning model to predict gF score. However, the choice of such regions may be subjective, the accuracy of prediction was not significantly different from inputting the whole image, and treating regions separately may miss the opportunity to consider those regions jointly in the convolutions. Interpretation of deep learning models can be also achieved by masking or replacing different regions, adding random noise to images, or calculating the saliency, activating, or attention maps.111–113 Their use in interpreting deep learning prediction of intelligence or neurocognition is yet to be studied.
Summary of sMRI Inference of Neurocognition and Intelligence. In Figure 4, we show a bar plot representing the proportion of our reviewed sMRI papers that used different Brodmann areas in inferring intelligence and neurocognition. For simplicity, we only used the Brodmann areas without mentioning the hemisphere sides.
Table 6.
Summary of sMRI studies inferring/relating to human neurocognition and intelligence. Acronyms- ANCOVA: Analysis of Covariance, ABCD: Adolescent Brain Cognitive Development, NIH-TCB: NIH toolbox of neurocognitive battery, LASSO: Least Absolute Shrinkage and Selection Operator, SVM: Support Vector Machine, SVR: Support Vector Regression, CNN: Convolutional Neural Network, ROI: Region of Interest, KNN: K-Nearest Neighbors, WASI: Weschler Abbreviated Scale of Intelligence, WISC: Wechsler Intelligence Scale for Children, WAIS: Wechsler Adult Intelligence Scale, FSIQ: Full-scale Intelligent Quotient, ABIDE: Autism Brain Imaging Data Exchange, T1-w: T1-weighted MRI, T2-w: T2-weighted MRI, DWI: Diffusion-weighted Imaging, DTI: Diffusion Tensor Imaging, TRUST: T2-relaxation under spin tagging. Probable BAs are not specified for either left or right hemisphere.
| Study | Year | N |
Age (years) |
Dataset | MRI type | MRI features | Regions | Probable BAs |
IQ/ Neuro. Test |
Normal/ Abnormal |
Method |
Correlation/ Finding |
| Chiang et al.60 | 2019 | 8669 | 9-10 | ABCD | T1-w | Total volume, mean signal intensity, and entropy | Visual, fronto-parietal, somatosensory, motor, default mode network, and cingulo opercular network. | 6, 8, 9, 22, 41, 42, 17, 18, 19, 1, 2, 3, 5, 7, 4, 6 | NIH-TCB | Normal | CNN, and LASSO | Mean Square Error (gF) = 95.38 (for true residual gF in the range of [-40, 30]) |
| Ranjbar et al.66 | 2019 | 8669 | 9-10 | ABCD | T1-w | 122 ROI volumes in the gray matter, white matter, and cerebrospinal fluid | Gray matter, white matter, and cerebrospinal fluid | 11, 44, 45, 47, 4, 1, 2, 3, 10, 12, 40 | NIH-TCB | Normal | CNN and random forest | Mean Square Error (gF) = 93.64 (for true residual gF in the range of [-40, 30]) |
| Vang et al.107 | 2019 | 8669 | 9-10 | ABCD | T1-w | CNN-learned features | Gray matter, white matter, and cerebrospinal fluid |
Not specified | NIH-TCB | Normal | CNN with gradient boosting machine | Mean Square Error (gF) = 96.18 (for true residual gF in the range of [-40, 30]) |
| Pominova et al.108 | 2019 | 8669 | 9-10 | ABCD | T1-w | CNN-learned features | Gray matter | Not specified | NIH-TCB | Normal | VoxCNN | Mean Square Error (gF) = 93.838 (for true residual gF in the range of [-40, 30]) |
| Zou et al.109 | 2019 | 8669 | 9-10 | ABCD | T1-w | CNN-learned features | Bilateral transverse temporal gyri, bilateral thalamus, left parahippocampal gyrus, left hippocampus, right opercular part of inferior frontal gyrus, left anterior cingulate gyrus, right amygdala, left lingual gyrus, left superior parietal lobule, right inferior parietal lobule, left angular gyrus, left paracentral lobule, and left caudate nucleus. | 41, 42, 34, 44, 45, 47, 24, 32, 33, 19, 7, 39, 40, 1, 2, 3, 4 |
NIH-TCB | Normal | 3D CNN | Mean Square Error (gF) = 92.74 (for true residual gF in the range of [-40, 30]) |
| Liu et al.110 | 2019 | 8669 | 9-10 | ABCD | T1-w | CNN-learned features | Skull-stripped whole brain | Not specified | NIH-TCB | Normal | UNet-like encoder/decoder | Mean Square Error (gF) = 102.25 (for true residual gF in the range of [-40, 30]) |
Diffusion MRI to Infer Intelligence and Neurocognition
Diffusion tensor imaging (DTI) measures water flow at every voxel in the brain. Its parameter maps include Fractional Anisotropy (FA), which measures the directionality of water diffusion (ranging between 0 for complete diffusion in all directions and 1 for single-directional flow), apparent diffusion coefficient (ADC), which measures the magnitude of water diffusion at each voxel. DTI can also construct tractography, which quantifies white matter tracts that water flows through, and is also known as structural connectivity. In Table 7 of the supplementary materials, we summarized existing Diffusion MRI-based neurocognitive predictive studies.
FA is found to be correlated to neurocognitive function. For example, full-scale IQ is shown to be correlated (r = 0.53; 95% CI 0.35–0.66) to the FA values in the right anterior thalamic radiation, left superior longitudinal fasciculus, left inferior fronto-occipital fasciculus, and left uncinate fasciculus (collectively, BAs 1, 3-9, 11, 13, 17, 18, 22, 24, 25, 29, 32, 34-36, 38, 39, 41, 42-47).114 It is also found that FA at 2 weeks of age is correlated (r = 0.35-0.48) to the BSID-based neurodevelopmental outcomes at 2 years of age in infants.115 Similarly, Pearson’s correlation analysis revealed a negative correlation (r = -0.73; p < 0.001) between VIQ and FA in the left-hemispheric Brocaʼs area (BAs 44, 45).116 In addition, correlation analysis of VIQ and mean diffusivity (MD) revealed a positive correlation in the left hemispheric Brocaʼs area (BAs 44, 45).116 Another study117 used FA to find chronic neurological damage in 30-60 years old retired national football league players and its association with mini-mental state examination (MMSE) evaluation of cognitive functions, which revealed a neurophysiological impairment in about 24% of the studied population.
Table 7.
Summary of diffusion MRI studies inferring human neurocognition and intelligence. Acronyms- FA: Fractional Anisotropy, MD: Mean Diffusivity, RD: Radial Diffusivity, BSID: Bayley Scales of Infant Development, MSEL: Mullen Scale of Early Learning, MMSE: Mini-Mental Status Examination, VR: Visual Reception, FM: Fine Motor, RL: Receptive Language, EL: Expressive Language, ELC: Early Learning Composite, RMSE: Root Mean Square Error, HCP: Human Connectome Project, WASI: Weschler Abbreviated Scale of Intelligence, WISC: Wechsler Intelligence Scale for Children, WAIS: Wechsler Adult Intelligence Scale, FSIQ: Full-scale Intelligent Quotient, PIQ: Performance IQ, VIQ: Verbal IQ, T1-w: T1-weighted MRI, T2-w: T2-weighted MRI, DWI: Diffusion-weighted Imaging, DTI: Diffusion Tensor Imaging. Probable BAs are not specified for either left or right hemisphere.
| Study | Year | N |
Age (years) |
Dataset | MRI type | MRI features | Regions | Probable BAs |
IQ/ Neuro. Test |
Normal/ Abnormal |
Method |
Correlation/ Finding |
| Malpas et al.114 | 2016 | 91 | 18-55 | Nathan Kline Institute/Rockland Sample | DTI | FA | 42 Brodmann regions were specified in each hemisphere | 1, 3, 4, 5, 6, 7, 8, 9, 11, 24, 25, 29, 32, 44, 45, 46, 47, 13, 22, 34, 35, 36, 38, 41, 42, 39, 40, 43, 17, 18 | WASI | Normal |
t statistic regression analysis |
FA was positively correlated with FSIQ with r = 0.53 (95% CI 0.35–0.66). |
| Konrad et al. 116 | 2012 | 30 | 22.8±1.5 | Institute of Neuroradiology of the Johannes Gutenberg University Mainz, Germany | T1-w, DTI |
FA, MD | Left-hemispheric Brocaʼs area |
44, 45, 22 | Hamburg–Wechsler Intelligenztest (HAWIE-R) - equivalent to WAIS-R | Normal | Voxel-wise t statistic regression analysis, Pearson correlation |
VIQ performance is negatively correlated to the FA in the mentioned regions (r = - 0.73; p < 0.001). |
| Feng et al.115 | 2019 | 38 | 0-2 | Arkansas Children’s Nutrition Center | DTI | FA | White matter tracts | Not specified | BSID-III | Normal | Voxel-wise tract-based spatial statistics (TBSS) |
Correlations between FA at 2 weeks of age and BSID subfields scores at 2 years of age are 0.35~0.48. |
| Casson et al.117 | 2014 | 45 | 30-60 | Wayne State University | T1-w, SWI, DTI | FA-based dysarthria, pyramidal system dysfunction, extrapyramidal system dysfunction, and cerebellar dysfunction | Gray matter, white matter, and cerebrospinal fluid | Not specified | MMSE | Normal/ abnormal | Chi-square test | The number of football-related concussions was associated with isolated neurocognitive abnormalities in 24% of population. |
| Adeli et al.94 | 2019 | 24 | 0-4 | UNC Chapel Hill Early Brain Development Study | T1-w, T2-w, DWI |
Cortical thickness, mean curvature, local gyrification index, vertex area, vertex volume, sulcal depth in string distance, and sulcal depth in Euclidean distance | Parcellation of the cerebral cortex into 70 anatomically meaningful ROIs | Not specified | VR, FM, RL, EL, and ELC (MSEL) | Normal | Multi-task multi-linear regression | Correlation between predicted and true ELC is 0.70 (p < 0.001) |
| Lee et al.118 | 2017 | 535 | 0-2 | UNC Chapel Hill Early Brain Development Study | DTI | Axial diffusivity (AD), radial diffusivity (RD), and FA |
White matter | Not specified | MSEL: ELC | Normal | Distance correlation coefficient | Correlation between AD, RD and FA with ELC are 0.13~0.20 (p < 0.05) |
| Zhang et al. 119 | 2019 | 1076 | - | HCP | DWI | Count of streamlines, connected surface area (CSA) and weighted CSA, mean and maximum values of FA and MD, cluster number, average length, and mean deviations from a template streamline | ROIs in the whole cortex |
Not specified |
Raven's Progressive Matrices |
Normal | Tensor network principal components analysis |
Correlation between actual and estimated gF is 24.11% (p < 0.001). |
Other study94 used different cortical features from the whole brain such as the sulcal depth as Euclidian distance from the cerebral hull surface, local gyrification index, curved sulcal depth along the streamlines constrained in cerebral fluid, mean curvature, and cortical thickness, corresponding to working memory, attention, verbal learning and memory, visuospatial functioning, spatial planning, and problem-solving, and inhibition as features and found a correlation between predicted and true early learning composite (ELC) od 0.70 (p < 0.001). A similar study118 but using DTI-based features from the whole brain such as axial diffusivity (AD), radial diffusivity (RD), and FA found a correlation between the DT features (i.e., AD, RD, and FA) and ELC of 0.13~0.20 (p < 0.05). Another study119 used several DWI features from the whole brain such as count of streamlines, connected surface area (CSA), weighted CSA, mean and maximum FA and MD, cluster number, average length, and mean deviations from a template streamline to predict gF, and reported a correlation between actual and estimated gF of 24.11% (p < 0.001).
Functional MRI to Infer Intelligence and Neurocognition
Functional MRI (fMRI) utilizes the blood oxygenation level-dependent (BOLD) effect to reveal the brain connectivity during a stimulation (task-fMRI) or in a resting state (rs-fMRI).120 Major large-scale brain networks as found in resting-state fMRI include the dorsal and ventral default mode, right and left executive control, dorsal and ventral attention, anterior and posterior salience, basal ganglia, language, high and primary visual, precuneus, auditory and somatosensory networks, and others.121
Functional connectivity strength among different parts of the brain, estimated from fMRI, can be used to predict neurocognitive and intelligence scores. As summarized in Table 8 of the supplementary materials, functional connectivity in the bilateral dorsolateral prefrontal cortices (BA 9) is significantly correlated (r = 0.47; p = 0.0002) to the Wechsler Adult Intelligence Scale (WAIS) intelligence scores.122 Also, the functional connectivity in the frontoparietal network region (including BAs 9, 4, 39, 40, 46, 10, 13 and other regions) and central brain regions (i.e., somatosensory region; BAs 1, 2, 3) is used for later life neuropsychological test performance prediction with a correlation between the actual and predicted behavioral scores of r = 0.12~0.44 (p < 0.001).123 Frontoparietal network (BAs 9, 4, 39, 40, 46, 10, 13, etc.) connectivity is also found significantly correlated to fluid intelligence (r = 0.50; p < 0.01),124 memory (r = 0.097; p < 0.001),125 general neurocognitive ability (r = 0.31; p < 0.0001),126 and FSIQ (r = 0.51; p < 0.001)127 performance. Any disease (e.g. Turner syndrome128) related impairment in the fronto-parietal network also causes a deficit in the gF/VIQ, compared to a healthy population (p < 0.0001).
Some other studies used fMRI-based functional connectivity data from Human Connectome Project (HCP) to show a correlation between the actual and estimated fluid intelligence (0.19-33)129–133 and cognitive ability (0.95).134
In Figure 5, we show a bar plot representing the proportion of our reviewed fMRI papers that used different Brodmann areas in inferring intelligence and neurocognition. For simplicity, here also, we only used the Brodmann areas without mentioning the hemisphere sides. We see in this figure that AI approaches also utilized those Brodmann areas, which were previously reported to be correlated to the intelligence and neurocognition of humans. In addition, we see in this figure that the AI approaches used many Brodmann areas, which are in fact a part of the well-known P-FIT model.
Table 8.
Summary of functional MRI inferring human neurocognition and intelligence. Acronyms- OASIS: Open Access Series of Imaging Studies, KSHAP: Korean Social Life, Health, and Aging Project, ABCD: Adolescent Brain Cognitive Development, FC: Functional Connectivity, MMSE: Mini-Mental Status Examination, BOLD: Blood-oxygen-level-dependent, ABCD: Adolescent Brain Cognitive Development, NIH-TCB: NIH toolbox of neurocognitive battery, ANOVA: Analysis of Variance, FSIQ: Full-scale Intelligent Quotient, PIQ: Performance IQ, VIQ: Verbal IQ, LASSO: Least Absolute Shrinkage and Selection Operator, CNN: Convolutional Neural Network, HCP: Human Connectome Project, WAIS: Wechsler Adult Intelligence Scale, WASI: Wechsler Abbreviated Scale of Intelligence, MMSE: Mini-mental State Examination, CPM: Connectome-Based Predictive Modeling; T1-w: T1-weighted MRI, fMRI: functional MRI.
| Study | Year | N |
Age (years) |
Dataset | MRI type | MRI features | Regions | Probable BAs |
IQ/ Neuro. Test |
Normal/ Abnormal |
Method |
Correlation/ Finding |
| Song et al. 122 | 2008 | 59 | 18.5–33.3 | Xuanwu Hospital of Capital Medical University | fMRI | Functional connectivity | bilateral dorsolateral prefrontal cortices | 9 | WAIS | Normal | Stepwise linear regression | FSIQ is correlated to the functional connectivity in bilateral dorsolateral prefrontal cortices (r = 0.47; p = 0.0002). |
| Kwak et al.123 | 2021 | 795 | 46-96 | OASIS-3, KSHAP | T1-w, fMRI |
Functional connectivity from BOLD signals | Region of frontoparietal network and central brain | 9, 4, 39, 40, 46, 10, 13, 1, 2, 3 | MMSE | Normal | Ridge regression | Correlation between behavioral test scores and FC-predicted score is 0.12~0.44 (p < 0.001). |
| Finn et al. 124 | 2015 | 126 | 22-35 | Human Connectome Project (HCP) | fMRI | Positive and negative edges, frontoparietal networks | Frontoparietal region | 9, 4, 39, 40, 46, 10, 13 | Raven's Progressive Matrices | Normal | CPM | Correlation between actual and estimated gF is 0.5 (p < 0.01) |
| Powell et al. 125 | 2017 | 841 | 22-37 | HCP | fMRI | Voxel-wise local structural connectome | Region of frontoparietal network | 9, 4, 39, 40, 46, 10, 13 | NIH-TCB | Normal | LASSO Principal Component Regressor | Correlation between the actual and predicted NIH picture sequence memory test is 0.097 (p < 0.001) |
| Sripada et al. 126 | 2020 | 2013 | 9-10 | ABCD | fMRI | Resting-state functional connectivity pattern | Default mode network, frontoparietal network, salience network, dorsal attention network | 8, 9, 10, 21, 28, 36, 23, 24, 32, 29, 30, 31, 39, 40 | NIH-TCB | Normal | Brain basis set (BBS) modeling (combination of PCA and linear regression) | General neurocognitive ability score is highly correlated to the mentioned networks (r = 0.31; p < 0.0001) |
| Jiang et al. 127 | 2017 | 360 | 17-24 | University of Electronic Science and Technology, China | fMRI | Functional connectivity | Superior frontal gyrus, inferior and superior parietal lobules |
10, 11, 12, 39, 40, 7 | WAIS-RC | Normal | RelieF+LASSO | Correlation between actual and estimated FSIQ is 51% (p < 0.001) |
| Hart et al.128 | 2006 | 25 | 14-29 | UNC Pediatric Endocrinology Turner Syndrome Clinic | fMRI | Activated voxels in fMRI | Left and right middle frontal gyri, inferior frontal gyri, intraparietal sulci and inferior temporal gyri | 10, 44, 45, 47, 20 | WASI | Normal/ abnormal |
ANOVA | Individuals with Turner syndrome and controls had significantly different verbal IQs (p < 0.0001) |
| Greene et al. 129 | 2018 | 1086 | 8-36 | HCP, Philadelphia Neurodevelopmental Cohort (PNC) | fMRI | Whole brain functional connectivity | Cortical and subcortical grey matter, cerebellum | Not specified | Raven's Progressive Matrices | Normal | CPM |
Correlation between actual and estimated gF is 19% in resting state (p = 0.039) |
| He et al. 131 | 2018 | 9821 | 22-69 | HCP, UK-Biobank | fMRI | Functional Connectivity Matrix | Whole-brain spatially independent components | Not specified | Raven's Progressive Matrices | Normal | Kernel Regression, Feedforward NN, CNN | Correlation between actual and estimated gF is 23.9% (p < 0.001) using the Kernel regression |
| Li et al. 132 | 2018 | 100 | - | HCP | fMRI | Amplitude of low-frequency fluctuation of left anterior cingulate cortex | Right prefrontal cortex, left anterior cingulate cortex | 8, 24, 32, 33 | Raven's Progressive Matrices | Normal | Support vector regressor | Correlation between actual and estimated gF is 32.5% (p = 0.031) |
| Dubois et al. 133 | 2018 | 884 | 22-36 | HCP | fMRI | Functional Connectivity Matrix | Cortical and subcortical grey matter | Not specified | Raven's Progressive Matrices | Normal | Univariate correlation filtering + Elastic net regression | Correlation between actual and estimated gF is 22% using the univariate model (p < 0.001) |
| Yoo et al. 134 | 2019 | 575 | 22-56 | HCP | fMRI | Functional Connectivity Matrix | Regions of frontoparietal and default mode networks | 9, 4, 39, 40, 46, 10, 13, 38, 25, 23, 31 | Raven's Progressive Matrices | Normal | CPM-based Multivariate distance correlation | Correlation between actual and estimated cognitive ability is 9.5% (p < 0.01) |
| Noble et al. 135 | 2017 | 618 | 22-56 | HCP | fMRI | 10 functionally coherent networks | Whole gray matter | Not specified | Raven's Progressive Matrices | Normal | CPM | Correlation between actual and estimated gF is 22% (p < 0.0001) |
Opportunities and Challenges
Precision and Individual Variability. Earlier studies associated MRI metrics with neurocognition in a population. Population-level association does not explain individual variability. There is a need to use MRI to estimate or predict neurocognition for individual subjects. A fundamental question remains open for which MRI metrics, out of hundreds of s/d/fMRI metrics, from which neuroanatomy, carry the neurocognitive information for individual differences. The answers to this question may vary by the neurocognitive domains.
Neuroscientific Interpretation. Sex differences exist widely in diseases136 and in normal brain MRIs.137 Hemispheric differences exist and contribute to brain development. Besides sex and hemispheric differences, brain development presents spatial and temporal heterogeneity. Spatially, maturation occurs in a posterior-to-anterior and inferior-to-superior direction138,139. Temporally, sensory and motor cortices develop earlier, while the prefrontal, amygdala, and hippocampus continue to get matured during adolescence139,140, and working memory141 and reasoning142 continue to evolve over childhood and adolescence. Yet, it remains open to ‘localizing’ the regional brain biomarkers in space, in time, and specific to sex, age, and brain hemisphere. Elucidating the neural substrate of inter-individual intelligence difference will also differ across neurocognitive domains.
Nature and nurture beyond MRI data. A mystery is which extent is human intelligence or neurocognition decided by nature (i.e., genetics) and by nurture. For nurture, social upbringing143 and neighborhood environment144 have effects on neurodevelopment, so do demographics (age, sex, body mass index or BMI, etc.), lifestyle (smoking, alcohol, reading, exercise, etc.), nutrition, socioeconomic status (education, income, etc.), and other factors. Thus, we need to combine MRI with other nature and nurture data to better understand individual variability in neurocognition.3,145–150 There are technical challenges for (i) how to best combine 3D MRIs with 1D non-MRI features151; (ii) how to identify the best subset of variables that best estimate neurocognitive abilities152,153; and (iii) eventually quantify the contribution of nature versus nurture.
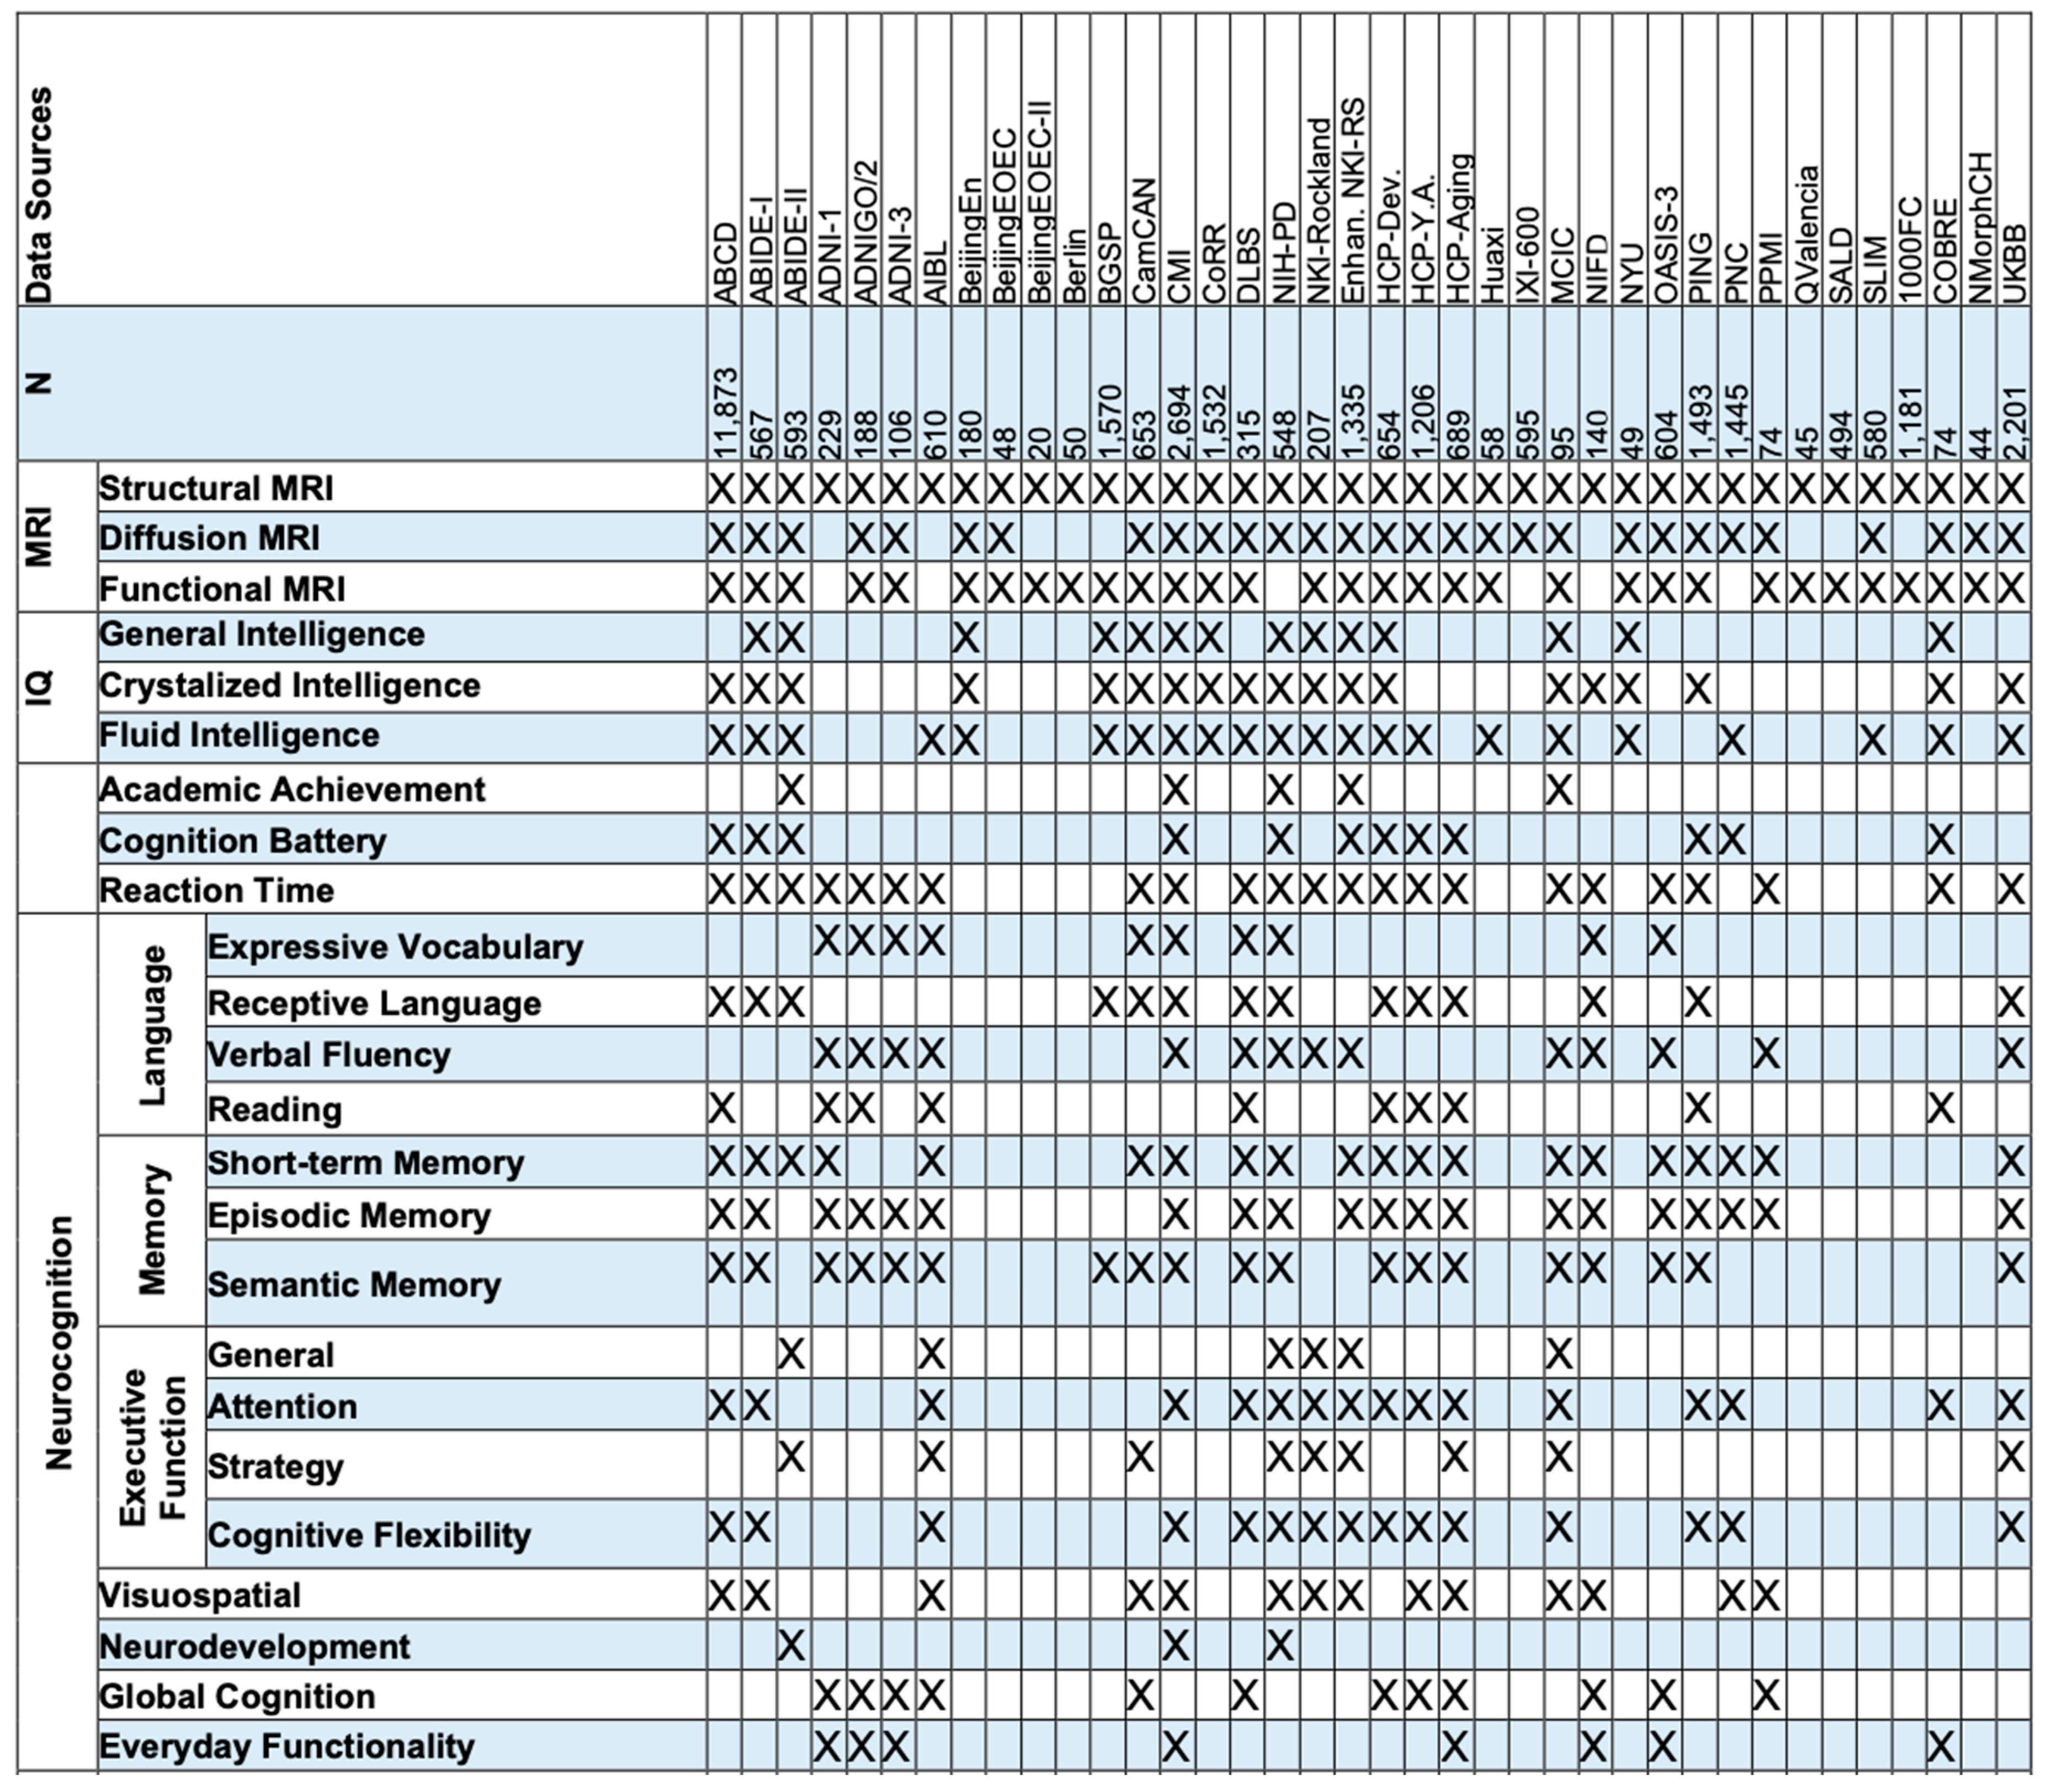
Merging Datasets. Artificial intelligence requires a large training dataset, which, for brain MRI, means 1,000 or more subjects.154 Recent studies have combined public or private datasets to form a large database of thousands or even tens of thousands of brain MRIs, for age prediction,155,156 quantification of normal brain development,131 genotype-phenotype mapping157 and other tasks. We have found at least 38 public datasets with a total of about 35,000 unique individuals with both brain MRIs and neurocognitive/intelligence test scores (Table 2). Challenges arise, however, for (a) multi-site, multi-scanner, multi-protocol MRI harmonization; (b) dealing with different types or versions of neurocognitive tests as used in different datasets; (c) tackling uncertainties in the test scores for neurocognition/intelligence; and (d) coping with incompleteness or inconsistency in other variables (demographics, socioeconomic status, genetics, environment, etc.) across datasets.
Table 2.
We have found at least 38 public datasets with a total of about 35,000 unique individuals with both brain MRIs and neurocognitive/intelligence test scores.
Table 2.
We have found at least 38 public datasets with a total of about 35,000 unique individuals with both brain MRIs and neurocognitive/intelligence test scores.
Evaluation of the Present versus Prediction of the Future. Predicting future neurocognitive outcomes and intelligence level is more difficult but as, if not more, important than evaluating the current status. Early prediction of later-life neurocognitive outcomes will create a precious time window for early intervention.7,8 It will identify high-risk patients for targeted intervention, avoiding unnecessary interventions for patients at low risk for future neurocognitive impairments.158 Both the early and the targeted interventions are key unmet needs in clinical trials that aim to improve patients’ long-term neurocognitive outcomes.8,159 For the last three decades, there have been many studies that used medical imaging (e.g., MRI) and computer-aided mathematical models (e.g., multivariate analysis, machine learning, deep learning, etc.) to identify neurocognitive impairments in patients with various diseases, e.g., traumatic brain injuries,160 schizophrenia,161 Alzheimer's Disease,162 and diabetes.163 Yet, predicting normal and abnormal neurocognitive development trajectories remains a largely unanswered question.
Linking Healthy and Diseased. Do machine intelligence models that predict human intelligence in normal controls help us to predict abnormal neurocognitive outcomes in diseased populations? Do neurocognitive outcome prediction models share similar MRI and non-MRI features across diseases? Current studies are mostly on diseased populations but studying one specific disease at a time. Linking healthy and diseased, or merging data across diseases, may offer new insight for the common support of normal and abnormal neurocognitive development.
Conclusion
In this paper, we reviewed different MRI studies to infer neurocognitive or human intelligence. While existing reviews are often on specific disease populations,164–167 our review focuses primarily on healthy subjects but has included various disease-specific MRI findings. We observed several trends in this research direction: population-level association studies are transitioning to individual-level machine learning predictions, single MRI sequence research is giving ways to multi-modal MRI research, multi-omics approaches integrating MRI with rich non-MRI information are merging from MRI-alone investigations, bigger sample sizes (thousands or tens of thousands) by merging datasets are fast increasing compared to small sample size studies (dozens to hundreds) from a single dataset. Despite growing efforts and expanding knowledge, the decades-long topic of machine intelligence inferring human intelligence remains little understood in general. Opportunities exist with the rise of big data and AI, but several major neuroscientific and data science challenges call for further investigations.
References
- Morley JE, Morris JC, Berg-Weger M, et al. Brain health: the importance of recognizing cognitive impairment: an IAGG consensus conference. J Am Med Dir Assoc. 2015, 16, 731–739. [Google Scholar] [CrossRef]
- Latal B, Patel P, Liamlahi R, Knirsch W, Tuura RO, von Rhein M. Hippocampal volume reduction is associated with intellectual functions in adolescents with congenital heart disease. Pediatr Res. 2016, 80, 531–537. [Google Scholar] [CrossRef]
- Kessler N, Feldmann M, Schlosser L, et al. Structural brain abnormalities in adults with congenital heart disease: prevalence and association with estimated intelligence quotient. Int J Cardiol. 2020, 306, 61–66. [Google Scholar] [CrossRef] [PubMed]
- Watson CG, Stopp C, Wypij D, Bellinger DC, Newburger JW, Rivkin MJ. Altered white matter microstructure correlates with IQ and processing speed in children and adolescents post-fontan. J Pediatr. 2018, 200, 140–149. [Google Scholar] [CrossRef] [PubMed]
- Dubois J, Galdi P, Paul LK, Adolphs R. A distributed brain network predicts general intelligence from resting-state human neuroimaging data. Philos Trans R Soc B Biol Sci. 2018, 373, 20170284. [Google Scholar]
- Kanai R, Rees G. The structural basis of inter-individual differences in human behaviour and cognition. Nat Rev Neurosci. 2011, 12, 231–242. [Google Scholar] [CrossRef] [PubMed]
- Liamlahi R, Latal B. Neurodevelopmental outcome of children with congenital heart disease. Handb Clin Neurol. 2019, 162, 329–345. [Google Scholar]
- Urschel S, Bond GY, Dinu IA, et al. Neurocognitive outcomes after heart transplantation in early childhood. J Heart Lung Transplant. 2018, 37, 740–748. [Google Scholar] [CrossRef] [PubMed]
- Pallas, SL. Intrinsic and extrinsic factors that shape neocortical specification. Trends Neurosci. 2001, 24, 417–423. [Google Scholar] [CrossRef]
- Spitzka, EA. Brain-weight, cranial capacity and the form of the head, and their relations to the mental powers of man. Science. 1903, 17, 753–754. [Google Scholar] [CrossRef]
- Pol HEH, Schnack HG, Posthuma D, et al. Genetic contributions to human brain morphology and intelligence. J Neurosci. 2006, 26, 10235–10242. [Google Scholar] [CrossRef] [PubMed]
- Rushton JP, Ankney CD. Whole brain size and general mental ability: a review. Int J Neurosci. 2009, 119, 692–732. [Google Scholar] [CrossRef] [PubMed]
- Deary IJ, Bastin ME, Pattie A, et al. White matter integrity and cognition in childhood and old age. Neurology. 2006, 66, 505–512. [Google Scholar] [CrossRef] [PubMed]
- Schmithorst VJ, Wilke M, Dardzinski BJ, Holland SK. Cognitive functions correlate with white matter architecture in a normal pediatric population: a diffusion tensor MRI study. Hum Brain Mapp. 2005, 26, 139–147. [Google Scholar] [CrossRef] [PubMed]
- Jensen, AR. Clocking the Mind: Mental Chronometry and Individual Differences. Elsevier; 2006.
- Poldrack RA, Gorgolewski KJ. Making big data open: data sharing in neuroimaging. Nat Neurosci. 2014, 17, 1510–1517. [Google Scholar] [CrossRef] [PubMed]
- Graham SA, Lee EE, Jeste DV, et al. Artificial intelligence approaches to predicting and detecting cognitive decline in older adults: A conceptual review. Psychiatry Res. 2020, 284, 112732. [Google Scholar] [CrossRef]
- Dizaji AS, Vieira BH, Khodaei MR, et al. Linking Brain Biology to Intellectual Endowment: A Review on the Associations of Human Intelligence With Neuroimaging Data. Basic Clin Neurosci. 2021, 12, 1. [Google Scholar] [CrossRef]
- Naef N, Schlosser L, Brugger P, et al. Brain volumes in adults with congenital heart disease correlate with executive function abilities. Brain Imaging Behav. Published online 2021, 1–9. [Google Scholar]
- Fontes K, Rohlicek CV, Saint-Martin C, et al. Hippocampal alterations and functional correlates in adolescents and young adults with congenital heart disease. Hum Brain Mapp. 2019, 40, 3548–3560. [Google Scholar] [CrossRef]
- Pike NA, Roy B, Moye S, et al. Reduced hippocampal volumes and memory deficits in adolescents with single ventricle heart disease. Brain Behav. 2021, 11, e01977. [Google Scholar] [CrossRef]
- Ehrler M, Latal B, Kretschmar O, von Rhein M, Tuura RO. Altered frontal white matter microstructure is associated with working memory impairments in adolescents with congenital heart disease: a diffusion tensor imaging study. NeuroImage Clin. 2020, 25, 102123. [Google Scholar] [CrossRef] [PubMed]
- McGrew, KS. CHC Theory and the Human Cognitive Abilities Project: Standing on the Shoulders of the Giants of Psychometric Intelligence Research. Elsevier; 2009.
- Carroll, JB. Human Cognitive Abilities: A Survey of Factor-Analytic Studies. Cambridge University Press; 1993.
- Horn JL, Cattell RB. Refinement and test of the theory of fluid and crystallized general intelligences. J Educ Psychol. 1966, 57, 253. [Google Scholar] [CrossRef] [PubMed]
- Spearmen, C. General intelligence objectively determined and measured. Am J Psychol. 1904, 15, 107–197. [Google Scholar] [CrossRef]
- Cattell, RB. Theory of fluid and crystallized intelligence: A critical experiment. J Educ Psychol. 1963, 54, 1. [Google Scholar] [CrossRef]
- Schneider WJ, McGrew KS. The Cattell–Horn–Carroll theory of cognitive abilities. Published online 2018.
- McGrew, K. Cattell-Horn-Carroll CHC (Gf-Gc) Theory: Past, Present & Future.
- Kaufman, AS. Contemporary Intellectual Assessment: Theories, Tests, and Issues. Guilford Publications; 2018.
- Hartman, DE. Wechsler Adult Intelligence Scale IV (WAIS IV): return of the gold standard. Appl Neuropsychol. 2009, 16, 85–87. [Google Scholar] [CrossRef] [PubMed]
- Benson N, Hulac DM, Kranzler JH. Independent examination of the Wechsler Adult Intelligence Scale—Fourth Edition (WAIS-IV): what does the WAIS-IV measure? Psychol Assess. 2010, 22, 121. [Google Scholar] [CrossRef]
- Assessing the psychometric utility of IQ scores: A tutorial using the Wechsler intelligence scale for children–fifth edition. Sch Psychol Rev. Published online 2021, 1-15.
- Wechsler, D. WASI-II: Wechsler Abbreviated Scale of Intelligence. PsychCorp; 2011.
- Woodcock RW, McGrew KS, Mather N, Schrank FA. Woodcock-Johnson III diagnostic supplement to the tests of cognitive abilities. Itasca IL Riverside. 2003, 10, 003435520104400407. [Google Scholar]
- Bornman J, Romski M, Tonsing K, et al. Adapting and translating the Mullen Scales of Early Learning for the South African context. S Afr J Commun Disord. 2018, 65, 1–9. [Google Scholar]
- dos Santos ESL, de Kieviet JF, Königs M, van Elburg RM, Oosterlaan J. Predictive value of the Bayley scales of infant development on development of very preterm/very low birth weight children: a meta-analysis. Early Hum Dev. 2013, 89, 487–496. [Google Scholar] [CrossRef]
- Kubinger, KD. Psychologische Diagnostik: Theorie Und Praxis Psychologischen Diagnostizierens. Hogrefe Verlag; 2006.
- Wegenschimmel B, Leiss U, Veigl M, et al. Do we still need IQ-scores? Misleading interpretations of neurocognitive outcome in pediatric patients with medulloblastoma: a retrospective study. J Neurooncol. 2017, 135, 361–369. [Google Scholar] [CrossRef]
- Zgaljardic DJ, Temple RO. Neuropsychological Assessment Battery (NAB): Performance in a sample of patients with moderate-to-severe traumatic brain injury. Appl Neuropsychol. 2010, 17, 283–288. [Google Scholar] [CrossRef]
- Akshoomoff N, Beaumont JL, Bauer PJ, et al. VIII. NIH Toolbox Cognition Battery (CB): composite scores of crystallized, fluid, and overall cognition. Monogr Soc Res Child Dev. 2013, 78, 119–132. [Google Scholar] [CrossRef] [PubMed]
- Denboer JW, Nicholls C, Corte C, Chestnut K. National Institutes of Health Toolbox Cognition Battery. Oxford University Press; 2014.
- Barbey, AK. Network neuroscience theory of human intelligence. Trends Cogn Sci. 2018, 22, 8–20. [Google Scholar] [CrossRef] [PubMed]
- Duncan J, Owen AM. Common regions of the human frontal lobe recruited by diverse cognitive demands. Trends Neurosci. 2000, 23, 475–483. [Google Scholar] [CrossRef] [PubMed]
- Duncan, J. The multiple-demand (MD) system of the primate brain: mental programs for intelligent behaviour. Trends Cogn Sci. 2010, 14, 172–179. [Google Scholar] [CrossRef]
- Kovacs K, Conway AR. Process overlap theory: A unified account of the general factor of intelligence. Psychol Inq. 2016, 27, 151–177. [Google Scholar] [CrossRef]
- Jung RE, Haier RJ. The Parieto-Frontal Integration Theory (P-FIT) of intelligence: converging neuroimaging evidence. Behav Brain Sci. 2007, 30, 135–154. [Google Scholar] [CrossRef]
- Deary IJ, Penke L, Johnson W. The neuroscience of human intelligence differences. Nat Rev Neurosci. 2010, 11, 201–211. [Google Scholar] [CrossRef]
- Colom R, Karama S, Jung RE, Haier RJ. Human intelligence and brain networks. Dialogues Clin Neurosci. Published online 2022.
- Lerch JP, Van Der Kouwe AJ, Raznahan A, et al. Studying neuroanatomy using MRI. Nat Neurosci. 2017, 20, 314–326. [Google Scholar] [CrossRef]
- Fischl, B. FreeSurfer. Neuroimage. 2012, 62, 774–781. [Google Scholar] [CrossRef]
- Jenkinson M, Beckmann CF, Behrens TE, Woolrich MW, Smith SM. Fsl. Neuroimage. 2012, 62, 782–790. [Google Scholar] [CrossRef]
- Cox, RW. AFNI: what a long strange trip it’s been. Neuroimage. 2012, 62, 743–747. [Google Scholar] [CrossRef] [PubMed]
- Eickhoff SB, Yeo BT, Genon S. Imaging-based parcellations of the human brain. Nat Rev Neurosci. 2018, 19, 672–686. [Google Scholar] [CrossRef]
- Zhang-James Y, Glatt SJ, Faraone SV. Nu Support Vector Machine in Prediction of Fluid Intelligence Using MRI Data. In: Challenge in Adolescent Brain Cognitive Development Neurocognitive Prediction. Springer; 2019, 92-98.
- Chen H, Dou Q, Yu L, Qin J, Heng PA. VoxResNet: Deep voxelwise residual networks for brain segmentation from 3D MR images. NeuroImage. 2018, 170, 446–455. [Google Scholar] [CrossRef] [PubMed]
- Tsukahara JS, Harrison TL, Draheim C, Martin JD, Engle RW. Attention control: The missing link between sensory discrimination and intelligence. Atten Percept Psychophys. 2020, 82, 3445–3478. [Google Scholar] [CrossRef] [PubMed]
- Cabeza R, Nyberg L. Imaging cognition II: An empirical review of 275 PET and fMRI studies. J Cogn Neurosci. 2000, 12, 1–47. [Google Scholar] [CrossRef]
- MacDonald AW, Cohen JD, Stenger VA, Carter CS. Dissociating the role of the dorsolateral prefrontal and anterior cingulate cortex in cognitive control. Science. 2000, 288, 1835–1838. [Google Scholar] [CrossRef]
- Chiang JN, Reggente N, Dell’Italia J, Zheng ZS, Lutkenhoff ES. Predicting Fluid Intelligence Using Anatomical Measures Within Functionally Defined Brain Networks. In: Challenge in Adolescent Brain Cognitive Development Neurocognitive Prediction. Springer; 2019, 143-149.
- Srivastava S, Eitel F, Ritter K. Predicting fluid intelligence in adolescent brain mri data: An ensemble approach. In: Challenge in Adolescent Brain Cognitive Development Neurocognitive Prediction. Springer; 2019, 74-82.
- Ren H, Wang X, Wang S, Zhang Z. Predict Fluid Intelligence of Adolescent Using Ensemble Learning. In: Challenge in Adolescent Brain Cognitive Development Neurocognitive Prediction. Springer; 2019, 66-73.
- Tamez-Pena J, Orozco J, Sosa P, Valdes A, Nezhadmoghadam F. Ensemble of svm, random-forest and the bswims method to predict and describe structural associations with fluid intelligence scores from t1-weighed mri. In: Challenge in Adolescent Brain Cognitive Development Neurocognitive Prediction. Springer; 2019, 47-56.
- Brueggeman L, Koomar T, Huang Y, et al. Ensemble Modeling of Neurocognitive Performance Using MRI-Derived Brain Structure Volumes. In: Challenge in Adolescent Brain Cognitive Development Neurocognitive Prediction. Springer; 2019, 124-132.
- Mihalik A, Brudfors M, Robu M, et al. ABCD Neurocognitive Prediction Challenge 2019: predicting individual fluid intelligence scores from structural MRI using probabilistic segmentation and kernel ridge regression. In: Challenge in Adolescent Brain Cognitive Development Neurocognitive Prediction. Springer; 2019, 133-142.
- Ranjbar S, Singleton KW, Curtin L, et al. Sex differences in predicting fluid intelligence of adolescent brain from T1-weighted MRIs. In: Challenge in Adolescent Brain Cognitive Development Neurocognitive Prediction. Springer; 2019, 150-157.
- Wlaszczyk A, Kaminska A, Pietraszek A, Dabrowski J, Pawlak MA, Nowicka H. Predicting Fluid Intelligence from Structural MRI Using Random Forest regression. In: Challenge in Adolescent Brain Cognitive Development Neurocognitive Prediction. Springer; 2019, 83-91.
- Kao PY, Zhang A, Goebel M, Chen JW, Manjunath BS. Predicting Fluid Intelligence of Children using T1-weighted MR Images and a StackNet. In: Challenge in Adolescent Brain Cognitive Development Neurocognitive Prediction. Springer; 2019, 9-16.
- Li T, Wang X, Luo T, et al. Adolescent Fluid Intelligence Prediction from Regional Brain Volumes and Cortical Curvatures Using BlockPC-XGBoost. In: Challenge in Adolescent Brain Cognitive Development Neurocognitive Prediction. Springer; 2019, 167-175.
- Saha S, Pagnozzi A, Bradford D, Fripp J. Predicting fluid intelligence in adolescence from structural MRI with deep learning methods. Intelligence. 2021, 88, 101568. [Google Scholar] [CrossRef]
- Kane MJ, Engle RW. The role of prefrontal cortex in working-memory capacity, executive attention, and general fluid intelligence: An individual-differences perspective. Psychon Bull Rev. 2002, 9, 637–671. [Google Scholar] [CrossRef]
- Conway AR, Cowan N, Bunting MF, Therriault DJ, Minkoff SR. A latent variable analysis of working memory capacity, short-term memory capacity, processing speed, and general fluid intelligence. Intelligence. 2002, 30, 163–183. [Google Scholar] [CrossRef]
- Paul EJ, Larsen RJ, Nikolaidis A, et al. Dissociable brain biomarkers of fluid intelligence. Neuroimage. 2016, 137, 201–211. [Google Scholar] [CrossRef]
- Morsing E, Malova M, Kahn A, et al. Brain Volumes and Developmental Outcome in Childhood Following Fetal Growth Restriction Leading to Very Preterm Birth. Front Physiol. 2018, 9, 1583. [Google Scholar] [CrossRef]
- Ogawa T, Aihara T, Shimokawa T, Yamashita O. Large-scale brain network associated with creative insight: combined voxel-based morphometry and resting-state functional connectivity analyses. Sci Rep. 2018, 8, 1–11. [Google Scholar]
- Hilger K, Winter NR, Leenings R, et al. Predicting intelligence from brain gray matter volume. Brain Struct Funct. 2020, 225, 2111–2129. [Google Scholar] [CrossRef] [PubMed]
- Packard MG, Knowlton BJ. Learning and memory functions of the basal ganglia. Annu Rev Neurosci. 2002, 25, 563–593. [Google Scholar] [CrossRef] [PubMed]
- Tricomi E, Delgado MR, McCandliss BD, McClelland JL, Fiez JA. Performance feedback drives caudate activation in a phonological learning task. J Cogn Neurosci. 2006, 18, 1029–1043. [Google Scholar] [CrossRef] [PubMed]
- Grazioplene RG, G. Ryman S, Gray JR, Rustichini A, Jung RE, DeYoung CG. Subcortical intelligence: Caudate volume predicts IQ in healthy adults. Hum Brain Mapp. 2015, 36, 1407–1416. [Google Scholar] [CrossRef]
- Westlye LT, Walhovd KB, Bjørnerud A, Due-Tønnessen P, Fjell AM. Error-related negativity is mediated by fractional anisotropy in the posterior cingulate gyrus—a study combining diffusion tensor imaging and electrophysiology in healthy adults. Cereb Cortex. 2009, 19, 293–304. [Google Scholar] [CrossRef]
- Bar M, Tootell RB, Schacter DL, et al. Cortical mechanisms specific to explicit visual object recognition. Neuron. 2001, 29, 529–535. [Google Scholar] [CrossRef] [PubMed]
- McCandliss BD, Cohen L, Dehaene S. The visual word form area: expertise for reading in the fusiform gyrus. Trends Cogn Sci. 2003, 7, 293–299. [Google Scholar] [CrossRef]
- McClelland JL, Rogers TT. The parallel distributed processing approach to semantic cognition. Nat Rev Neurosci. 2003, 4, 310–322. [Google Scholar] [CrossRef] [PubMed]
- Oxtoby NP, Ferreira FS, Mihalik A, et al. ABCD Neurocognitive Prediction Challenge 2019: Predicting individual residual fluid intelligence scores from cortical grey matter morphology. In: Challenge in Adolescent Brain Cognitive Development Neurocognitive Prediction. Springer; 2019:114-123.
- Rebsamen M, Rummel C, Mürner-Lavanchy I, Reyes M, Wiest R, McKinley R. Surface-Based Brain Morphometry for the Prediction of Fluid Intelligence in the Neurocognitive Prediction Challenge 2019. In: Challenge in Adolescent Brain Cognitive Development Neurocognitive Prediction. Springer; 2019:26-34.
- Valverde JM, Imani V, Lewis JD, Tohka J. Predicting intelligence based on cortical WM/GM contrast, cortical thickness and volumetry. In: Challenge in Adolescent Brain Cognitive Development Neurocognitive Prediction. Springer; 2019:57-65.
- Pölsterl S, Gutiérrez-Becker B, Sarasua I, Roy AG, Wachinger C. Prediction of Fluid Intelligence from T1-Weighted Magnetic Resonance Images. In: Challenge in Adolescent Brain Cognitive Development Neurocognitive Prediction. Springer; 2019:35-46.
- Pölsterl S, Gutiérrez-Becker B, Sarasua I, Roy AG, Wachinger C. An AutoML Approach for the Prediction of Fluid Intelligence from MRI-Derived Features. In: Challenge in Adolescent Brain Cognitive Development Neurocognitive Prediction. Springer; 2019:99-107.
- Guerdan L, Sun P, Rowland C, et al. Deep learning vs. classical machine learning: A comparison of methods for fluid intelligence prediction. In: Challenge in Adolescent Brain Cognitive Development Neurocognitive Prediction. Springer; 2019:17-25.
- Li T, McCorkle GS, Williams DK, Badger TM, Ou X. Cortical Morphometry is Associated with Neuropsychological Function in Healthy 8-Year-Old Children. J Neuroimaging. 2020, 30, 833–842. [Google Scholar] [CrossRef] [PubMed]
- Tadayon E, Pascual-Leone A, Santarnecchi E. Differential contribution of cortical thickness, surface area, and gyrification to fluid and crystallized intelligence. Cereb Cortex. 2020, 30, 215–225. [Google Scholar] [CrossRef] [PubMed]
- Bajaj S, Raikes A, Smith R, et al. The relationship between general intelligence and cortical structure in healthy individuals. Neuroscience. 2018, 388, 36–44. [Google Scholar] [CrossRef] [PubMed]
- Girault JB, Cornea E, Goldman BD, et al. Cortical structure and cognition in infants and toddlers. Cereb Cortex. 2020, 30, 786–800. [Google Scholar] [CrossRef]
- Adeli E, Meng Y, Li G, Lin W, Shen D. Multi-task prediction of infant cognitive scores from longitudinal incomplete neuroimaging data. NeuroImage. 2019, 185, 783–792. [Google Scholar] [CrossRef] [PubMed]
- Zhang C, Adeli E, Wu Z, Li G, Lin W, Shen D. Infant brain development prediction with latent partial multi-view representation learning. IEEE Trans Med Imaging. 2018, 38, 909–918. [Google Scholar]
- Zhang X, Cheng J, Ni H, et al. Infant Cognitive Scores Prediction with Multi-stream Attention-Based Temporal Path Signature Features. In: International Conference on Medical Image Computing and Computer-Assisted Intervention. Springer; 2020:134-144.
- Squeglia LM, Jacobus J, Sorg SF, Jernigan TL, Tapert SF. Early adolescent cortical thinning is related to better neuropsychological performance. J Int Neuropsychol Soc. 2013, 19, 962–970. [Google Scholar] [CrossRef]
- Yang JJ, Yoon U, Yun HJ, et al. Prediction for human intelligence using morphometric characteristics of cortical surface: partial least square analysis. Neuroscience 2013, 246, 351–361. [Google Scholar] [CrossRef]
- Wang L, Wee CY, Suk HI, Tang X, Shen D. MRI-based intelligence quotient (IQ) estimation with sparse learning. PloS One. 2015, 10, e0117295. [Google Scholar]
- Choi YY, Shamosh NA, Cho SH, et al. Multiple bases of human intelligence revealed by cortical thickness and neural activation. J Neurosci. 2008, 28, 10323–10329. [Google Scholar] [CrossRef]
- Wright IC, McGuire PK, Poline JB, et al. A voxel-based method for the statistical analysis of gray and white matter density applied to schizophrenia. Neuroimage. 1995, 2, 244–252. [Google Scholar] [CrossRef]
- Kim H, Kim J hoon, Possin KL, et al. Surface-based morphometry reveals caudate subnuclear structural damage in patients with premotor Huntington disease. Brain Imaging Behav. 2017, 11, 1365–1372. [Google Scholar] [CrossRef]
- Whitwell, JL. Voxel-based morphometry: an automated technique for assessing structural changes in the brain. J Neurosci. 2009, 29, 9661–9664. [Google Scholar] [CrossRef] [PubMed]
- Hidese S, Ota M, Matsuo J, et al. Correlation Between the Wechsler Adult Intelligence Scale-3 (rd) Edition Metrics and Brain Structure in Healthy Individuals: A Whole-Brain Magnetic Resonance Imaging Study. Front Hum Neurosci 2020, 14. [Google Scholar]
- McDermott CL, Seidlitz J, Nadig A, et al. Longitudinally mapping childhood socioeconomic status associations with cortical and subcortical morphology. J Neurosci. 2019, 39, 1365–1373. [Google Scholar] [CrossRef]
- Ramsden S, Richardson FM, Josse G, et al. Verbal and non-verbal intelligence changes in the teenage brain. Nature. 2011, 479, 113–116. [Google Scholar] [CrossRef]
- Vang YS, Cao Y, Xie X. A Combined Deep Learning-Gradient Boosting Machine Framework for Fluid Intelligence Prediction. In: Challenge in Adolescent Brain Cognitive Development Neurocognitive Prediction. Springer; 2019:1-8.
- Pominova M, Kuzina A, Kondrateva E, et al. Ensemble of 3D CNN regressors with data fusion for fluid intelligence prediction. In: Challenge in Adolescent Brain Cognitive Development Neurocognitive Prediction. Springer; 2019:158-166.
- Zou Y, Jang I, Reese TG, Yao J, Zhu W, Rispoli JV. Cortical and Subcortical Contributions to Predicting Intelligence Using 3D ConvNets. In: Challenge in Adolescent Brain Cognitive Development Neurocognitive Prediction. Springer; 2019:176-185.
- Liu L, Yu L, Wang S, Heng PA. Predicting Fluid Intelligence from MRI Images with Encoder-Decoder Regularization. In: Challenge in Adolescent Brain Cognitive Development Neurocognitive Prediction. Springer; 2019:108-113.
- Arrieta AB, Díaz-Rodríguez N, Del Ser J, et al. Explainable Artificial Intelligence (XAI): Concepts, taxonomies, opportunities and challenges toward responsible AI. Inf Fusion. 2020, 58, 82–115. [Google Scholar] [CrossRef]
- Gunning D, Stefik M, Choi J, Miller T, Stumpf S, Yang GZ. XAI—Explainable artificial intelligence. Sci Robot. 2019, 4, eaay7120. [Google Scholar] [CrossRef]
- Speith, T. A review of taxonomies of explainable artificial intelligence (XAI) methods. In: 2022 ACM Conference on Fairness, Accountability, and Transparency; 2022:2239-2250.
- Malpas CB, Genc S, Saling MM, Velakoulis D, Desmond PM, O’Brien TJ. MRI correlates of general intelligence in neurotypical adults. J Clin Neurosci. 2016, 24, 128–134. [Google Scholar] [CrossRef]
- Feng K, Rowell AC, Andres A, et al. Diffusion tensor MRI of white matter of healthy full-term newborns: relationship to neurodevelopmental outcomes. Radiology. 2019, 292, 179–187. [Google Scholar] [CrossRef]
- Konrad A, Vucurevic G, Musso F, Winterer G. VBM–DTI correlates of verbal intelligence: a potential link to Broca’s Area. J Cogn Neurosci. 2012, 24, 888–895. [Google Scholar] [CrossRef]
- Casson IR, Viano DC, Haacke EM, Kou Z, LeStrange DG. Is there chronic brain damage in retired NFL players? Neuroradiology, neuropsychology, and neurology examinations of 45 retired players. Sports Health. 2014, 6, 384–395. [Google Scholar] [CrossRef] [PubMed]
- Lee SJ, Steiner RJ, Yu Y, et al. Common and heritable components of white matter microstructure predict cognitive function at 1 and 2 y. Proc Natl Acad Sci. 2017, 114, 148–153. [Google Scholar] [CrossRef]
- Zhang Z, Allen GI, Zhu H, Dunson D. Tensor network factorizations: Relationships between brain structural connectomes and traits. Neuroimage. 2019, 197, 330–343. [Google Scholar] [CrossRef]
- Gore JC, Li M, Gao Y, et al. Functional MRI and resting state connectivity in white matter-a mini-review. Magn Reson Imaging. 2019, 63, 1–11. [Google Scholar] [CrossRef] [PubMed]
- Shirer WR, Ryali S, Rykhlevskaia E, Menon V, Greicius MD. Decoding subject-driven cognitive states with whole-brain connectivity patterns. Cereb Cortex. 2012, 22, 158–165. [Google Scholar] [CrossRef] [PubMed]
- Song M, Zhou Y, Li J, et al. Brain spontaneous functional connectivity and intelligence. Neuroimage. 2008, 41, 1168–1176. [Google Scholar] [CrossRef]
- Kwak S, Kim H, Kim H, Youm Y, Chey J. Distributed functional connectivity predicts neuropsychological test performance among older adults. Hum Brain Mapp. Published online 2021.
- Finn ES, Shen X, Scheinost D, et al. Functional connectome fingerprinting: identifying individuals using patterns of brain connectivity. Nat Neurosci. 2015, 18, 1664–1671. [Google Scholar] [CrossRef]
- Powell MA, Garcia JO, Yeh FC, Vettel JM, Verstynen T. Local connectome phenotypes predict social, health, and cognitive factors. Netw Neurosci. 2018, 2, 86–105. [Google Scholar] [CrossRef]
- Sripada C, Rutherford S, Angstadt M, et al. Prediction of neurocognition in youth from resting state fMRI. Mol Psychiatry. 2020, 25, 3413–3421. [Google Scholar] [CrossRef]
- Jiang R, Qi S, Du Y, et al. Predicting individualized intelligence quotient scores using brainnetome-atlas based functional connectivity. In: 2017 IEEE 27th International Workshop on Machine Learning for Signal Processing (MLSP). IEEE; 2017:1-6.
- Hart SJ, Davenport ML, Hooper SR, Belger A. Visuospatial executive function in Turner syndrome: functional MRI and neurocognitive findings. Brain. 2006, 129, 1125–1136. [Google Scholar] [CrossRef]
- Greene AS, Gao S, Scheinost D, Constable RT. Task-induced brain state manipulation improves prediction of individual traits. Nat Commun. 2018, 9, 1–13. [Google Scholar]
- Elliott ML, Knodt AR, Cooke M, et al. General functional connectivity: Shared features of resting-state and task fMRI drive reliable and heritable individual differences in functional brain networks. Neuroimage. 2019, 189, 516–532. [Google Scholar] [CrossRef] [PubMed]
- He T, Kong R, Holmes A, et al. Do deep neural networks outperform kernel regression for functional connectivity prediction of behavior. BioRxiv. Published online 2018:473603. =, 4: 2018.
- Li C, Yang G, Li M, Li B. Fluid intelligence relates to the resting state amplitude of low-frequency fluctuation and functional connectivity: a multivariate pattern analysis. NeuroReport. 2018, 29, 8–12. [Google Scholar] [CrossRef] [PubMed]
- Dubois J, Galdi P, Han Y, Paul LK, Adolphs R. Resting-state functional brain connectivity best predicts the personality dimension of openness to experience. Personal Neurosci. 2018, 1.
- Yoo K, Rosenberg MD, Noble S, Scheinost D, Constable RT, Chun MM. Multivariate approaches improve the reliability and validity of functional connectivity and prediction of individual behaviors. Neuroimage. 2019, 197, 212–223. [Google Scholar] [CrossRef] [PubMed]
- Noble S, Spann MN, Tokoglu F, Shen X, Constable RT, Scheinost D. Influences on the test–retest reliability of functional connectivity MRI and its relationship with behavioral utility. Cereb Cortex. 2017, 27, 5415–5429. [Google Scholar] [CrossRef] [PubMed]
- Kanaya AM, Grady D, Barrett-Connor E. Explaining the sex difference in coronary heart disease mortality among patients with type 2 diabetes mellitus: a meta-analysis. Arch Intern Med. 2002, 162, 1737–1745. [Google Scholar] [CrossRef] [PubMed]
- Cosgrove KP, Mazure CM, Staley JK. Evolving knowledge of sex differences in brain structure, function, and chemistry. Biol Psychiatry. 2007, 62, 847–855. [Google Scholar] [CrossRef] [PubMed]
- Sowell ER, Thompson PM, Leonard CM, Welcome SE, Kan E, Toga AW. Longitudinal mapping of cortical thickness and brain growth in normal children. J Neurosci. 2004, 24, 8223–8231. [Google Scholar] [CrossRef] [PubMed]
- Giedd JN, Blumenthal J, Jeffries NO, et al. Brain development during childhood and adolescence: a longitudinal MRI study. Nat Neurosci. 1999, 2, 861–863. [Google Scholar] [CrossRef] [PubMed]
- Herting MM, Johnson C, Mills KL, et al. Development of subcortical volumes across adolescence in males and females: A multisample study of longitudinal changes. NeuroImage. 2018, 172, 194–205. [Google Scholar] [CrossRef] [PubMed]
- Nagel BJ, Herting MM, Maxwell EC, Bruno R, Fair D. Hemispheric lateralization of verbal and spatial working memory during adolescence. Brain Cogn. 2013, 82, 58–68. [Google Scholar] [CrossRef] [PubMed]
- Vendetti MS, Johnson EL, Lemos CJ, Bunge SA. Hemispheric differences in relational reasoning: novel insights based on an old technique. Front Hum Neurosci. 2015, 9, 55. [Google Scholar]
- Steffener J, Habeck C, O’Shea D, Razlighi Q, Bherer L, Stern Y. Differences between chronological and brain age are related to education and self-reported physical activity. Neurobiol Aging. 2016, 40, 138–144. [Google Scholar] [CrossRef]
- Hackman DA, Cserbik D, Chen JC, et al. Association of Local Variation in Neighborhood Disadvantage in Metropolitan Areas With Youth Neurocognition and Brain Structure. JAMA Pediatr. Published online 2021:e210426-e210426.
- Skotting MB, Eskildsen SF, Ovesen AS, et al. Infants with congenital heart defects have reduced brain volumes. Sci Rep. 2021, 11, 1–8. [Google Scholar]
- Bolduc ME, Lambert H, Ganeshamoorthy S, Brossard-Racine M. Structural brain abnormalities in adolescents and young adults with congenital heart defect: a systematic review. Dev Med Child Neurol. 2018, 60, 1209–1224. [Google Scholar] [CrossRef]
- Asschenfeldt B, Evald L, Heiberg J, et al. Neuropsychological status and structural brain imaging in adults with simple congenital heart defects closed in childhood. J Am Heart Assoc. 2020, 9, e015843. [Google Scholar] [CrossRef]
- Oster ME, Watkins S, Hill KD, Knight JH, Meyer RE. Academic outcomes in children with congenital heart defects: a population-based cohort study. Circ Cardiovasc Qual Outcomes. 2017, 10, e003074. [Google Scholar] [CrossRef] [PubMed]
- Savory K, Manivannan S, Zaben M, Uzun O, Syed YA. Impact of copy number variation on human neurocognitive deficits and congenital heart defects: a systematic review. Neurosci Biobehav Rev. 2020, 108, 83–93. [Google Scholar] [CrossRef] [PubMed]
- Derridj N, Guedj R, Calderon J, et al. Long-term Neurodevelopmental Outcomes of Children with Congenital Heart Defects. J Pediatr. Published online 2021.
- Huang SC, Pareek A, Seyyedi S, Banerjee I, Lungren MP. Fusion of medical imaging and electronic health records using deep learning: a systematic review and implementation guidelines. NPJ Digit Med. 2020, 3, 1–9. [Google Scholar]
- Guyon I, Elisseeff A. An introduction to variable and feature selection. J Mach Learn Res 2003, 3, 1157–1182. [Google Scholar]
- Li J, Cheng K, Wang S, et al. Feature selection: A data perspective. ACM Comput Surv CSUR. 2017, 50, 1–45. [Google Scholar]
- Smith SM, Nichols TE. Statistical challenges in “big data” human neuroimaging. Neuron. 2018, 97, 263–268. [Google Scholar] [CrossRef]
- He S, Pereira D, Perez JD, et al. Multi-channel attention-fusion neural network for brain age estimation: Accuracy, generality, and interpretation with 16,705 healthy MRIs across lifespan. Med Image Anal. 2021, 72, 102091. [Google Scholar] [CrossRef]
- He S, Grant PE, Ou Y. Global-Local Transformer for Brain Age Estimation. IEEE Trans Med Imaging. Published online 2021.
- Brookes AJ, Robinson PN. Human genotype–phenotype databases: aims, challenges and opportunities. Nat Rev Genet. 2015, 16, 702–715. [Google Scholar] [CrossRef]
- Sterling LH, Liu A, Ganni E, et al. Neurocognitive disorders amongst patients with congenital heart disease undergoing procedures in childhood. Int J Cardiol. Published online 2021.
- Calderon J, Bellinger DC. Executive function deficits in congenital heart disease: why is intervention important? Cardiol Young. 2015, 25, 1238–1246. [Google Scholar] [CrossRef]
- Cole JH, Leech R, Sharp DJ, Initiative ADN. Prediction of brain age suggests accelerated atrophy after traumatic brain injury. Ann Neurol. 2015, 77, 571–581. [Google Scholar] [CrossRef] [PubMed]
- Cole JH, Ritchie SJ, Bastin ME, et al. Brain age predicts mortality. Mol Psychiatry. 2018, 23, 1385. [Google Scholar] [CrossRef] [PubMed]
- Franke K, Ziegler G, Klöppel S, Gaser C, Initiative ADN. Estimating the age of healthy subjects from T1-weighted MRI scans using kernel methods: exploring the influence of various parameters. Neuroimage. 2010, 50, 883–892. [Google Scholar] [CrossRef] [PubMed]
- Franke K, Gaser C, Manor B, Novak V. Advanced BrainAGE in older adults with type 2 diabetes mellitus. Front Aging Neurosci. 2013, 5, 90. [Google Scholar]
- Antonova E, Sharma T, Morris R, Kumari V. The relationship between brain structure and neurocognition in schizophrenia: a selective review. Schizophr Res. 2004, 70, 117–145. [Google Scholar] [CrossRef] [PubMed]
- Berkelhammer LD, Williamson AL, Sanford SD, et al. Neurocognitive sequelae of pediatric sickle cell disease: a review of the literature. Child Neuropsychol. 2007, 13, 120–131. [Google Scholar] [CrossRef]
- Shields LB, Choucair AK. Management of low-grade gliomas: a review of patient-perceived quality of life and neurocognitive outcome. World Neurosurg. 2014, 82, e299–e309. [Google Scholar] [CrossRef]
- Subramaniyan S, Terrando N. Narrative review article: neuroinflammation and perioperative neurocognitive disorders. Anesth Analg. 2019, 128, 781. [Google Scholar] [CrossRef]
Figure 2.
Domains scored by the NIH toolbox neurocognitive battery.
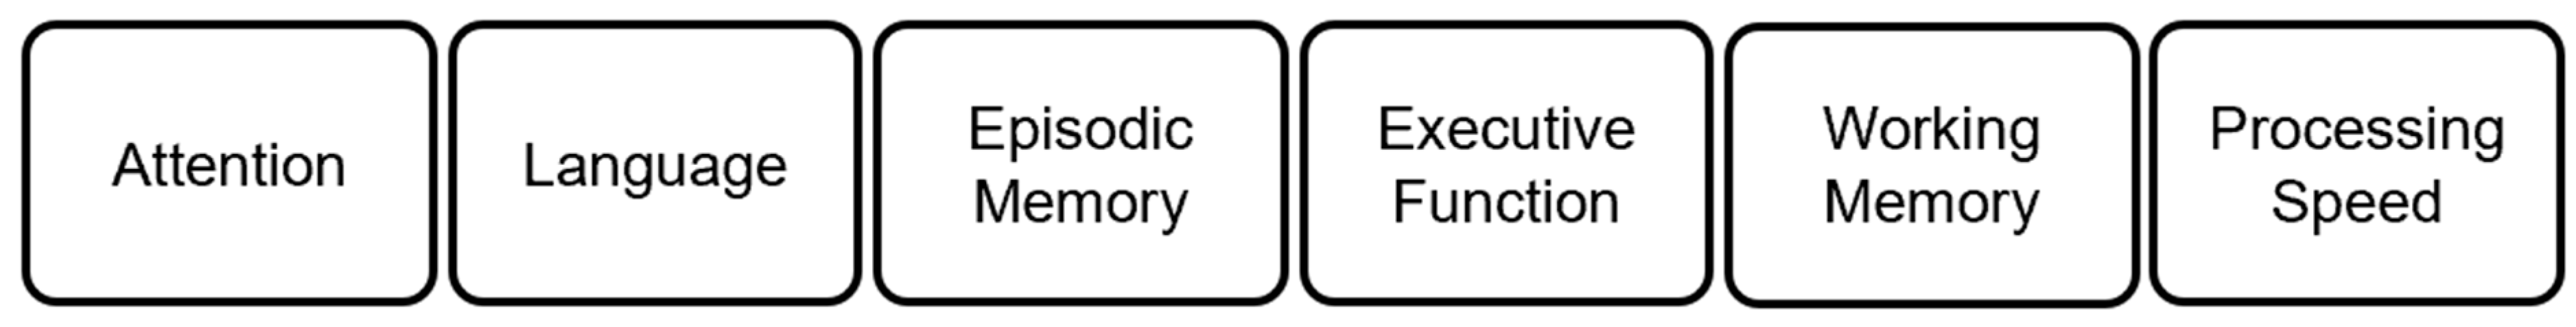
Figure 4.
Bar plot representing of the proportion of our reviewed sMRI papers that used different Brodmann areas in inferring intelligence and neurocognition. Shaded BA numbers are part of the P-FIT model. Brodmann areas are not specified for either left or right hemisphere. Studies that did not specify BAs are also included in the normalization.
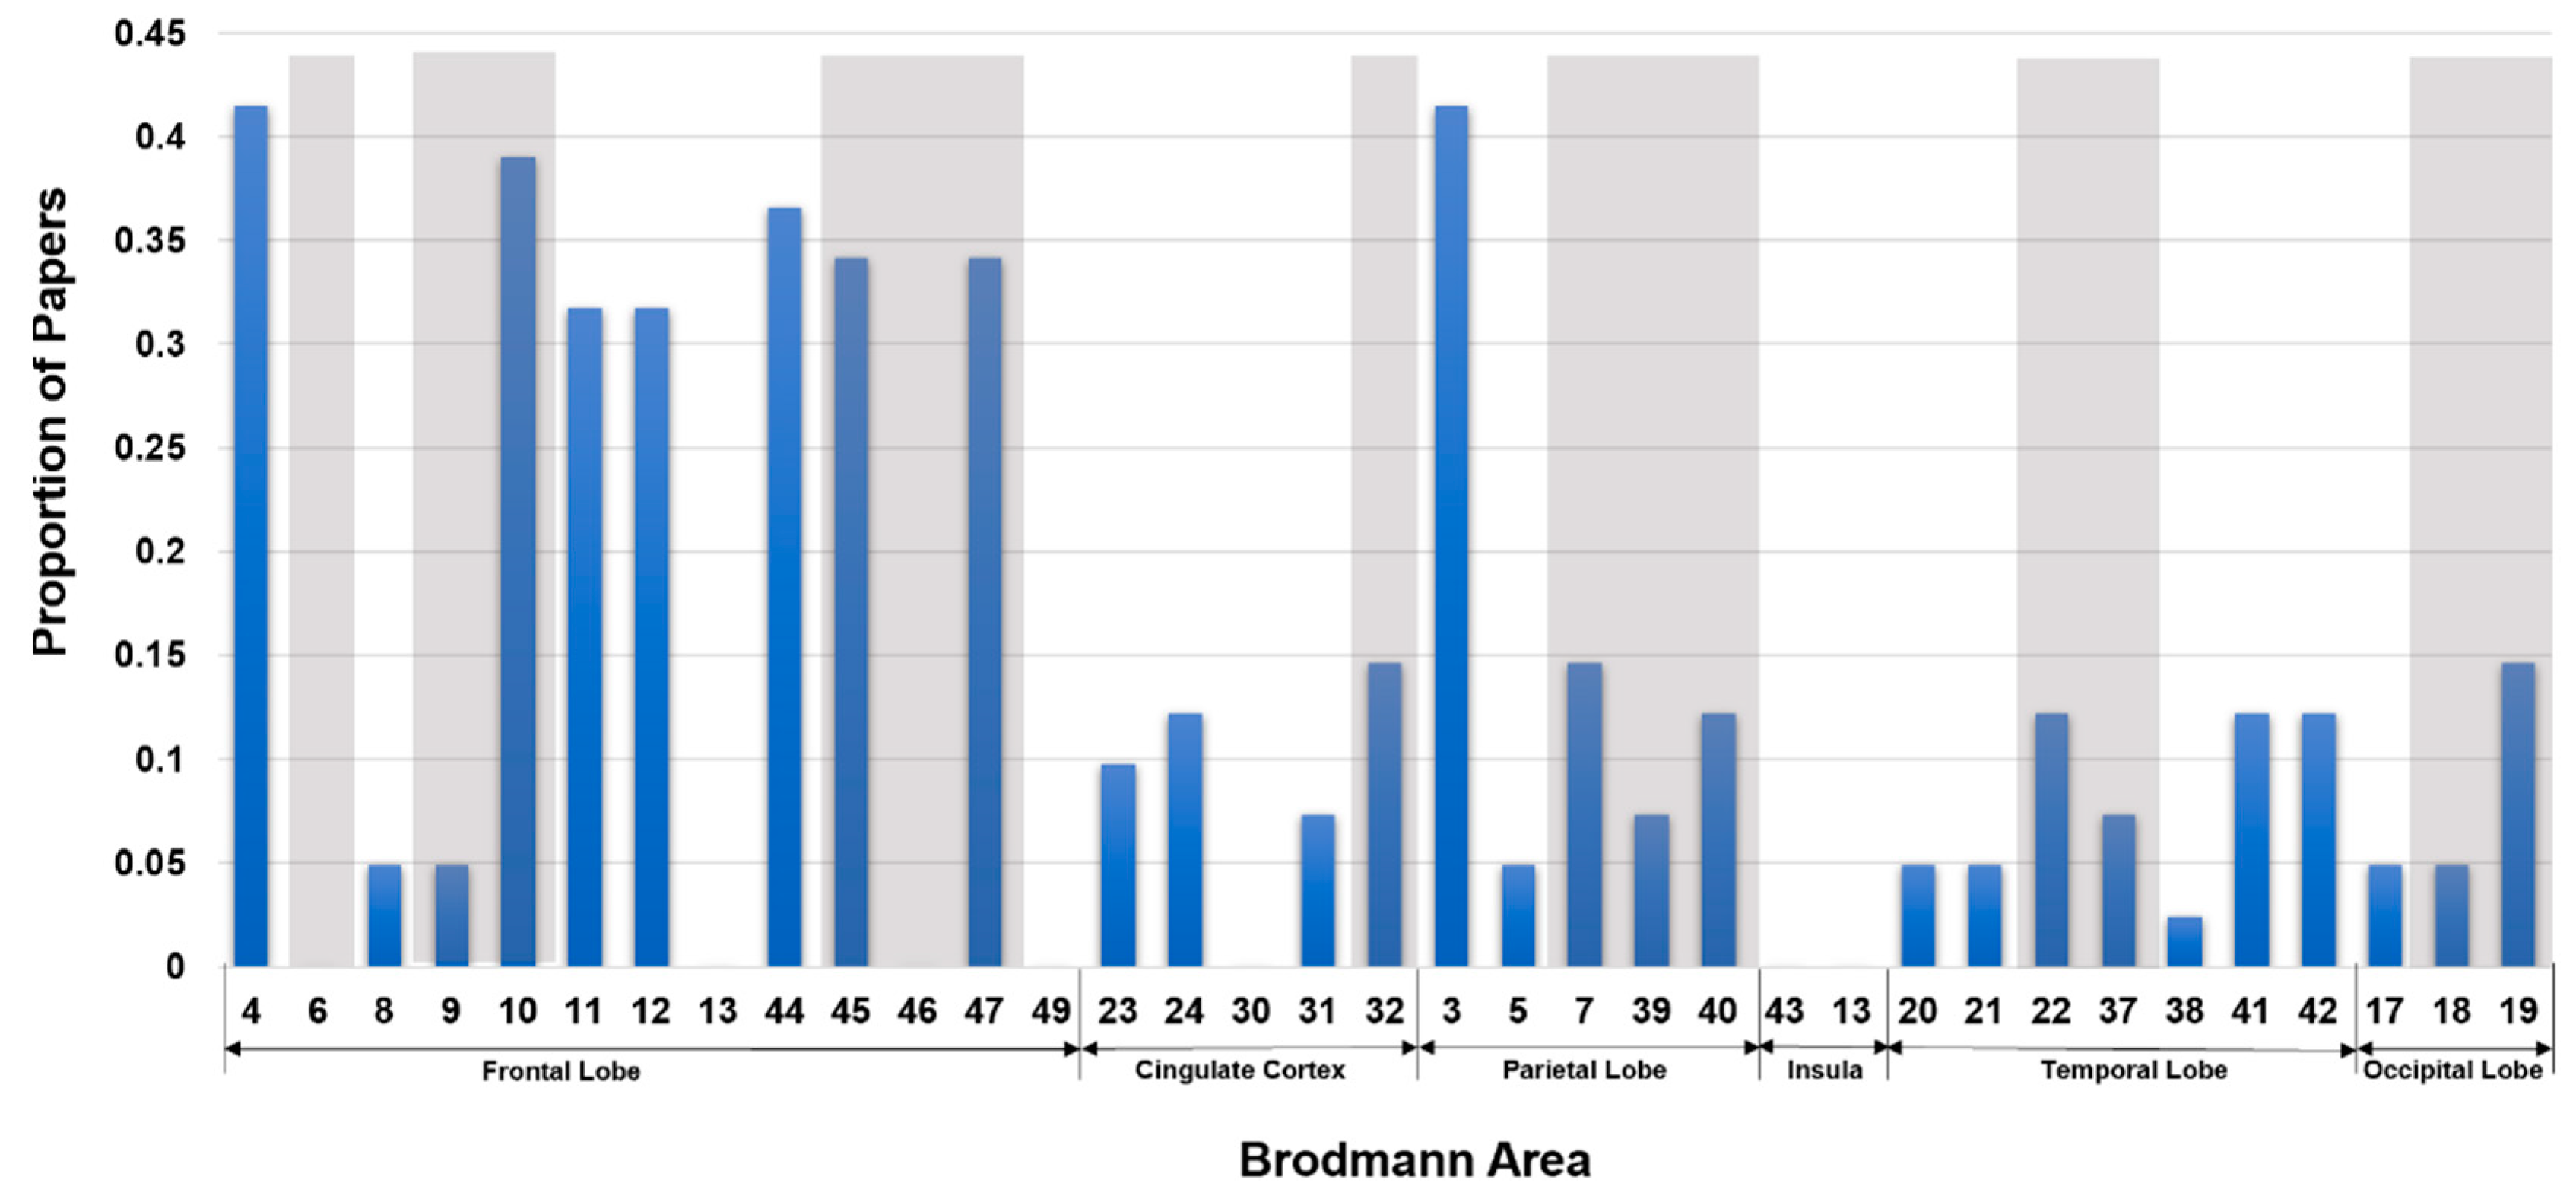
Figure 5.
Bar plot representing of the proportion of our reviewed fMRI papers that used different Brodmann areas in inferring intelligence and neurocognition. Shaded BA numbers are part of the P-FIT model. Brodmann areas are not specified for the either left or right hemisphere. Studies that did not specify BAs are also included in the normalization.
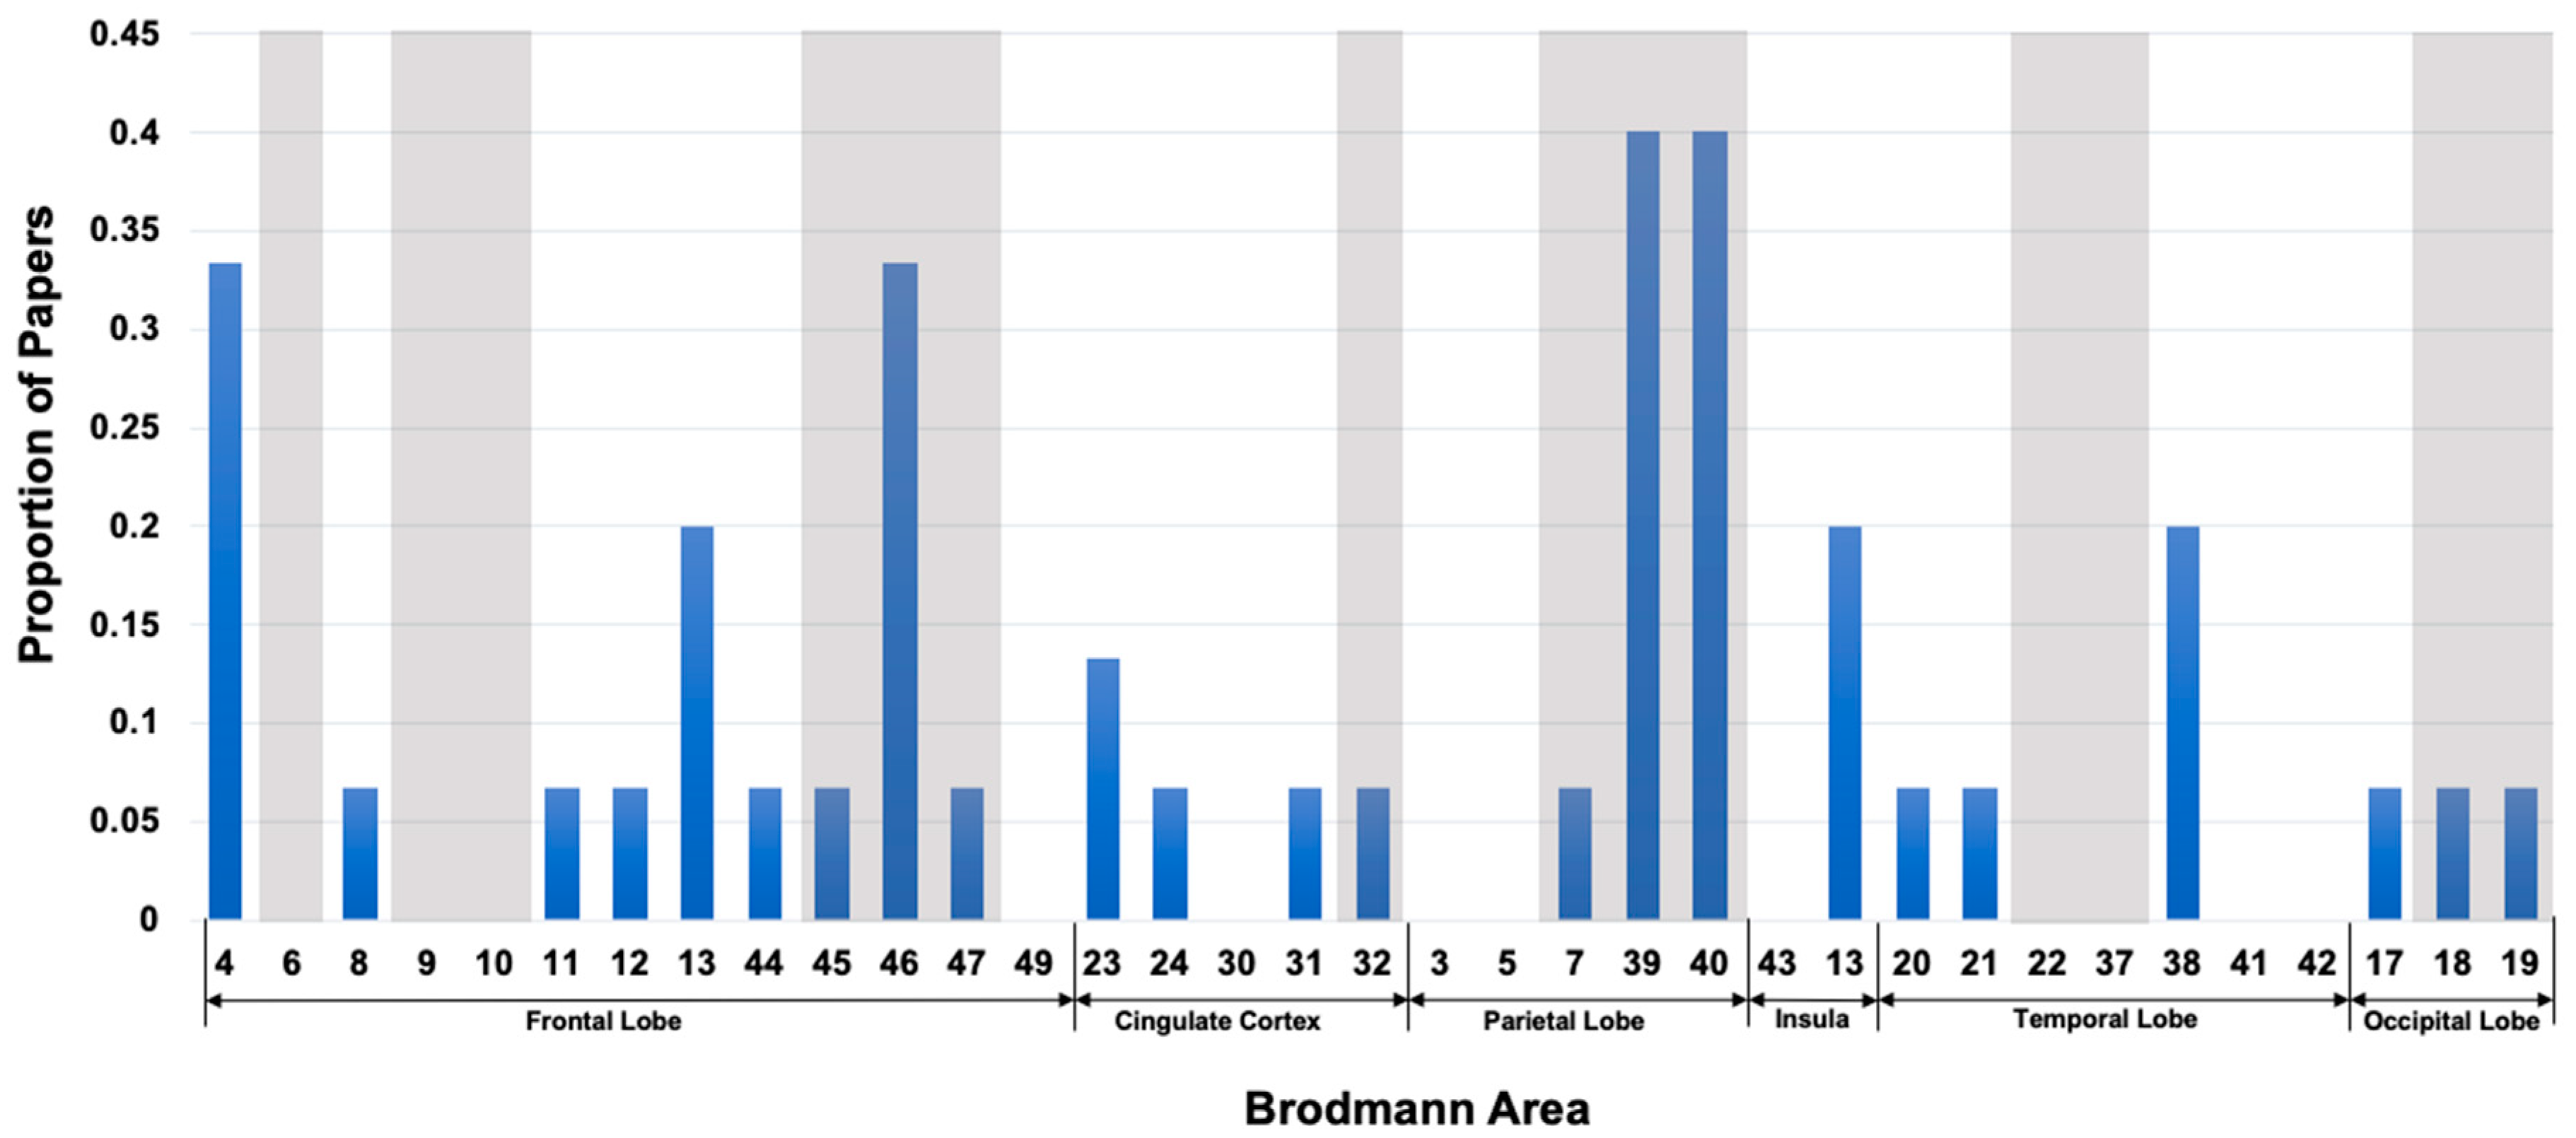
Disclaimer/Publisher’s Note: The statements, opinions and data contained in all publications are solely those of the individual author(s) and contributor(s) and not of MDPI and/or the editor(s). MDPI and/or the editor(s) disclaim responsibility for any injury to people or property resulting from any ideas, methods, instructions or products referred to in the content. |
© 2023 by the authors. Licensee MDPI, Basel, Switzerland. This article is an open access article distributed under the terms and conditions of the Creative Commons Attribution (CC BY) license (http://creativecommons.org/licenses/by/4.0/).
Copyright: This open access article is published under a Creative Commons CC BY 4.0 license, which permit the free download, distribution, and reuse, provided that the author and preprint are cited in any reuse.


