

Submitted:
10 February 2023
Posted:
13 February 2023
You are already at the latest version
Preprints on COVID-19 and SARS-CoV-2
Abstract
Assessment of the percentage of disease infected lung volume using computed tomography (CT) images can play an important role to detect lung diseases and predict disease severity. However, manual segmentation of disease infected regions from many CT image slices is tedious and not feasible in clinical practice. To help solve this clinical challenge, this study aims to investigate a new strategy to automatically segment disease infected regions and predict disease severity. We employed a public dataset acquired from 20 COVID-19 patients, which includes manually annotated lung and infections masks, to train a new ensembled deep learning (DL) model that combines the five customized residual attention UNet models to segment disease infected regions followed by a Feature Pyramid Network (FPN) model to classify severity stage of COVID-19 infection. To test potentially clinical utility of new model, we first gathered and processed another set of CT images acquired from 80 Covid-19 patients. Next, we asked two chest radiologists to read CT images of each patient and report the estimated percentage of infected lung volume and disease severity level. Additionally, we asked radiologists to rate acceptance of DL model-generated segmentation results using a 5-scale rating method. Data analysis results show that agreement between disease severity classification is >90% in 45 testing cases. Furthermore, >73% of cases received the high rating score from two radiologists (scored more than 4). This study demonstrates feasibility of developing a new DL-model to efficiently provide quantitative assessment of disease severity based on the automated segmentation of the disease infected regions to support improving efficacy of radiologists in disease diagnosis.
Keywords:
Infected lung segmentation
; Quantification of lung disease severity
; Comparison be-tween manual and automated image segmentation
; Deep Neural Network
; COVID-19 detections
; COVID-19 severity assessment
1. Introduction
Computed tomography (CT) is the most popular medical imaging modality used in the clinical practice to detect lung diseases (i.e., lung cancer, chronic obstructive pulmonary disease, interstitial lung diseases, pneumonia and others). In order to more accurately assess severity of many lung diseases and predict patients’ prognosis, estimation of disease infected volume and/or its percentage to the total lung volume plays an important role. However, subjective estimation of disease infected regions or volume by radiologists is quite difficult, tedious, and inaccurate (due to the large intra- and inter-reader variability), which make it often infeasible in the busy clinical practice. Thus, in order to help solve this clinical challenge, developing computer-aided detection (CAD) schemes or methods has been attracting broad research interest. For example, the CAD-generated lung density mask has been well developed and tested to quantify percentages of emphysema infected lung volume [1] or degree of lung inflammation [2]. However, quantifying other lung diseases such as pneumonia infected lung volume has not been well developed and evaluated. Thus, we investigated feasibility of developing new CAD schemes that can automatically segment pneumonia infected regions depicting on CT image slices and quantify the percentage of the diseased lung volume, which has potential to more accurately and efficiently assist radiologists in disease diagnosis and assessment of disease severity.
The Coronavirus disease (COVID-19) was first diagnosed in late 2019, this respiratory disease originated from SARS-CoV-2 virus has infected millions of people globally [3] and also produced pneumonia-type diseases. Chest X-ray radiography and CT are two radiological imaging modalities to assist diagnosis of COVID-19 induced pneumonia, and more importantly to monitor its severity and spread of the infection [4]. While chest X-ray images are easier and faster to taken with low cost, CT scan is highly preferred mainly due to its three-dimensional nature and additional information to improve diagnostic accuracy [5]. Thanks to the availability of test kits, the diagnosis of COVID-19 is not a challenging task, but, on the other hand, the assessment of the infection severity and spread to lung regions and cause pneumonia-type infection is very demanding, which can help determine severity of infection and predict disease prognosis or long-term consequence or residual side-effect. However, manual delineation of lung infections and distinguishing between the opacity and texture of infected regions is challenging, time consuming, and highly subjective, which can be influenced by the radiologist’s bias and clinical experiences [5]. Additionally, it is also difficult for radiologists to distinguish between COVID-19 and other viral pneumonia [6].
In developing CAD schemes of lung CT images, deep learning (DL) models have been well recognized and widely used recently to perform the tasks of segmenting the regions of interest (ROIs) and detecting variety of lung diseases using the automatically extracted image features. However, DL algorithms or models generally need large datasets for training to achieve high accuracy and robustness [7]. Unfortunately, it lacks available image datasets with pixel-level annotation of disease regions in medical image research field since the reliable manual annotation of medical images is extremely time-consuming and difficult without heavy involvement of the experienced radiologists [5]. Hence, most of previous studies have focused on developing DL models to classify between COVID-19 and normal or other types of pneumonia cases [8,9,10], which has been found not clinically acceptable [11]. Thus, in order to overcome the disadvantages of previous “black-box” type CAD or DL models, developing new CAD or DL models to automatically segment the pneumonia infected regions due to the COVID-19 with interactive graphic user interface (GUI) is important to increase transparency and allow radiologists to visually inspect the segmented the infected lesions or regions, which can provide radiologists a visual-aid DL tool to assist their decision-making in order to more accurately and robustly quantify the severity and spread of COVID-19 generated pneumonia infection.
In order to test the feasibility and potential clinical utility of quantifying COVID-19 infected pneumonia volume using a novel DL approach or model, the overarching objective of this study is to investigate and compare the agreement between manual and automated segmentation of COVID-19 infected regions, ratings on disease severity, and acceptance level of radiologists to DL-generated lesion segmentation results. Following sections reports brief information of this study.
2. Materials and Methods
2.1. Datasets
In this study, three chest CT image datasets were used, which include two public datasets namely, “COVID-19 CT scans” and “COVID-19 CT segmentation dataset” [12]. The first public dataset includes 20 CT scans of patients diagnosed with COVID-19 from two sources, Coronacases [13] and Radiopedia [14]. Although numerous COVID-19 image datasets are publicly available, one unique characteristic of the dataset selected in this study is that all CT images have been annotated by experts providing three separate masks for the left lung, right lung, and infection. The second public dataset contains 100 axial CT images acquired from more than 40 COVID-19 patients. A mask with three labels is provided by a radiologist for each CT image indicating ground-glass opacity (GGO), pleural effusion and consolidation regions. These two datasets were used to build and/or train the DL model of segmenting and qualifying the disease infected regions or volumes. Additionally, another independent testing dataset is also assembled to test and evaluate the trained DL models, which includes 80 CT scans of COVID-19 patients acquired from” Hospital Regional III Hanorio Delgado” Arequipa, Peru.
2.2. Image preprocessing
In order to achieve higher reliability or robustness of the DL model, several image preprocessing techniques were employed to initially remove clinically unrelated images and normalize remaining images. First, the “COVID-19 CT scans” dataset includes whole CT images of COVID-19 patients. However, some slices of each CT scan (i.e., in the beginning and near the end of scan) usually contain very little lung area, thus not providing helpful information. Including these CT slices in the training data leads to a more unbalanced dataset. Thus, we removed up to 10% of CT images at the beginning and near the end of each CT scan. Generally, all lung infection datasets are unbalanced since the number of infection mask pixels are significantly less than the pixels of the healthy lung and other normal tissues presented in the image. In order to create a more balanced training dataset, we removed all healthy CT slices with no infection mask.
Second, image normalization is another important preprocessing step when training deep neural networks. Thus, all CT images were normalized by clipping the intensities outside the range [600, -1024] HU, (if x > max, then, x' = max. if x < min, then, x' = min ), and the remaining values were scaled between zero and one (x' =(x-xmin)⁄(xmax-xmin )).
Third, we applied the data augmentation technique to generalize and enlarge the dataset and mitigate overfitting. The main augmentation method adopted in this study is Elastic Transform [15] which is commonly applied in biomedical image analysis. The python library Albumentations [16] was used to perform the Elastic Transform and other affine transformations. Along with the elastic Transform, we also applied horizontal flip, Random rotate, and vertical flip. Figure 1 demonstrates changes of a CT slice after applying an augmentation method in this study.
Last, another preprocessing technique was adding different filters as a channel to the CT image. Several filters have been tested with various channel arrangements to pronounce different textures and structures and consequently achieve better discrimination between healthy and infected regions. Contrast Limited Adaptive Histogram Equalization (CLAHE) is one of the filters that has been applied as a channel to the CT images. CLAHE is a variant of adaptive histogram equalization that limits contrast amplification to reduce noise amplification. This filter performs histogram equalization in small patches with high accuracy and contrast limiting. Figure 2 illustrates the effect of applying a CLAHE filter on a CT image.
2.3. Image segmentation models and output
Several common deep neural network models were used in this study, including UNet [17], Feature Pyramid Network (FPN) [18], and Attention Residual UNet [19]. The Segmentation Models library [20] available on GitHub was used to test various segmentation models with different backbones and parameters more conveniently. For each model, many parameters have been tested and modified, including loss functions, fixed and variable learning rates, encoders and decoders, and dropout rates.
2.3.1. Lung segmentation
The first step is to segment lung area depicting on each CT slide. For this purpose, a publicly available model for lung parenchyma segmentation was used to create lung masks and segmenting the lung area [21]. In brief, this model used the U-net with the only adaption being batch normalization after each layer. Figure 3 demonstrates an example of the created lung mask and the lung segmentation result using this mask.
2.3.2. Infection area segmentation
The next step is to segment the disease infected lung regions (from fuzzy ground glass to consolidation patterns), regardless of the severity and development stage, which is one of the primary objectives of this study. Therefore, various object detection and segmentation models with different hyper-parameters have been employed to achieve the highest accuracy. First, the Attention Residual-UNet (AR-UNet) is selected to build the ensembled model in this study. AR-UNet model is an end-to-end infection segmentation network, which embeds attention mechanism and residual block simultaneously into the U-Net architecture. Hence, this model efficiently balances limited training data. In this model, Attention path employs the attention mechanism to capture spatial feature details. Residual block involves the semantic information flow through a 1×1 convolution [22].
Based on literature search and our experiments, we recognize that among many tested loss functions, the Binary cross-entropy loss and the Tversky loss [21] led to the best predictions. Binary cross-entropy is calculated as the following formula (1) [23]. Where ti is the truth value of either 0 or 1, pi is the SoftMax probability for the ith class [23].
In order to compute the Tversky loss function, a SoftMax along each voxel is applied [21]. Let P and t be the predicted and truth binary labels, respectively. The Dice similarity coefficient (D) between two binary volumes is identified and computed using formula (2):
D (P, t) = 2|Pt|/ (|P|+|t|)
Since in most cases non-lesion voxels outnumbers the lesion voxels, one of the main challenges in medical imaging is imbalance data especially in lesion segmentation. Therefore, using the unbalanced data in training lead to predictions that are severely biased towards low sensitivity (recall) and high precision, which is not desired particularly in medical applications where false-positives (FPs) are much tolerable than false-negatives (FNs). To achieve an optimum balance between sensitivity and precision (FPs vs. FNs) we used a loss layer based on the Tversky index. This index allows us to put emphasis on FNs and leads to high sensitivity. Using the formula (2) in a training loss layer, it equally weighs recall and precision, FN and FP, respectively [21]. To weigh FNs more than FPs in the training of a network with highly imbalanced data where small lesions’ detection is essential, a loss layer based on the Tversky index is efficient. The Tversky index is computed as the formula (3) [21]:
where α and β control the magnitude of penalties for FNs and FPs, respectively. Hence, the finally used Tversky loss function is defined as follows using formula (4) [21]:
Ti(P,t,α,β)=|Pt|/(|Pt|+β|P⁄t|+α|t⁄P| )
In the above equation, p0i and p1i are the probability of voxel i lesion and non-lesion, respectively. Additionally, v0i is 1 for a lesion and 0 for a non-lesion voxel and vice versa for the v1i [21].
Since image segmentation accuracy and robustness depend on choosing and use of DL models along with optimal training parameters, in order to more accurately and robustly segment disease infection areas or blobs depicting on chest CT images, we have developed, tested and compared five models based on AR-UNet with different training parameters as summarized in Table 1. Additionally, based on the hypothesis that if five models contain complementary prediction scores of pixels belonging to disease infected area, fusion of the predictions of all five selected models can further improve image segmentation results (i.e., prevent under-segmentation as much as possible). While involving several models comes with a longer processing time, the more reliable and precise prediction is worth the extra time.
2.3.3. Segmentation of GGO and Consolidation patches
Moreover, besides the overall infected region segmentation, it is of great importance to distinguish between different stages of COVID-19-infected pneumonia developments in lung and provide better assistance to radiologists. The “COVID-19 CT segmentation dataset” provides manual annotations with 3 infection types, GGO, pleural effusion and consolidation. Since the pleural effusion type is not of great interest in this study, we only included the GGO and consolidation labels into the training dataset. Like the infection segmentation model, we tested various neural network architectures and hyper parameters aiming to achieve the best predictions. We have applied an FPN model to categorize different stages of the COVID-19 in the infected area. This model has 23,915,590 trainable parameters. As depicted in Figure 4 the patch segmentation is based on ResNet and FPN model. ResNet34 is a backbone and FPN is the feature extractor network.
Although, the staging model tends to over-segment the GGO regions, the consolidation segmentation is very accurate. In order to prevent the over-segmentation on GGO area, the infection segmentation model is used to constrain the staging model. This model classifies each patch to three classes of Background, GGO and Consolidation.
2.3.4. Integrated model and GUI
Therefore, three common deep neural network architectures have been employed in this study. For lung segmentation, we have applied a publicly available model for lung parenchyma segmentation based on the UNet model. Additionally, FPN models along with AR-UNet, were developed for infection segmentation since the attention blocks have been shown to be very beneficial in image segmentation [19]. Moreover, an FPN model applied to categorize the severity of the COVID-19 infected area. For each model, many parameters have been tested and modified, including loss functions, fixed and variable learning rates, different encoders and decoders, and dropout rates. All models are written in Python and the TensorFlow library is used to train and test the models.
After extracting the lung and infected lesions by the two segmentation models, the percentage of the infected lung volume is reported along with the average Hounsfield units (HU) inside infected region, which can indicate the density of the lesion of interest and hence the severity of infection. This information is reported for the left and right lungs for each CT slice as well as the whole CT.
Finally, in order to assist radiologists in diagnosis of COVID-19 infected pneumonia using the DL model generated quantitative results or predictive scores, we also designed a stand-alone graphical user interface (GUI) as a “visual-aid” tool, which can be installed on any windows-based computers without the need for any specific programing language or library. Figure 5 illustrates the flow diagram of the developed DL model method and GUI tool.
2.4. Image preprocessing
After observing the output of the lung segmentation model, it was noted that in several cases with sever disease infection, small percentage of the lung may be missing from the segmentation as shown in Figure 5-a, which are typically represent disease infection area. In order to include or recover the missed lung area if the lung segmentation error is visually observed from our GUI, the user (i.e., radiologist) can call an image a specially-designed post-processing function that applies a unique conventional image processing algorithm inspired by the rolling ball algorithm [24] to automatically correct segmentation error. This algorithm starts with extracting the lung contours followed by several steps and morphological filters such as disk drawing, filling holes, median, and erosion operations. As shown in Figure 6, it can convert a jagged and rough lung boundary as shown in Figure 6-a to a smooth one which covers the previously missed lung area as shown in Figure 6-b. While it might lead to a small over-segmentation in some cases, the previously missed area contains very important infected lesions that can significantly affect the assessment of sever cases.
2.5. Evaluation
In order to objectively evaluate new DL model performance, the model was first tested “as is” using an independent dataset of 80 new test CT scans. Next, we asked two expert chest radiologists to retrospectively read and review these 80 sets of CT images. Each radiologist read and examined half of the CT scans (40 patients) and reported the patient infection spread in percentage based on their judgment of the percentage of infected lung volume. These subjectively assessed values are then collected and compared to the values generated by the DL model. It is important to note that in this new testing image dataset of 80 clinical cases, there are no manually annotated lung and disease infection area segmentation marks. Thus, no Dice coefficients can be computed, and we only compared the agreement between radiologists and DL model in predicting percentage of disease infected lung area (or volume) based on the predicted result of infection area ratio or spread scores between radiologists’ assessment and DL models.
Moreover, in order to test radiologists’ confidence level to accept DL-generated infection area segmentation results, we also show radiologists the DL segmentation results displayed on the developed GUI and ask them to rate acceptance level of the infection area segmentation of each CT slice with a score of 1 (poor segmentation) to 5 (excellent segmentation).
Last, we also ask radiologist to assign each patient to two groups of mild infection cases that are dominated with GGO and severe infection cases that have significant fraction of consolidation areas or blobs. We then compared agreement between DL-model generated case classification results and radiologists’ classification results. A corresponding confusion matrix was generated for the comparison and diagnostic accuracy computation.
3. Results
Figure 7 demonstrates several examples of the lung and infection segmentation results. The left column illustrates the raw CT images while the second and third columns illustrate the masks of the segmented lung and disease infection areas, respectively. In addition, Figure 8, shows the patch segmentation results of GGO and consolidation areas (or blobs).
Figure 9 shows a snapshot of the GUI window used in this study to obtain the subjective ratings from the radiologists. Using this GUI tool, radiologists can observe the raw CT image and the predicted segmentation side by side for better comparison. The radiologists can also rate accuracy or acceptance level of the DL-generated disease infection area segmentation on each slice using a rating scale from 1 to 5, as well as provide their overall assessment of lung infection spread. The Additionally, the lung segmentation is also visualized to make sure the predicted spread scores are reliable. If significant portion of lung is missing, the radiologist can call and run the function to correct the segmentation errors as described in Methods section of this paper.
The subjectively estimated disease infection ratio or spread scores of all 80 testing cases (patients) were collected from the two radiologists and compared to the quantitative prediction scores generated by the DL model. As shown in Figure 9, we observe following results.
- 1)
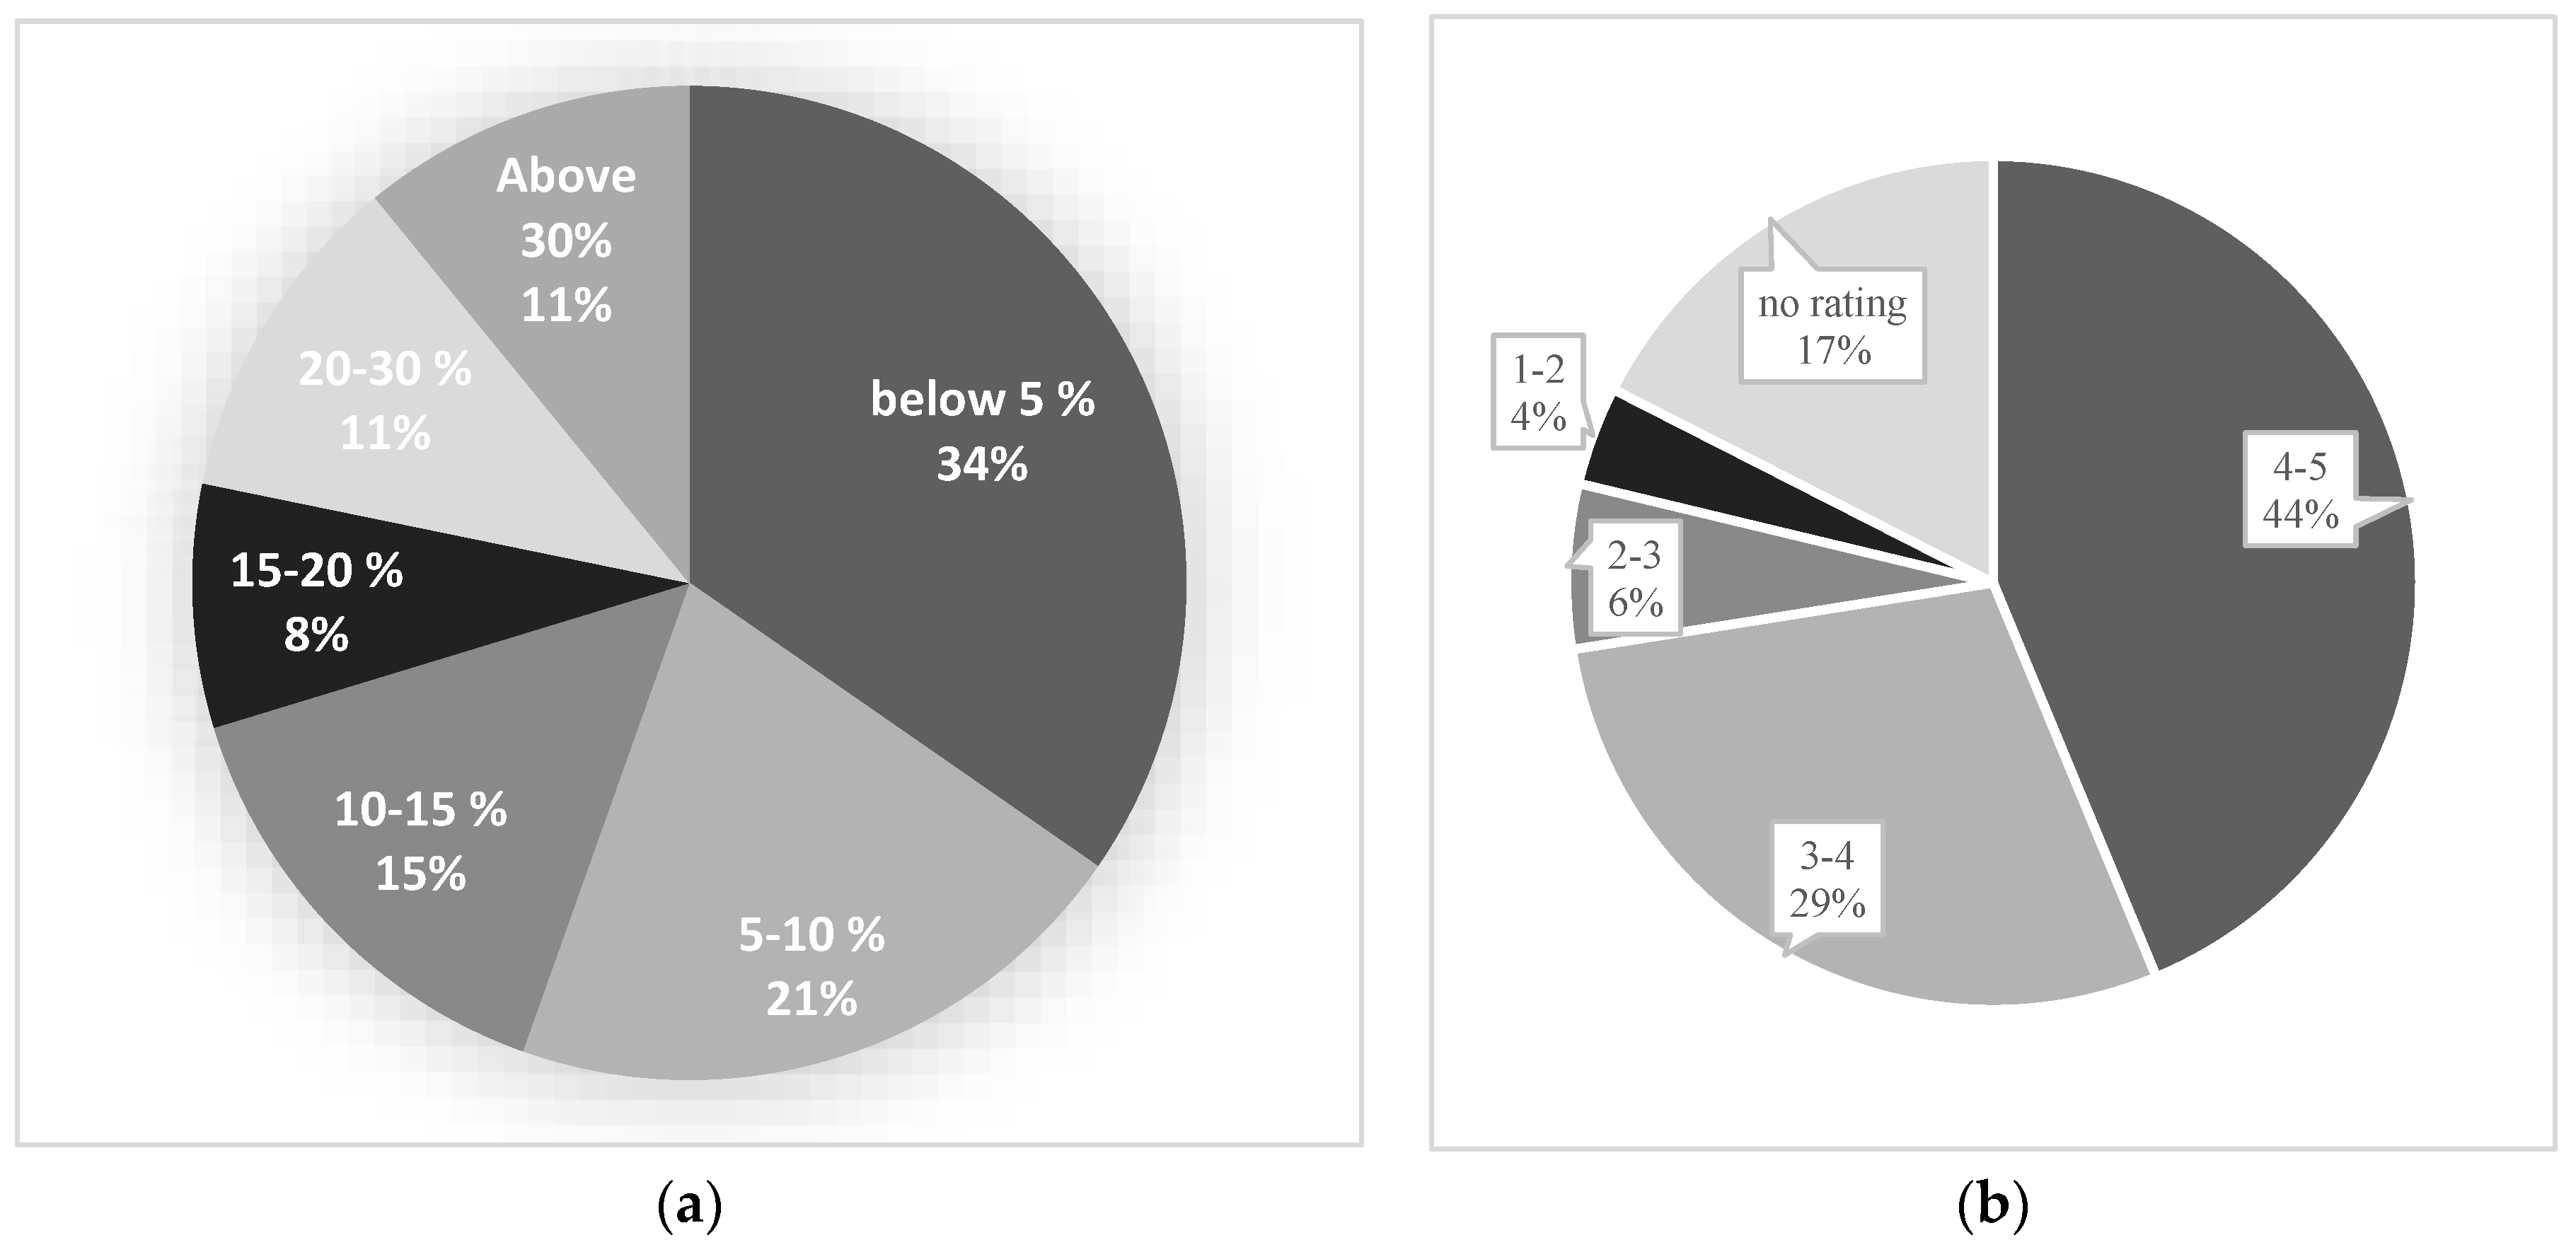
- The DL segmentation model predicts the spread score of 25 out of 80 testing cases with less than 5% difference from radiologists score (accuracy of +95%) (Figure 10-a).
- 2)
- Around 55% of testing cases are predicted with less than 10% difference (accuracy of +90%) and 90% of study cases showed less than 30% difference in spread score (accuracy of +70%) between radiologists and DL model generated results (Figure 10-a).
- 3)
- The averaged accuracy or acceptance ratings for all testing cases are calculated and presented in Figure 10-b. As shown, radiologists rated a score of 3 or higher among 73% of study cases indicating an acceptable prediction generated by DL model.
- 4)
- Additionally, the ratings of the testing cases with high spread score accuracy have been carefully analyzed to ensure that the high accuracy is not by chance. For example, among the testing cases with more than 95% spread accuracy, the radiologists rated an acceptance score higher than 3 over 78% cases, and among the testing cases with +90% accuracy, 84% of cases received an acceptance rating higher than 3 indicating the DL segmentation is acceptable and the spread score is reliable.
Figure 10.
Part (a) illustrates the difference between the spread score of radiologists and the predicted score by the model, and part (b) presents the average ratings of radiologists on the test dataset.
Figure 10.
Part (a) illustrates the difference between the spread score of radiologists and the predicted score by the model, and part (b) presents the average ratings of radiologists on the test dataset.
Moreover, to evaluate the performance of our DL model in identifying different stages of the COVID-19, the radiologists also put a label on the infected regions. Then, the results of our model and radiologists were compared together. Table 2 shows the confusion matrix of the staging performance, which reveals an 85% accuracy of the DL model in predicting or classifying disease infection severity or stage in this testing dataset.
3. Results
In the last 3 years, large number of studies of developing DL-based models of chest X-ray radiographs and/or CT images aiming to assist detection and classification of COVID-19 infected pneumonia have been reported and published in the literature. However, as reported in a comprehensive review study [11], no such a DL model was accepted in the clinical practice to effectively assist radiologists. In order to effectively address or solve this challenge and make DL model acceptable by radiologists, we conduct a new study using a different approach. This study has following unique characteristics and/or new observations.
First, we tested a new hypothesis to quantify percentages of COVID-19 infected volume and demonstrated a potential application of a novel DL model in the segmentation of the Covid-19 generated pneumonia infection in chest CT images. One of the innovations of this study is that we developed a combined five AR-UNet models for the infected region segmentation, and a novel lung segmentation correcting algorithm based on conventional image processing techniques to ensure all infected lesions are included in the prediction. Furthermore, we applied an FPN model to identify different stages of the COVID-19 infected area.
Second, since physicians including radiologists have low confidence to accept results generated by current “black box” type artificial intelligent (AI) or DL models, developing “explainable AI” tools [25] has been attracting broad research interest in medical imaging field. Thus, in this study we designed and implemented a graphic user interface (GUI) as a “visual-aid” tool that shows DL segmented disease infection areas. This stand-alone GUI allows radiologists to easily navigate through all generated outputs, rate each CT slice automatic segmentation, and submit their assessment of the percentage of lung volume with Covid-19 infection. Additionally, the radiologist can also order or call a supplementary image postprocessing algorithm to automatically correct the possibly identified segmentation errors. Our observer study experience and results demonstrate that using this interactive GUI or “visual-aid” supporting tool can provide radiologists the reasoning of DL model generated prediction results and thus increase their confidence to use DL model in their decision-making process of disease diagnosis.
Third, based on our interaction with the radiologists, we learnt that radiologists typically assign the patients into 3 classes of disease severity namely, mild, moderate and severe diseases based on the distribution or domination of GGO, pleural effusion and consolidation patterns. Thus, we believe that in order to increase its clinical utility, DL model should also have a function or capability to assign each testing case into one of these three classes. Since in three image datasets used in this study, very few pleural effusion patterns exist, we developed a patch segmentation based model to identify GGO and consolidation areas depicted on each CT image slice and then predict or classify the cases into either mild/moderate (A) and severe (C) classes as shown in Table 2. In this way, we enable to compare disease severity prediction results between the radiologists and DL model. In future study, we need to collect more study cases with more diversity. Thus, we can apply the same DL concept to train the model that enables to classify 3 classes of disease severity.
Fourth, we conducted and reported a unique observer preference and comparison experiment involving two chest radiologists in this study. Thus, unlike many previous studies that only reported Dice coefficients of agreement between DL model generated image segmentation results and manual segmentation results of one radiologist, which does not have real clinical impact due to the large inter-reader variability in image segmentation, we used a simple and more efficient or practical method to evaluate DL model segmentation results by asking radiologist to rate the acceptance level of DL model segmentation using a 5 rating scale. This practical approach has been approved quite effective in medical imaging field [26]. Our study generates quite encouraging results or observation of the higher agreement between the manual and automated COVID-19 infected region or volume segmentation, as well as the higher acceptance rate of radiologists to the DL-segmented results.
Last, we also recognize limitations of this study including the small image datasets and involving only two radiologists. Thus, this is a very preliminary study. The developed DL model along with the GUI tool needs to be further optimized and validated using large and diverse image cases. We also need to recruit more radiologists to evaluate model performance and potential clinical utility in the future studies. Despite the limitations, we believe that this is a unique and valid study. Although this study uses COVID-19 cases to segment and quantifies COVID-19 induced pneumonia regions or volume, the DL concept and model can also be easily adopted to segment and quantify other types of virus infected pneumonia or other interstitial lung diseases (ILD) in future research studies. If successful, such DL-based disease quantification models with the interactive visual-aid tools have the promising potential to provide clinicians (i.e., radiologists) useful supporting tools to improve the accuracy of lung disease diagnosis assessment in future clinical practice.
Author Contributions
Conceptualization, S.M. and A.A.; methodology, S.M, A.A..; validation, A.V. and D.G.; formal analysis, A.C., M.A., W.p., V.C, L.E., V.C., L.H., and K. Q.; writing—original draft preparation, S.M. and A.A.; writing—review and editing, B.Z., E.C. and J.J.; supervision, J.J., B.Z., A.G., Y.Q. and E.C.; funding acquisition, J.J. All authors have read and agreed to the published version of the manuscript.
Funding
“This research was funded by the Universidad Nacional de San Agustin (UNSA), Arequipa, Peru, through the Latin America Sustainability Initiative (LASI) and the OU-UNSA Global Change and Human Health Institute, grant number A21-0257-IN-UNSA” as well as supported in part by grants from the National Institutes of Health (NIH) of USA (R01CA218739 and P20GM135009).
Informed Consent Statement
This is a retrospective study of analyzing the existing images. The written informed consents from the patients are not required. This article also does not contain any studies with human participants or animals performed by any of the authors.
Acknowledgments
This work was funded by the Universidad Nacional de San Agustin (UNSA), Arequipa, Peru, through the Latin America Sustainability Initiative (LASI) and the OU-UNSA Global Change and Human Health Institute.
Conflicts of Interest
The authors declare no conflict of interest.
References
- Müller, N.L., et al., “Density mask”: an objective method to quantitate emphysema using computed tomography. Chest, 1988. 94(4): p. 782-787. [CrossRef]
- Karimi, R., et al., Lung density on high resolution computer tomography (HRCT) reflects degree of inflammation in smokers. Respiratory research, 2014. 15(1): p. 1-10. [CrossRef]
- Karimi, R., et al., Lung density on high resolution computer tomography (HRCT) reflects degree of inflammation in smokers. Respiratory research, 2014. 15(1): p. 1-10. [CrossRef]
- Heidari, M., et al., Improving the performance of CNN to predict the likelihood of COVID-19 using chest X-ray images with preprocessing algorithms. International journal of medical informatics, 2020. 144: p. 104284. [CrossRef]
- Fan, D.-P., et al., Inf-net: Automatic covid-19 lung infection segmentation from ct images. IEEE Transactions on Medical Imaging, 2020. 39(8): p. 2626-2637. [CrossRef]
- Wang, S., et al., A deep learning algorithm using CT images to screen for Corona Virus Disease (COVID-19). European radiology, 2021: p. 1-9. [CrossRef]
- Wu, Y.-H., et al., Jcs: An explainable covid-19 diagnosis system by joint classification and segmentation. IEEE Transactions on Image Processing, 2021. 30: p. 3113-3126. [CrossRef]
- Abbas, A., M.M. Abdelsamea, and M.M. Gaber, 4S-DT: Self-Supervised Super Sample Decomposition for Transfer Learning With Application to COVID-19 Detection. IEEE Transactions on Neural Networks and Learning Systems, 2021. [CrossRef]
- Hua, C. and S. Lee, Fast Deep Learning Computer-Aided Diagnosis against the Novel COVID-19 pandemic from Digital Chest X-ray Images. 2020.
- Ozturk, T., et al., Automated detection of COVID-19 cases using deep neural networks with X-ray images. Computers in biology and medicine, 2020. 121: p. 103792. [CrossRef]
- Roberts, M., et al., Common pitfalls and recommendations for using machine learning to detect and prognosticate for COVID-19 using chest radiographs and CT scans. Nature Machine Intelligence, 2021. 3(3): p. 199-217. [CrossRef]
- https://www.kaggle.com/andrewmvd/covid19-ct-scans.
- https://coronacases.org/.
- https://radiopaedia.org/.
- Simard, P.Y., D. Steinkraus, and J.C. Platt. Best practices for convolutional neural networks applied to visual document analysis. in Icdar. 2003.
- Buslaev, A., et al., Albumentations: fast and flexible image augmentations. Information, 2020. 11(2): p. 125. [CrossRef]
- Ronneberger, O., P. Fischer, and T. Brox. U-net: Convolutional networks for biomedical image segmentation. in International Conference on Medical image computing and computer-assisted intervention. 2015. Springer.
- Lin, T.-Y., et al. Feature pyramid networks for object detection. in Proceedings of the IEEE conference on computer vision and pattern recognition. 2017.
- Oktay, O., et al., Attention u-net: Learning where to look for the pancreas. arXiv preprint arXiv:1804.03999, 2018. [CrossRef]
- Yakubovskiy, P., Segmentation models. GitHub repository, 2019.
- Salehi, S.S.M., D. Erdogmus, and A. Gholipour. Tversky loss function for image segmentation using 3D fully convolutional deep networks. in International workshop on machine learning in medical imaging. 2017. Springer.
- Li, C., et al. Attention Residual U-Net for Building Segmentation in Aerial Images. in 2021 IEEE International Geoscience and Remote Sensing Symposium IGARSS. 2021. IEEE. [CrossRef]
- Wang, Q., et al., A comprehensive survey of loss functions in machine learning. Annals of Data Science, 2022. 9(2): p. 187-212. [CrossRef]
- Park, S.C., et al., Computer-aided detection of early interstitial lung diseases using low-dose CT images. Physics in Medicine & Biology, 2011. 56(4): p. 1139. [CrossRef]
- Arrieta, A.B., et al., Explainable Artificial Intelligence (XAI): Concepts, taxonomies, opportunities and challenges toward responsible AI. Information fusion, 2020. 58: p. 82-115. [CrossRef]
- Pu, J., et al., A computational geometry approach to automated pulmonary fissure segmentation in CT examinations. IEEE transactions on medical imaging, 2008. 28(5): p. 710-719. [CrossRef]
Figure 1.
An example of applying an augmentation method. (a) The original image (b) After applying an augmentation method.
Figure 1.
An example of applying an augmentation method. (a) The original image (b) After applying an augmentation method.
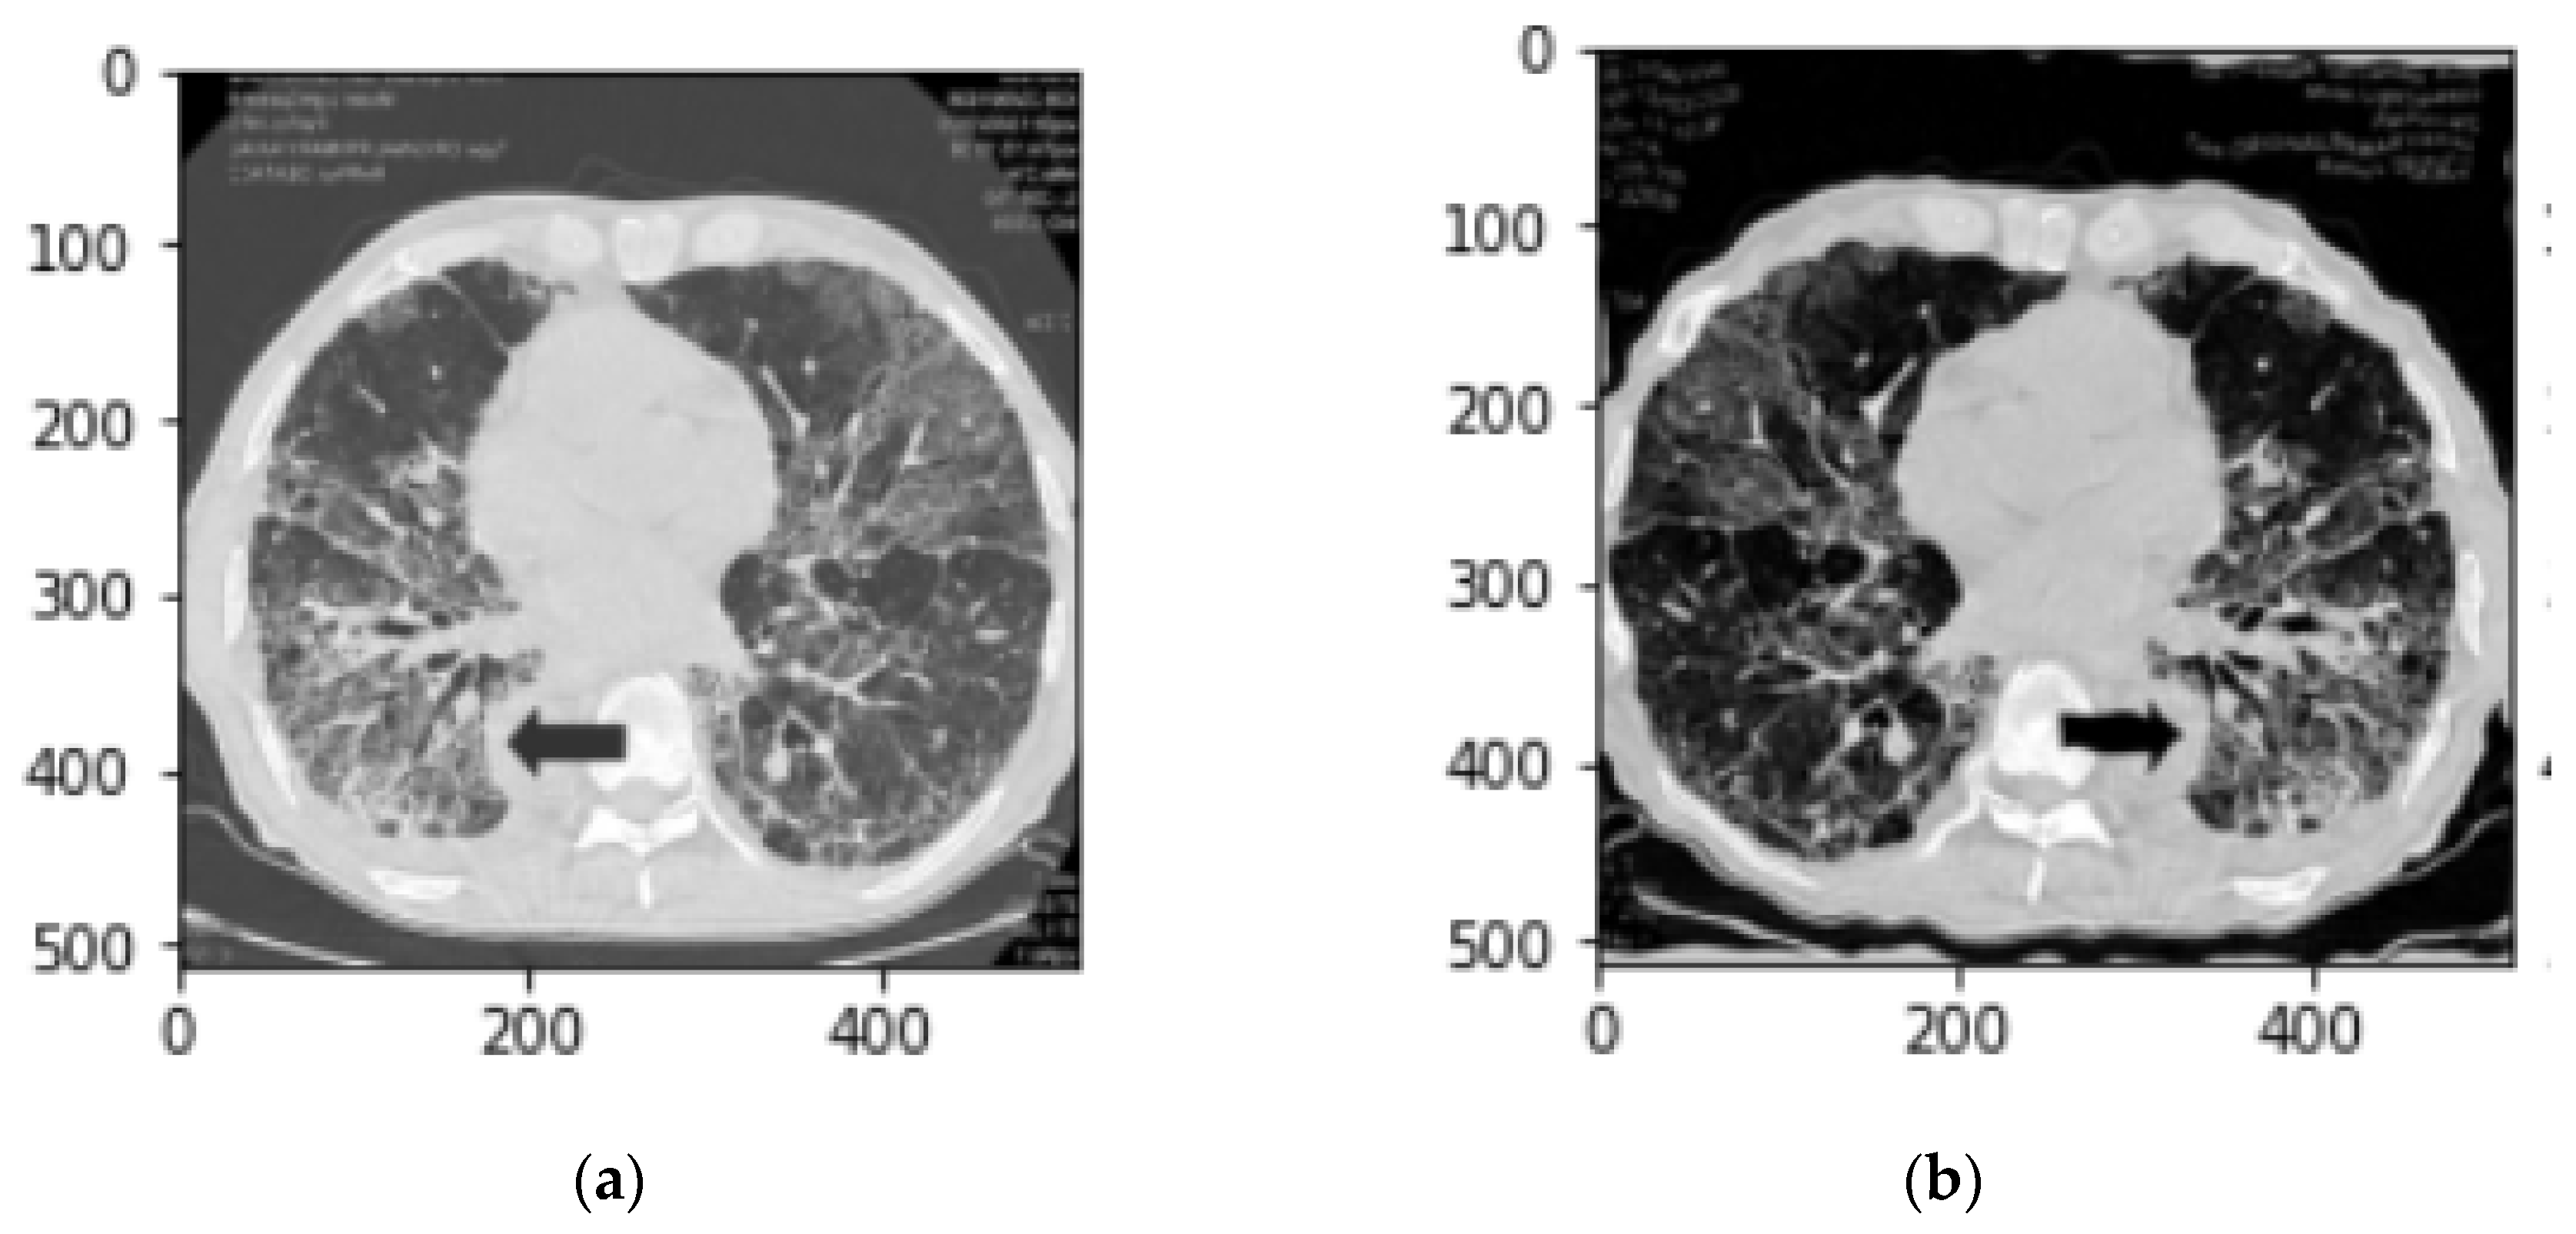
Figure 2.
(a) Before applying a CLAHE filter (b) After applying a CLAHE filter.
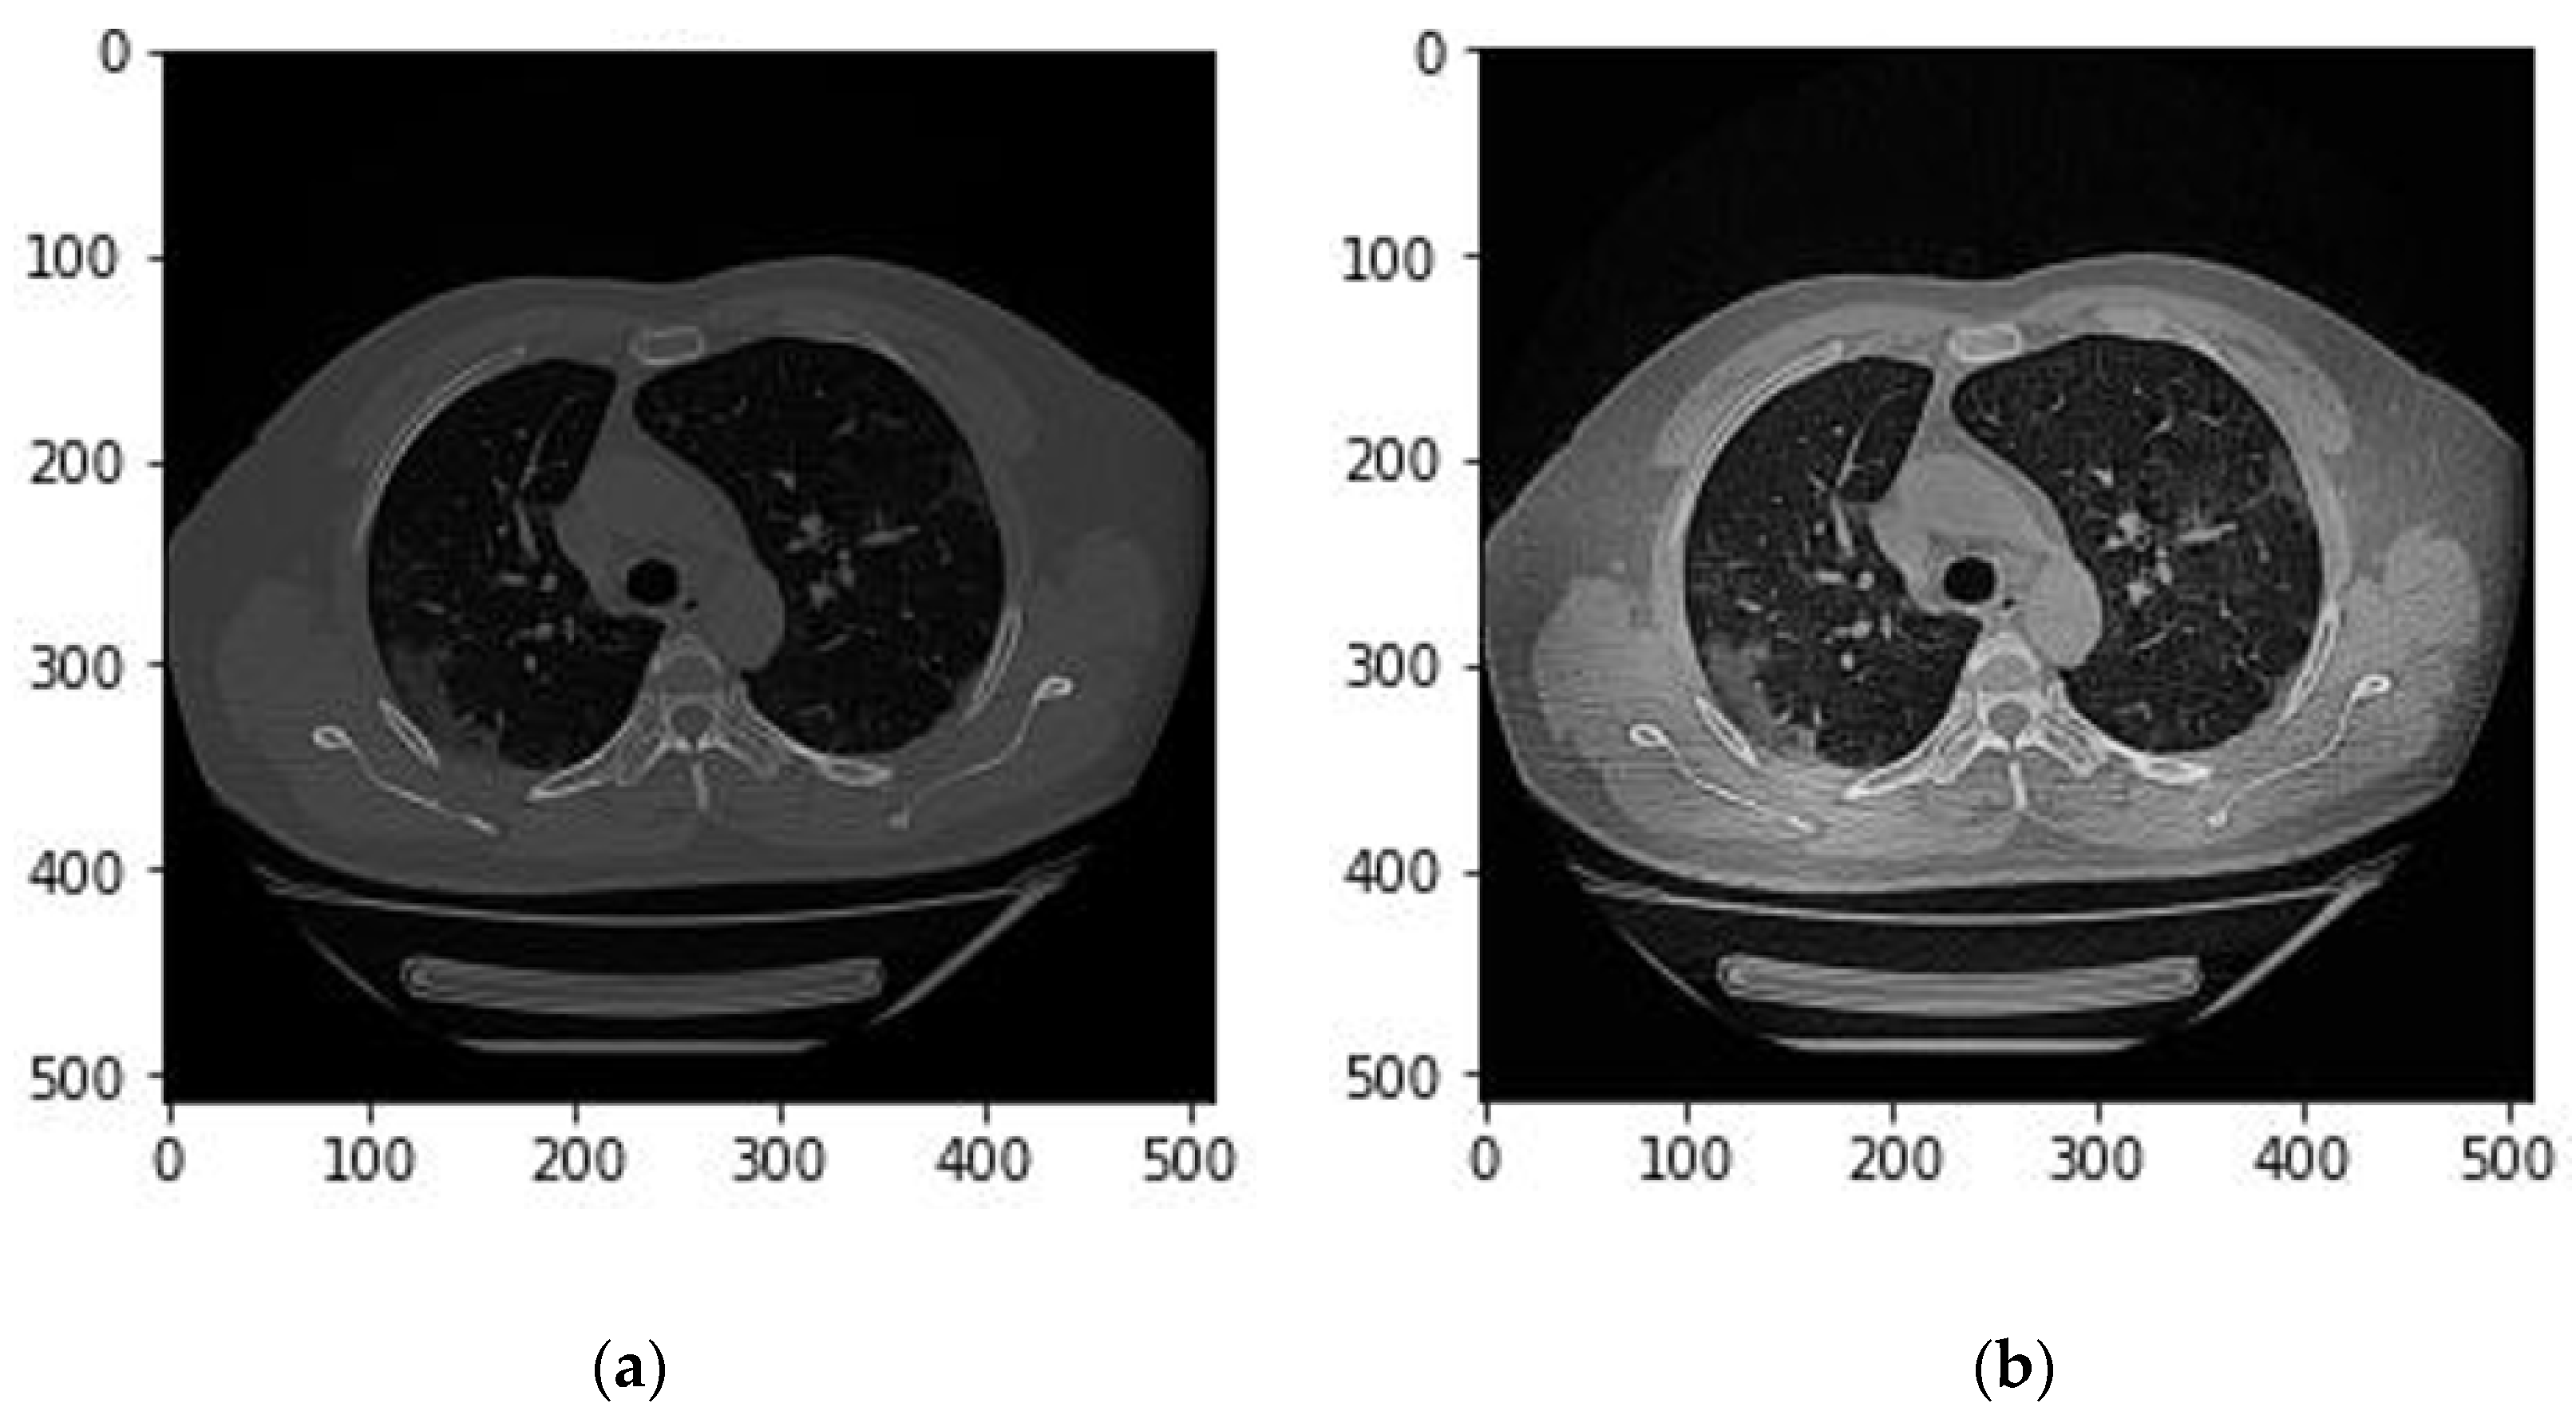
Figure 3.
An example of the lung segmentation. (a) Raw CT image; (b) CT image and lung mask.
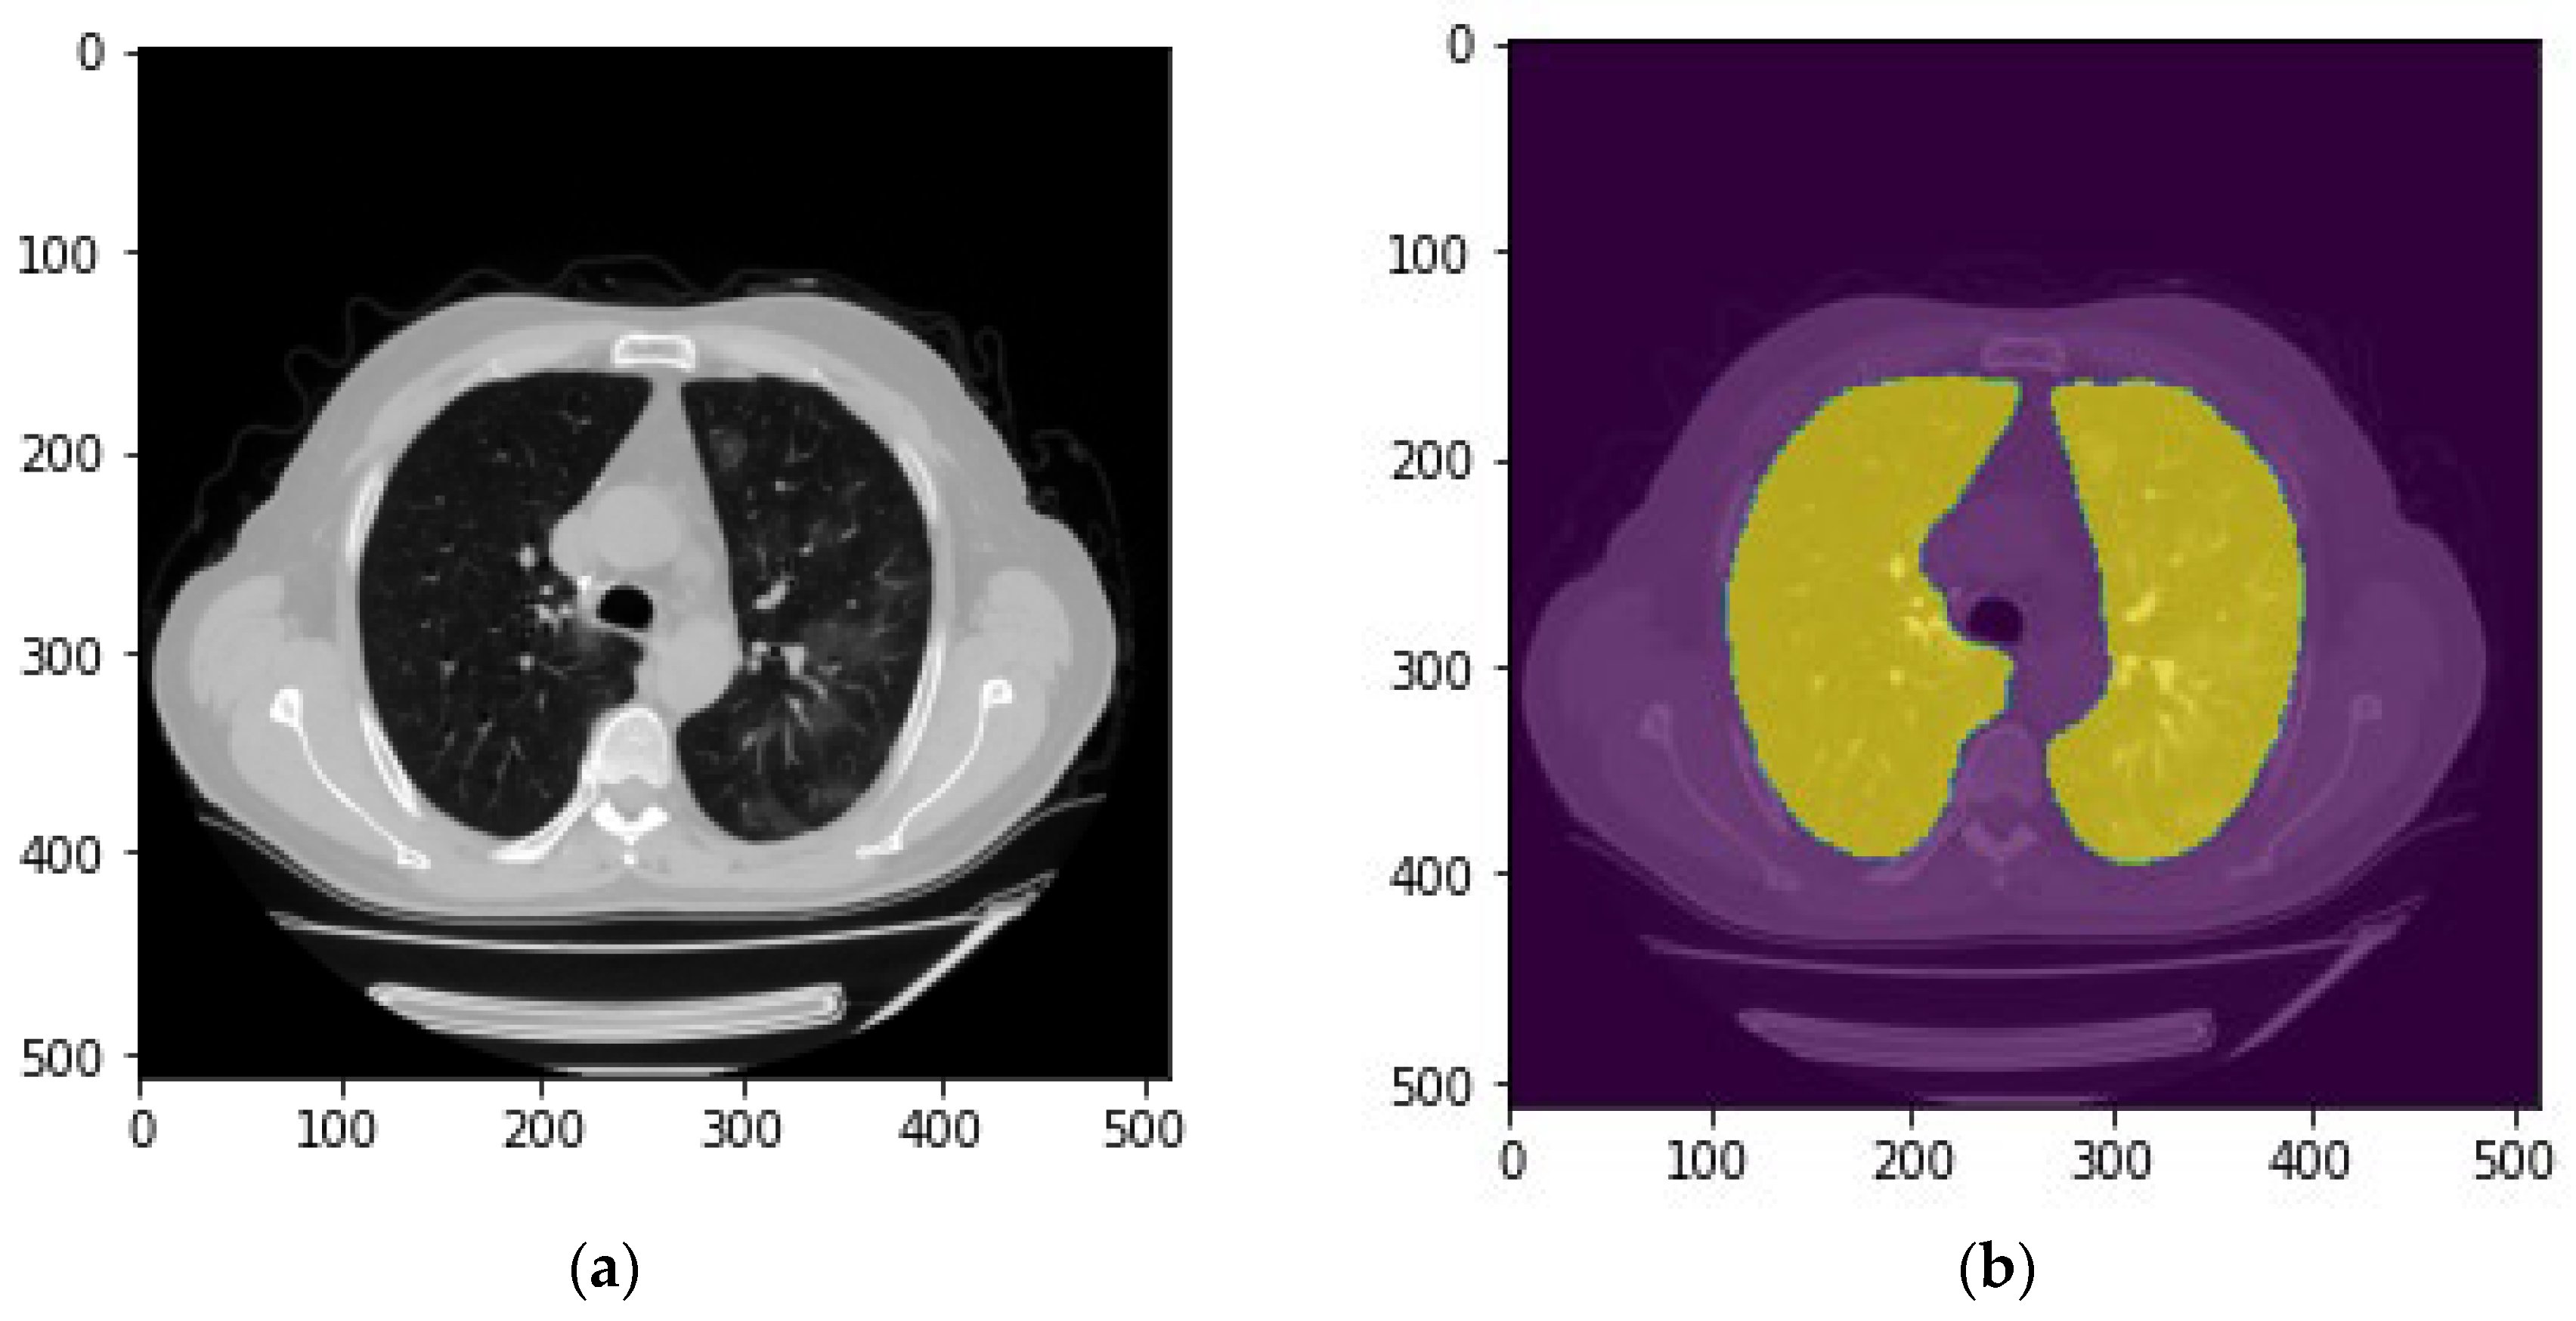
Figure 4.
Overview of deep learning architecture for the patch segmentation model.
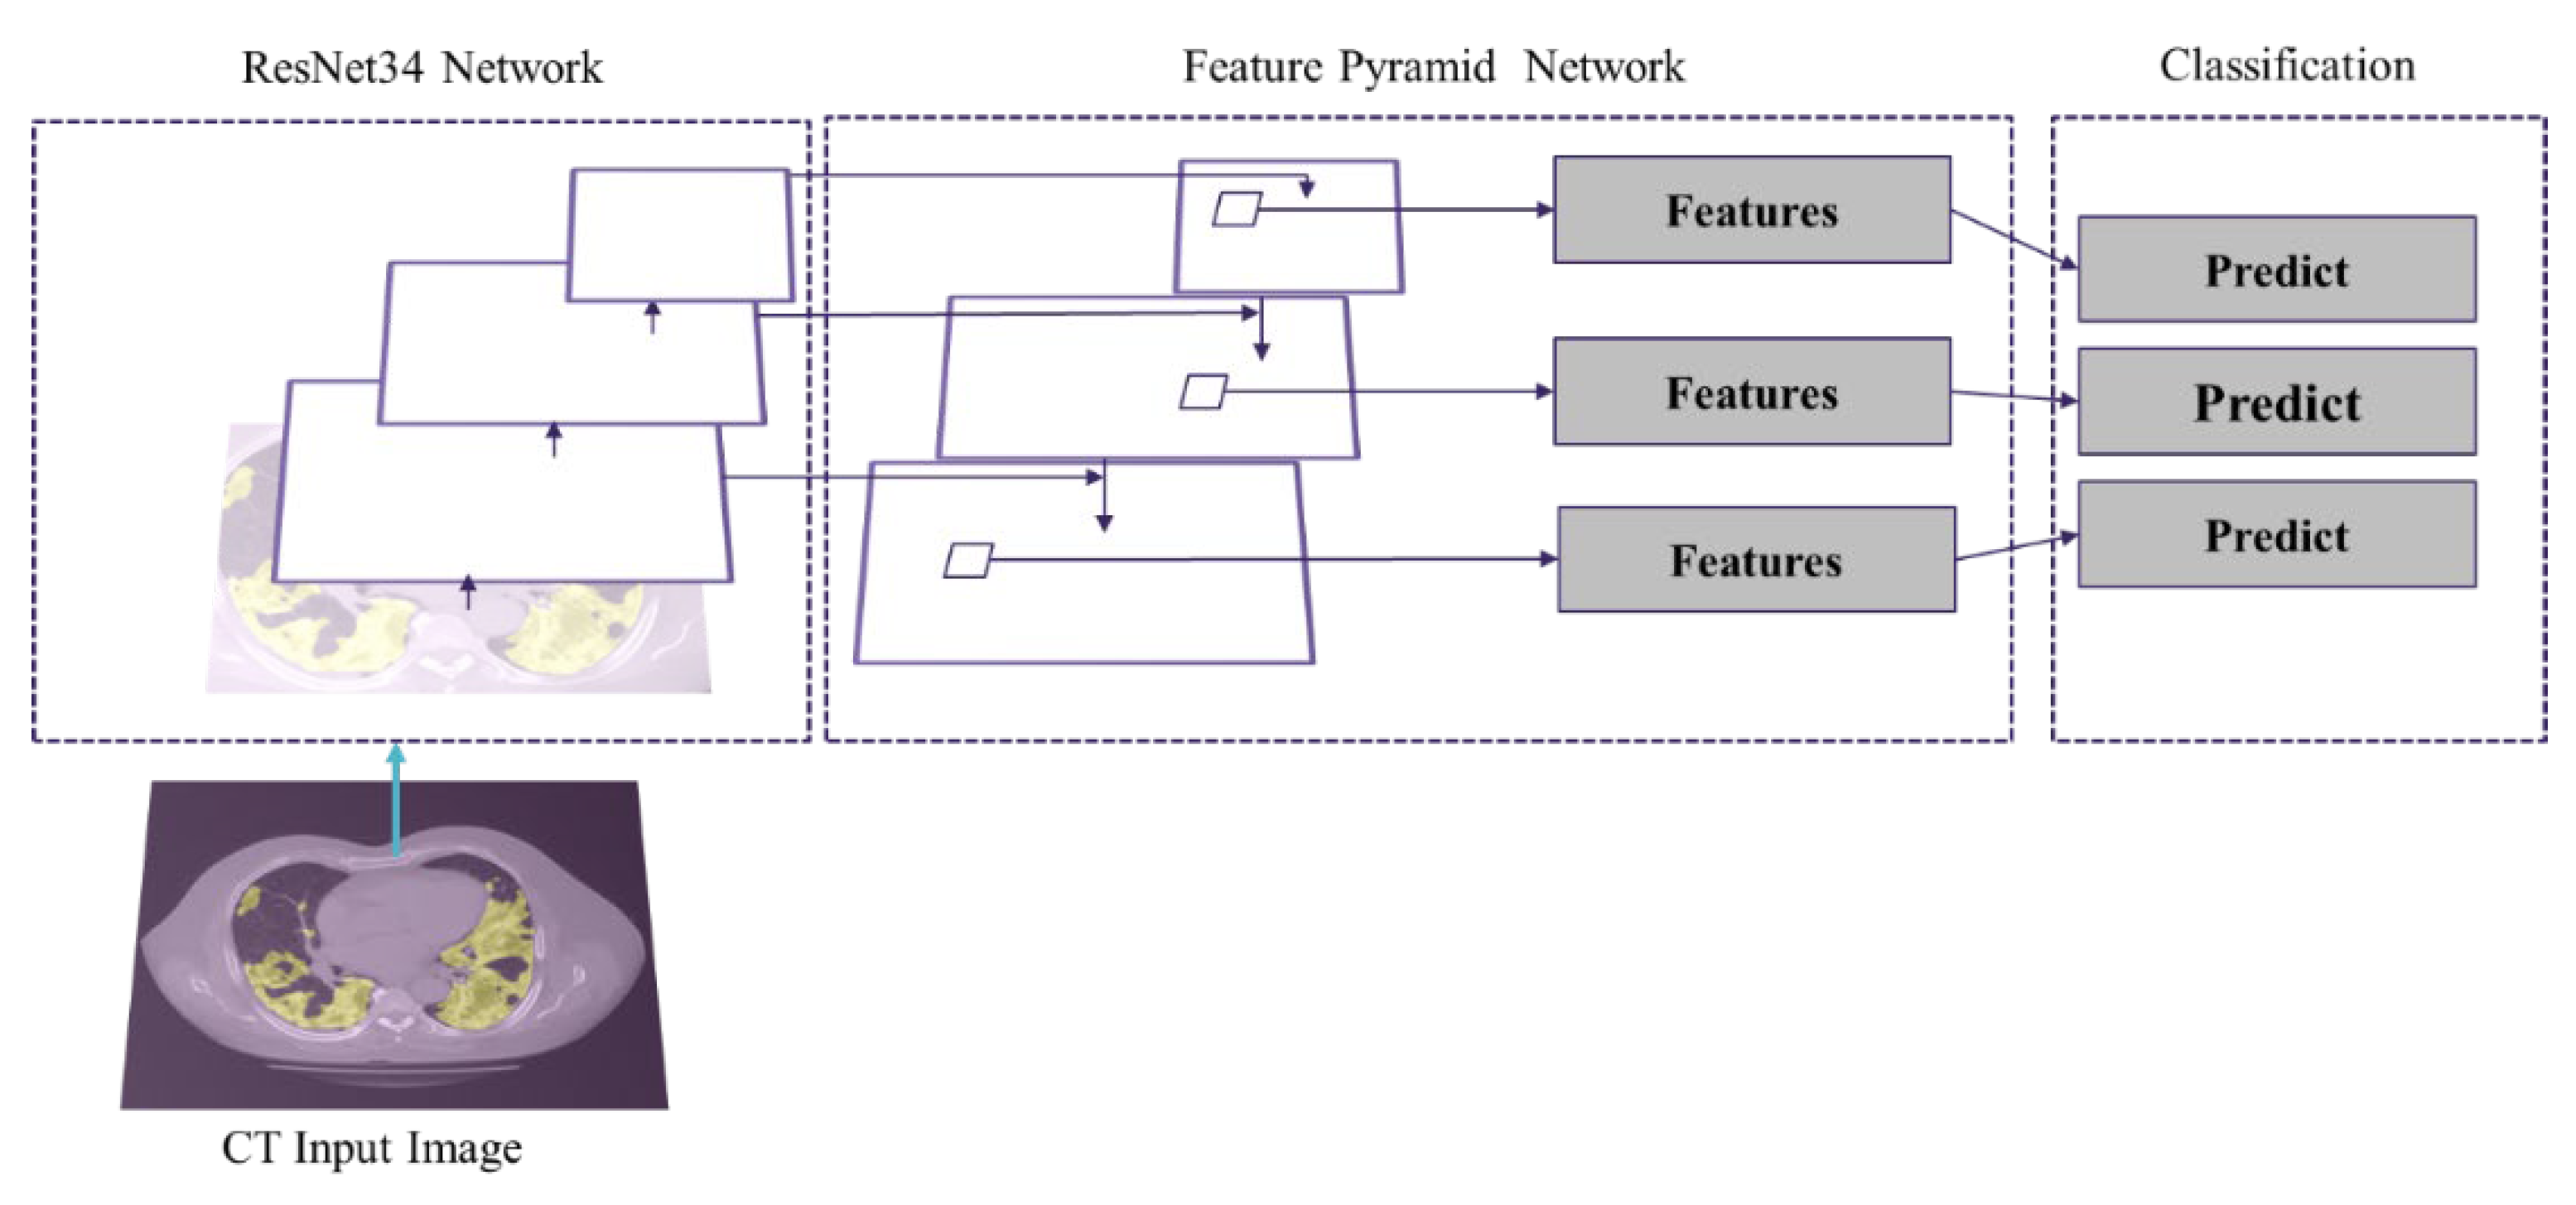
Figure 5.
Image post-processing and correction.
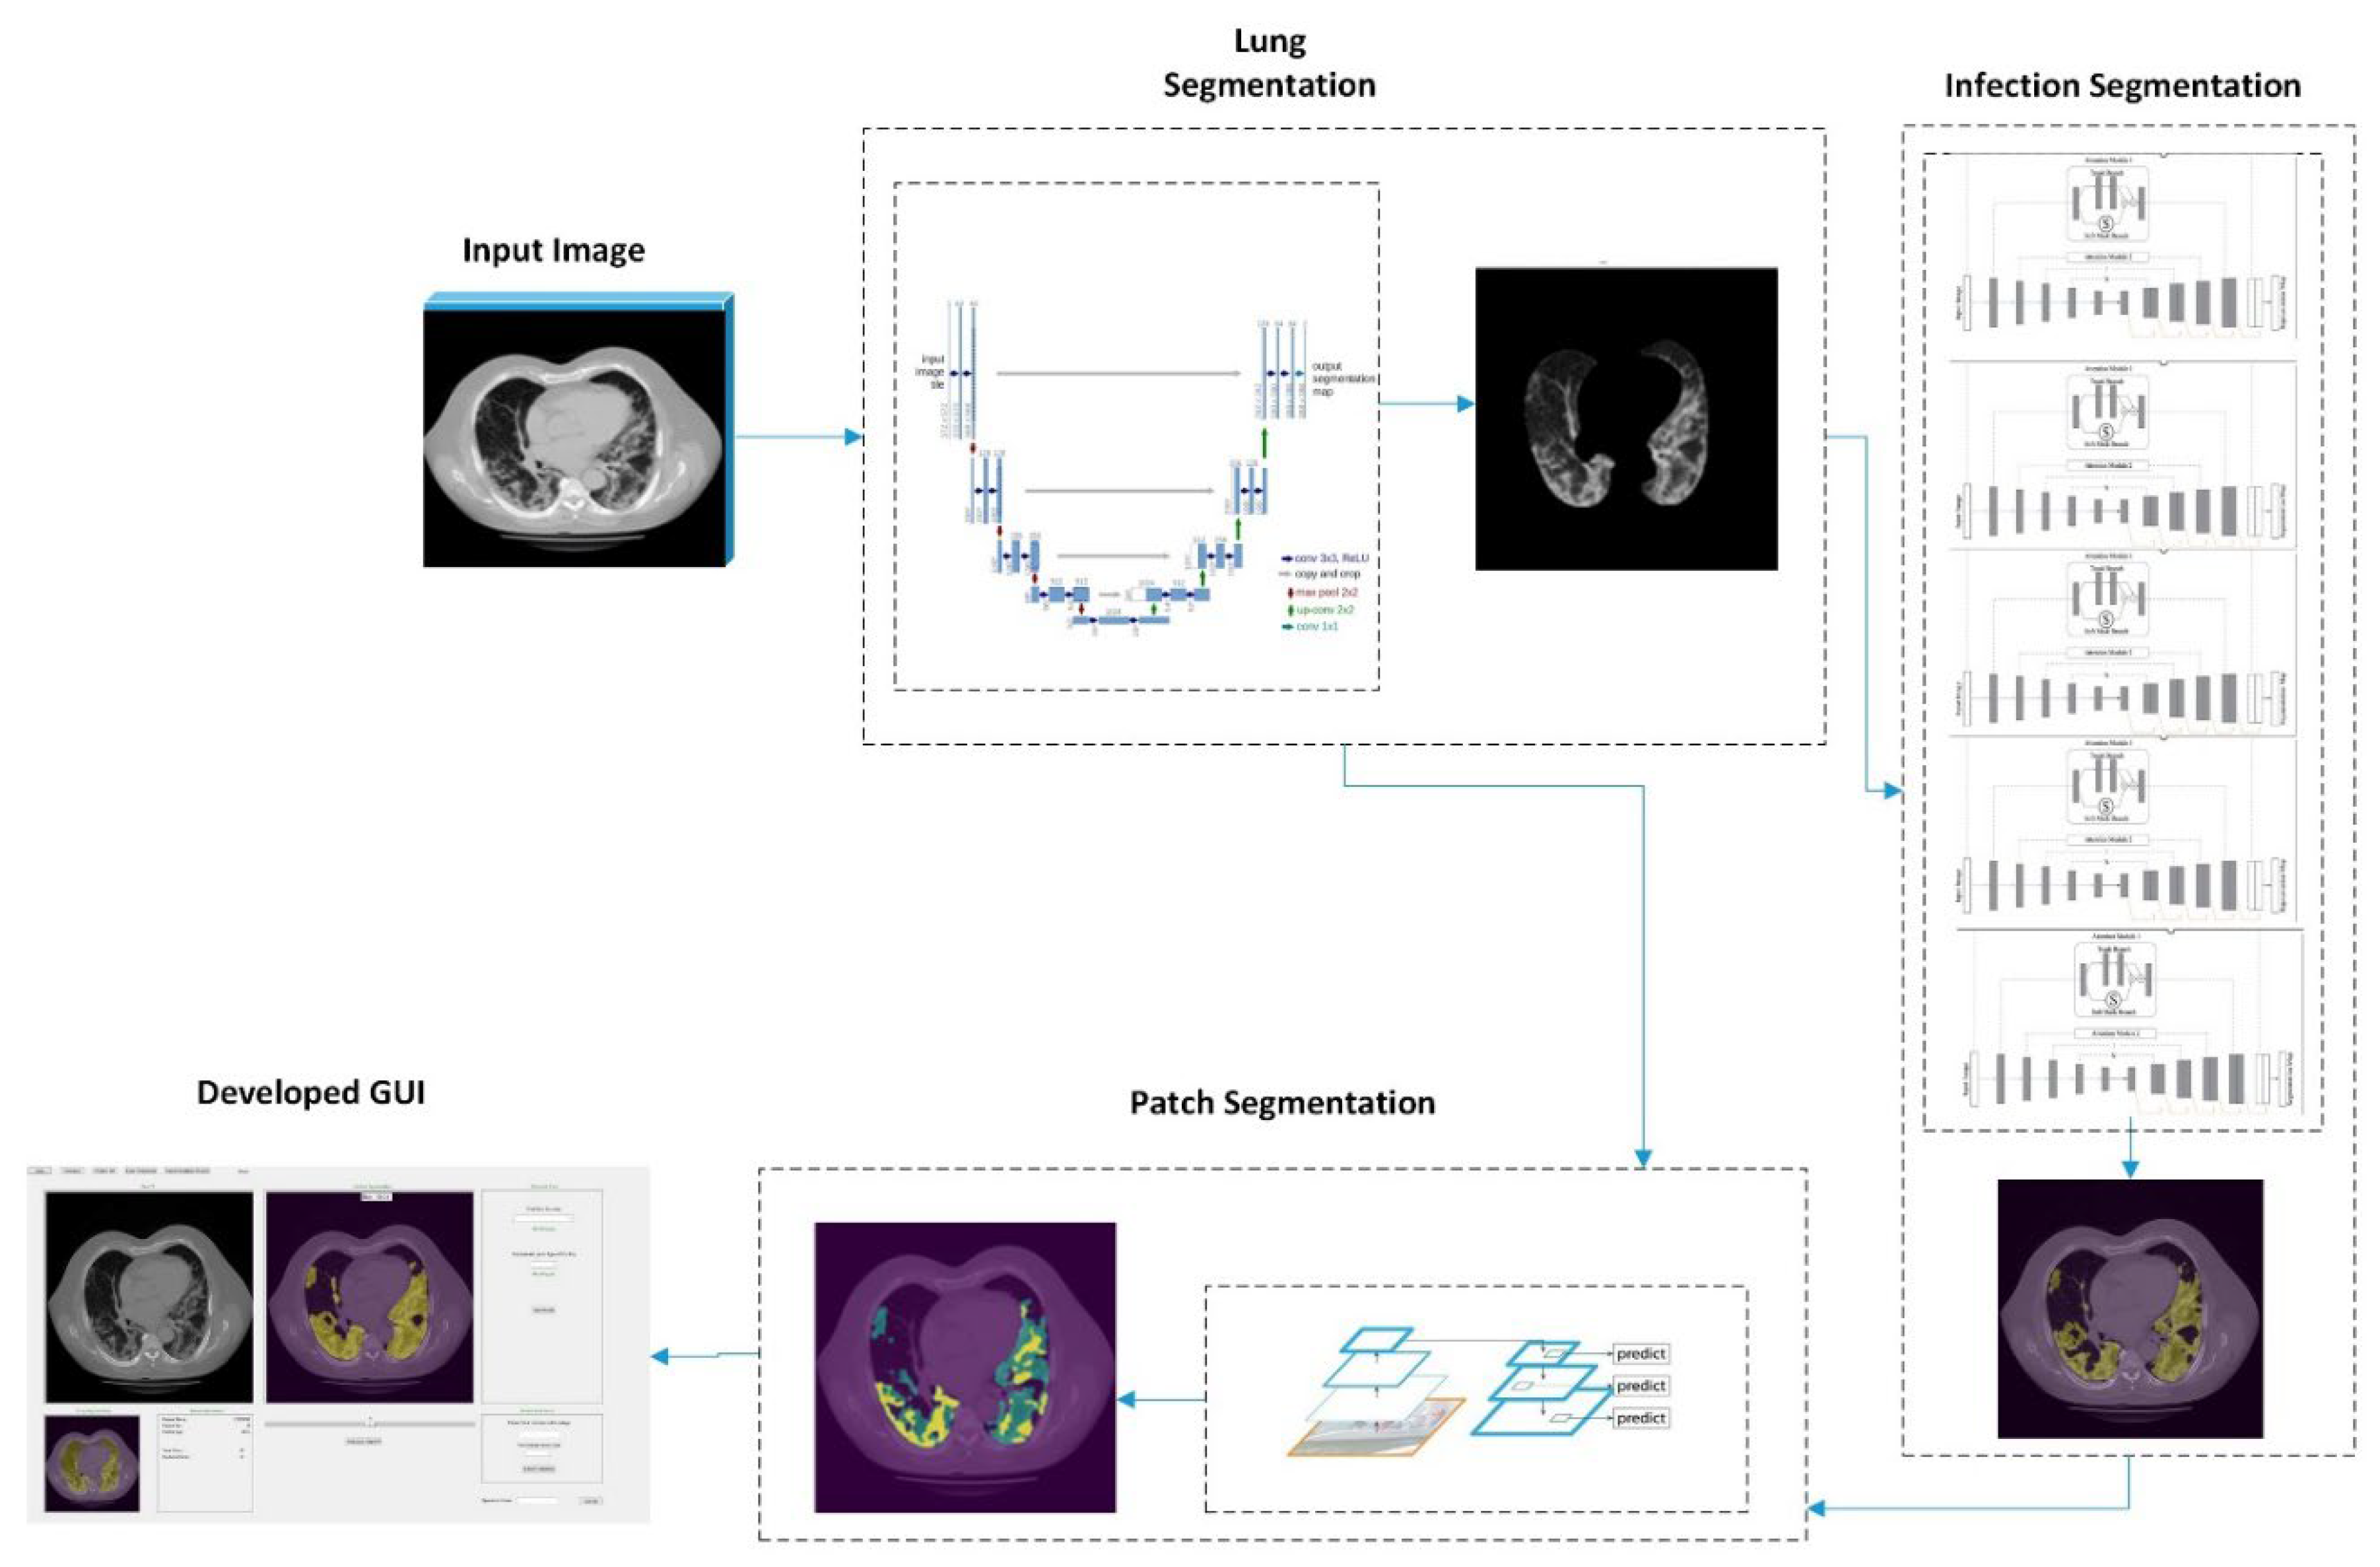
Figure 6.
(a) lung segmentation mask (b) post-processing lung segmentation.
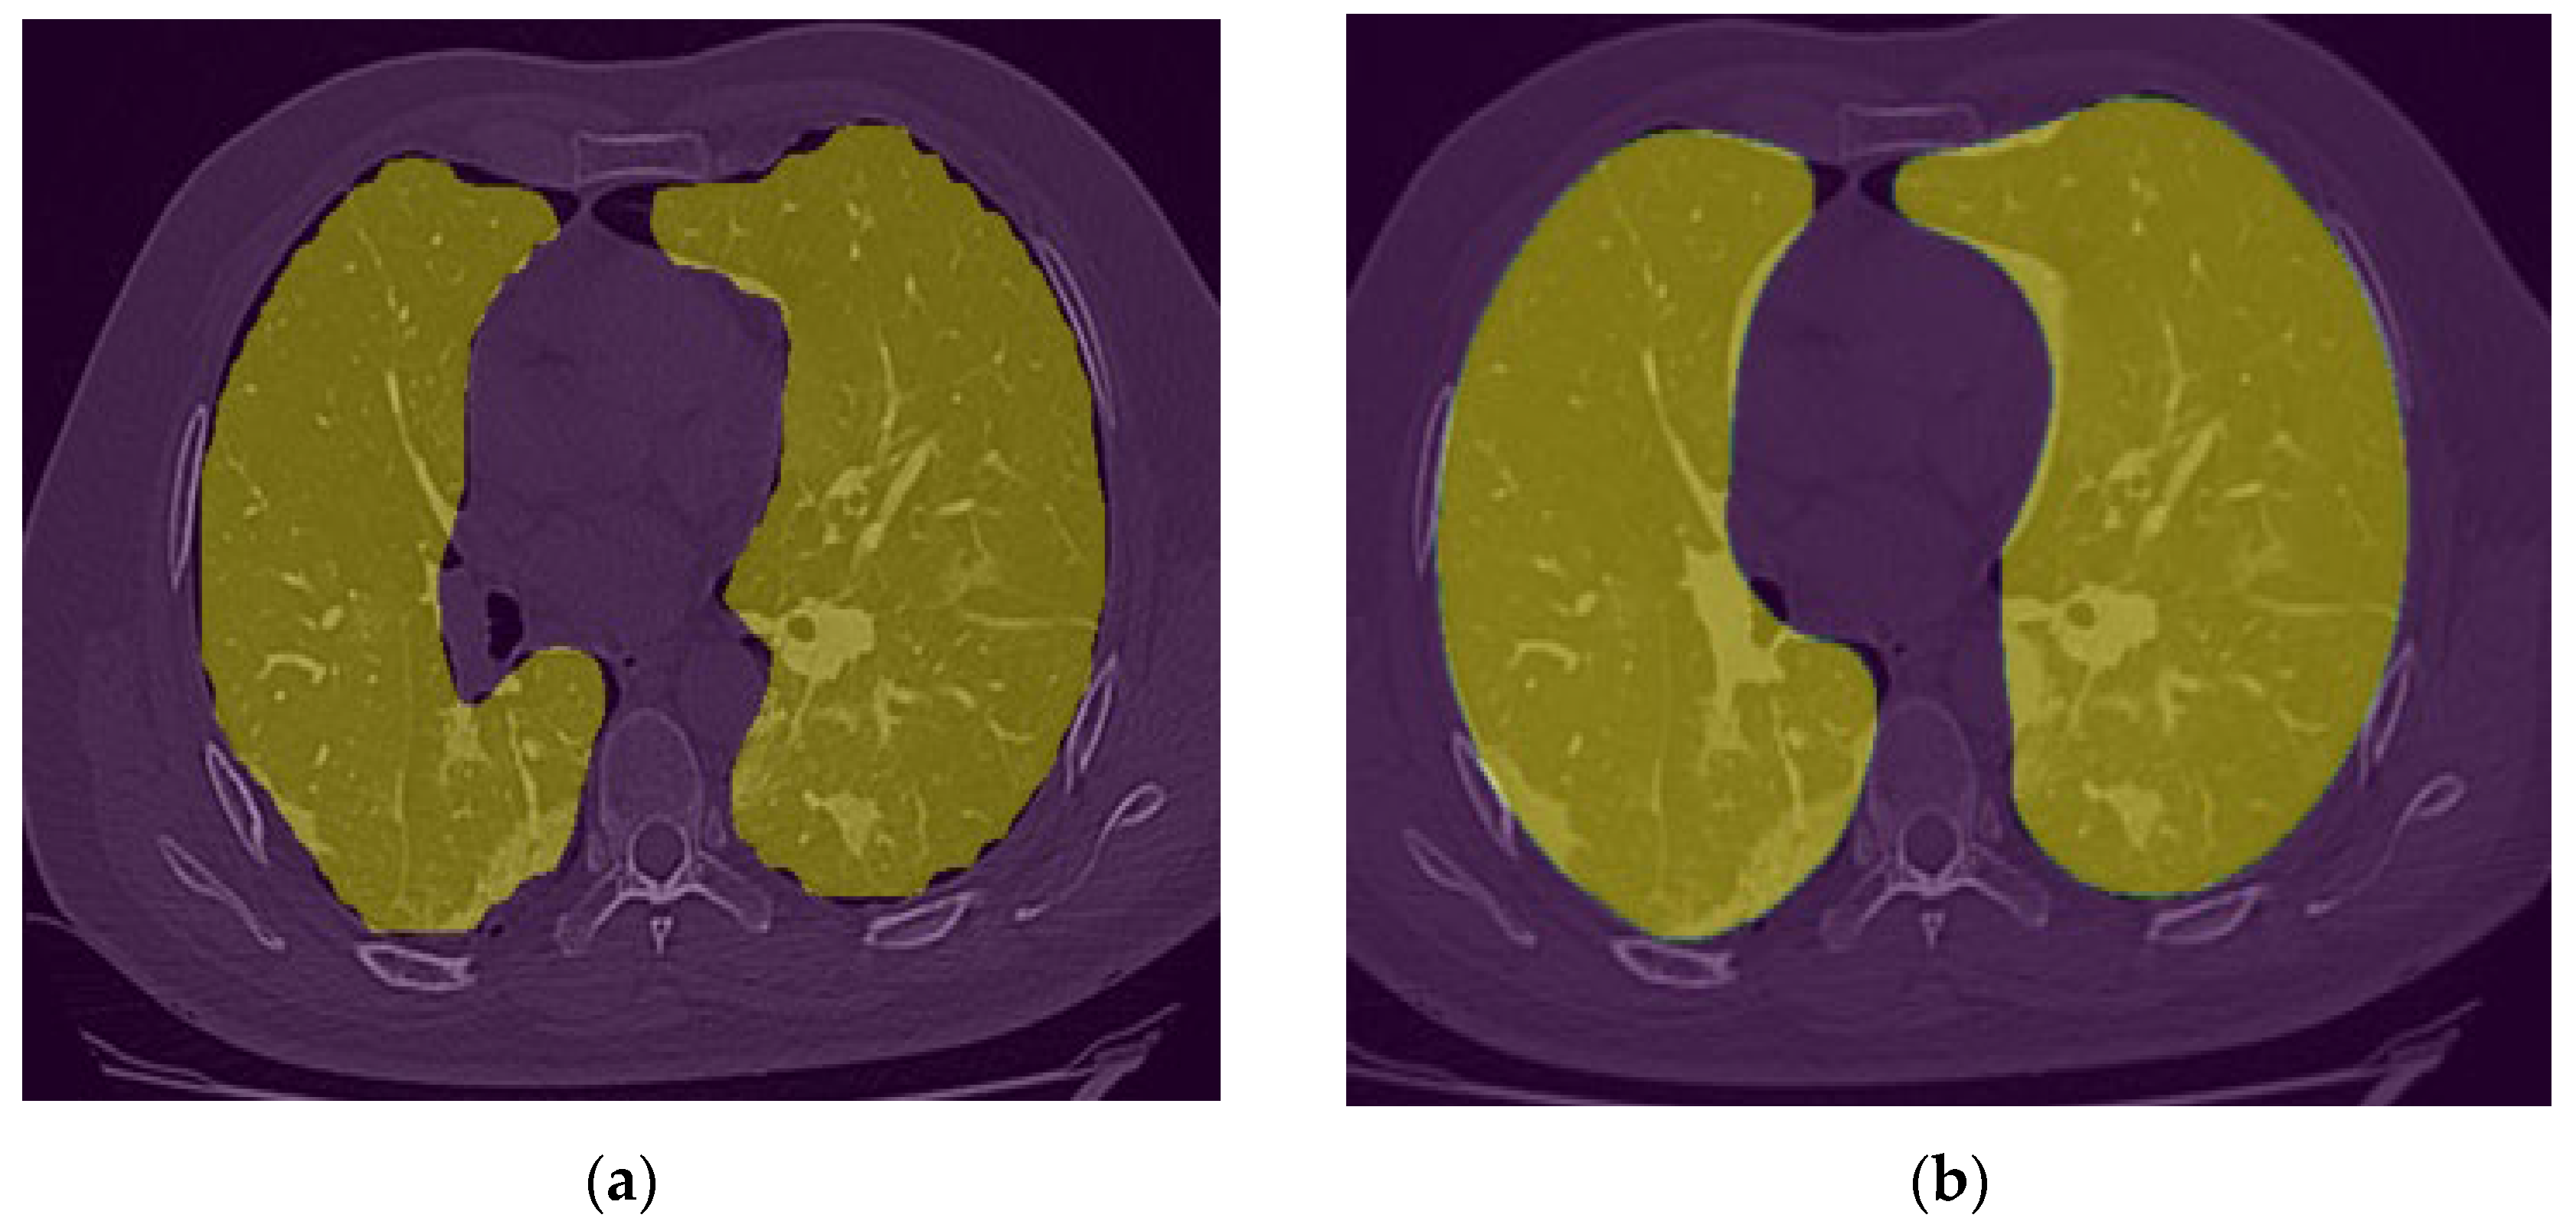
Figure 7.
(a) Raw CT image (b) Lung mask and (c) Infection Segmentation.
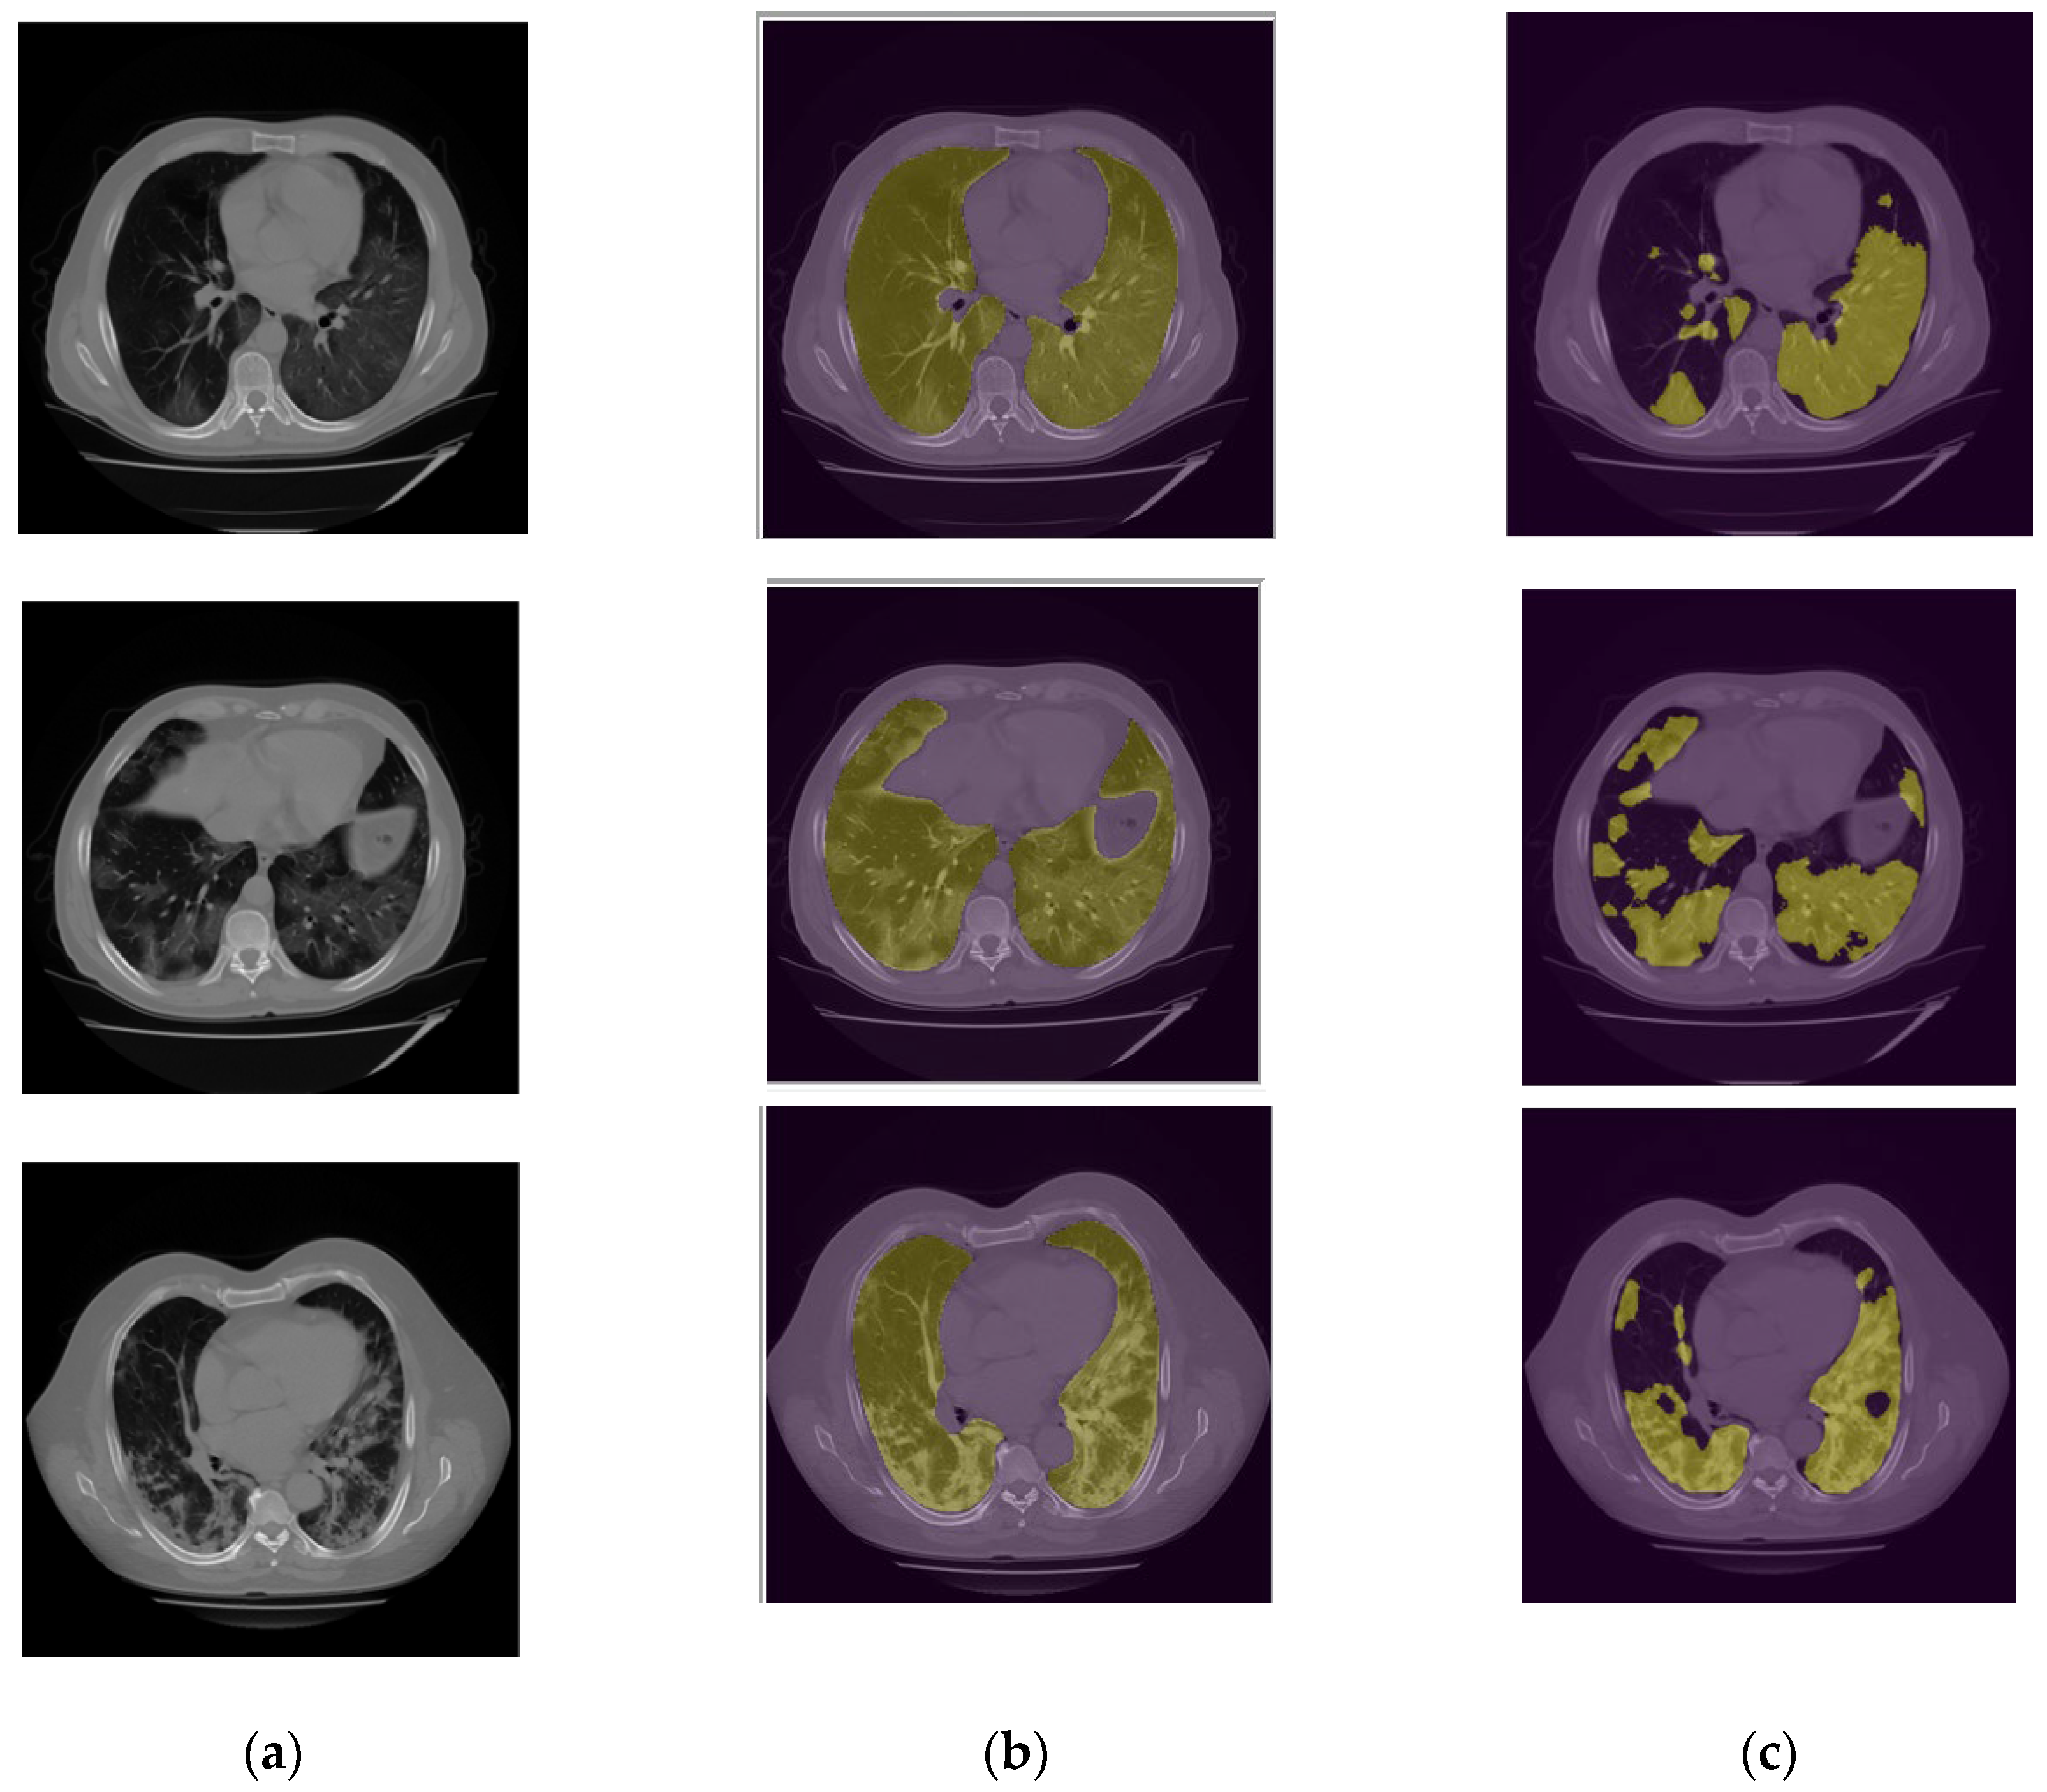
Figure 8.
Patch segmentation results. The green area represents the GGO and Crazy Paved pattern. The yellow area shows the Consolidation area.
Figure 8.
Patch segmentation results. The green area represents the GGO and Crazy Paved pattern. The yellow area shows the Consolidation area.
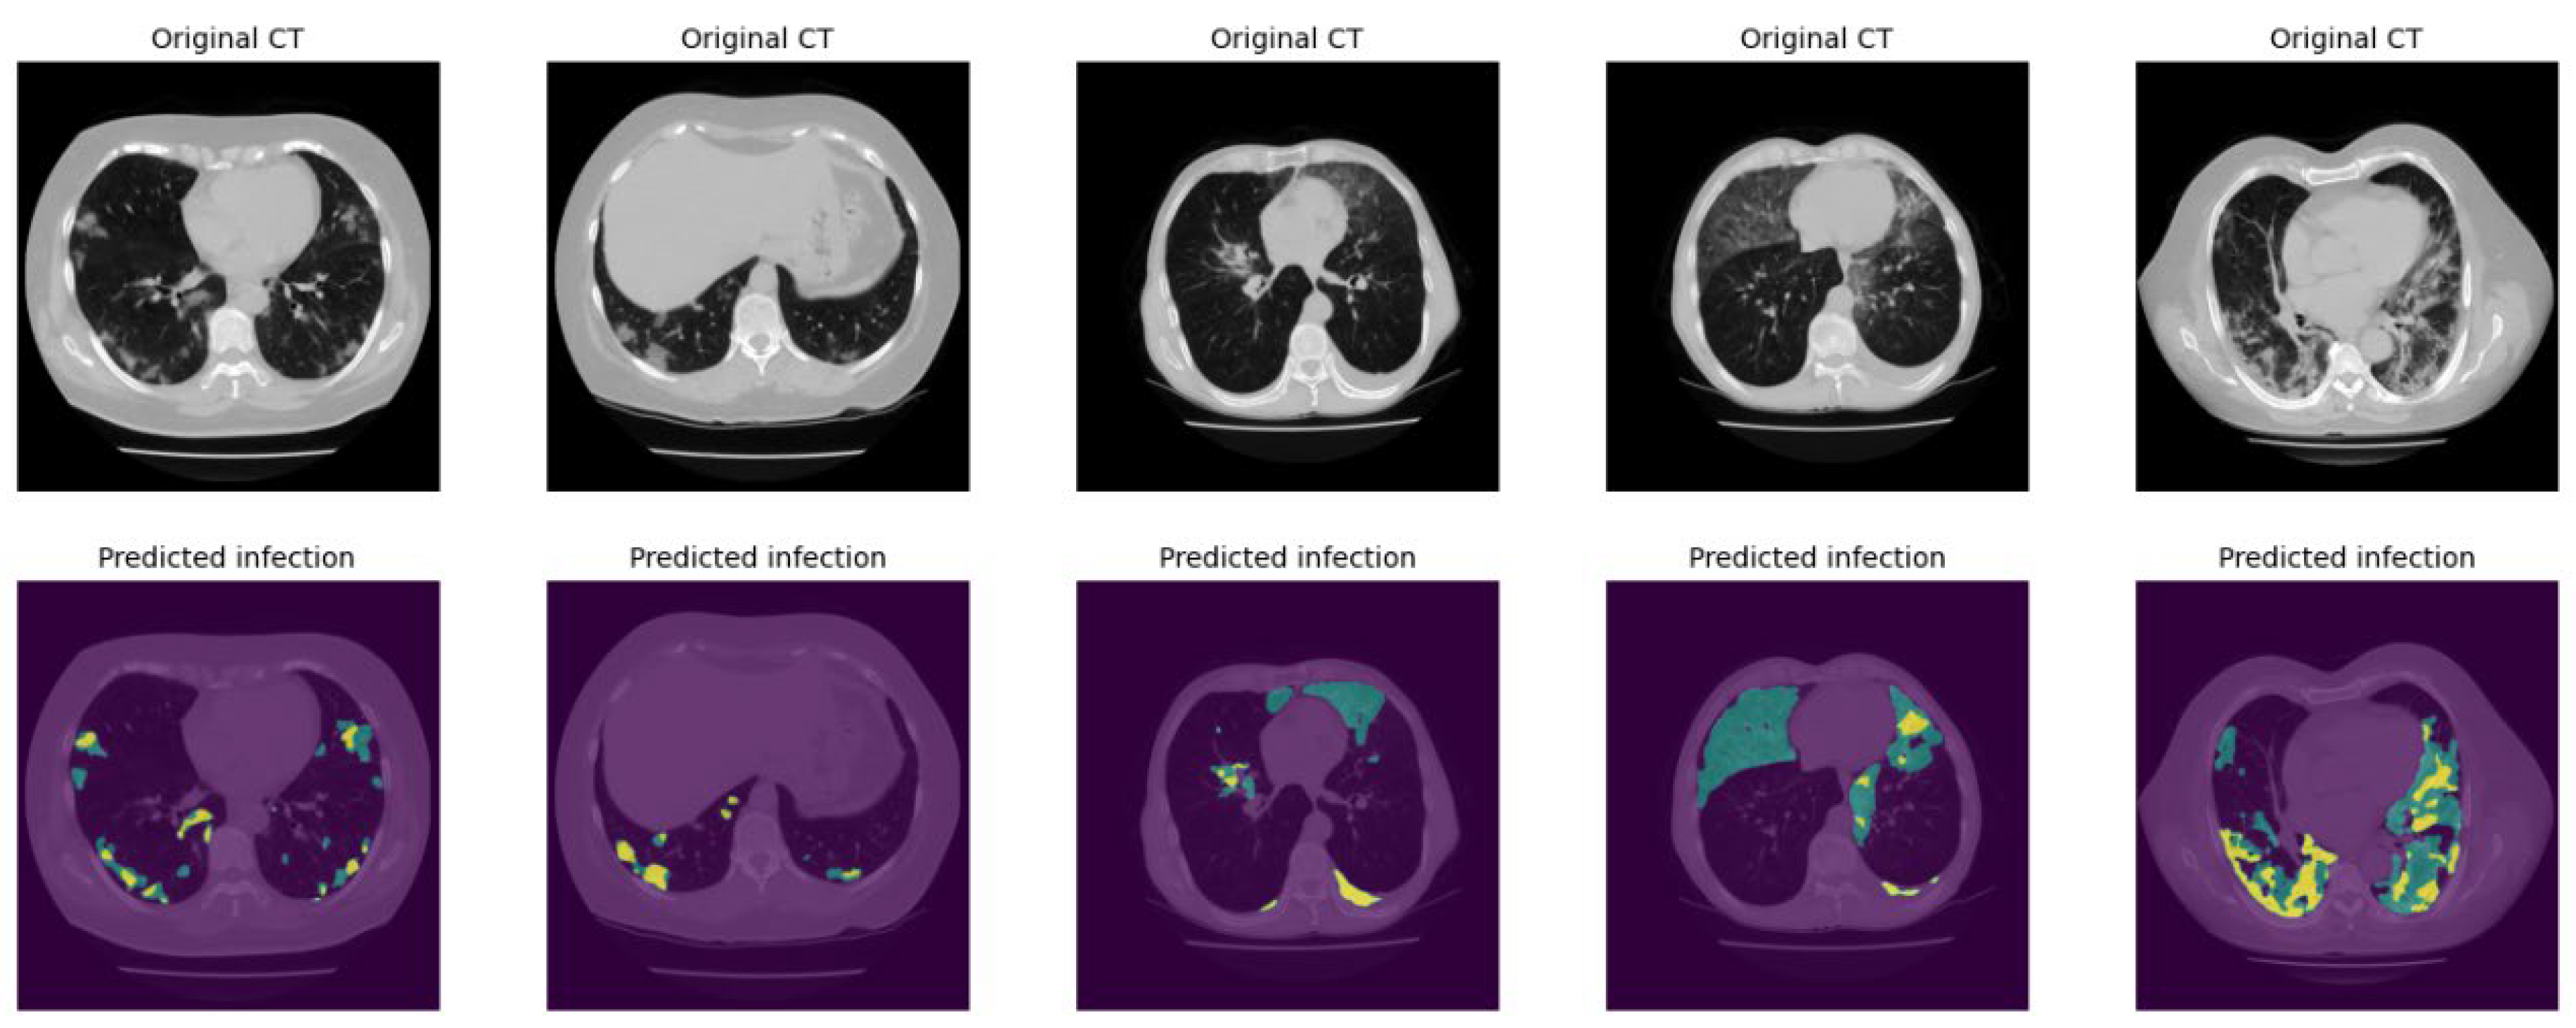
Figure 9.
Illustration of the developed GUI for lung and COVID-19 infection segmentation.
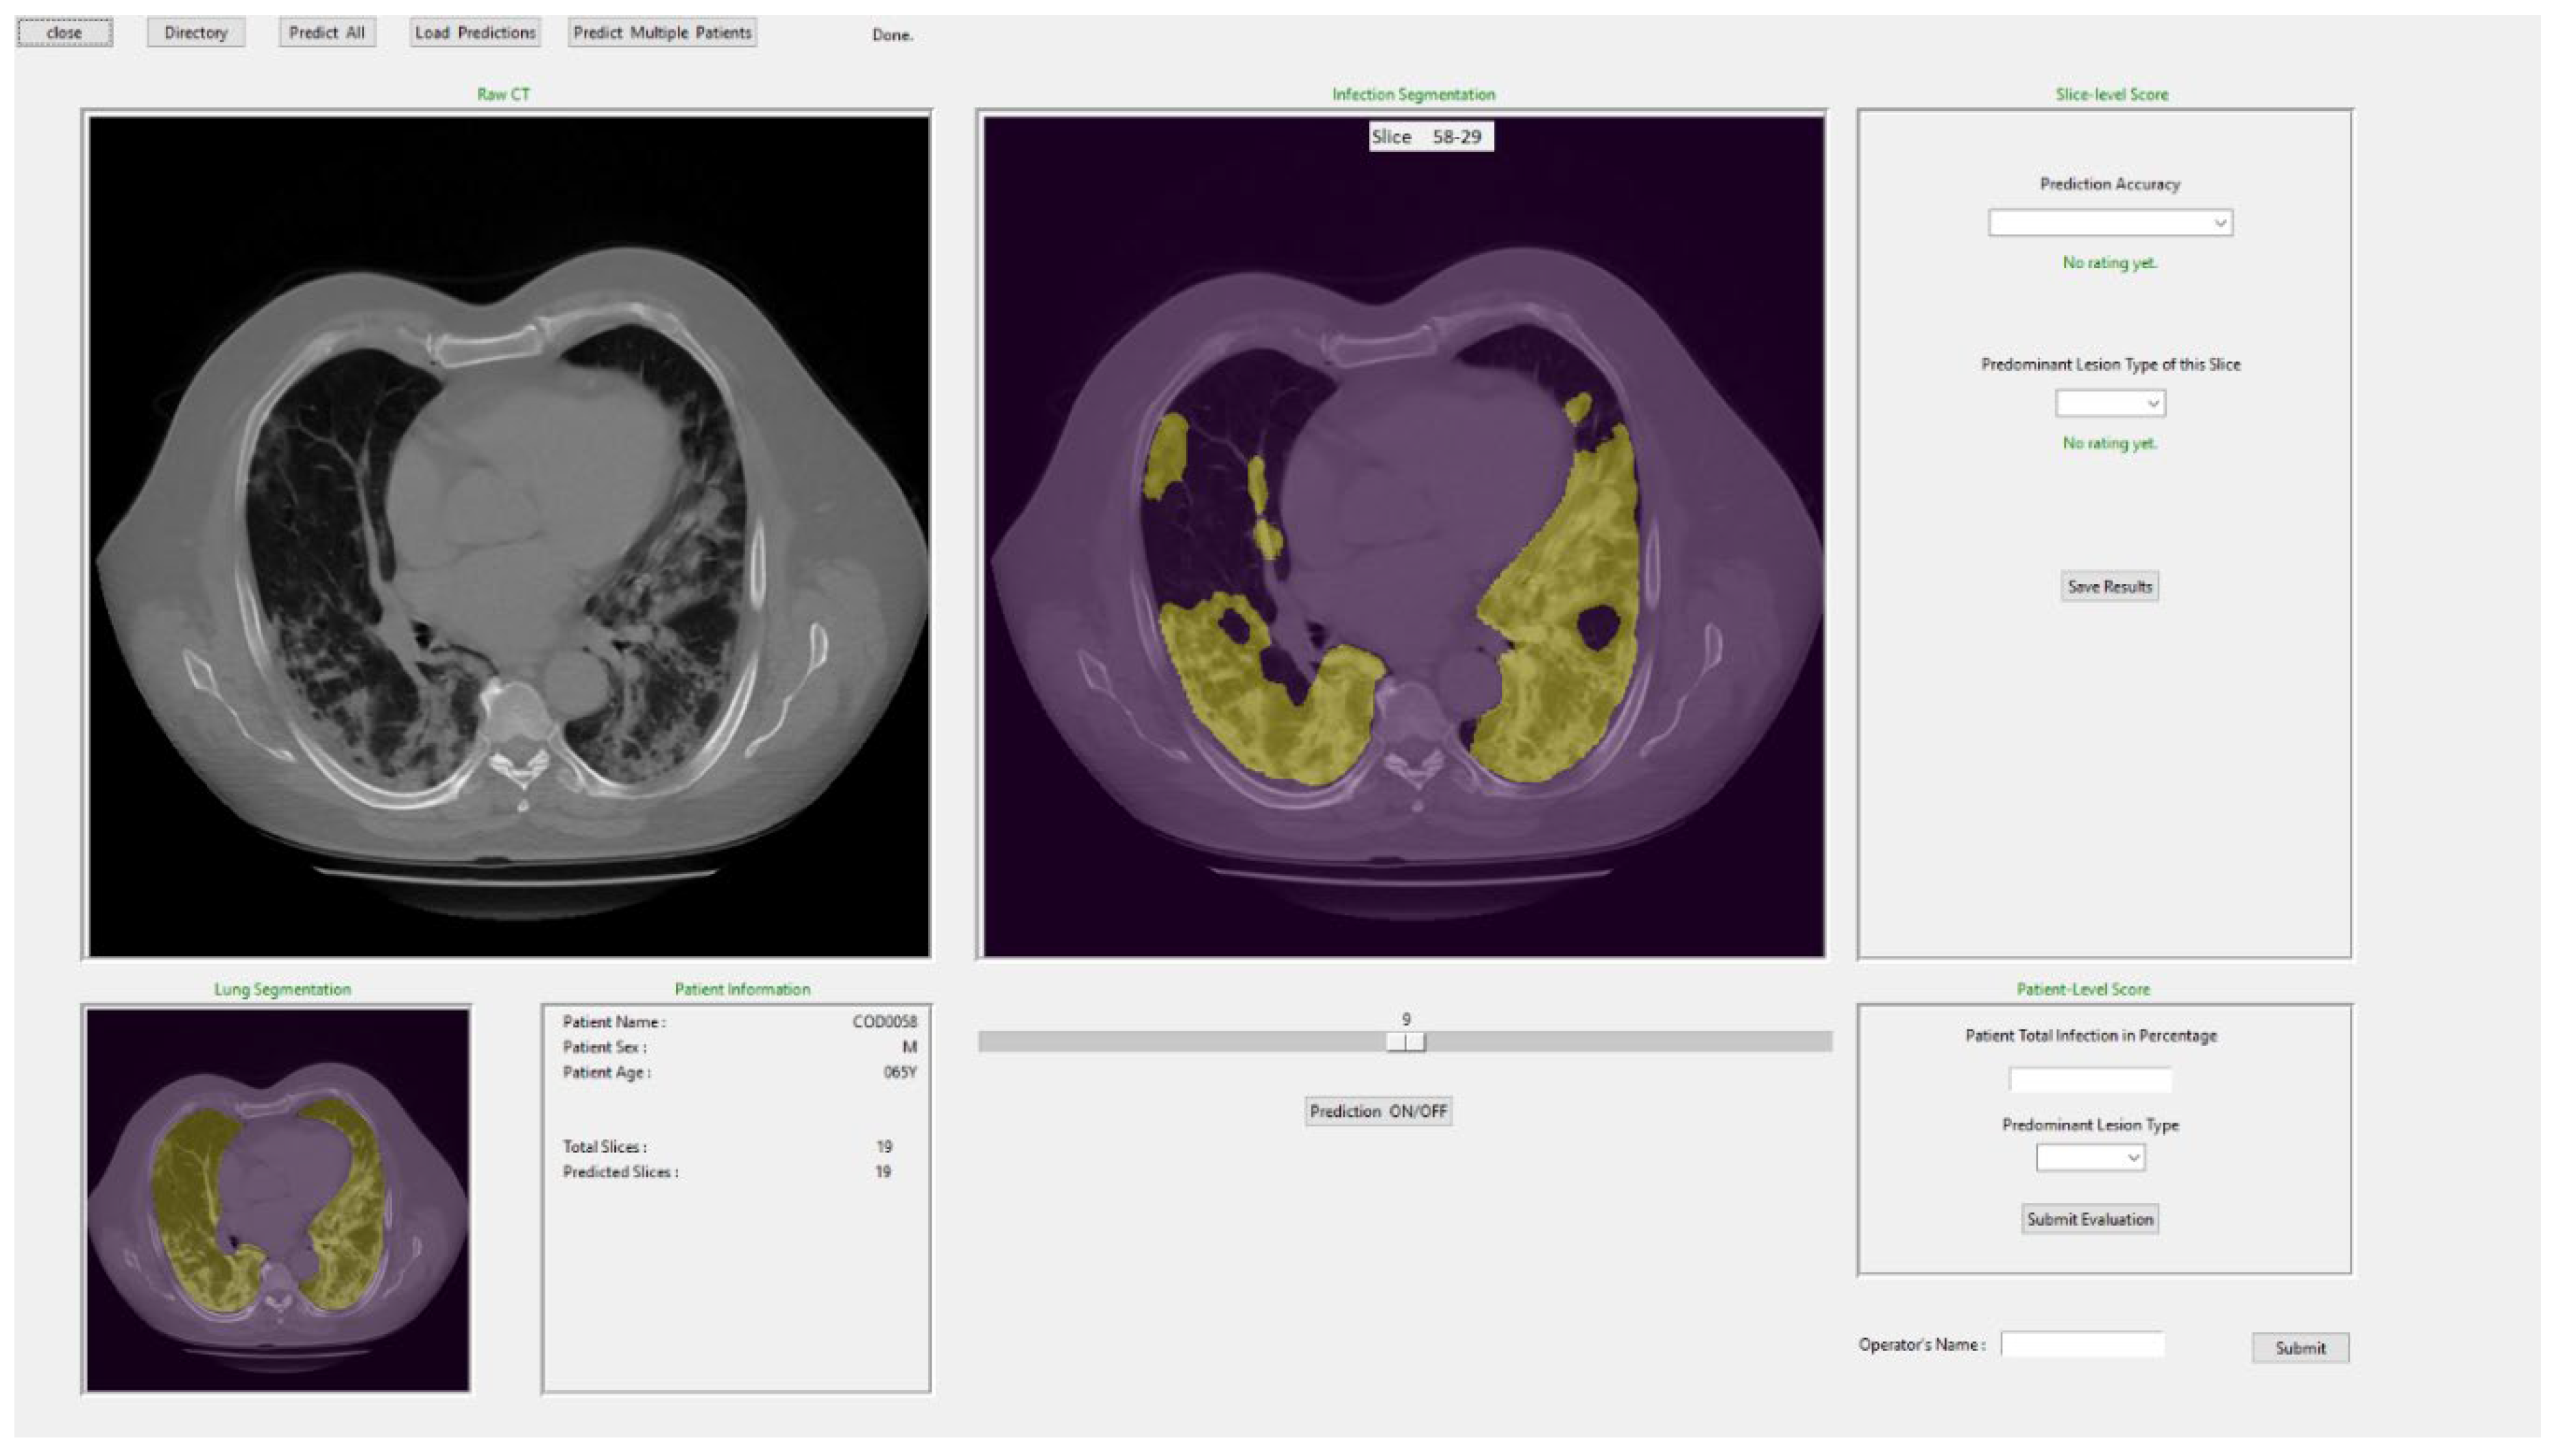

Table 1.
The detail of the ensembled model for infection detection.
| Loss function | Augmentation | |
|---|---|---|
| Model 1 | Binary Cross Entropy | 5 times |
| Model 2 | Tversky | 10 times |
| Model 3 | Tversky | 10 times |
| Model 4 | Binary Cross Entropy | 10 times |
| Model 5 | Binary Focal Loss | 5 times |
Table 2.
Confusion matrix illustrating the developed model’s stage detection. the cases dominated with GGO and crazy paved pattern area are classified as “A” group, and “C” represents the cases with significant consolidation area (blobs).
Table 2.
Confusion matrix illustrating the developed model’s stage detection. the cases dominated with GGO and crazy paved pattern area are classified as “A” group, and “C” represents the cases with significant consolidation area (blobs).
| Radiologists\Model | A | C |
|---|---|---|
| A | 61 | 2 |
| C | 10 | 7 |
Disclaimer/Publisher’s Note: The statements, opinions and data contained in all publications are solely those of the individual author(s) and contributor(s) and not of MDPI and/or the editor(s). MDPI and/or the editor(s) disclaim responsibility for any injury to people or property resulting from any ideas, methods, instructions or products referred to in the content. |
© 2023 by the authors. Licensee MDPI, Basel, Switzerland. This article is an open access article distributed under the terms and conditions of the Creative Commons Attribution (CC BY) license (http://creativecommons.org/licenses/by/4.0/).
Copyright: This open access article is published under a Creative Commons CC BY 4.0 license, which permit the free download, distribution, and reuse, provided that the author and preprint are cited in any reuse.