Submitted:
03 February 2023
Posted:
07 February 2023
You are already at the latest version
Abstract
Knowing the spatial variability of factors that influence crop yield is essential to carry out a localized treatment. The present study aimed to map the spatial variability of apparent soil electrical conductivity (ECa) in two cultivation areas, delimit management zones (MZ), characterize the soil density (Sd) at two depths, in each MZ, and assess whether the delimitation of MZ, based on the spatial variability of ECa, was able to identify regions of the productive field with different Sd. Spatial variability of ECa was detected. MZ with the highest mean value of ECa also presented the highest mean values of Sd. The highest Sd values were observed for the 0.1 – 0.2 m layer, regardless of the studied area. Regardless of granulometry, the proposed method was able to detect density differences from ECa. The delimitation of MZ, based on the spatial variability of ECa mapping, was able to differentiate the mean values of Sd between MZ 1 (1.53 g cm-3) and MZ 2 (1.67 g cm-3) in the Area A, in the 0.1 – 0.2 m layer. A statistical difference was observed for the mean values of Sd, in MZ 1, layer 0.1 - 0.2 m, when comparing the two study areas: A (1.53 g cm-3) and B (1.64 g cm-3). We suggest that further studies should be carried out, as the mapping of the spatial variability of the apparent soil electrical conductivity showed potential in the differentiation of soil bulk density at different depths.
Keywords:
no-till
; soil compaction
; precision agriculture
; apparent soil electrical conductivity
1. Introduction
Brazil and USA are currently the world’s largest producers of soybean. In the 2020/21 season, Brazil reached the record mark of 135.4 M T, produced in a cropped area of 38.5 M ha, with average productivity estimated at 3,517 kg ha-1 [1]. The Brazilian farmer has been using technologies in order to conciliate the increase of productivity and cropped area, thus, improve their profitability [2].
In this context, we highlight the successful adoption, on a large scale, of the no-tillage system (NTS). According to Salomão and colleagues [3], the adoption of NTS represents an alternative for economic and sustainable production, which makes it possible to solve environmental problems such as the soil erosion, loss of nutrients by lixiviation and transport of agrochemical inputs, soluble nutrients and organic matter into water courses and natural ecosystems.
Associated with the NTS, the use of precision agriculture techniques and digital tools, such as those aimed at mapping the spatial variability of soil attributes, has been consolidated as an efficient agronomic practice, especially in the management of soil fertility through georeferenced soil sampling [4]. The mapping of the spatial variability of soil and plant attributes provides tools to scout the fields with layers of information, allowing site-specific interventions [5], in particular, in soil attributes that are crop yield limiting.
The choice of the soil sampling method will affect the characterization quality of the spatial variability of soil attributes. Soil sampling based on a grid of georeferenced points is the most used in Brazilian precision agriculture [6]. However, the representativeness of the spatial variability of soil attributes is dependent on the number of points that compose the grid [7]. Some soil attributes as phosphorus content and soil resistance penetration demands a large number of sampling. In this context, grids composed of many sampling points can make the characterization of the spatial variability economically unfeasible [8].
In the literature, there are numerous studies on the mapping of the spatial variability of soil chemical properties, for the purpose of site-specific management, using precision agriculture tools. Among the reasons that justify this large number of studies, in addition to the relevance of improving soil fertility in dystrophic tropical soils, is the availability of equipment to mechanical operationalization of sampling. Studies related to the spatial variability of soil physical attributes, such as bulk density, are less frequent. Soil density can be used as an indicator of changes in soil structure [9]. According to Stone and Silveira [10] the soil density is a factor that affect soil water storage, plant nutrient uptake, root growth and crop yield. Although, its relevance to crop performance the high labor demand to soil density evaluation limit the spatial variability characterization.
The search of technical approaches that aim to smart sampling for the purpose of characterizing soil density in homogeneous zones with low cost is highly demanded. In this scenario, the soil apparent electrical conductivity can help to guide the sampling for the purpose of characterizing spatial variability of the bulk density. Therefore, allowing site-specific chiseling or cover crops that can mitigate soil compaction.
The present study firstly map the spatial variability of apparent soil electrical conductivity (ECa) in two fields, one a rainfeed and the second irrigated with center-pivot system. Secondly, delimited management zones (MZ) based on the spatial variability of the ECa in each field. Finally, evaluate the soil density, at two depths, according MZ. The hypothesis of the study was that the delimitation of MZ, based on the ECa, was able to capture regions with different soil densities in both fields.
2. Materials and Methods
This study was carried out in two farm fields, located in the municipality of Cachoeira do Sul, Rio Grande do Sul State; Southern Brazil. These fields have been managed under no-tillage system and oriented to grain crop production. The soil is classified as Red Acrisol, according to Soil Taxonomy 1975 [11].
The field A has 26.7 ha, cropped in a dryland system. The management adopted in this area includes NT of soybeans in the summer season, harrowing and sowing of oats (for cover crop/pasture) in the winter season. The field B has 24.1 ha, cropped with irrigation of center-pivot irrigation system. In the summer season, part of the pivot is cropped with soybean and part with corn, for silage production. In the winter, the whole field is sown with oat for animal pasture.
Soil sampling scheme was grid with points regularly spaced at 50 x 50 m (Figure 1). These points served as a basis for measuring the ECa (mS m-1). A Garmin GPS receiver, model GPSMAP 62sc, was used to locate the sample points in the study areas.
Soil moisture was estimated by the gravimetric method. with the aid of a Dutch auger, representative soil samples from the 0-0.2 m soil layer were collected in random points in both fields. The soil samples were stored in aluminum recipients, identified and taken to the laboratory for drying in an oven for 24 hours at 105°C.
To determine the ECa, the electrical resistivity method was used. The electrical resistivity was obtained by introducing four equally spaced electrodes into the soil. An electric current was applied to the external electrodes and the potential difference was measured at the internal electrodes. The electrode assembly configuration used was the Wenner Matrix [12,13].
The resistivity obtained using the Wenner Matrix was calculated by Equation (1).
where:
- = Resistivity, Ohm m-1;
- = Spacing between electrodes, m;
- ∆V = Measured potential difference, V; and
- i = Applied electric current, A.
The apparent soil electrical conductivity represents the inverse of the resistivity, being calculated by Equation (2).
where:
- ECa = Apparent soil electrical conductivity, S m-1.
To obtain the ECa, a portable electrical conductivity meter, assembled by Landviser®, model LandMapper® ERM-02, was used. A Wenner matrix was constructed with four electrodes arranged in order to get measurements at 0.20 m soil depth. The electrode support structure was developed using metalon tubes, steel screws, and flexible wires in different colors for current electrodes (red wire) and electrodes used to determine the potential difference (black wire). The contact between the steel screws and the metalon was isolated by covering the screws with a PVC hose. Figure 2 shows the portable meter and the electrode array.
The spatial dependence of the ECa was evaluated by variogram adjustments, assuming the stationarity of the intrinsic hypothesis, defined by Equation (3).
where:
- = Semivariance as a function of the separation distance (h) between pairs of points;
- h = Separation distance between pairs of points, m;
- N(h) = Number of experimental pairs of observations Z(xi) and Z (xi + h) separated by a distance h.
Gaussian, spherical, and exponential models were tested in the semivariograms. The model that presented the smallest residual sum of squares was adjusted [14]. The selected model was evaluated using the cross-validation technique, which consists of plotting the observed values in the field versus those estimated by the selected model on a graph. The model accuracy is reflected by the parameters obtained in the cross-validation analysis, which are: coefficient of determination (the closer to the value 1, the more accurate the estimates), standard error of prediction (the smaller, the more accurate the estimates) and intercept (the closer to zero, the more accurate the estimates).
Once the spatial dependence was determined and the theoretical semivariance model adjusted, the map of spatial variability of ECa was made. The interpolation of values was performed using ordinary kriging. This interpolation method was selected because it provides the best linear unbiased predictions (BLUP), seeking the minimum variance [14]. For the estimation of values in unsampled locations, 16 close neighbors and a search radius of 50% of the range value found in the variogram adjustment were used, in order to guarantee the spatial continuity interval.
The analysis of spatial variability was made using the computer program GS+, version 7. The ECa values resulting from the kriging interpolation were organized into 2 MZ. These zones were generated through the KrigMe computer program, developed by Valente [15], using the Fuzzy k-means classification algorithm in the data cluster analysis and management zones generation.
After defined the MZ, soil texture (0 – 0.2 m) and soil bulk density (0 – 0.1; 0.1 – 0.2 m) evaluations were carried out in each of these zones. Data collections were made in three sampling points within each MZ. Soil sampling for soil texture was performed using a cutting shovel, removing representative soil from the 0 – 0.2 m layer. The soil samples were packed in plastic bags, identified and sent for laboratory analysis.
Soil bulk density was determined by the soil volumetric ring method, which is considered a standard for bulk density assessment. To collect the undisturbed soil sample, steel cylinders with bevelled edges (4 cm diameter, 3 cm height, and 37.7 cm3 volume) were used. The cylinders were introduced in the soil profile, in the 0 – 0.1 and 0.1 – 0.2 m depths, with the aid of a sledgehammer and an auger; later, with the aid of a cutting shovel, the rings were collected. Excess soil beyond the dimensions of the rings was removed with a knife, until it the ring’s surface was cleaned.
The rings with the soil were then packed in aluminum recipients capsules and taken to the laboratory. The samples were placed to dry in an oven at 105°C for a 24h-period. After that, they were weighed on a precision scale; the weight of the aluminum capsule + ring (tare) was deducted from the weight obtained, in order to get the dry soil mass. Soil bulk density was determined base in the Equation (4).
where:
- Sd = Soil bulk density, g cm-3;
- ms = Dry soil mass, g;
- V = Ring volume, cm3.
Figure 3 illustrate the collection of undisturbed soil samples at depths of 0 - 0.1 m (a; b) and 0.1 - 0.2 m (c), and the sample prepared to be sent to the laboratory for soil bulk density determination (d).
The ECa, bulk density, and soil texture data was submitted to descriptive statistical analysis, calculating the values of minimum, average, maximum, standard deviation, and coefficient of variation. The average values of soil density, between the MZ for the same field and between the MZ of the different fields, were compared by the t-test of means. Statistical analyzes were performed using the statistical program Statistica, version 7.
3. Results
The average of soil moisture, representative of the 0-20 cm layer, at the time of soil ECa evaluation was 0.130 g g-1 for field A and 0.127 g g-1 for field B. The spatial variability of ECa was determined for the two fields. The theoretical model that best explained the empirical semivariance of ECa was the spherical model, with a coefficient of determination (r2) of 0.78 for field A and 0.93 for field B. The greatest range was observed in field B (497 m) and the smallest in field A (161.8 m). These values were higher than the distance between the soil sampling collect points (50 m). Figure 4 shows the semivariograms with adjustment parameters, cross-validation graphs with adjustment parameters and the maps of spatial variability of ECa for the two fields.
Figure 5 shows the maps of MZ, divided into two classes, delimited based on the spatial variability of the ECa (Figure 4). In both fields, class MZ 1 represents low ECa sites and class MZ 2 represents high ECa areas. Due to the small areas, the MZ map was divided only into two classes, as, according to Tisseyre and McBratney [16], the increase in the number of classes leads to irregularity in the field, creating small MZ that are difficult to manage.
Table 1 shows the descriptive statistical parameters of soil attributes: apparent soil electrical conductivity (ECa; mS m-1), soil bulk density (Sd; g cm-3), gravimetric soil moisture (Sm, g g-1), sand, silt and clay contents, for the management zones delimited in field A (rainfeed). Cachoeira do Sul, RS.
ECa ranged from 3.62 to 14.94 mS m-1, with the highest mean value observed for MZ 2 (10.05 mS m-1). In MZ 2 the zone with the highest ECa had higher values of Sd for both depths evaluated, when compared to Sd values got in MZ 1.
Considering the 0 – 0.1 m soil layer, the mean Sd in MZ 1 was 1.34 g cm-3, while in MZ 2 it was 1.46 g cm-3. For the 0.1 – 0.2 m layer, the MZ 1 the Sd was 1.53 g cm-3 and the MZ 2 it was 1.67 g cm-3, confirming the efficiency of the ECa as a delimiting factor for MZ.
The CV for the Sd estimates, regardless of the soil layer and the MZ investigated, were below 6%, classified as low variability (CV < 12%) as proposed by Warrick and Nielsen [17]. In relation to the soil texture, the MZ presented very similar values for the attributes sand, silt, and clay, suggesting that the differences in Sd reported were not associated with soil texture.
Table 2 shows the descriptive statistical parameters of soil attributes: Apparent soil electrical conductivity (ECa; mS m-1), soil density (Sd; g cm-3), soil moisture (Sm, g g-1), sand, silt, and clay, for the management zones delimited in field B.
The Field B had the lowest range of ECa values, which ranged from 3.03 to 7.77 mS m-1. The average soil Sd, regardless the MZ, was lower for the 0 – 0.1 m layer than the 0.1 – 0.2 m layer.
Table 3 presents the results of the test of means for Sd, in each field investigated, according to the MZ delineated. A significant statistical difference was observed only for the comparison between the averages of Sd in the 0.1 – 0.2 m layer, between MZ 1 and 2 for field A.
Regardless of the field investigated, the highest Sd values were observed for the MZ 2, that is, the one with the highest ECa reported. Furthermore, the highest Sd values were obtained for the 0.1 – 0.2 m layer, regardless of the field or the MZ investigated.
The test of means did not detect significant differences among soil attributes (except for the Sd as previously reported), this fact, considering the values of Sd reported, suggesting a certain level of soil compaction. Therefore, the spatial variability of ECa show potential to be a guiding factor for smart Sd sampling able to identify areas in the field with distinct Sd values. This spatial variability delineation is agronomic relevant because Sd is an indicator of the soil physical quality, an attribute that directly influences crop performance [29,30].
Table 4 presents test of means for Sd in both fields investigated according the MZ delineated. A statistically significant difference was observed for the mean values of Sd between fields A and B for the soil layer of 0.1 – 0.2 m, with values of 1.53 and 1.64 g dm-3, respectively.
The Table 5 presents the Sd, in each field, as a function of the different depths investigated in MZ. The Sd values of the 0.1 – 0.2 m were higher from the 0 – 0.1 m in field A, for both MZ investigated. In the field B, although the same trend of higher values of Sd in the deeper layer compared to the shallow was observed in both MZ, a significant statistical difference was only observed for the MZ 1.
4. Discussion
In the semivariograms of ECa the range values used can influence the quality of estimates, since it determines the number of values used in the interpolation process; thus, estimates made with interpolation by ordinary kriging using values of larger ranges tend to be more reliable, presenting spatial maps that more accurately represent the field variability [18]. The cross-validation regression coefficients showed values above 0.8 for both fields, indicating a satisfactory fit of the semivariance model. Cross-validation was efficient tool to represent spatial ECa variability based in the agreement of estimated values and real field variability [19].
The ECa values represent the spatial changes in soil attributes. Previous studies have already reported that ECa values are affected by chemical and physical soil attributes. Peralta and colleagues [20] studied the correlation between soil attributes and ECa and identified that cation-exchange capacity and soil organic matter (SOM) contents were positively related to ECa. Yet, SOM had a significant correlation with the soil moisture, that supports a higher electric current capacity and therefore drive the ECa spatial variability.
Medeiros [21] evaluated the correlation of ECa in two fields with different soil texture being one a sandy and other a clayey soil. The authors reported that in the sandy soil field, a positive correlation was found for the available soil phosphorus and there was no correlation between ECa and SOM neither with clay and sand contents. In the clayey soil field, ECa had a positive correlation with clay content and a negative correlation with sand content. Alves [22] defined MZ based on the spatial variability of ECA and SOM in corn and soybean fields reported that they were efficient indicators of soil attributes spatial variability.
Research carried out by Bottega and colleagues [23] investigate the delimitation of MZ based on the ECa concluded that the MZ gotten were able to capture the spatial variability of soil attributes as the contents of clay, potassium, calcium, sum of bases, effective cation exchange capacity and cation exchange capacity at pH 7.
In field A, the delimited management zones did not present spatial continuity, as observed in field B in which the two MZ were better delimited. This fact can be explained by the management adopted by the farmers in each field. MZ 1 of field B the central pivot was used to corn for silage. In this MZ 1, there was an intensive non-controlled traffic of heavy machines that associate to a more intensive cropping system, resulted in soil compaction. In fields with high above ground biomass exportation, low levels of SOM and nutrients depletion are generally reported [24], that could accelerate the soil compaction process specially under traffic machinery with high soil moisture. Michelon and colleagues [25] investigating central pivot fields in five Brazilian States reported that in Sao Paulo State 34% of fields had soil compaction. The authors evaluated soil density and macroporosity as key indicators of soil compaction suggesting that for soil texture range of 200- 300 g kg-1 of clay the bulk density > 1.55 and macroporosity <10 % were critical to crop performance and soil water storage. The change in soil hydro-physical attributes may affect ECa.
Regardless of the MZ, in our study the field B had Sd lower in the 0 – 0.1 m layer (MZ1= 1,54; MZ2= 1,46 g cm-3) than in the 0.1 – 0.2 m layer (MZ1: 1,66; MZ2: 1,74 g cm-3). Assuming the critical values of Sd proposed to Michelon and colleagues [25] in our study the field B in the 0 – 0.1 m layer was not critical but the 0.10-0.20 m had Sd values over this limit affecting crop performance, water storage and ECa. These results corroborate those obtained by Silveira [26], who observed similar trend of lower Sd at depth of 0 – 0.1 m than 0.1 m– 0.2 m. In addition, the study carried out by Assis [27] found that the Sd in layers 0 – 0.1 m had lower change in Sd in degraded pasture field. Custodio [28] attributed the higher accumulation of SOM in shallow layer as a key factor to keep soil biological activity and plant root growth that can alleviate soil compaction.
The soil compaction reported in field B, possibly was associate to random aleatory traffic of heavy machinery under high soil moisture and a greater number of livestock in the winter season (crop-livestock system). The machine traffic and overgrazing are among the main world causes of soil compaction increasing soil bulk density, affecting plant root growth [29]. The increase in soil bulk density is associate to linear decrease in macroporosity that causes slow infiltration rate which its turn compromises soil water storage [30]. Bono; Macedo; Tormena [31] evaluated the soil physical attributes of U. brizantha pasture found that the high bulk densities in the shallow layers were due to live-stock grazing effect. Similarly, Bell [32] reported that the major constraint to adoption of integrated crop-livestock farming systems in Australia is the adverse impacts of soil compaction caused by grazing livestock express by decrease in soil porosity and infiltration rate, and increase in soil bulk density and soil penetration resistance in soil surface (top 5-10 cm. In field B of our study we had three factors associate random machinery traffic, live-stock grazing and silage production that affect severely soil physics attributes that were represented by Sd captured by ECa.
The increase of Sd with depth in our study can be associate to a decline in SOM, lower soil aggregation, higher penetration resistance and decreased in soil porosity [33]. Mazurana [34] observed that machine traffic in an uncultivated system (fallow) affected soil macroporosity up to a 0.10 m-depth, also changing Sd.
Soil density values tend to increase under continuous no-till due to lack of soil disturbance and crop rotation. The soil macroporosity, microporosity, and total porosity also increase when the principles of NTS are fully integrate (permanent soil cover, minimum soil disturbance and crop rotation [26]. Also, according to Kunz [35], depending on the soil physics conditions at beginning of NTS adoption have been reported mainly in clay soil expressed by increase in Sd and decrease in macroporosity.
The in a continuous and rotational grazing system alters the physical properties of the soil, such as soil porosity, leading to soil compaction [36]. Collares [37] aimed to evaluate the impacts of machine traffic and cattle hooves on soil physics attributes reported that immediate compaction was observed in soils under machinery traffic, while in soils livestock grazing, an increase in soil compaction was observed only in shallow layers, altering the soil macroporosity. Chyba and colleagues [38] comparing soil compaction by machinery traffic and cattle hooves reported that the effect could be similar with saturated hydraulic conductivity values reduced by 80% compared to non-compacted treatment confirming the negative effect on infiltration rate. In our study the high Sd in field 2 that had both sources of soil compaction machinery traffic and cattle hooves justifying the high ECa.
The present study aimed to investigate whether the delimitation of MZ, based on the mapping of the spatial variability of ECa, is efficient in differentiating Sd values in two fields with different management systems but with similar soil texture. The results demonstrate the great potential of ECa in be a tool to guide smart Sd sampling supporting site-specific management to mitigate soil compaction in grain crops. The techniques and tools used in this study can be adopted in any rural property, regardless of its size or technological level. The delimitation of the MZ can contribute to the reduction of time and costs involved with the quantification of Sd, since each MZ can be considered as homogeneous. Further studies should be carried out, so that this technique can be consolidated as an effective tool in the site-specific management of soil compaction.
5. Conclusions
Spatial variability of apparent soil electrical conductivity was detected in both fields investigated that present similar soil texture. Management zones with the highest value of apparent soil electrical conductivity had the highest values of soil density, in both soil layer analyzed. The highest soil bulk density was observed for the 0.1 – 0.2 m layer, regardless of the studied field. Although the fields had different level of soil compaction based on soil bulk density and crop management adopted. Field under central pivot irrigation had highest soil bulk density associate to intensive random machinery traffic, livestock grazing effect and crop residue remotion compared to Field under rainfeed management. In consequence a statistical difference for soil bulk density, in MZ 1, layer 0.1 – 0.2 m, was reported with 7.2 % higher bulk density in field under central pivot than rainfeed reaching values that affect soil water storage and crop performance. Beside on that, the delimitation of management zones based on the spatial variability of apparent electrical conductivity mapping was an efficient and cheaper tool to guide smart soil sampling to explore the presence of soil compaction. Our study confirm that central pivot irrigated fields need special attention regarding the risk of soil compaction specially when submitted to intensive cropping systems, crop residue remotion to silage and livestock grazing.
Author Contributions
Conceptualization, E.L.B., C.K.M., and Z.B.de O.; methodology, E.L.B., and Z.B.de O.; software, E.L.B., and C.K.M.; formal analysis, E.L.B and C.K.M.; data curation, E.L.B., and Z.B. de O..; writing—original draft preparation, E.L.B., and C.K.M; writing—review and editing, T.J.C.A., and C. de C.L.; supervision, E.L.B. All authors have read and agreed to the published version of the manuscript.
Funding
We thank Conselho Nacional de Desenvolvimento Científico e Tecnológico (CNPq) for granting an undergraduate research scholarship through Public Notice No. 009/2019 – Institutional Scientific Initiation Scholarship Program (PIBIC and PIBIC Affirmative Actions) CNPq/UFSM. We thank CNPq for research scholarship to last author.
Acknowledgments
We also thank Mr. Maurício Tisato and Mr. Paulo Ebbesen, for the availability of the study areas.
Conflicts of Interest
The authors declare no conflict of interest.
References
- CONAB - Companhia Nacional De Abastecimento. Acompanhamento da safra brasileira de grãos, v.8 – safra 2020/21, nº 8 – oitavo levantamento; CONAB: Brasília, Brasil, 2021; 115p. [Google Scholar]
- Londero, R.; de Oliveira, R.B.; do Nascimento, J.M.; Arcoverde, S.N.S.; Secretti, M.L. Dependência espacial da fertilidade do solo sob plantio direto e suas relações com a produtividade da soja. Cad. Cien. Agrárias 2020, 12, 1–8. [Google Scholar] [CrossRef]
- Salomão, P.E.A.; Kriebel, W.; dos Santos, A.A.; Martins, A.C.E. A importância do sistema de plantio direto na palha para reestruturação do solo e restauração da matéria orgânica. Res. Soc. and Dev. 2020, 9, e154911870. [Google Scholar] [CrossRef]
- Gelain, E.; Bottega, E.L.; Motomiya, A.V.d.A.; Marin, C.K.; de Oliveira, Z.B. Dependência e correlação espacial dos atributos de solo em função do arranjo amostral. Tecno-Lógica 2021, 25, 145–172. [Google Scholar] [CrossRef]
- Cintra, P.H.M.; Compagnon, A.M.; Arriel, F.H.; Ventura, G.S.; dos Santos, M.L.; Pimenta Neto, A.M. Variabilidade espacial e qualidade na semeadura de soja. Braz. Appl. Sci. Review 2020, 4, 1206–1221. [Google Scholar] [CrossRef]
- Cherubin, M.R.; Santi, A.L.; Eitelwein, M.T.; Amado, T.J.C.; Simon, D.H.; Damian, J.M. Dimensão da malha amostral para caracterização da variabilidade espacial de fósforo e potássio em Latossolo Vermelho. Pesqui. Agropecu. Bras. 2015, 50, 168–177. [Google Scholar] [CrossRef]
- Grego, C.R.; de Oliveira, R.P.; Vieira, S.R. Geoestatística aplicada à agricultura de precisão. In Agricultura de precisão: resultados de um novo olhar; Bernardi, A.C.d.C., Naime, J.d.M., Resende, A.V.d., Bassoi, L.H., Inamasu, R.Y., Eds.; Brasília: Embrapa, Brasil, 2014. [Google Scholar]
- Lopes, K.A. do L.; Aguiar, F.I. dos S.; Oliveira, I.R. de; Dantas, J.S. Variabilidade espacial de atributos químicos de um argissolo amarelo distrocoeso em diferentes densidades de amostragem. Rev. Cien. Rural 2020, 22, 29–42. [Google Scholar] [CrossRef]
- Campos, B.H. Estudo de caso de atributos físicos de solo no bioma cerrado, em diferentes sistemas de uso e manejo. 2021. 35 f. Monografia (Bacharelado em Engenharia Ambiental), Universidade Federal de Uberlândia, Uberlândia, MG, Brasil.
- Stone, L.F.; Silveira, P.M. da. Efeitos do sistema de preparo e da rotação de culturas na porosidade e densidade do solo. Rev. Bras. Cienc. Solo 2001, 25, 395–401. [Google Scholar] [CrossRef]
- United States Department of Agriculture [USDA]. Soil Taxonomy: Agriculture Washington; Handbook: DC, USA, 1975. [Google Scholar]
- Corwin, D.L.; Hendrickx, J.M.H. Electrical Resistivity: Wenner Array. In Methods of Soil Analysis Part 4 Physical Methods; Silva, J.S., Ed.; SSSA Book Series; ACSESS: Madison, WI, USA, 2002. [Google Scholar]
- Corwin, D.L.; Lesch, S.M. Application of soil electrical conductivity to precision agriculture: Theory, Principles, and Guidelines. Agron. J. 2003, 95, 455–471. [Google Scholar] [CrossRef]
- Oliver, M.A.; Webster, R. A tutorial guide to geostatistics: Computing and modelling variograms and kriging. Catena 2014, 113, 56–69. [Google Scholar] [CrossRef]
- Valente, D.S.M. Desenvolvimento de um sistema de apoio à decisão para definir zonas de manejo em cafeicultura de precisão.2010. 122 f. Tese (Doutorado em Engenharia Agrícola), Universidade Federal de Viçosa, Viçosa, MG, Brasil.
- Tisseyre, B.; Mcbratney, A.B. A technical opportunity index based on mathematical morphology for site-specific management: an application to viticulture. Precis. Agric. 2008, 9, 101–113. [Google Scholar] [CrossRef]
- Warrick, A.W.; Nielsen, D.R. Spatial variability of soil physical properties in the field. In Applications of soil physics; Hillel, D., Ed.; Academic: New York, NY, USA, 1980. [Google Scholar]
- Corá, J.E.; Araujo, A.V.; Pereira, G.T.; Beraldo, J.M.G. Variabilidade espacial de atributos do solo para adoção do sistema de agricultura de precisão na cana-de-açúcar. Rev. Bras. Cienc. Solo 2004, 28, 1013–1021. [Google Scholar] [CrossRef]
- Landim, P.M.B. Sobre geoestatística e mapas. Terrae Didatica 2006, 2, 19–33. [Google Scholar] [CrossRef]
- Peralta, N.R.; Costa, J.L.; Balzarini, M.; Angelini, H. Delineation of management zones with measurements of soil apparent electrical conductivity in the southeastern pampas. Can. J. Soil Sci. 2013, 93, 205–218. [Google Scholar] [CrossRef]
- Medeiros, W.N.; Valente, D.S.M.; Queiroz, D.M. de; Pinto, F. de A. de C.; Assis, I.R. de. Condutividade elétrica aparente do solo em dois tipos de solo. Rev. Cien. Agron. 2018, 49, 43–52. [Google Scholar] [CrossRef]
- Alves, S.M. de F.; Alcântara, G.R.; Reis, E.F. dos; Queiroz, D.M. de, Valente D.S.M. Definição de zonas de manejo a partir de mapas de condutividade. Biosci. J. 2013, 29, 104–114. [Google Scholar]
- Bottega, E.L.; Dias, R.F.; Sari, E.L.; Dorneles, A.B.; Marin, C.K.; Oliveira, Z.B. de. Zonas de manejo: a teoria na prática. Rev. Plantio Direto 2019, 171, 11–14. [Google Scholar]
- Molin, J.P.; Castro, C.N. Establishing management zones using soil electrical conductivity and other soil properties by the fuzzy clustering technique. Sci. Agric. 2008, 65, 567–573. [Google Scholar] [CrossRef]
- Michelon, C.J.; Carlesso, R.; Petry, M.T.; Melo, G.L.; Spohr, R.B.; Andrade, J.G. de. Qualidade física dos solos irrigados de algumas regiões do Brasil Central. Rev. Bras. Eng. Agric. Ambiental 2009, 13, 39–45. [Google Scholar] [CrossRef]
- Silveira, P.M. da; Stone, L.F.; Alves Júnior, J.; Silva J.G., da. Efeitos do manejo do solo sob plantio direto e de culturas na densidade e porosidade de um Latossolo. Biosci. J. 2008, 24, 53–59. [Google Scholar]
- Assis, P.C.R.; Stone, L.F.; Medeiros, J.C.; Madari, B.E.; Oliveira, J. de M.; Wruck, F.J. Atributos físicos do solo em sistemas de integração lavoura-pecuária-floresta. Rev. Bras. Eng. Agric. Ambiental 2015, 19, 309–316. [Google Scholar] [CrossRef]
- Custódio, G.D.; Ribon, A.A.; Fernandes, K.L.; Hermógenes, V.T.L.; Barros, L.R. Densidade do solo e densidade relativa-indicadores da qualidade física de um latossolo amarelo sob diferentes manejos de pastagens e mata nativa. Campo Digital 2015, 10, 50–62. [Google Scholar]
- Santos, F.F. dos; Savioli, J.S.; Santos, L.G. dos; Leite, F.; Castaldo, J.H. Uso de bioestimulante na cultura da soja sobre tráfego controlado. Res. Soc. and Dev. 2020, 9, e238997096–e238997096. [Google Scholar] [CrossRef]
- Nicoloso, R. da S.; Amado, T.J.C.; Schneider, S.; Lanzanova, M.E.; Girardello, V.C.; Bragagnolo, J. Eficiência da escarificação mecânica e biológica na melhoria dos atributos físicos de um latossolo muito argiloso e no incremento do rendimento de soja. R. Bras. Ci. Solo 2008, 32, 1723–1734. [Google Scholar] [CrossRef]
- Bono, J.A.M.; Macedo, M.C.M.; Tormena, C.A. Qualidade física do solo em um latossolo vermelho da região sudoeste dos cerrados sob diferentes sistemas de uso e manejo. Rev. Bras. Cienc. Solo 2013, 37, 743–753. [Google Scholar] [CrossRef]
- Bell, L.W. Impacts of soil compaction by livestock on crop productivity– a modelling analysis. In Proceedings of the 19th World Congress of Soil Science, Brisbane, Australia, 1–6 August 2010; Soil Solutions for a Changing World. [Google Scholar]
- Bicalho, I.M. Um estudo da densidade do solo em diferentes sistemas de uso e manejo. Enciclopédia Biosfera 2011, 7, 1–9. [Google Scholar]
- Mazurana, M.; Fink, J.R.; Silveira, V.H. da; Levien, R.; Zulpo, L.; Brezolin, D. Propriedades físicas do solo e crescimento de raízes de milho em um Argissolo Vermelho sob tráfego controlado de máquinas. Rev. Bras. Cienc. Solo 2013, 37, 1185–1195. [Google Scholar] [CrossRef]
- Kunz, M. Relações físico – hídricas de um latossolo sob plantio direto.2010. 48 f. Dissertação (Mestrado em Ciência do Solo) – Universidade Federal de Santa Maria, Santa Maria, RS, Brasil.
- Cervelati, K.F.; Sousa Neto, E.L. de; Eguchi, E.S.; Silva, M.R.; Pierangeli, M.A.P. Efeito de diferentes sistemas de pastejo em atributos físicos do solo. PUBVET - Publicações em Medicina Veterinária e Zootecnia 2011, 5, 1142. [Google Scholar] [CrossRef]
- Collares, G.L. Compactação em latossolos e argissolo e relação com parâmetros de solo e de plantas.2005. 107 f. Tese (Doutorado em Ciência do Solo), Universidade Federal de Santa Maria, Santa Maria, RS, Brasil.
- Chyba, J.; Kroulík, M.; Krištof, K.; Misiewicz, P.A.; Chaney, K. Influence of soil compaction by farm machinery and livestock on water infiltration rate on grassland. Agron. Res 2014, 12, 59–64. [Google Scholar]
Figure 1.
Soil sampling grid used to evaluate apparent soil electrical conductivity (ECa) in field A under rainfeed, of 26.7 hectares (a), and in field B under central pivot irrigation, of 24.1 hectares (b). Cachoeira do Sul, RS.
Figure 1.
Soil sampling grid used to evaluate apparent soil electrical conductivity (ECa) in field A under rainfeed, of 26.7 hectares (a), and in field B under central pivot irrigation, of 24.1 hectares (b). Cachoeira do Sul, RS.
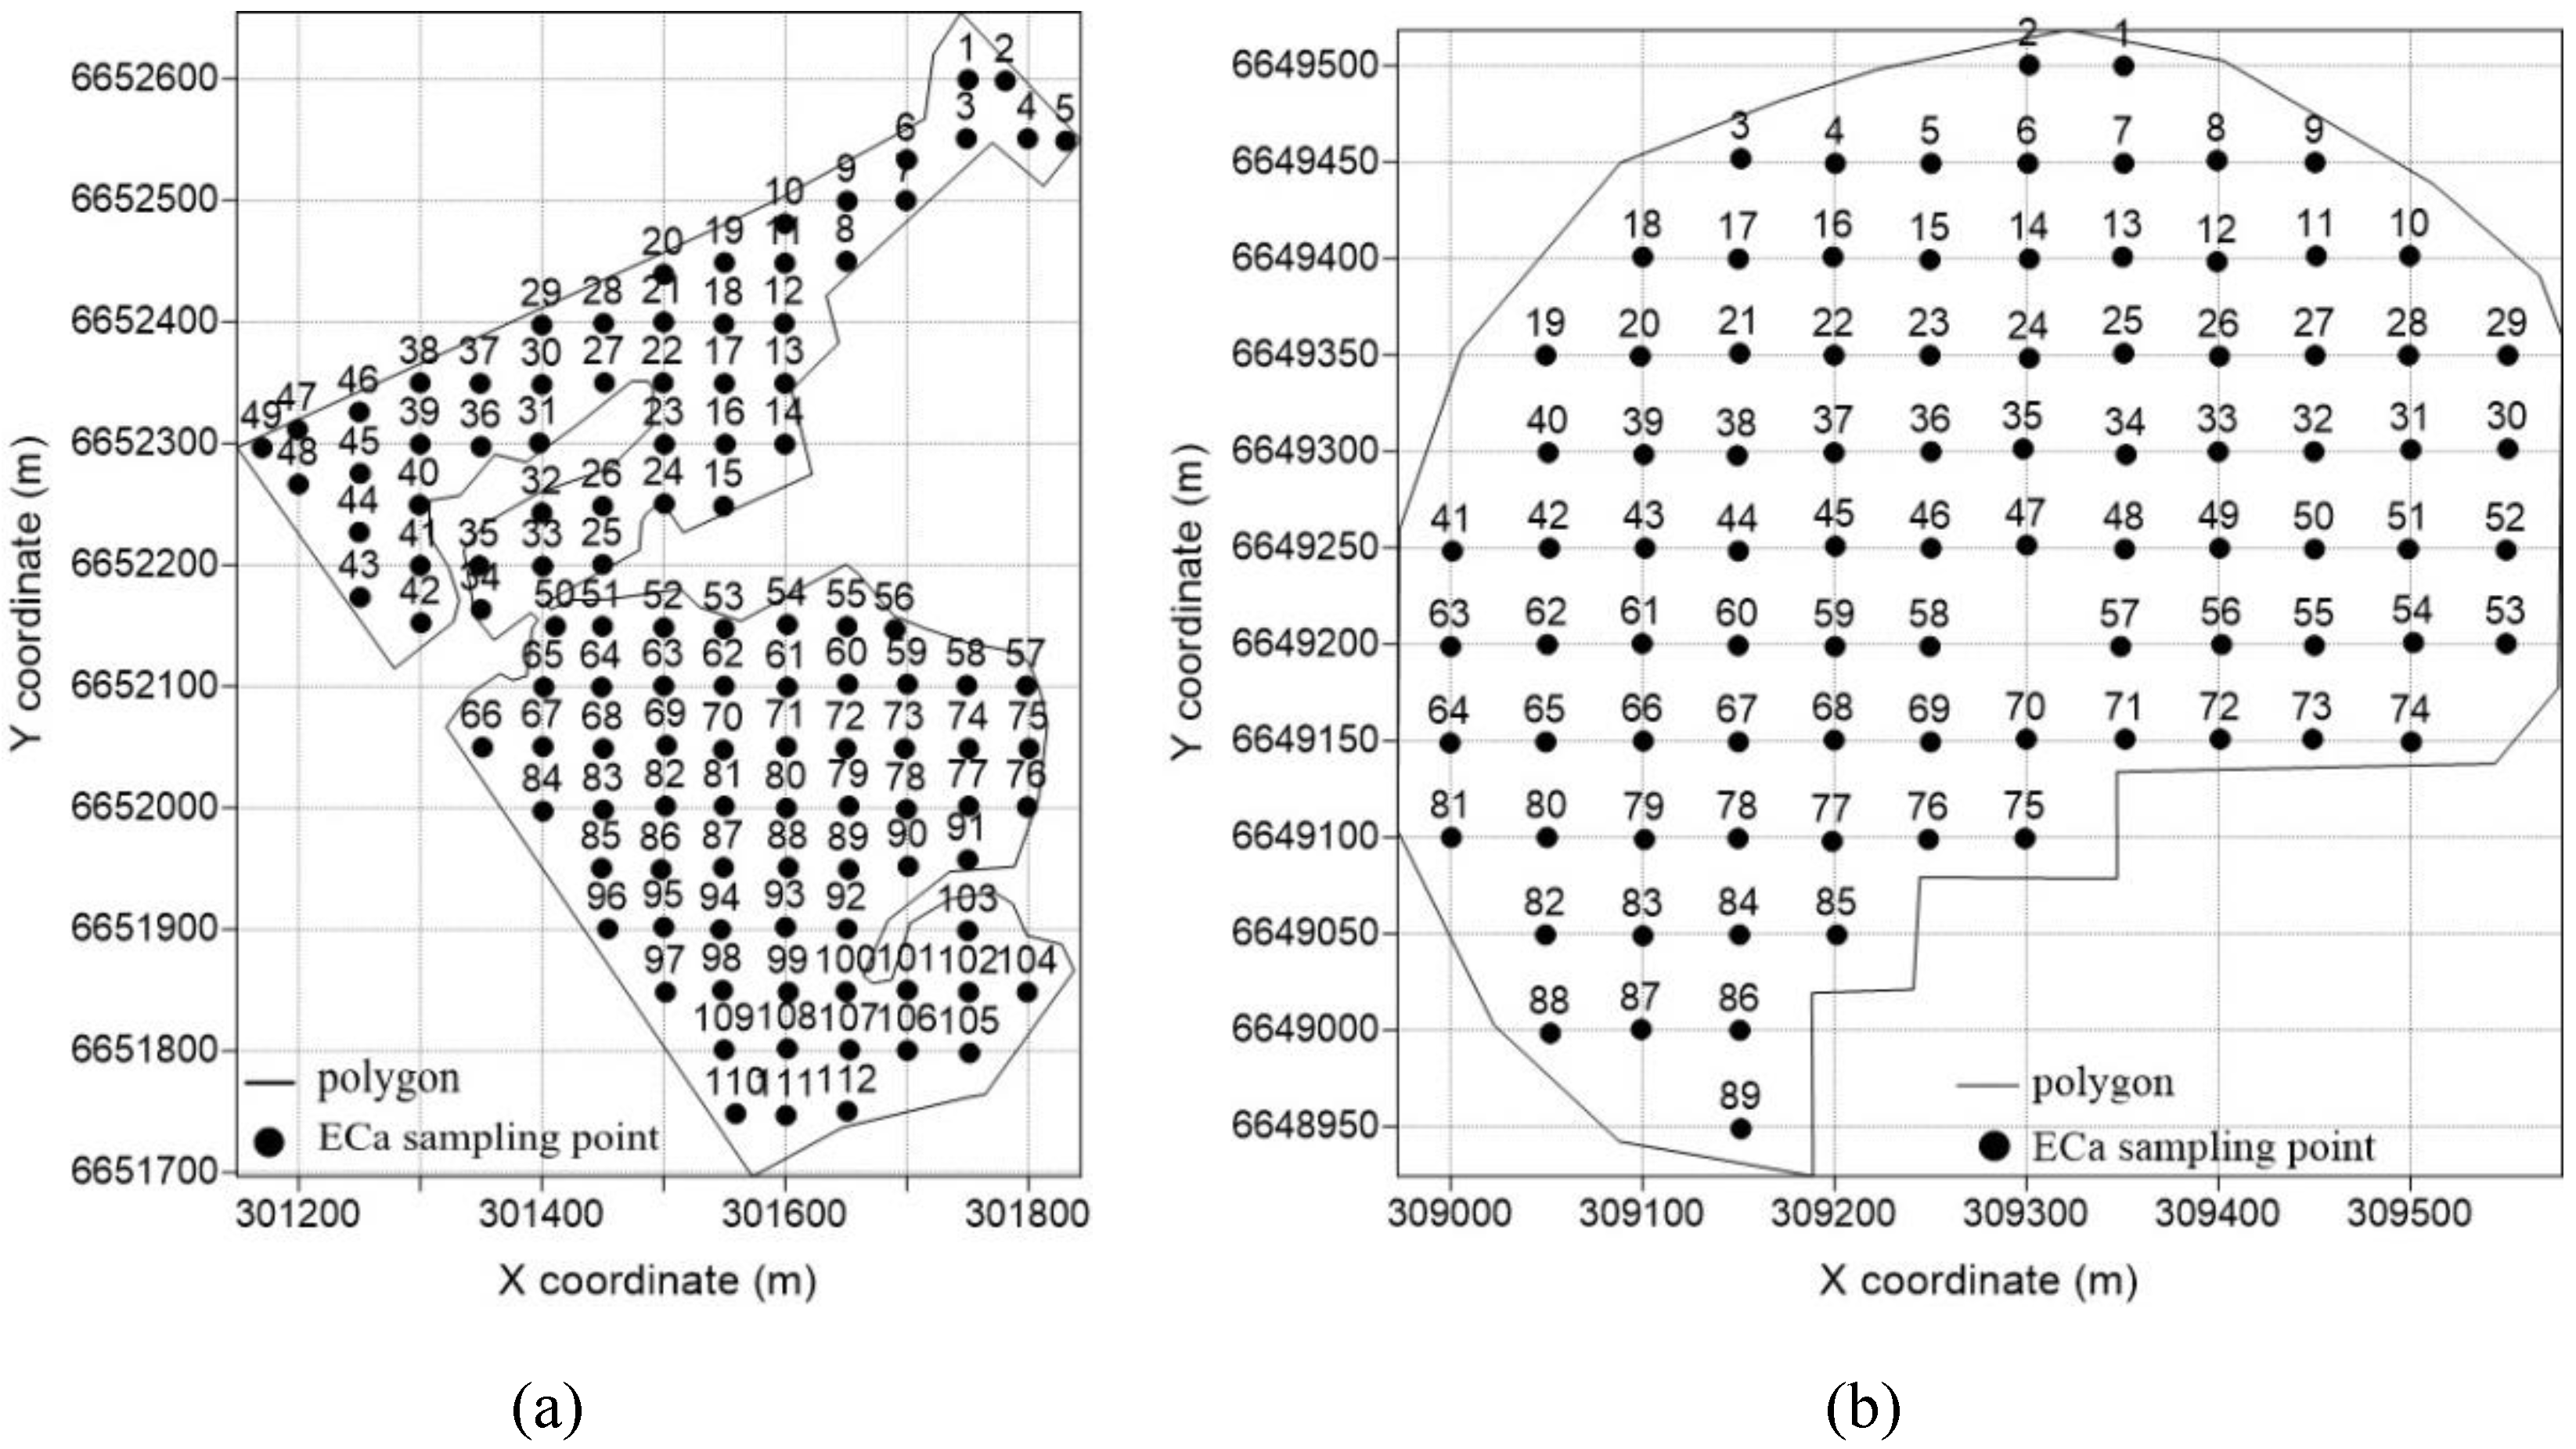
Figure 2.
Wenner matrix and portable electrical conductivity meter, assembled by Landviser®, model LandMapper® ERM-02 (image without scale).
Figure 2.
Wenner matrix and portable electrical conductivity meter, assembled by Landviser®, model LandMapper® ERM-02 (image without scale).
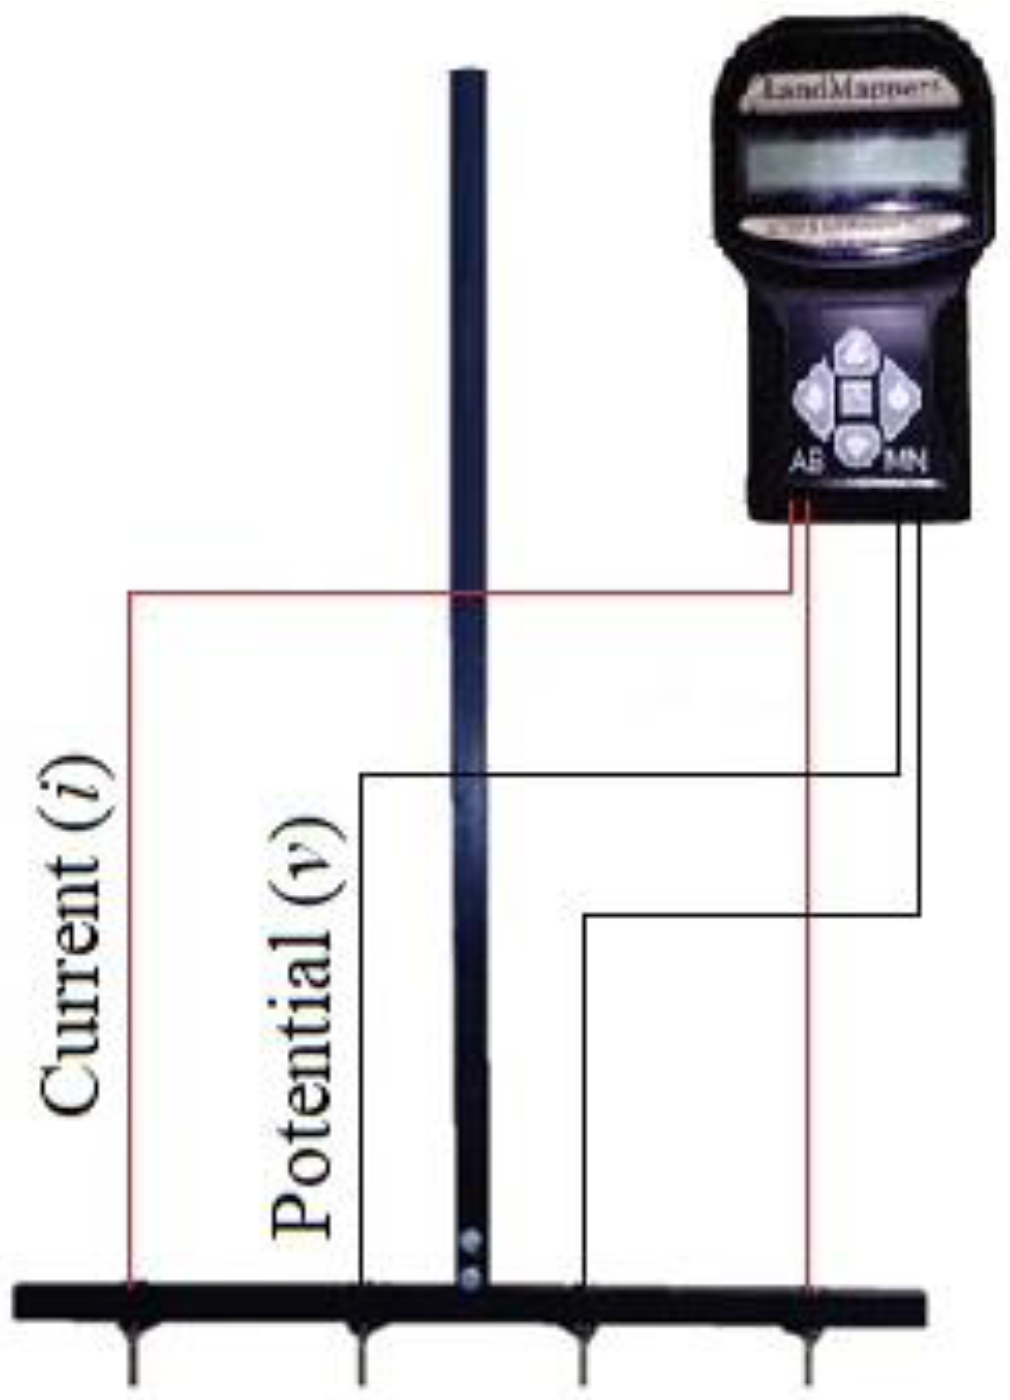
Figure 3.
Collection of undisturbed soil samples at depths of 0 – 0.1 m (a and b), at a depth of 0.1 – 0.2 m (c), and field soil sample preparation procedure to be taken to the laboratory (d). Cachoeira do Sul, RS.
Figure 3.
Collection of undisturbed soil samples at depths of 0 – 0.1 m (a and b), at a depth of 0.1 – 0.2 m (c), and field soil sample preparation procedure to be taken to the laboratory (d). Cachoeira do Sul, RS.
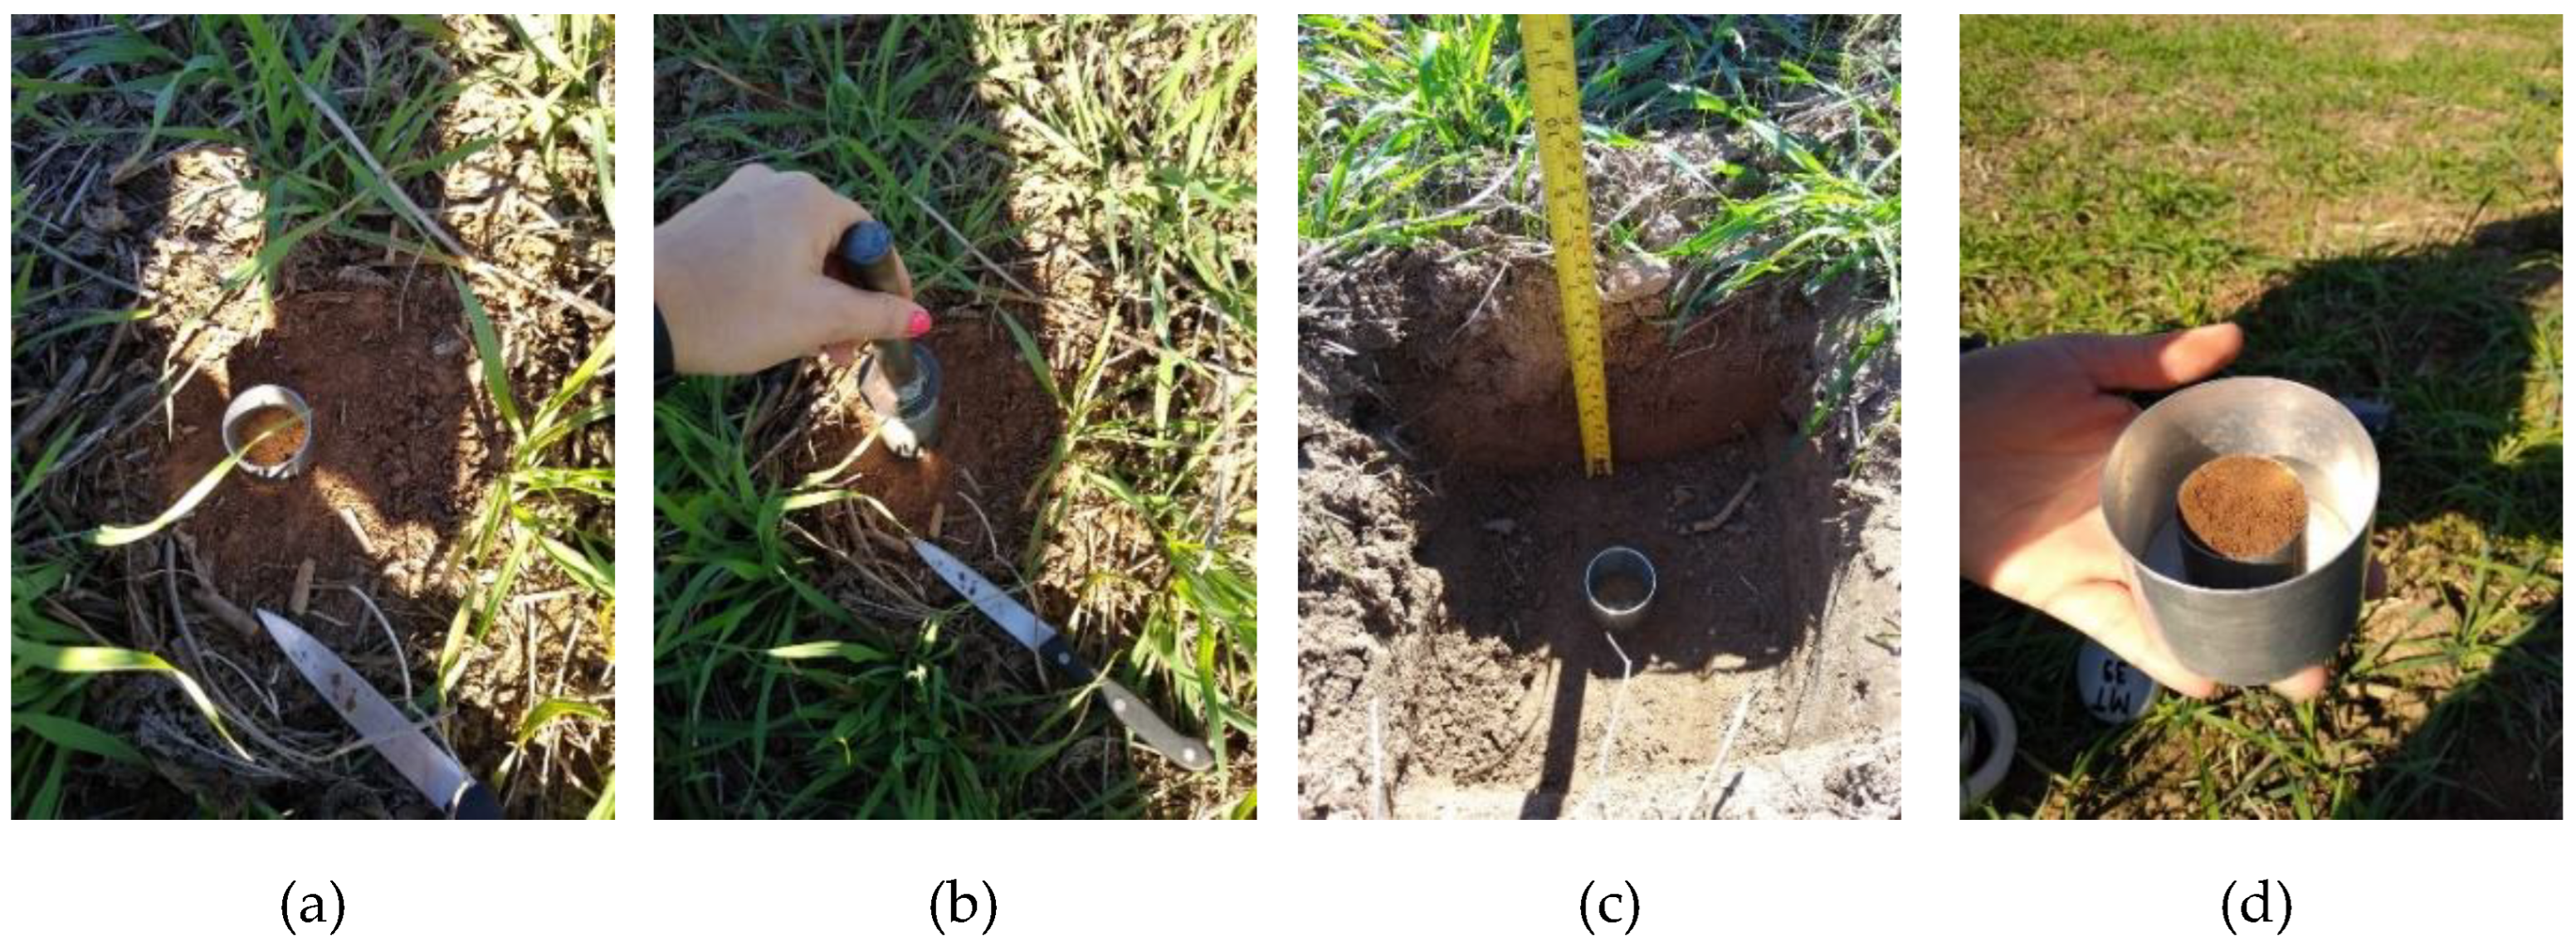
Figure 4.
Semivariograms, cross-validation plots and maps of spatial variability of ECa for the two fields selected. Adjustment parameters of the semivariograms: C0: Nugget effect; C0+C: Level; a: Range (m); r2: coefficient of determination. Cross-validation parameters: RC: regression coefficient; y: intercept; SEP: standard error of prediction; r2: coefficient of determination. Cachoeira do Sul, RS.
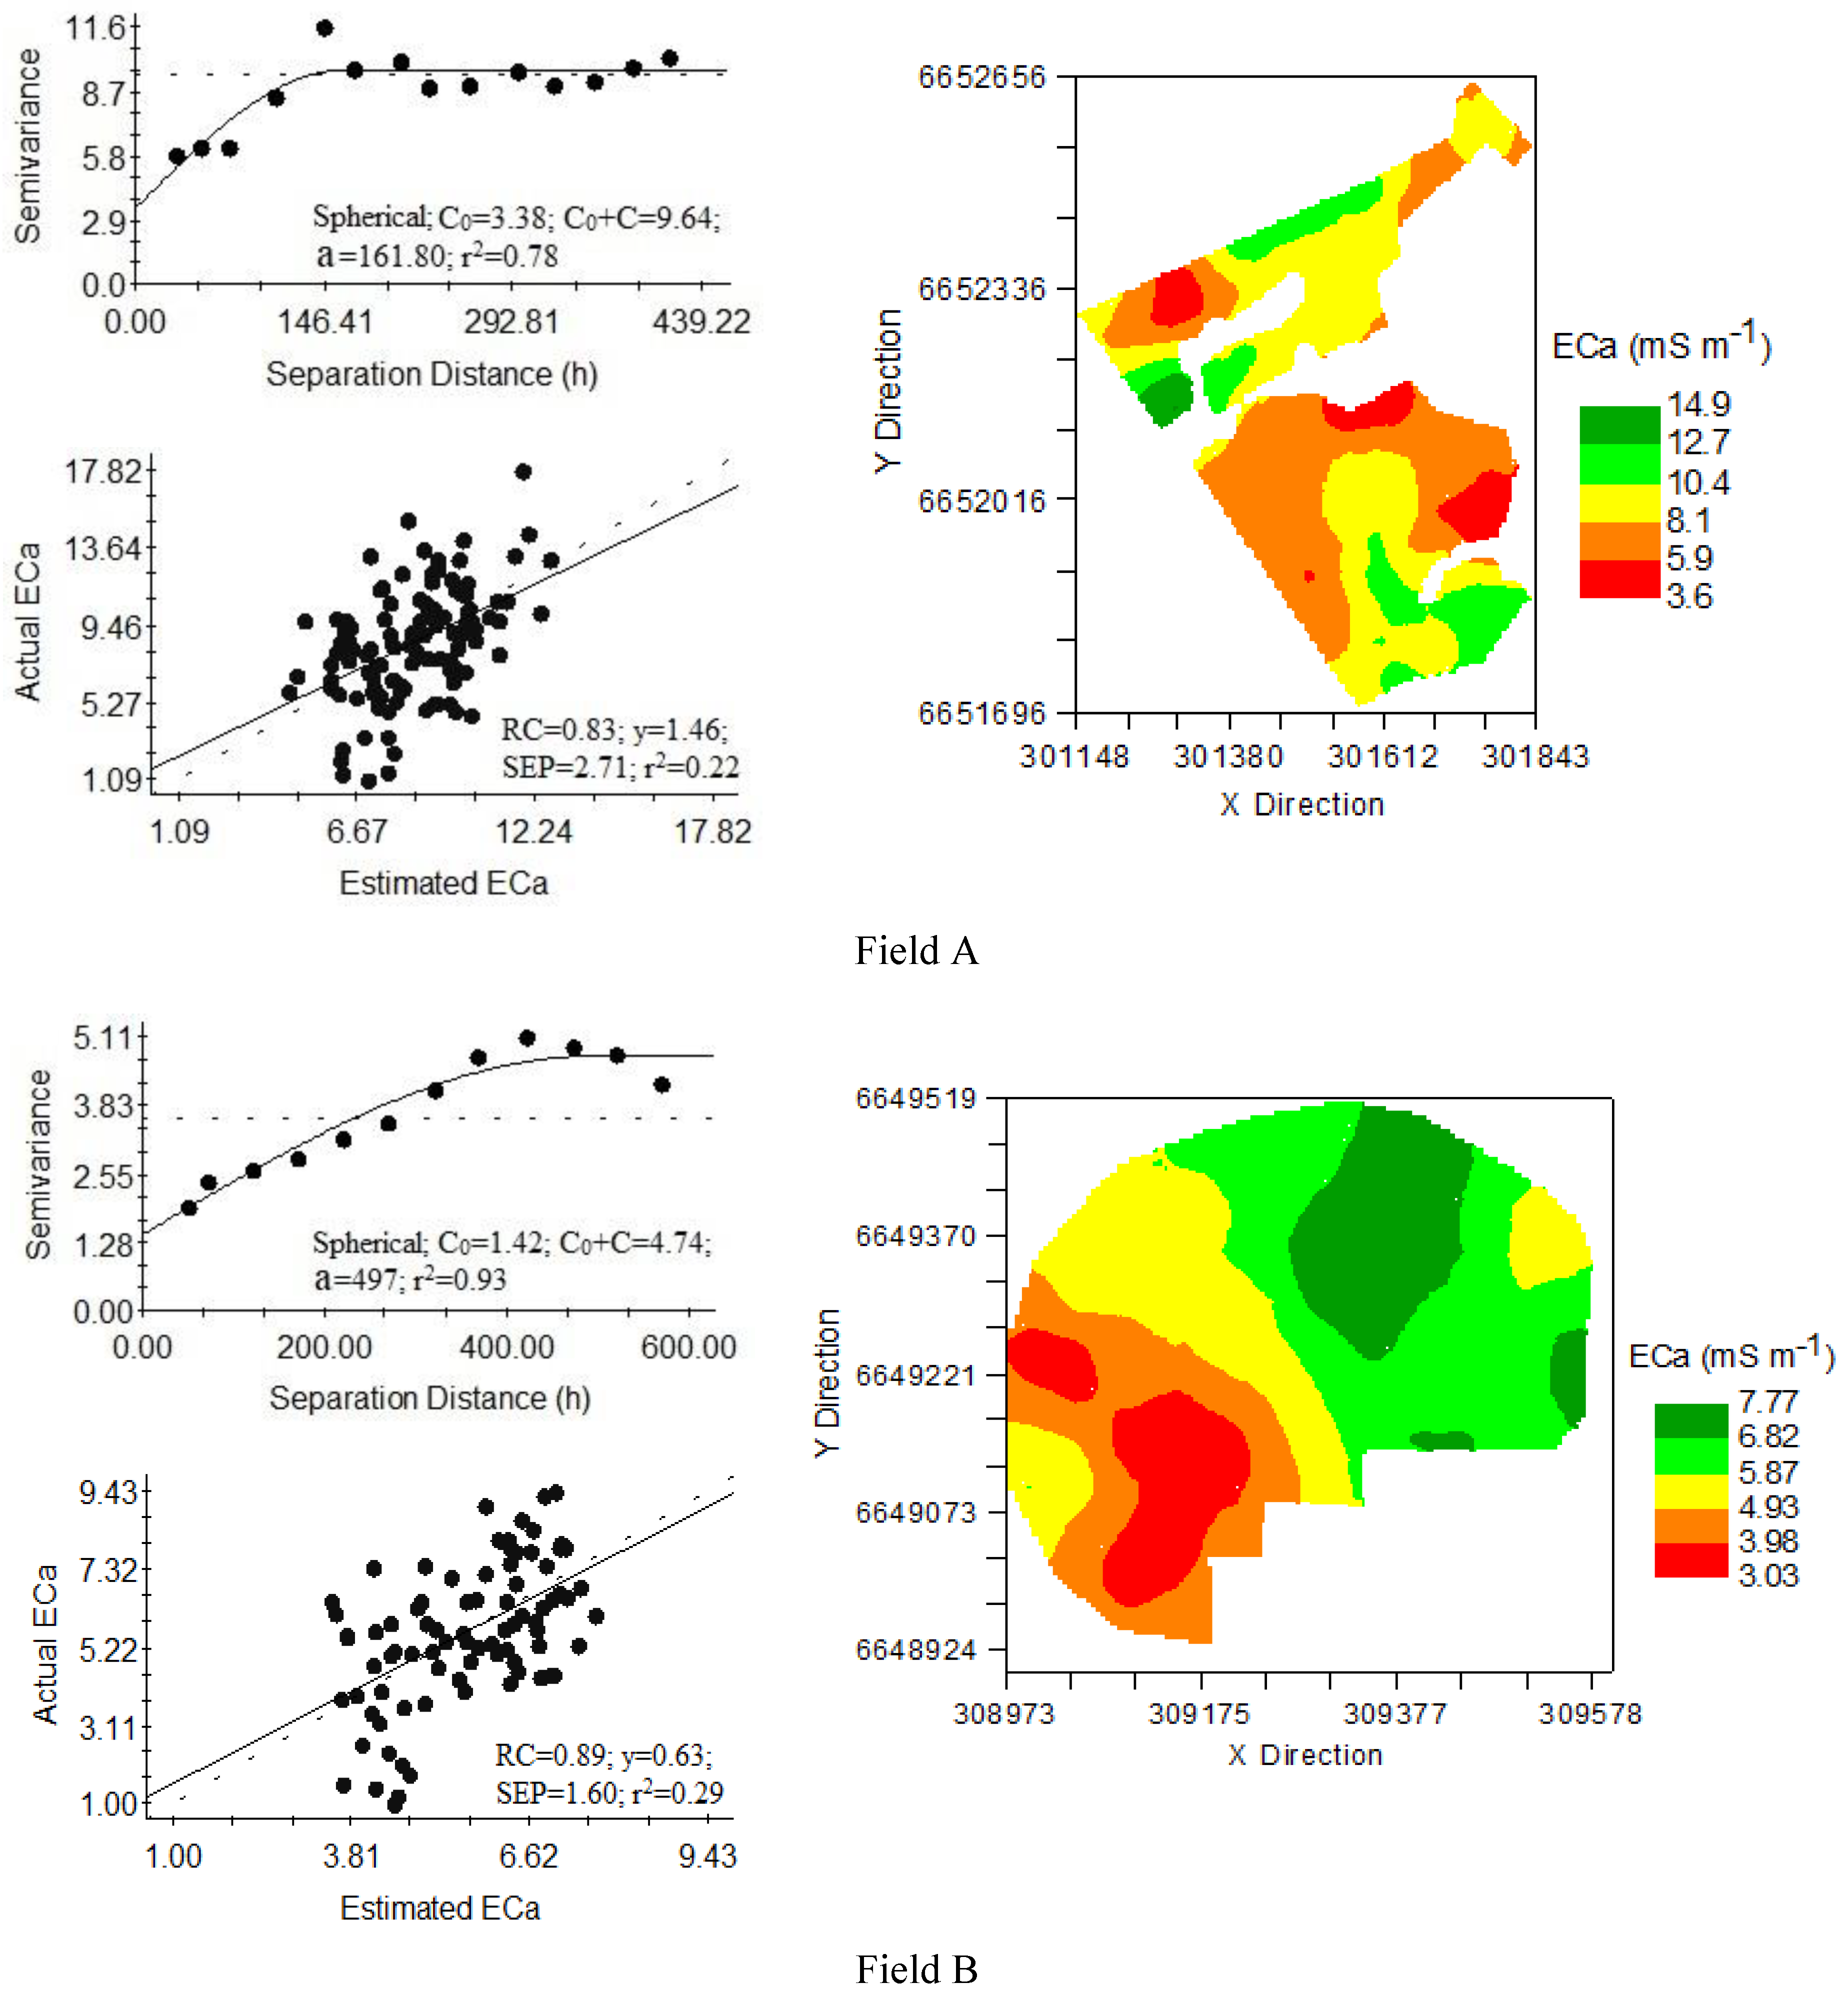
Figure 5.
Maps of management zones delimited based on the spatial variability of the apparent soil electrical conductivity in fields A (rainfeed) and B (irrigated by central pivot). Cachoeira do Sul, RS.
Figure 5.
Maps of management zones delimited based on the spatial variability of the apparent soil electrical conductivity in fields A (rainfeed) and B (irrigated by central pivot). Cachoeira do Sul, RS.
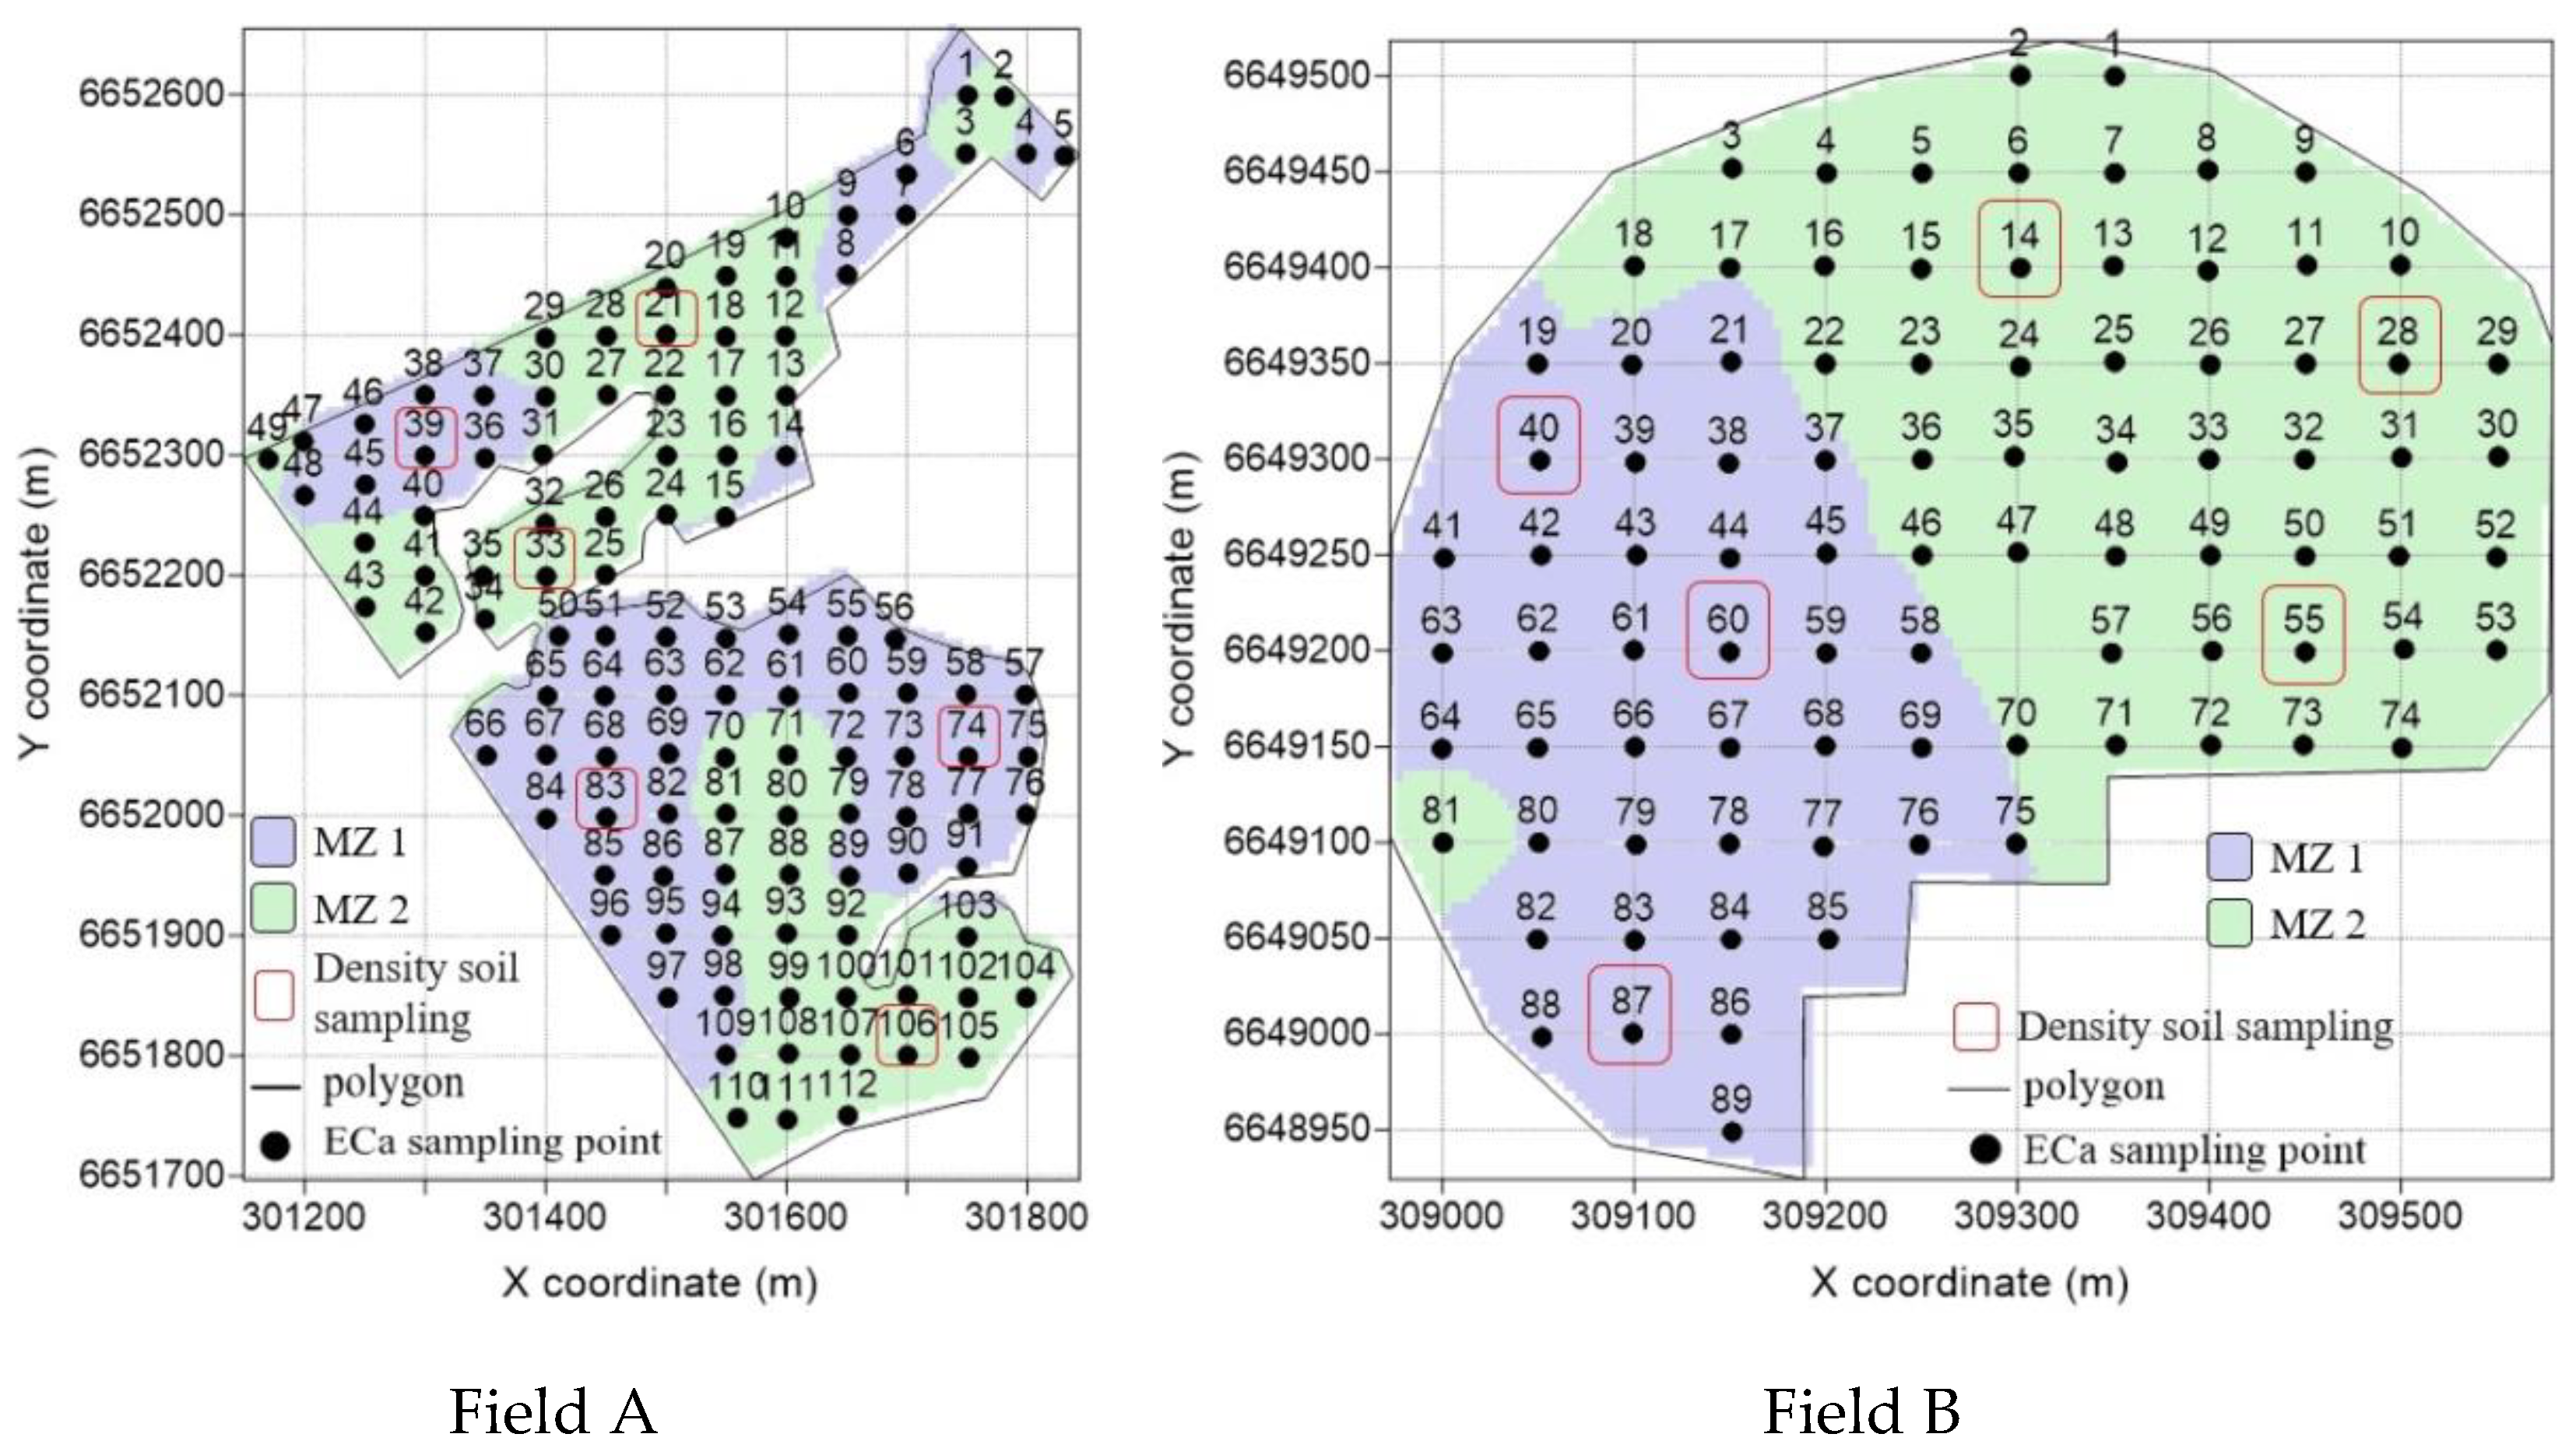

Table 1.
Descriptive statistics of soil attributes: Apparent soil electrical conductivity (ECa; mS m-1), soil bulk density (Sd; g cm-3), soil moisture (Sm, g g-1), sand, silt and clay contents, for the delimited management zones (MZ) in field A. Cachoeira do Sul, RS, BR.
Table 1.
Descriptive statistics of soil attributes: Apparent soil electrical conductivity (ECa; mS m-1), soil bulk density (Sd; g cm-3), soil moisture (Sm, g g-1), sand, silt and clay contents, for the delimited management zones (MZ) in field A. Cachoeira do Sul, RS, BR.
| Field | MZ | Attribute | Minimum | Mean | Maximum | Standard deviation | CV (%) |
|---|---|---|---|---|---|---|---|
| A | 1 | ECa (mS m-1) | 3.62 | 6.91 | 8.48 | 0.98 | 14.18 |
| Sd (0-0.1 m) | 1.31 | 1.34 | 1.38 | 0.04 | 3.05 | ||
| Sm (0-0.1 m) | 0.110 | 0.128 | 0.145 | 0.018 | 13.84 | ||
| Sd (0.1-0.2 m) | 1.50 | 1.53 | 1.56 | 0.03 | 1.94 | ||
| Sm (0.1-0.2 m) | 0.103 | 0.124 | 0.138 | 0.018 | 14.85 | ||
| Sand | - | 63 | - | - | - | ||
| Silt | - | 19 | - | - | - | ||
| Clay | - | 18 | - | - | - | ||
| 2 | ECa (mS m-1) | 8.49 | 10.05 | 14.94 | 1.12 | 11.14 | |
| Sd (0-0.1 m) | 1.40 | 1.46 | 1.54 | 0.08 | 5.21 | ||
| Sm(0-0.1 m) | 0.093 | 0.127 | 0.169 | 0.038 | 30.40 | ||
| Sd (0.1-0.2 m) | 1.61 | 1.67 | 1.73 | 0.06 | 3.75 | ||
| Sm (0.1-0.2 m) | 0.104 | 0.123 | 0.146 | 0.021 | 17.41 | ||
| Sand | - | 62 | - | - | - | ||
| Silt | - | 20 | - | - | - | ||
| Clay | - | 18 | - | - | - |
d.f.: degrees of freedom.
Table 2.
Descriptive statistics of soil attributes: Apparent soil electrical conductivity (ECa; mS m-1), soil bulk density (Sd; g cm-3), gravimetric soil moisture (Sm, g g-1), sand, silt, and clay content (%), for the management zones (MZ) delimited in Field B (irrigated by central pivot). Cachoeira do Sul, RS, BR.
| Fields | MZ | Attributes | Minimum | Mean | Maximum | Standard deviation | CV (%) |
|---|---|---|---|---|---|---|---|
| B | 1 | ECa (mS m-1) | 3.03 | 4.46 | 5.43 | 0.62 | 14.00 |
| Sd (0-0.1 m) | 1.25 | 1.35 | 1.54 | 0.16 | 12.12 | ||
| Sm (0-0.1 m) | 0.136 | 0.158 | 0.186 | 0.026 | 16.19 | ||
| Sd (0.1-0.2 m) | 1.61 | 1.64 | 1.66 | 0.03 | 1.67 | ||
| Sm (0.1-0.2 m) | 0.138 | 0.146 | 0.154 | 0.008 | 5.31 | ||
| Sand | - | 59 | - | - | - | ||
| Silt | - | 17 | - | - | - | ||
| Clay | - | 24 | - | - | - | ||
| 2 | ECa (mS m-1) | 5.44 | 6.43 | 7.77 | 0.58 | 8.97 | |
| Sd (0-0.1 m) | 1.26 | 1.46 | 1.62 | 0.18 | 12.29 | ||
| Sm(0-0.1 m) | 0.132 | 0.140 | 0.148 | 0.008 | 5.40 | ||
| Sd (0.1-0.2 m) | 1.65 | 1.74 | 1.81 | 0.08 | 4.87 | ||
| Sm (0.1-0.2 m) | 0.119 | 0.126 | 0.137 | 0.010 | 7.82 | ||
| Sand | - | 54 | - | - | - | ||
| Silt | - | 22 | - | - | - | ||
| Clay | - | 24 | - | - | - |
d.f.: degrees of freedom.
Table 3.
Test of means for bulk soil density (Sd; g cm-3), in each field investigated, according the management zones (MZ 1 and MZ 2) delineated based on apparent soil electrical conductivity. Cachoeira do Sul, RS, BR.
Table 3.
Test of means for bulk soil density (Sd; g cm-3), in each field investigated, according the management zones (MZ 1 and MZ 2) delineated based on apparent soil electrical conductivity. Cachoeira do Sul, RS, BR.
| Field | Soil Depth (m) | Soil Density (g cm-3) MZ 1 MZ 2 |
t-value | d.f. | p-value | |
|---|---|---|---|---|---|---|
| A | 0-0.1 | 1.34 | 1.46 | -2.42 | 4.00 | 0.07 |
| 0.1-0.2 | 1.53 | 1.67 | -3.39 | 4.00 | 0.03 | |
| B | 0-0.1 | 1.35 | 1.46 | -0.73 | 4.00 | 0.51 |
| 0.1-0.2 | 1.64 | 1.74 | -1.84 | 4.00 | 0.14 | |
d.f.: degrees of freedom; t-value = student test; p-value = significance.
Table 4.
Test of means for bulk soil density (Sd; g cm-3), in two management zones (MZ 1 and MZ 2) delineated based on apparent soil electrical conductivity, according fields. Cachoeira do Sul, RS, BR.
Table 4.
Test of means for bulk soil density (Sd; g cm-3), in two management zones (MZ 1 and MZ 2) delineated based on apparent soil electrical conductivity, according fields. Cachoeira do Sul, RS, BR.
| MZ | Soil Depth (m) | Soil Density (g cm-3) Field A Field B |
t-value | d.f. | p-value | |
|---|---|---|---|---|---|---|
| 1 | 0-0,1 | 1.34 | 1.35 | -0.18 | 4.00 | 0.86 |
| 0.1-0.2 | 1.53 | 1.64 | -4.80 | 4.00 | 0.01 | |
| 2 | 0-0.1 | 1.46 | 1.46 | 0.01 | 4.00 | 1.00 |
| 0.1-0.2 | 1.67 | 1.74 | -1.17 | 4.00 | 0.31 | |
d.f.: degrees of freedom; t-value = student test; p-value = significance.
Table 5.
Soil bulk density (Sd; g cm-3), in two fields (A and B), and two depths (0-0.10 m and 0.10-0.20 m) in management zone delineated based on apparent electrical conductivity. Cachoeira do Sul, RS, BR.
Table 5.
Soil bulk density (Sd; g cm-3), in two fields (A and B), and two depths (0-0.10 m and 0.10-0.20 m) in management zone delineated based on apparent electrical conductivity. Cachoeira do Sul, RS, BR.
| Fields | MZ | Sd by depths (0-0.1 m) ( 0.1-0.2 m) |
t-value | d.f. | p-value | |
|---|---|---|---|---|---|---|
| A | 1 | 1.34 | 1.53 | -6.71 | 4.00 | 0.00 |
| 2 | 1.46 | 1.67 | -3.71 | 4.00 | 0.02 | |
| B | 1 | 1.35 | 1.64 | -3.02 | 4.00 | 0.04 |
| 2 | 1.46 | 1.74 | -2.47 | 4.00 | 0.07 | |
d.f.: degrees of freedom; t-value = student test; p-value = significance.
Disclaimer/Publisher’s Note: The statements, opinions and data contained in all publications are solely those of the individual author(s) and contributor(s) and not of MDPI and/or the editor(s). MDPI and/or the editor(s) disclaim responsibility for any injury to people or property resulting from any ideas, methods, instructions or products referred to in the content. |
© 2023 by the authors. Licensee MDPI, Basel, Switzerland. This article is an open access article distributed under the terms and conditions of the Creative Commons Attribution (CC BY) license (http://creativecommons.org/licenses/by/4.0/).
Copyright: This open access article is published under a Creative Commons CC BY 4.0 license, which permit the free download, distribution, and reuse, provided that the author and preprint are cited in any reuse.


