
Submitted:
30 January 2023
Posted:
31 January 2023
You are already at the latest version
Abstract
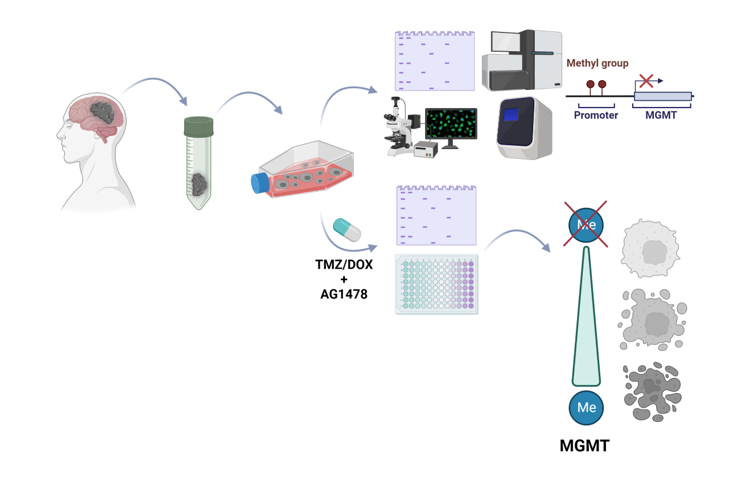
Glioblastomas (GBM) are most common, primary brain tumors in adults. Despite advances in neurosurgery, radio- and chemotherapy, the median survival of GBM patients is 15 months. Recent large-scale genomic, transcriptomic and epigenetic analyses have shown the cellular and molecular heterogeneity of GBMs, which hampers the outcomes of standard therapies. We have established 13 GBM-derived cell cultures from fresh tumor specimens and characterized them molecularly using RNAseq, immunoblotting and immunocytochemistry. Evaluation of proneural (OLIG2, IDH1R132H, TP53 and PDGFRα), classical (EGFR) and mesenchymal markers (CHI3L1/YKL40, CD44 and phospho-STAT3), as well as expression of pluripotency (SOX2, OLIG2, NESTIN) and differentiation (GFAP, MAP2, β-Tubulin III) markers revealed the striking inter-tumor heterogeneity of primary GBM cell cultures. Upregulated expression of VIMENTIN, N-CADHERIN and CD44 at mRNA/protein levels suggested increased epithelial to mesenchymal transition (EMT) in most studied cell cultures. The effects of temozolomide (TMZ) or doxorubicin (DOX) were tested in three GBM-derived cell cultures with different methylation status of the MGMT promoter. Amongst TMZ- or DOX-treated cultures the strongest accumulation of apoptotic markers: caspase 7 and PARP were found in WG4 cells with methylated MGMT suggesting that its methylation status predicts vulnerability to both drugs. As many GBM-derived cells showed high EGFR levels, we tested the effects of AG1478, an EGFR inhibitor, on downstream signaling pathways. AG1478 caused decreased levels of phospho-STAT3, thus inhibition of active STAT3 augmented antitumor effects of DOX and TMZ in cells with methylated and intermediate status of MGMT. Altogether, our findings show that GBM-derived cell cultures mimic the considerable tumor heterogeneity and identifying patient-specific signaling vulnerabilities can assist in overcoming therapy resistance, by providing personalized combinatorial treatment recommendations.
Keywords:
glioblastoma
; cancer stem cells
; EMT
; MGMT
; temozolomide
; doxorubicin
; STAT3
; EGFR inhibitor (AG1478)
1. Introduction
Glioblastoma (GBM) is the most common, primary brain tumor that is considered as one of the most aggressive malignant human tumors. Despite maximal safe resection followed by radiation with adjuvant chemotherapy, the average survival is 15 months after diagnosis as more aggressive tumors recur typically within 6 months after therapy [1]. Temozolomide (TMZ) is an alkylating drug widely used as a first-choice chemotherapeutic agent in GBM [2], however, 50% of patients develop the resistance to TMZ, which restricts an effective treatment. The O6-methylguanine-DNA methyltransferase (MGMT) is responsible for removing the methyl group from O6-methylguanine in DNA thereby diminishing the overall efficacy of TMZ. MGMT expression, determined by a CpG methylation status of the MGMT gene promoter, is an important factor in predicting the response to TMZ treatment [3,4]. Hypermethylation of the MGMT promoter results in decreased expression of the MGMT protein and has been shown to correlate with prolonged survival of GBM patients. In contrast, tumors with unmethylated MGMT (with increased MGMT activity) commonly exhibit resistance to TMZ. The epigenetic status of MGMT became a crucial predicting factor of TMZ effectiveness [5,6]. Nevertheless, many other molecular mechanisms can contribute to TMZ resistance, such as other DNA repair systems, epigenetic modifications, aberrant signaling pathways or molecular- and cellular heterogeneity in malignant glioma [7,8]. Therefore, there is an urgent need to discover a novel approach to increase the glioma cell sensitivity to TMZ and other drugs.
Anthracycline antibiotic doxorubicin (DOX) is one of the most common chemotherapeutics used in the treatment of various solid and blood cancers [9,10]. Previous studies have shown the DOX-related toxicity to cultured glioma cells [11]. Moreover, DOX was an effective anti-glioma agent in animal models of malignant gliomas [12,13]. Unfortunately, DOX has a low penetration of blood brain barrier (BBB), and causes side effects in healthy tissues, including dose-limiting cardiotoxicity. Various formulations such as nanoparticles, liposomes, exosomes and polymer conjugates were developed to improve transport of DOX through BBB and achieve the desired concentration of the drug within tumors [14,15,16,17,18]. Additionally, complementary approaches including combinatory treatment and/or intra-tumoral delivery of DOX to GBM, had been used in GBM therapy to reduce cytotoxicity in normal tissue [15,17,19].
GBM is characterized by high inter- and intra-patient heterogeneity. Integrated genomic and transcriptomic analyses identified clinically relevant subtypes of GBMs, referred to as: classical (CL), mesenchymal (MES), neural (NE), and proneural (PN). These subtypes are tightly associated with genomic abnormalities. Platelet-derived growth factor receptor alpha (PDGFRA) amplifications and isocitrate dehydrogenase 1 (IDH1) as well as Tumor protein 53 (TP53) gene mutations were most frequently found in the PN group. The epithelial growth factor receptor (EGFR) alterations were found in the CL group, and neurofibromin 1 (NF1) gene abnormalities were preferentially grouped in MES GBMs. Moreover, the response to aggressive therapy differs by a subtype, with the greatest benefits in the CL subtype and no benefits in the PN subtype [20]. These subtypes also vary within the same tumor specimen, as multi-region tumor sampling has shown co-existence of multiple subtypes in different regions of the same tumor. These subtypes can change over time and through therapy. Single-cell RNA-sequencing (scRNA-seq) indicated that distinct cells in the same tumor recapitulate programs from distinct subtypes [21,22,23]. Studies by Patel et al. [22] showed that cells from the same tumor had variable ‘stemness’ and expressed different receptor tyrosine kinases (RTKs). Markedly, several studies indicated the presence of different cells, including glioma stem cells (GSCs) (also called tumor-initiating cells), within a tumor and their contribution to tumor growth, recurrence, and resistance to radio- and chemotherapies [24,25,26,27].
Receptor tyrosine kinases (RTKs) are the most commonly altered genes in adult GBMs (67%) [28]. The amplifications and mutations of EGFR are detected in about half of GBM tumors and in 95% of CL-GBMs [28,29,30]. Amplification of EGFR is often accompanied by the appearance of a EGFR variant III (EGFRvIII), which lacks the extracellular domain, causing a ligand-independent constitutive activity [31,32]. EGFR and its downstream signaling networks contribute to GBM cell proliferation and diffused invasion [33]. Due to frequency of EGFR aberrations, many EGFR-targeting therapies are in development or in clinical trials for many different types of tumors, including GBMs [34,35]. Although EGFR kinase inhibitors had shown initial success in other tumors (e.g non-small lung cancer) [36], EGFR inhibitors, such as gefitinib and erlotinib, failed to assist in GBM therapy, demonstrating insignificant outcome in clinical trials [37,38,39]. Among mechanisms of therapy resistance to EGFR inhibitors are: PTEN (phosphatase and tensin homolog) alterations, deregulated PI3K (phosphatidylinositol 3-kinase) pathway [38,40], compensatory signaling pathways, tumor heterogeneity and ineffective BBB penetration [41]. A better understanding of the EGFR signaling network and its interrelations with other pathways is essential to improve drug activity, clarify the mechanisms of resistance, and develop better therapeutic agents. EGFR and its constitutively activated variant EGFRvIII transduce signals via classical RTK pathways: the RAS/mitogen activated protein kinase (MAPK)/extracellular signal–regulated kinase (ERK, the phosphatidylinositol 3-kinase (PI3K)/protein kinase B (PKB/AKT), the Janus kinas (JAK)/STAT, and the protein kinase C (PKC) [35].
Signal transducer and activator of transcription 3 (STAT3) is an oncogenic transcription factor [42] regulating the transcription of several genes involved in cell cycle progression, resistance to apoptosis, angiogenesis, invasiveness and immune escape [43,44,45]. GBM patients with high levels of activated (phosphorylated) STAT3 have more aggressive disease and poorer clinical outcomes [46]. Interestingly, activated STAT3 is abundant in patient-derived GSC [47,48]. Inhibition of STAT3 phosphorylation or STAT3 knockdown decreased viability of glioma cells, including GSCs and slowed disease progression of GSC orthotopic xenografts in mice [49,50,51,52]. Constitutively activated STAT3 is frequently co-expressed with EGFR in high-grade gliomas and targeting STAT3 sensitizes glioma cells to anti-EGFR (Iressa/gefitinib) and alkylating agents [53]. Concurrent inhibition of EGFR and JAK2/STAT3, with afatinib and pacritinib, abrogated elevated STAT3 signaling detected upon EGFR inhibition in patient-derived GSCs. Combinatorial treatment was highly effective in a panel of molecularly heterogeneous GSC and in orthotopic EGFRvIII GSC xenografts [54]. Afatinib (a second generation of EGFR-inhibitor) combined with TMZ synergistically inhibited cell proliferation, clonogenicity, invasion and motility of cultured glioma cells expressing EGFRvIII and prevented progression of intracranially implanted U87-MG EGFRvIII cells [55]. Cetuximab (an anti-EGFR antibody) augmented radiation and chemotherapy effects in GBM cells in vitro and in vivo [56,57]. TMZ and cetuximab were tested in a phase I/II clinical trial of primary GBMs [58]. Depatuxizumab mafodotin (ABT-414), an EGFR-targeting antibody–drug conjugate [59], selectively killed tumor cells overexpressing wild-type or mutant forms of EGFR and provided significant therapeutic benefit in a GBM xenograft model [60].
DOX conjugated with ultrasmall nanoparticle shows a significant efficacy in patient-derived xenografts harboring EGFR mutations and/or amplification after intravenous administration [19]. The anti-EGFR-doxorubicin-loaded immunoliposomes (ILs-DOX) displayed highly efficient binding and internalization in a panel of EGFR and EGFRvIII overexpressing cells [61,62]. Recently, a small trial with anti-EGFR ILs-DOX on relapsed GBMs with EGFR amplification showed positive response in one patient [63].
The lack of effective conventional GBM therapy encourages researchers to search for new therapeutic strategies based upon the combination of repurposed drugs. We investigated the effectiveness of an EGFR inhibitor AG1478 in combination with TMZ or DOX using molecularly diverse patient-derived cell cultures, especially with a different status of MGMT. We established a quick and reliable method for generating patient-derived primary glioma cell cultures from fresh-resected glioma tissues and performed their molecular characterization. Our study demonstrated that targeting EGFR signaling together with TMZ or DOX decreased cell viability and induced apoptosis of GBM-derived cells with methylated or intermediate status of MGMT. Mechanistic studies revealed that although AG1478 inhibits phosphorylation of STAT3 in patient-derived cells, it was not sufficient to sensitize primary cells with the unmethylated MGMT promoter. These data defines cell-type specific responses to the EGFR inhibitor in combination with TMZ or DOX and indicates a role of the MGMT promoter methylation in predicting cell responses to chemotherapeutics.
2. Materials and Methods
2.1. Cell cultures and treatments
WG0, WG1, WG3, WG4, WG5, WG6, WG9, WG10, WG13, WG14, WG15, WG16, WG16, WG17, WG18, WG19 primary glioma cultures originated from surgically resected glioblastoma samples (grade 4, according to WHO 2016 classification) [64]. The use of tissues was approved by the Research Ethics Board at Institute of Psychiatry and Neurology in Warsaw, Poland and informed consents were obtained from the patients. All methods were carried out in accordance with the relevant guidelines and regulations. Freshly resected tumor tissues were washed in Hank’s balanced sodium solution (HBSS; Gibco Invitrogen, Switzerland) and subjected to mechanical and enzymatic dissociation using Neural Tissue Dissociation Kit (Miltenyi Biotec, Germany) according to the manufacturer’s instructions. Some samples were processed without enzymatic digestion, in favor of accurate tissue cutting in DMEM/F12 medium until a smooth milky single cell suspension was achieved. To remove undissociated pieces and debris cell suspension was filtered through a 100 and 40 micron cell strainer. The blood cells were discarded during serial passage and medium exchange, instead of using Lympholyte-M [65]. Tumor cells were re-suspended in DMEM/F-12 medium (Gibco Invitrogen, Switzerland) supplemented with 10% fetal bovine serum for adherent cultures, or DMEM/F-12 serum-free medium for sphere cultures, and plated at a density of 1–2 × 10⁶ cells/T75 flask. 50% of the fresh medium was replaced every 4 days.
The L0125, and L0627 GBM GSC lines were provided by Dr Rossella Galli (San Raffaele Scientific Institute, Milan, Italy) [66]. L0125 and L0627 were expanded in vitro in serum-free medium for sphere culture.
Normal human astrocytes (NHA) were purchased from Lonza (Walkersville,, USA) and cultured in ABM Basal Medium (Lonza) supplemented with 3% fetal bovine serum, 1% L-glutamine, 0.1% ascorbic acid, 0.1% human EGF, 0.1% gentamicin, and 0.0025% recombinant human insulin.
NTERA-2 cl.D1 were purchased from ATCC (Manassas, USA) and cultured in DMEM with GlutaMax-1 and supplemented with 10% fetal bovine serum.
All cell cultures were grown in a humidified atmosphere of CO2/air (5%/95%) at 37 °C.
2.2. Sphere cultures and material collection
For sphere cultures, cells were seeded at a low density (3000 viable cells/cm2) onto non-adherent plates and cultured in serum-free DMEM/F-12 medium, supplemented with 2% B27 (Gibco Invitrogen, Switzerland), 20 ng/mL recombinant human bFGF (Miltenyi Biotec, Germany), 20 ng/mL recombinant human EGF (StemCell Technologies, Canada), 0.0002% heparin (StemCell Technologies, Canada) and antibiotics (100 U/mL penicillin, 100 µg/mL streptomycin, Gibco Invitrogen, Switzerland). 25% of the medium was replaced every 3 days. After 7-14 days of culturing, the spheres were collected by centrifugation at 110 × g and lysed in Qiagen RLT lysis buffer for RNA isolation or lysed in buffer supplemented with complete protease inhibitor cocktail (Roche Applied Science, USA) for blotting.
2.3. Cell treatments
Temozolomide (TMZ), doxorubicin (DOX) and AG1478 (AG) were dissolved in DMSO. Cells were treated with single drugs: TMZ (1 mM) for 72 h, DOX (50-1000 nM) for 48 h and AG (10 µM) for 6 h, or with combination of TMZ+AG (1 mM + 10 µM) for 72 h, and DOX+AG (500 nM + 10 µM) for 48 h. DMSO was added at respective concentrations and served as a control condition.
2.4. Cell viability assays
Cell viability was evaluated using MTT metabolism test, as described previously [67]. Briefly, 1.5-2 x10⁴ cells were seeded onto 24-well plates and the MTT solution (0.5 mg/mL; Sigma-Aldrich, Germany) was added after 24, 48, 72 and 96 h after cell seeding. After 1 h of incubation at 37 °C, water-insoluble formazan was dissolved in DMSO and optical densities were measured at 570 nm and 620 nm using a scanning multi-well spectrophotometer. Cell viability after AG, DOX or TMZ treatments was evaluated using the PrestoBlue Cell Viability Reagent (Invitrogen, USA). Diluted PrestoBlue reagent was added to each well for 1.5 h at 37 °C. After collecting samples fluorescence was measured at 570 nm and 620 nm using a multi-well spectrophotometer.
2.5. Immunoblotting
Whole cell lysates were prepared in a buffer containing phosphatase and protease inhibitors, separated by SDS-PAGE and transferred onto nitrocellulose membranes as described [68]. After blocking with 5% nonfat milk in a blocking buffer, the membranes were incubated overnight with primary antibodies and then with the appropriate secondary antibodies for 1 h. Immunocomplexes were visualized using an enhanced chemiluminescence detection system (SuperSignal West Pico PLUS; ThermoFisher Scientific, USA). Blots were visualized with a Chemidoc imaging system (Bio-Rad, USA). The molecular weight of proteins was estimated with prestained protein markers (Sigma-Aldrich, USA).
2.6. Immunofluorescence
Cells were seeded onto glass coverslip at a density of 2-3x10⁴ cells. After 24 h cells were fixed with 4% PFA pH 7.2, washed, permeabilized with 0.1% Triton-X100 and blocked in a mix of 2% donkey serum and 1.5% fetal bovine serum, followed by overnight incubation with primary antibodies diluted in PBS containing 1% bovine serum albumin (BSA) and 0.1% Triton X-100. Cells were then washed in PBS, incubated with Alexa Fluor A555 secondary antibodies diluted in PBS for 2 h, counterstained with DAPI and mounted. For reagent specifications, catalogue numbers, and concentrations, see Supplementary Table S1.
2.7. Scratch-wound assay
Cells were seeded onto 60-mm culture dishes at a density of 8×10⁴ cells, in duplicates. When cells reached 80% confluency, a scratch was gently made using a p200 pipette tip. The pictures of the area were taken immediately after a wound was inflicted to the cells (0 h) and after 18 h. Migration rate was estimated from the distance that the cells moved, as determined microscopically. The area between the edges of the wound was measured by using Image J software. The six measurements were taken for each experimental condition. A mobility rate is expressed as percentage of wound closure as compared to 0 h time point. Migration rates were calculated using the following equation: (initial distance-final distance/initial distance) × 100%.
2.8. Bisulfite DNA conversion and methylation-specific polymerase chain reaction (MS-PCR)
DNA was extracted using standard phenol/chloroform methods. A purity and concentration of DNA were estimated by measuring absorbance at 260/280 nm. DNA (2 μg) was treated with bisulfite (EpiTect Bisulfite Kit, Qiagen, Germany). The modified DNA was amplified using primers specific for the methylated or unmethylated MGMT gene promoter, as listed in Supplementary Table S1. Each PCR mixture contained 1 μL of DNA, 500 nM of primers, 1x reaction buffer containing 1.5 mM MgCl2, and 1 U HotStarTaq DNA Polymerase and 250 mM dNTPs (Promega, USA). PCR was performed with thermal conditions as follows: 95 °C for 10 min, 45 cycles of 95 °C for 30 s, 57 °C for 30 s and 72 °C for 30 s with a final extension of 72 °C for 10 min. PCR products were visualized using Agilent TapeStation system (Agilent Technologies, USA) yielding a band of 81 bp for a methylated product and 93 bp for an unmethylated product. Positive methylated and positive unmethylated controls (EpiTect PCR Control DNA Set Qiagen, Germany) were included.
2.9. Quantitative RT-PCR Analysis
Total RNA was extracted using an RNeasy Mini kit (Qiagen, Germany) and purified using RNeasy columns. An integrity of RNA was determined using an Agilent 2100 Bioanalyzer. For qRT-PCR, total RNA from cells was used to synthesize cDNA by extension of oligo (dT)15 primers with SuperScript reverse transcriptase (Thermo Fisher Scientific, USA). Real Time PCR experiments were performed in duplicates using a cDNA equivalent of 22.5 ng RNA in a 10-μl reaction volume containing 2x SYBR Green Fast PCR Master Mix (Applied Biosystems, Germany) and a set of primers. Sequences of the primers are listed in Table S1. Data were analyzed by the relative quantification method using StepOne Software (Applied Biosystems, Germany). The expression of each product was normalized to 18S rRNA and presented as a dCt value.
2.10. mRNA library preparation and sequencing
Quality and quantity of isolated nucleic acids were determined by Nanodrop (Thermo Fisher Scientific, Waltham, MA, USA). mRNA libraries were prepared using KAPA Stranded mRNAseq Kit (Roche, Switzerland/Kapa Biosystems, USA) according to manufacturer’s protocol. Briefly, mRNAs were enriched from 500 ng total RNAs using poly-T oligo-attached magnetic beads (Kapa Biosystems, USA). Enriched mRNA was fragmented, then the first and second strand of cDNA were synthesized. Adapters were ligated and the loop structure of each adapter was cut by USER enzyme (NEB, USA). Finally, the amplification of obtained dsDNA fragments that contained a specific adapter sequence was performed using NEB starters. Quality control of final libraries was performed using Agilent Bioanalyzer High Sensitivity dsDNA Kit (Agilent Technologies, USA). Concentration of the final libraries was measured using Quantus Fluorometer and QuantiFluor ONE Double Stranded DNA System (Promega, USA). Libraries were sequenced on HiSeq 1500 (Illumina, USA) on the rapid run flow cell with a paired-end settings (2x76bp).
2.11. RNA-seq data alignment, processing, and analysis
Data analysis: RNA sequencing reads were aligned to the human genome reference with the STAR algorithm [69], a fast gap-aware mapper. Then, gene counts were obtained by featurecounts [70] using human transcriptomic annotations. The counts were then imported to R and processed by DESeq2 [71]. The counts were normalized for gene length and library size.
TCGA public data analysis: TCGA level 3 RNAseq data (aligned by STAR and gene expression counted by HTseq) were uploaded to R. Data from TCGA GBM (glioblastoma, WHO grade 4) and LGG (lower-grade gliomas, WHO grades 2/3) repositories were uploaded. Gene expression values as FPKM (fragments per kilobase of exon per million) were used for further analysis. The curated sets of genes characteristic for each GBM subtype, categorized originally by Verhaak et al. [20], were downloaded from the Molecular Signatures Database v7.5.1. The analysis for the following gene sets was performed VERHAAK_GLIOBLASTOMA_PRONEURAL, VERHAAK_GLIOBLASTOMA_NEURAL, VERHAAK_GLIOBLASTOMA_CLASSICAL, VERHAAK_GLIOBLASTOMA_MESENCHYMAL.
2.12. Statistical analysis
All biological experiments were performed on 3-4 independent cell passages. Results are expressed as means ± standard deviation (SD). P-values were calculated using two-tailed t test or one-way ANOVA followed by appropriate post-hoc test using GraphPad Prism v6 (GraphPad Software, USA). Differences were considered statistically significant for p values < 0.05.
The effect size, Cohen’s ‘d’ and Hedge’s ‘g’, were calculated as follows: , . - mean of the group, - error mean square, - sample size.
3. Results
3.1. Generation and phenotypic characterization of patient-derived glioma cell cultures
Patients-derived cell cultures represent more reliable cellular models for testing new cytotoxic drugs in comparison to commercially available established cell lines. Thus, we aimed to establish primary cell cultures from freshly resected high- or low-grade gliomas. Following dissociation of the tissue, cells were cultured in the presence of serum as adherent cells or in defined serum-free media as spheres. We generated adherent cell cultures for the vast majority of glioma samples, whereas only two tumor samples gave rise to spheres, enriched in GSCs. Cell cultures after subsequent 8 passages with unchanged proliferation were considered as glioma cell lines. Three culture cells (WG0, WG3 and WG6) underwent two passages and stopped growing. Altogether, we established 13 GBM-derived cell lines out of 16 WHO high-grade surgical specimens. We managed to developed two cell lines from a WHO grade 1 tumor, and two cell lines from WHO grade 2 or 3 tumors. Information concerning age, sex and histopathological diagnosis of patients is presented in the table (Supp. Figure 1). The mean age of men was 65 and 45 in case of women (Figure 1b). Our studies have shown that GBMs were more frequent in men than in women in a 1.67:1 proportion (Figure 1a, b). Sex differences in GBM incidence have been previously reported [72,73,74].
GBMs are characterized by fast growth due to enhanced proliferation capacity, thus we analyzed doubling time of 13 patient-derived cell cultures (Figure 1c, d) within 4 days. Cells with the doubling time lower than 60 h were considered as highly proliferating cells, where as those dividing every 60-150 h were designated as intermediate proliferating cells. Finally cell lines with doubling time higher than 150 h were labeled as slowly proliferating cells. Among the cultures only WG4 and WG9 cells had a high proliferative index. Most of the cells were intermediate-proliferating cells, with the average doubling time of 100 h. WG18, WG10, WG2 and WG1 were slowly dividing cells. There was no correlation between doubling time of patient-derived cell cultures and patient age (Figure 1c, d; Supp. Figure 1). Doubling time of normal human astrocytes (NHA), used as a non-malignant control, was approximately 150 h. Contrary, the proliferation rate of commercial glioma cell lines: U251, U87-MG, LN229 and LN18 was 57, 43, 41 and 40 h, respectively. These results indicated that established glioma cell lines, commonly used in cancer research, grew faster than primary glioma cell cultures.
For better characterization of primary cell cultures, we applied the RNAseq analysis. Previous comprehensive analyses of gene expression profiles identified four subtypes of glioblastoma, referred as PN, MES, CL, and NE [20]. In the current study the unsupervised analysis of mRNA expression profiles was performed to compare 13 GBM-derived primary cell cultures with TCGA (The Cancer Genomic Atlas) datasets [20]. The results were mapped into a 2-dimensional space using PCA (principal component analysis) analysis. The resulting PCA (data not shown) showed a clear separation of low and high-grade gliomas in TCGA dataset, and primary GBM-derived cell cultures were more similar to high-grade gliomas in terms of transcriptional profiles. Gliomas from TCGA and the primary glioma cell cultures clustered separately(data not shown).
Next, we attempted to assign each individual primary GBM cell culture to four molecular subclasses. Most of the patient-derived cell cultures represented mixed subtypes, without a dominant gene expression signature, with the exception of WG13 and WG17 showing mostly the MES signature, and WG4 and WG14 represented by mixed, PN and CL subtypes (Figure 1e). Further, we performed cell culture subtyping by assessing protein expression, as previously demonstrated [75,76]. We analyzed levels of seven proteins by Western blotting (Figure 1f, g). Detection of mutant IDH1R132H, and high levels of TP53 and PDGFRα had suggested the PN subtype, high levels of EGFR evidenced the CL subtype, and high levels of CHI3L1/YKL40, CD44 and phospho-STAT3 were typical for the MES subtype. We found that WG4, WG14 and WG17 were positive for the mutant IDH1R132H and TP53, but had low expression of PDGFRα. High levels of EGFR were detected in approximately 50% of tumor cell cultures (WG0, WG1, WG2, WG4, WG9, WG10, WG13, WG18). Immunoblot analysis with antibodies specifically recognizing mesenchymal markers demonstrated elevated CD44 levels in all tested glioma cell cultures, whereas high expression of CHI3L1/YKL40 was found only in WG4 and WG14 cells. Elevated levels of phosphorylated STAT3 (active form of STAT3) were observed in WG9, WG10, WG13, WG14, WG18 primary glioma cell lines. The global gene profiling and protein-based classification of primary glioblastoma cell cultures revealed thatWG4 and WG14 could be classified into PN subtype, however, exome sequencing of the WG4 cells did not detect any mutation in IDH1(data not shown).
3.2. Stem cell capacity of WG4 and WG14 cells
GBMs contain a rare population of glioma stem-like cells (GSCs, also called glioma-initiating cells) with capacities of self-renewal, multi-lineage differentiation, and resistance to therapies [25]. The expression of selected pluripotency and differentiation markers was examined. Transcriptomic analysis revealed high expression of both type of markers in WG4 and WG14 cells in comparison to other primary cell cultures (Figure 2a). We found high expression of pluripotency markers such as PROM1, OLIG2, SOX2 and NESTIN (a marker of neural precursors), as well as overexpression of markers for astrocytes (GFAP, S100) and neurons (MAP2, TUBB3). These results were validated by quantitative RT-PCR analysis, Western blotting and immunostaining (Figure 2b-e). High expression of GFAP at mRNA and protein level was observed not only in WG4 and WG14 but also in WG9, WG10, WG13 and WG17 cell cultures. Interestingly, these cell cultures exhibited high expression of TUBB3, SOX2 and NESTIN mRNA. Elevated levels of GFAP, b-Tubulin III, SOX2 and NESTIN proteins were detected in WG9, WG13, WG17 cells (Figure 2b-e, Supp. Figure2). Using Western blotting analysis and immunostaining we did not detect the OLIG2 protein expression in all tested glioma cell lines growing in serum-containing media (data not shown). Overexpression of both pluripotency and differentiation markers was observed in the same cell lines and confirmed that the tumor cells are aberrantly differentiated. Moreover, these results revealed the inter- and intra-tumor heterogeneity of GBM-derived cell cultures.
To obtain a subpopulation enriched in GSCs, cells were cultured at low density, without serum and in the presence of epidermal growth factor (EGF) and fibroblast growth factor (bFGF). We found that only two primary cell cultures, WG4 and WG14, were capable of forming spheres, as evidenced by using light microscopy (Figure 3a, Supp. Figure 3; [68]. We have previously shown high expression of NANOG, POU5F1, SOX2 and PROM1 in WG4 spheres [68]. Here, we demonstrate that GCSs-enriched spheres from WG14 expressed significantly higher levels of OLIG2 and lower levels of astrocytic (GFAP) and neuronal (b-Tubulin III) markers as compared to the adherent tumor cells (Figure 3b-c). Similar profiles were demonstrated in other GSCs originating from human GBMs (L0125 and L0627 cell lines) [66,77]. L0125 and L0627 spheres quickly attached to the cell cultures plates and branched out in serum-containing medium. Increased expression of GFAP and b-Tubulin III were observed upon addition of serum containing media (Figure 3b-c). Interestingly, all studied glioblastoma-derived spheres (WG14, L0125, L0627) did not expressed NANOG and OCT4A, an essential transcription factors that regulate self-renewal and pluripotency of embryonic stem cells [78]. NTERA-2 cells, a pluripotent human embryonic carcinoma cell line [79], were NANOG, OCT4A and SOX2-positive (Figure 3b-c). These results confirmed that GBM-derived spheres are lineage-restricted cells that could eventually become the terminally differentiated cells [80]. Indeed, the presence of serum in the culture medium increased the levels of astrocytic and neuronal markers, however high expression of neural stem and precursor markers such as NESTIN and SOX2 was also observed (Figure 3b-c).
3.3. EMT markers/regulators and migratory properties of patient-derived glioma cell cultures
During epithelial to mesenchymal transition (EMT) cells acquire mesenchymal features, represented by increased motility and invasive capabilities. Growing evidence supports a critical role of EMT in tumor progression [81,82]. Although gliomas do not undergo the classical EMT program, the majority of molecules involved in EMT play a role in the glial to mesenchymal transition, GMT [83]. Upon induction of EMT-like changes, a subpopulation of glioma cells becomes highly motile, resistant to treatment, and invades the surrounding parenchyma generating micrometastasis [84]. The analysis of RNAseq data from TCGA databases showed significant upregulation of genes encoding mesenchymal markers and EMT regulators such as CDH2 (coding N-cadherin), VIM (coding Vimentin), SNAIs and TWISTs in tumor samples, particularly in high-grade human gliomas (grade 4) and in the mesenchymal subtype GBM (Supp. Figure 4a-b). The CDH1 expression (coding E-cadherin) was relatively low, and the lowest level was found in mesenchymal subtype GBMs (Supp. Figure 4a-b). The analysis of survival data revealed that patients with low expression of CDH2, VIM, SNAIs and TWISTs live longer compared with those of high expression (Supp. Figure 4c).
We analyzed the expression of EMT-related genes in GBM-derived cell cultures. We chose the top 30 genes from the web-based EMTome portal [85]. The presented heatmap shows different expressions of EMT gene signature in primary cell cultures (Supp. Figure 5a). Interestingly, the mesenchymal markers such as VIMENTIN and CD44 were upregulated at mRNA and protein levels in all tested cell cultures (Figure 1f, Figure 4a, Supp. Figure 5b). Elevated level of CDH2 was found in GBM-derived cells (Supp. Figure 5b). Immunoblot analysis showed higher levels of N-CADHERIN in some glioblastoma cell cultures, WG0, WG4, WG5, WG13, WG14, WG15 and WG17 (Figure 4a-b). The expression of CDH1 (an epithelial marker) was low in tested cell lines (Supp. Figure 5b). The analysis of EMT-inducing transcription factors showed elevated level of SNAIL in WG4, WG9, WG13 cells and similar level of SLUG in the most of studied cell cultures with the exception of WG4 cells having the highest SLUG protein level (Figure 4a-b). EMT induces migratory and invasive capabilities of tumor cells [86], thus we determined the migratory properties of human GBM-derived cell cultures using scratch assay. A majority of cell lines (WG1, WG2, WG4, WG10, WG13, WG15, WG16, WG17 and WG19) needed less or 18 h for closuring 30-50% of the wound (Figure 4c, Supp. Figure 5c). Scratch assay confirmed that the majority of GBM-derived cells have high migratory capacity.
3.4. Evaluation of anti-tumor effects of TMZ or DOX on human glioma-derived cells
Before studying responses of human GBM-derived cell cultures to TMZ, we performed the analysis of the MGMT promoter methylation status in 12 cell cultures. MGMT methylation was measured by using methylation specific (MS)-PCR which showed the unmethylated MGMT gene promoter (MGMT expressed) in 7 cell cultures (WG1, WG5, WG9, WG15, WG16, WG17 and WG19 cells), whereas the methylated MGMT promoter (MGMT non-expressed) was found only in WG4 cells. The intermediate status of the MGMT, both methylated and unmethylated, was found in WG10, WG13, WG14 and WG19 cell cultures (Figure 5a-b). We tested TMZ effects on GBM-derived cells with different status of the MGMT gene promoter: WG4 (the methylated MGMT promoter), WG14 (the intermediate status of MGMT) and WG9 (the unmethylated MGMT promoter). These cells were exposed to 1 mM TMZ for 72 h and a cell viability, as well as apoptotic markers were determined. Viability of glioma cells was significantly reduced after TMZ up to 75% (Figure 5c-d). The strongest accumulation of the cleaved caspase 3, caspase 7 and the fragment of PARP was found in TMZ-treated WG4 cells. The cytotoxic effect of TMZ was less prominent in WG14 cells, whereas WG9 cells were the resistant to the treatment (Figure 5e-f).
Next we inquired if cells would be sensitive to doxorubicin (DOX), a well-known cytotoxic drug. DOX was added to cells at different concentrations (50-1,000 nM) for 48 h (Supp. Figure 7). DOX reduced cell viability in a dose-dependent manner, with 25% of WG9 cells and 50% of WG4 and WG14 cells killed after drug administration. These results showed the resistance of WG9 primary cultures to DOX in contrast to other cell cultures. The half-maximal-effective concentration (EC50) values were calculated for WG4, WG14 and WG9 cells and were 1.09, 1.47 and 1.85 mM, respectively (Supp. Figure 7). Evaluation of caspase-cascade protein levels showed that WG4 cells were more sensitive to the drug in contrast to WG14 and WG9 cells (Figure 7a-b). Altogether, the results support the notion that the MGMT promoter methylation defines cell responses to TMZ or DOX treatment.
3.5. Activation of EGFR signaling pathway modifies the response of human glioma-derived cells to TMZ and DOX
EGFR amplification and/or overexpression was found in about half of all primary GBMs [29,30]. Due to the minor effect of TMZ or DOX alone on glioma cell viability, we explored if blocking EGFR tyrosine kinase with the specific inhibitor AG1478 (AG) would modify the cell response to TMZ or DOX. First, the effects of inhibition of EGFR on glioma cells were analyzed (Figure 6a-b).
AG efficiently blocked EGFR activation in WG4, WG14 and WG9 cells, as evidenced by reduction of phospho-EGFR levels (Figure 6a-b). Interestingly, treatment with AG for 6 h resulted in the reduction of phospho-STAT3 levels without decreasing phospho-ERK and phospho-AKT levels, and altering total ERK and AKT levels (Figure 6a-b; Supp. Figure 6b). Cell viability was not affected after exposure to AG for 6 h (Supp. Figure 6a), however the longer exposure (72 h) significantly reduced viability of WG4 and WG14 cells (Figure 6c). To study if AG sensitizes to TMZ-induced cell death, we calculated the effect size (Hedge’s g) for single, AG, TMZ, and the combined AG+TMZ treatment. Hedge’s g = 0.2, 0.5, and 0.8 often is cited as indicative of a small, medium and large effect size, respectively. The effects for WG4 were as follow: AG (4.5), TMZ (1.5), AG and TMZ (4.9); for WG14: AG (3.0), TMZ (2.7), AG and TMZ (3.6) and for WG9: AG (0.3), TMZ (0.2), AG+TMZ (0.5). Notably in all cell lines we observed synergistic effects of AG+TMZ and decreased cell viability. WG9 cells were resistant to the treatments. The analysis of apoptosis markers confirmed that the combined treatment with AG+TMZ results in the strongest accumulation of the cleaved caspase 7 and PARP in WG4 cells in comparison to WG14 and WG9 cells (Figure 6 d-e). While phospho-STAT3 levels were reduced in AG+TMZ treated cells, levels of phospho-ERK and phospho-AKT were not affected in treated cell cultures (Supp. Figure 6d-e).
Similar results were obtained after the AG+DOX treatment (Figure 7c). We calculated the effect size (Hedge’s g) for all of the treatments to determine the effectiveness of treatments. The effects on WG4 were as follow: AG (1.7), DOX (0.7), AG+DOX (1.8); for WG14: AG (2.0), DOX (2.3), AG+DOX (2.9) and for WG9: AG (0.8), DOX (0.4), AG+DOX (1.0). A synergy between AG and DOX was visible in the tested cell lines, with the minor effect on WG9 cells. Markedly, the analysis of cell death markers by Western blotting confirmed those results (Figure 7d-e). The accumulation of cleaved caspase 7 and cleaved PARP was found in WG4 and WG14 cells but not in WG9 cells.
4. Discussion
Glioblastomas are the most malignant tumor types of central nervous system (CNS) that remain incurable with the standard therapies [87,88], therefore new therapeutic approaches are needed. Due to slow pace and high costs of a new drug discovery, repurposing of Food and Drug Administration (FDA)-approved drugs becomes an attractive strategy [89,90]. Currently, several active agents, such as chlorpromazine (antipsychotic agent), imipramine (antidepressant), chloroquine (anti-malarial drug), metformin (anti-diabetic drug) or disulfiram (alcohol-abuse drug) are being investigated for their effects on GBM cells [91,92,93,94,95,96]. Moreover, better superior outcomes may be achieved by combining different targeted therapies [97].
GBM is currently treated with the Stupp protocol, which combines surgery followed by radiotherapy and chemotherapy with TMZ [98]. However, at least 50% of patients do not respond to the treatment, which ultimately leads to tumor recurrence [99]. MGMT, an endogenous DNA repair enzyme, is often considered as the most important contributor in TMZ resistance due to it’s direct role in counteracting of DNA alkylation damage [100]. Moreover, the deregulation of specific molecular pathways, including EGFR pathway, may contribute to TMZ/drug resistance. EGFR pathway has been extensively studied in GBM, due to common mutation and amplification of EGFR gene [28,29,30]. Several strategies were proposed to inhibit EGFR or its mutant EGFRvIII including small-molecule tyrosine kinase inhibitors, monoclonal antibodies and anti-tumor vaccines. Unfortunately, anti-EGFR therapies have shown negligible efficacy in clinical trials [97].
We sought to investigate the effectiveness of EGFR inhibitor AG1478 in combination with TMZ or with anthracycline, DOX, which is one of the most widely used chemotherapeutic drug against many cancers. We used molecularly diverse patients-derived primary GBM cell cultures, characterized by a different status of MGMT promoter methylation.
While established cell lines have failed to demonstrate accurate genomic representations of the original tumors, patient-derived tumor cells or xenografts accurately reflect the molecular characteristics of the patient’s tumor and offer possibility of testing the response to a large number of compounds in multiple doses, or in combination with other drugs [101].
The development and maintenance of a patient-derived glioma cell culture is challenging and time consuming [65,102]. We introduced a simplified and modified procedure to culture both adherent cells growing in a medium containing serum and GSCs growing in a serum-free medium supplemented with growth factors. The blood cells were removed during serial passages and medium exchanges. We generated 13 adherent cell cultures out of 16 GBM specimens, including sphere cultures, enriched in GSCs. The analysis of selected stem and differentiation marker expression could explain the low efficiency of obtaining sphere cultures. We found that only WG4 and WG14 cells had high expression of pluripotency markers such as PROM1, OLIG2, SOX2 and NESTIN (a marker of neural precursors), which are responsible for self-renewal of GSCs [103,104]. Expression of astrocytic (GFAP, S100) and neuronal (MAP2, TUBB3) markers was found in the same cells, suggesting that glioma cells undergone aberrant differentiation. Our data indicate that GBM-derived spheres represent a lineage-restricted progeny that expressed neural stem and precursor markers (NESTIN, SOX2 and OLIG2), but without expression of NANOG and OCT4A, an essential transcription factors that regulate self-renewal and pluripotency of embryonic stem cells [78], which is in agreement with recent findings [24,80,105]. Interestingly, we generated two cell lines from a WHO grade 1 tumor, and two cell lines from a grade WHO 2/3 tumor [106]. Creating patient-derived models of lower-grade gliomas (LGG) is challenging [107]. Virtually all LGG cell lines generated to date from adult patients represent oligodendroglioma WHO grade 3 [108,109,110,111], thus impeding in vitro studies of LGGs.
It has been shown that GSCs closely mirror the phenotype and genotype of primary tumors, rather than serum-cultured cell lines [112]. However, due to the low number of obtained neurosphere cultures from fresh GBM samples, we decided to analyze serum-cultured cells at the lowest passages. Passaging the cells as little as possible prevents genetic or epigenetic alterations keeping them close to the original tumor [113]. Markedly, primary GBM-derived cell cultures we developed were more similar to high grade gliomas from TCGA than to LGG in terms of transcriptional profiles (data not shown).
Our comprehensive analysis of gene expression profiles and protein levels, revealed high intertumoral heterogeneity among GBM-derived cell cultures. We found that most of the patient-derived cell cultures represented mixed subtypes, without dominant gene expression signature. While a MES subtype was the dominant subtype in WG13 and WG17 cells, WG4 and WG14 cells were characterized by PN and CL signatures. Interestingly, hierarchical clustering revealed that WG4, WG14 and WG9 cell cultures were very similar to each other. CL and PN subtypes had a profile characteristic of highly proliferative cells [20,114] and indeed WG4, WG9, WG14 cells had a high proliferation index.
Transcriptional analysis is not routinely feasible in clinical setting, therefore a simplified method based on the IHC expression of some proteins was proposed [75,76,115,116]. In this study, we evaluated seven proteins (EGFR, PDGFRa, IDH1R132H, TP53, CHI3L1/YKL40, CD44 and phSTAT3) as molecular markers for GBM subtyping. More than a half of the cultures had high levels of EGFR (CL markers) and phosphorylated/active form of EGFR was found in WG4, WG9 and WG14 cells. The correlation between EGFR mutation and phosphorylation of tyrosine 845 or 1068 has been previously shown in cancer cells [117]. WG4, WG14 and WG17 cells were positive for the mutant IDHR132H, therefore they would be assigned as grade 4 astrocytoma according to the current WHO classification published in 2021 [118]. The anti-IDH1R132H-specific monoclonal antibody is more sensitive than direct DNA sequencing [119]. Increased TP53 protein level in WG4, WG14 and WG17 cells suggests non-functional TP53, as wild-type TP53 is rapidly degraded and mutant forms are stabilized in tumor cells [120]. This is consistent with recent reports [20,28], showing that gliomas grade 4 with IDH1 hotspot mutations harbor concurrent TP53 mutations. High expression of TP53 and mutant IDH1 mutation did not correlate with high level of PDGFRa, elevated in a half of tumor cell cultures. High expression of CHI3L1/YKL40 (a MES marker) was found only in WG4 and WG14 cells. MES GBMs or MES subtype of GSCs express CD44 [121,122] and we confirmed elevated expression of CD44, as well as VIMENTIN in majority of cultures. N-CADHERIN (a hallmark of EMT) was expressed to varying extents in cell cultures. High expression of SNAIL was found in WG4, WG9 and WG13 cells, while the expression of SLUG was uniformly high in studied cell cultures. STAT3 has been implicated into EMT as an inducer of EMT genes such as SNAIL, SLUG, and TWIST [123,124,125] and consistently higher levels of active STAT3 were found in WG9, WG14 and WG4 cells.
We conclude that tested patient-derived cell cultures recapitulate the known molecular heterogeneity of GBM, although gene expression was not fully recapitulated at protein levels. Indeed, Brennan et al. found that a targeted proteomic profile showed that the impact of specific genomic alterations on downstream pathway signaling is not linear and not always concordant with a genotype [28]. Moreover, the machine-learning approach that designed an immunohistochemical (IHC)-based classification of GBM revealed 79.5% concordance with the transcriptional-based classification, with the highest accuracy (90%) reached in the MES subgroup [126]. MES and CL subgroups were well segregated, while PN GBM more frequently shared overlapping features with both groups.
The classification of GBM has implications in selecting target therapy strategies. The CL GBMs are more responsive to the radiation and chemotherapy, because the TP53 DNA damage response is intact in this group of patients. The MES subtype is the most aggressive and strongly associated with a poor prognosis compared to PN subtype [127], in addition, a shift from PN to MES subtype can occur in patients following radiotherapy and chemotherapy [105].
Based on the above, WG4, WG14 and WG9 cells were classified as a CL/PN subtype, highly expressing phosphorylated/active EGFR. Proteomic data from Reverse Phase Protein Array (RPPA) showed that EGFR and its phosphorylated variants (pY992, pY1068, and pY1173) are significantly enriched in the CL subtypes [128]. Since EGFR is among the most frequently mutated genes in human adult gliomas, and mostly found in the CL subtypes, EGFR-targeted therapy has attracted much attention as an alternative therapeutic strategy to treat malignant gliomas. A specific EGFR inhibitor AG1478 [N-(3-chlorophenyl)- 6,7-dimethoxyquinazolin-4-amine] competitively binds to the ATP pocket of EGFR and inhibits its activity [129,130]. Previous data showed anti-proliferative effects of AG1478 and enhancement of the sensitivity to cytotoxic drugs, such as cisplatin, etoposide and DOX in different cancer cells [131,132]. AG1478 inhibited the growth of A431 tumors in vivo [133] and human glioma cells which overexpress a mutant EGFR (EGFRvIII) [134,135,136]. AG1478 was used in EGFRvIII-related murine gliomas and advanced to clinical studies [137].
We determined the effect of AG1478 on GBM-derived cells treated with TMZ or DOX, but in the context of methylated MGMT. We found that AG-treated cells with methylated MGMT promoter or with intermediate status were more sensitive to DOX than cells with the unmethylated MGMT and AG1478+TMZ resulted in the strongest accumulation of apoptosis markers in WG4 and WG14 cells. Our data suggests that MGMT promoter methylation could predict the response to other drugs, not only for TMZ [138,139]. A recent systematic review and meta-analysis confirmed a MGMT methylation status as a clinical biomarker in GBM patients, showing association with better overall and progression free survival in patients treated with alkylating agents [140]. Interestingly, the survival benefits were also observed in GBM patients irrespective of treatment [141]. A subgroup of patients treated with tyrosine kinase inhibitors (with or without alkylating agent in combination) showed a significant association of the MGMT methylation with overall survival.
We found reduced levels of the phophorylated EGFR in AG1478-treated cells, including EGFRhigh GSCs [66], while downstream PI3K-AKT and ERK signaling pathways were not affected. Interestingly, the levels of active, phoshoprylated STAT3 were reduced. These data suggest that EGFR-STAT3 pathway is an important signaling rout for the response of tumor cells to AG1478. Lack of the effects on PI3K-AKT pathway could result from PTEN alterations, mutations within the gene encoding the p110 catalytic subunit of PI3K (PIK3CA), AKT amplification [142] or activation via PDGFRs [143,144,145]. We demonstrated that pharmacological inhibition of EGFR reduces phospho-STAT3 levels and increases the sensitivity of GBM derived cells cultures to TMZ or DOX. This evidence supports the notion of using drug combination to improve clinical outcome.
DOX is an anthracycline topoisomerase II inhibitor, used in many cancers but a low penetration of BBB and serious side effects, including cardiotoxicity restrict its use in GBM therapy. To overcome this obstacle various formulations with nanoparticles, liposomes, have been employed to deliver DOX to glioblastomas [14,15,16,17,18,19]. Interestingly, co-delivery of DOX and EGFR siRNA in intracranial U87MG xenografts prolonged the life span of the glioma-bearing mice and induced apoptosis in gliomas [15]. Other strategies assisting improvement of drug delivery and disruption the peritumoral BBB are focused ultrasound (FUS) and interstitial thermal therapy (LITT). Indeed, the accumulation of DOX in GBM-bearing mice following FUS-induced BBB disruption was significantly higher than that in the control tumor [18]. Butt et al. recently demonstrated that LITT combined with low-dose DOX results in longer survival recurrent GBM patients. Low dose of DOX was safe for patients, even with extended (>6 weeks) dosing [146]. Promising results were also observed in phase I trial (GBM-LIPO trial) in which patients with relapsed glioblastoma harboring an EGFR amplification were treated with anti-EGFR doxorubicin-loaded immunoliposomes (anti-EGFR ILs-dox) [63].
5. Conclusions
We present a simplified protocol to obtain glioma-derived cell cultures that allowed for the successful development of 13 cell cultures. Using RNAseq, immunoblotting and immunocytochemistry, we could better assign molecular characteristics of those cultures and assign them to the transcriptome-based GBM classification. Evaluation of markers specific to GBM subtypes: PN (OLIG2, IDH1R132H, TP53 and PDGFRα), CL (EGFR) and MES (CHI3L1/YKL40, CD44 and phospho-STAT3), as well as expression of pluripotency (SOX2, OLIG2, NESTIN) and differentiation (GFAP, MAP2, β-Tubulin III) markers revealed the considerable inter-tumor heterogeneity of primary GBM cell cultures. EGFR is one of the most frequent oncogenic alterations in GBM, which was recapitulated in cell cultures. The application of an EGFR inhibitor AG1478 reduced phospho-EGFR and phospho-STAT3 levels and sensitized cells to TMZ or DOX. The combination of AG1478 and chemotherapeutics decreased cell viability and induced apoptosis of GBM-derived cells with methylated or intermediate status of MGMT.
The results support using a combinatorial approach in well-defined GBM-derived cell cultures and advocate for the use of DOX, a cytotoxic drug with well-known pharmacokinetics together with EGFR-targeted therapy for GBM-patients. The results show that such combination would be effective in GBM-patients with amplified/mutated EGFR and with the methylated MGMT promoter.
Supplementary Materials
The following supporting information can be downloaded at the website of this paper posted on Preprints.org. Supp. Figure 1. Information about patient cohort and corresponding primary cell cultures. Supp. Figure 2. Immunofluorescent staining of selected proteins in primary cell cultures. Supp. Figure 3. Establishment of primary cell cultures and passaging. Supp. Figure 4. Expression of EMT-related gene in TCGA gliomas and the survival analysis of GBM-patients with different expression of EMT-related genes. Supp. Figure 5. Characterization of the mesenchymal phenotype of primary glioma cell cultures. Supp. Figure 6. The effect of AG1478 alone and in combination with TMZ. Supp. Figure 7. Impact of DOX treatment to primary glioma cell cultures.
Author Contributions
Conceptualization: I.A.C., K.W. and Bo.K.; Methodology/Investigation: I.A.C., K.W.; P. Sz., K.P., Be.K., K.J. and W.D.; Resources: R.C., M.B., B.C., P.N., K.K., W.G., M.R., T.C. and A.M.; Computational investigation: B.W.; Writing-Original Draft Preparation: I.A.C., K.W. and Bo.K.; Writing-Review and Editing: I.A.C., K.W., B.W., P.Sz., K.P. and Bo.K.; Supervision: Bo.K.; Funding Acquisition, Bo.K; All authors have read and agreed to the published version of the manuscript.
Funding
This research was funded by a grant from the National Centre for Research Development No. STRATEGMED2/265503/3/NCRB/15, DIMUNO: “Development of new cancer therapies based on selective antitumor immunomodulators” (Bo.K.) and a grant from the Foundation for Polish Science TEAM-TECH Core Facility; project “NGS platform for comprehensive diagnostics and personalized therapy in neuro-oncology” (Bo.K.).
Institutional Review Board Statement
The study was conducted according to the guidelines of the Declaration of Helsinki, and approved by the Committee of Bioethics at the St. Raphael Hospital, Scanmed, Cracow; Children’s Memorial Health Institute, Warsaw; Medical University of Warsaw and Institute of Psychiatry and Neurology, Warsaw, Poland (protocol #73/KBL/OIL/2015; #14/KB/2012, #KB/54/2016, #3/2016).
Informed Consent Statement
Informed consent was obtained from all subjects involved in the study.
Data Availability Statement
The data was deposited to European Genome-phenome Archive EGA (http://www.ebi.ac.uk/ega/), under accession numbers EGAS00001006849, EGAD00001009795.
Acknowledgments
We would like to acknowledge Sylwia K. Krol for her technical assistance in DNA isolation.
Conflicts of Interest
The funders had no role in the design of the study; in the collection, analyses, or interpretation of data; in the writing of the manuscript; or in the decision to publish the results.
Graphical abstract
The graphical abstract was created using BioRender software.
References
- Delgado-López, P.D.; Corrales-García, E.M. Survival in Glioblastoma: A Review on the Impact of Treatment Modalities. Clin Transl Oncol 2016, 18, 1062–1071. [Google Scholar] [CrossRef] [PubMed]
- Stupp, R.; Brada, M.; van den Bent, M.J.; Tonn, J.-C.; Pentheroudakis, G. High-Grade Glioma: ESMO Clinical Practice Guidelines for Diagnosis, Treatment and Follow-Up. Ann Oncol 2014, 25 Suppl 3, iii93-101. [Google Scholar] [CrossRef]
- Hirose, Y.; Kreklau, E.L.; Erickson, L.C.; Berger, M.S.; Pieper, R.O. Delayed Repletion of O6-Methylguanine-DNA Methyltransferase Resulting in Failure to Protect the Human Glioblastoma Cell Line SF767 from Temozolomide-Induced Cytotoxicity. J Neurosurg 2003, 98, 591–598. [Google Scholar] [CrossRef] [PubMed]
- Kokkinakis, D.M.; Hoffman, R.M.; Frenkel, E.P.; Wick, J.B.; Han, Q.; Xu, M.; Tan, Y.; Schold, S.C. Synergy between Methionine Stress and Chemotherapy in the Treatment of Brain Tumor Xenografts in Athymic Mice. Cancer Res 2001, 61, 4017–4023. [Google Scholar] [PubMed]
- Feldheim, J.; Kessler, A.F.; Monoranu, C.M.; Ernestus, R.-I.; Löhr, M.; Hagemann, C. Changes of O6-Methylguanine DNA Methyltransferase (MGMT) Promoter Methylation in Glioblastoma Relapse—A Meta-Analysis Type Literature Review. Cancers (Basel) 2019, 11. [Google Scholar] [CrossRef] [PubMed]
- Rivera, A.L.; Pelloski, C.E.; Gilbert, M.R.; Colman, H.; De La Cruz, C.; Sulman, E.P.; Bekele, B.N.; Aldape, K.D. MGMT Promoter Methylation Is Predictive of Response to Radiotherapy and Prognostic in the Absence of Adjuvant Alkylating Chemotherapy for Glioblastoma. Neuro Oncol 2010, 12, 116–121. [Google Scholar] [CrossRef] [PubMed]
- Singh, N.; Miner, A.; Hennis, L.; Mittal, S. Mechanisms of Temozolomide Resistance in Glioblastoma - a Comprehensive Review. Cancer Drug Resist 2021, 4, 17–43. [Google Scholar] [CrossRef] [PubMed]
- Gong, L.; Yin, Y.; Chen, C.; Wan, Q.; Xia, D.; Wang, M.; Pu, Z.; Zhang, B.; Zou, J. Characterization of EGFR-Reprogrammable Temozolomide-Resistant Cells in a Model of Glioblastoma. Cell Death Discov 2022, 8, 438. [Google Scholar] [CrossRef] [PubMed]
- Benjamin, R.S.; Riggs Jr., C. E.; Bachur, N.R. Pharmacokinetics and Metabolism of Adriamycin in Man. Clin Pharmacol Ther 1973, 14, 592–600. [Google Scholar] [CrossRef] [PubMed]
- Arcamone, F.; Cassinelli, G.; Fantini, G.; Grein, A.; Orezzi, P.; Pol, C.; Spalla, C. Adriamycin, 14-Hydroxydaimomycin, a New Antitumor Antibiotic from S. Peucetius Var. Caesius. Biotechnol Bioeng 1969, 11, 1101–1110. [Google Scholar] [CrossRef] [PubMed]
- Stan, A.C.; Casares, S.; Radu, D.; Walter, G.F.; Brumeanu, T.D. Doxorubicin-Induced Cell Death in Highly Invasive Human Gliomas. Anticancer Res 1999, 19, 941–950. [Google Scholar] [PubMed]
- Muldoon, L.L.; Neuwelt, E.A. BR96–DOX Immunoconjugate Targeting of Chemotherapy in Brain Tumor Models. J Neurooncol 2003, 65, 49–62. [Google Scholar] [CrossRef] [PubMed]
- Saito, R.; Bringas, J.R.; McKnight, T.R.; Wendland, M.F.; Mamot, C.; Drummond, D.C.; Kirpotin, D.B.; Park, J.W.; Berger, M.S.; Bankiewicz, K.S. Distribution of Liposomes into Brain and Rat Brain Tumor Models by Convection-Enhanced Delivery Monitored with Magnetic Resonance Imaging. Cancer Res 2004, 64, 2572–2579. [Google Scholar] [CrossRef] [PubMed]
- Steiniger, S.C.J.; Kreuter, J.; Khalansky, A.S.; Skidan, I.N.; Bobruskin, A.I.; Smirnova, Z.S.; Severin, S.E.; Uhl, R.; Kock, M.; Geiger, K.D.; et al. Chemotherapy of Glioblastoma in Rats Using Doxorubicin-Loaded Nanoparticles. Int J Cancer 2004, 109, 759–767. [Google Scholar] [CrossRef] [PubMed]
- Wang, L.; Hao, Y.; Li, H.; Zhao, Y.; Meng, D.; Li, D.; Shi, J.; Zhang, H.; Zhang, Z.; Zhang, Y. Co-Delivery of Doxorubicin and SiRNA for Glioma Therapy by a Brain Targeting System: Angiopep-2-Modified Poly(Lactic-Co-Glycolic Acid) Nanoparticles. J Drug Target 2015, 23, 832–846. [Google Scholar] [CrossRef] [PubMed]
- Kuo, Y.-C.; Chang, Y.-H.; Rajesh, R. Targeted Delivery of Etoposide, Carmustine and Doxorubicin to Human Glioblastoma Cells Using Methoxy Poly(Ethylene Glycol)-poly(Ε-caprolactone) Nanoparticles Conjugated with Wheat Germ Agglutinin and Folic Acid. Materials Science and Engineering: C 2019, 96, 114–128. [Google Scholar] [CrossRef] [PubMed]
- Thakur, A.; Sidu, R.K.; Zou, H.; Alam, M.K.; Yang, M.; Lee, Y. Inhibition of Glioma Cells’ Proliferation by Doxorubicin-Loaded Exosomes via Microfluidics. Int J Nanomedicine 2020, 15, 8331–8343. [Google Scholar] [CrossRef] [PubMed]
- Lin, Y.-L.; Wu, M.-T.; Yang, F.-Y. Pharmacokinetics of Doxorubicin in Glioblastoma Multiforme Following Ultrasound-Induced Blood-Brain Barrier Disruption as Determined by Microdialysis. J Pharm Biomed Anal 2018, 149, 482–487. [Google Scholar] [CrossRef]
- Aragon-Sanabria, V.; Aditya, A.; Zhang, L.; Chen, F.; Yoo, B.; Cao, T.; Madajewski, B.; Lee, R.; Turker, M.Z.; Ma, K.; et al. Ultrasmall Nanoparticle Delivery of Doxorubicin Improves Therapeutic Index for High-Grade Glioma. Clin Cancer Res 2022, 28, 2938–2952. [Google Scholar] [CrossRef]
- Verhaak, R.G.W.; Hoadley, K.A.; Purdom, E.; Wang, V.; Qi, Y.; Wilkerson, M.D.; Miller, C.R.; Ding, L.; Golub, T.; Mesirov, J.P.; et al. Integrated Genomic Analysis Identifies Clinically Relevant Subtypes of Glioblastoma Characterized by Abnormalities in PDGFRA, IDH1, EGFR, and NF1. Cancer Cell 2010, 17, 98–110. [Google Scholar] [CrossRef]
- Sottoriva, A.; Spiteri, I.; Piccirillo, S.G.M.; Touloumis, A.; Collins, V.P.; Marioni, J.C.; Curtis, C.; Watts, C.; Tavaré, S. Intratumor Heterogeneity in Human Glioblastoma Reflects Cancer Evolutionary Dynamics. Proc Natl Acad Sci U S A 2013, 110, 4009–4014. [Google Scholar] [CrossRef] [PubMed]
- Patel, A.P.; Tirosh, I.; Trombetta, J.J.; Shalek, A.K.; Gillespie, S.M.; Wakimoto, H.; Cahill, D.P.; Nahed, B. V; Curry, W.T.; Martuza, R.L.; et al. Single-Cell RNA-Seq Highlights Intratumoral Heterogeneity in Primary Glioblastoma. Science 2014, 344, 1396–1401. [Google Scholar] [CrossRef] [PubMed]
- Wang, Q.; Hu, B.; Hu, X.; Kim, H.; Squatrito, M.; Scarpace, L.; deCarvalho, A.C.; Lyu, S.; Li, P.; Li, Y.; et al. Tumor Evolution of Glioma-Intrinsic Gene Expression Subtypes Associates with Immunological Changes in the Microenvironment. Cancer Cell 2017, 32, 42–56. [Google Scholar] [CrossRef] [PubMed]
- Galli, R.; Binda, E.; Orfanelli, U.; Cipelletti, B.; Gritti, A.; De Vitis, S.; Fiocco, R.; Foroni, C.; Dimeco, F.; Vescovi, A. Isolation and Characterization of Tumorigenic, Stem-like Neural Precursors from Human Glioblastoma. Cancer Res 2004, 64, 7011–7021. [Google Scholar] [CrossRef] [PubMed]
- Bao, S.; Wu, Q.; McLendon, R.E.; Hao, Y.; Shi, Q.; Hjelmeland, A.B.; Dewhirst, M.W.; Bigner, D.D.; Rich, J.N. Glioma Stem Cells Promote Radioresistance by Preferential Activation of the DNA Damage Response. Nature 2006, 444, 756–760. [Google Scholar] [CrossRef] [PubMed]
- Singh, S.K.; Hawkins, C.; Clarke, I.D.; Squire, J.A.; Bayani, J.; Hide, T.; Henkelman, R.M.; Cusimano, M.D.; Dirks, P.B. Identification of Human Brain Tumour Initiating Cells. Nature 2004, 432, 396–401. [Google Scholar] [CrossRef] [PubMed]
- Chen, J.; Li, Y.; Yu, T.-S.; McKay, R.M.; Burns, D.K.; Kernie, S.G.; Parada, L.F. A Restricted Cell Population Propagates Glioblastoma Growth after Chemotherapy. Nature 2012, 488, 522–526. [Google Scholar] [CrossRef] [PubMed]
- Brennan, C.W.; Verhaak, R.G.W.; McKenna, A.; Campos, B.; Noushmehr, H.; Salama, S.R.; Zheng, S.; Chakravarty, D.; Sanborn, J.Z.; Berman, S.H.; et al. The Somatic Genomic Landscape of Glioblastoma. Cell 2013, 155, 462–477. [Google Scholar] [CrossRef]
- Shinojima, N.; Tada, K.; Shiraishi, S.; Kamiryo, T.; Kochi, M.; Nakamura, H.; Makino, K.; Saya, H.; Hirano, H.; Kuratsu, J.-I.; et al. Prognostic Value of Epidermal Growth Factor Receptor in Patients with Glioblastoma Multiforme. Cancer Res 2003, 63, 6962–6970. [Google Scholar] [PubMed]
- Hatanpaa, K.J.; Burma, S.; Zhao, D.; Habib, A.A. Epidermal Growth Factor Receptor in Glioma: Signal Transduction, Neuropathology, Imaging, and Radioresistance. Neoplasia 2010, 12, 675–684. [Google Scholar] [CrossRef]
- Ekstrand, A.J.; James, C.D.; Cavenee, W.K.; Seliger, B.; Pettersson, R.F.; Collins, V.P. Genes for Epidermal Growth Factor Receptor, Transforming Growth Factor Alpha, and Epidermal Growth Factor and Their Expression in Human Gliomas in Vivo. Cancer Res 1991, 51, 2164–2172. [Google Scholar] [PubMed]
- Wong, A.J.; Ruppert, J.M.; Bigner, S.H.; Grzeschik, C.H.; Humphrey, P.A.; Bigner, D.S.; Vogelstein, B. Structural Alterations of the Epidermal Growth Factor Receptor Gene in Human Gliomas. Proc Natl Acad Sci U S A 1992, 89, 2965–2969. [Google Scholar] [CrossRef] [PubMed]
- Huang, P.H.; Xu, A.M.; White, F.M. Oncogenic EGFR Signaling Networks in Glioma. Sci Signal 2009, 2, re6. [Google Scholar] [CrossRef] [PubMed]
- Karpel-Massler, G.; Schmidt, U.; Unterberg, A.; Halatsch, M.-E. Therapeutic Inhibition of the Epidermal Growth Factor Receptor in High-Grade Gliomas: Where Do We Stand? Mol Cancer Res 2009, 7, 1000–1012. [Google Scholar] [CrossRef] [PubMed]
- An, Z.; Aksoy, O.; Zheng, T.; Fan, Q.-W.; Weiss, W.A. Epidermal Growth Factor Receptor and EGFRvIII in Glioblastoma: Signaling Pathways and Targeted Therapies. Oncogene 2018, 37, 1561–1575. [Google Scholar] [CrossRef] [PubMed]
- Yang, X.; Yang, K.; Kuang, K. The Efficacy and Safety of EGFR Inhibitor Monotherapy in Non-Small Cell Lung Cancer: A Systematic Review. Curr Oncol Rep 2014, 16, 390. [Google Scholar] [CrossRef] [PubMed]
- Padfield, E.; Ellis, H.P.; Kurian, K.M. Current Therapeutic Advances Targeting EGFR and EGFRvIII in Glioblastoma. Front Oncol 2015, 5, 5. [Google Scholar] [CrossRef] [PubMed]
- Mellinghoff, I.K.; Wang, M.Y.; Vivanco, I.; Haas-Kogan, D.A.; Zhu, S.; Dia, E.Q.; Lu, K. V; Yoshimoto, K.; Huang, J.H.Y.; Chute, D.J.; et al. Molecular Determinants of the Response of Glioblastomas to EGFR Kinase Inhibitors. N Engl J Med 2005, 353, 2012–2024. [Google Scholar] [CrossRef] [PubMed]
- Sorscher, S.M. EGFR Mutations and Sensitivity to Gefitinib. N Engl J Med 2004, 351, 1260–1261. [Google Scholar] [PubMed]
- Reardon, D.A.; Quinn, J.A.; Vredenburgh, J.J.; Gururangan, S.; Friedman, A.H.; Desjardins, A.; Sathornsumetee, S.; Herndon, J.E., 2nd; Dowell, J.M.; McLendon, R.E.; et al. Phase 1 Trial of Gefitinib plus Sirolimus in Adults with Recurrent Malignant Glioma. Clin Cancer Res 2006, 12, 860–868. [Google Scholar] [CrossRef] [PubMed]
- Oprita, A.; Baloi, S.-C.; Staicu, G.-A.; Alexandru, O.; Tache, D.E.; Danoiu, S.; Micu, E.S.; Sevastre, A.-S. Updated Insights on EGFR Signaling Pathways in Glioma. Int J Mol Sci 2021, 22. [Google Scholar] [CrossRef] [PubMed]
- Darnell, J.E.J.; Kerr, I.M.; Stark, G.R. Jak-STAT Pathways and Transcriptional Activation in Response to IFNs and Other Extracellular Signaling Proteins. Science 1994, 264, 1415–1421. [Google Scholar] [CrossRef] [PubMed]
- Ou, A.; Ott, M.; Fang, D.; Heimberger, A.B. The Role and Therapeutic Targeting of JAK/STAT Signaling in Glioblastoma. Cancers (Basel) 2021, 13. [Google Scholar] [CrossRef] [PubMed]
- Swiatek-Machado, K.; Kaminska, B. STAT Signaling in Glioma Cells. Adv Exp Med Biol 2020, 1202, 203–222. [Google Scholar] [CrossRef] [PubMed]
- Luwor, R.B.; Stylli, S.S.; Kaye, A.H. The Role of Stat3 in Glioblastoma Multiforme. J Clin Neurosci 2013, 20, 907–911. [Google Scholar] [CrossRef] [PubMed]
- Birner, P.; Toumangelova-Uzeir, K.; Natchev, S.; Guentchev, M. STAT3 Tyrosine Phosphorylation Influences Survival in Glioblastoma. J Neurooncol 2010, 100, 339–343. [Google Scholar] [CrossRef] [PubMed]
- Peñuelas, S.; Anido, J.; Prieto-Sánchez, R.M.; Folch, G.; Barba, I.; Cuartas, I.; García-Dorado, D.; Poca, M.A.; Sahuquillo, J.; Baselga, J.; et al. TGF-Beta Increases Glioma-Initiating Cell Self-Renewal through the Induction of LIF in Human Glioblastoma. Cancer Cell 2009, 15, 315–327. [Google Scholar] [CrossRef] [PubMed]
- Sherry, M.M.; Reeves, A.; Wu, J.K.; Cochran, B.H. STAT3 Is Required for Proliferation and Maintenance of Multipotency in Glioblastoma Stem Cells. Stem Cells 2009, 27, 2383–2392. [Google Scholar] [CrossRef] [PubMed]
- Iwamaru, A.; Szymanski, S.; Iwado, E.; Aoki, H.; Yokoyama, T.; Fokt, I.; Hess, K.; Conrad, C.; Madden, T.; Sawaya, R.; et al. A Novel Inhibitor of the STAT3 Pathway Induces Apoptosis in Malignant Glioma Cells Both in Vitro and in Vivo. Oncogene 2007, 26, 2435–2444. [Google Scholar] [CrossRef]
- Li, G.-H.; Wei, H.; Lv, S.-Q.; Ji, H.; Wang, D.-L. Knockdown of STAT3 Expression by RNAi Suppresses Growth and Induces Apoptosis and Differentiation in Glioblastoma Stem Cells. Int J Oncol 2010, 37, 103–110. [Google Scholar] [PubMed]
- Stechishin, O.D.; Luchman, H.A.; Ruan, Y.; Blough, M.D.; Nguyen, S.A.; Kelly, J.J.; Cairncross, J.G.; Weiss, S. On-Target JAK2/STAT3 Inhibition Slows Disease Progression in Orthotopic Xenografts of Human Glioblastoma Brain Tumor Stem Cells. Neuro Oncol 2013, 15, 198–207. [Google Scholar] [CrossRef] [PubMed]
- Jensen, K.V.; Cseh, O.; Aman, A.; Weiss, S.; Luchman, H.A. The JAK2/STAT3 Inhibitor Pacritinib Effectively Inhibits Patient-Derived GBM Brain Tumor Initiating Cells in Vitro and When Used in Combination with Temozolomide Increases Survival in an Orthotopic Xenograft Model. PLoS One 2017, 12, e0189670. [Google Scholar] [CrossRef] [PubMed]
- Lo, H.-W.; Cao, X.; Zhu, H.; Ali-Osman, F. Constitutively Activated STAT3 Frequently Coexpresses with Epidermal Growth Factor Receptor in High-Grade Gliomas and Targeting STAT3 Sensitizes Them to Iressa and Alkylators. Clin Cancer Res 2008, 14, 6042–6054. [Google Scholar] [CrossRef] [PubMed]
- Jensen, K. V; Hao, X.; Aman, A.; Luchman, H.A.; Weiss, S. EGFR Blockade in GBM Brain Tumor Stem Cells Synergizes with JAK2/STAT3 Pathway Inhibition to Abrogate Compensatory Mechanisms in Vitro and in Vivo. Neurooncol Adv 2020, 2, vdaa020. [Google Scholar] [CrossRef] [PubMed]
- Vengoji, R.; Macha, M.A.; Nimmakayala, R.K.; Rachagani, S.; Siddiqui, J.A.; Mallya, K.; Gorantla, S.; Jain, M.; Ponnusamy, M.P.; Batra, S.K.; et al. Afatinib and Temozolomide Combination Inhibits Tumorigenesis by Targeting EGFRvIII-CMet Signaling in Glioblastoma Cells. J Exp Clin Cancer Res 2019, 38, 266. [Google Scholar] [CrossRef] [PubMed]
- Fukai, J.; Nishio, K.; Itakura, T.; Koizumi, F. Antitumor Activity of Cetuximab against Malignant Glioma Cells Overexpressing EGFR Deletion Mutant Variant III. Cancer Sci 2008, 99, 2062–2069. [Google Scholar] [CrossRef] [PubMed]
- Eller, J.L.; Longo, S.L.; Kyle, M.M.; Bassano, D.; Hicklin, D.J.; Canute, G.W. Anti-Epidermal Growth Factor Receptor Monoclonal Antibody Cetuximab Augments Radiation Effects in Glioblastoma Multiforme in Vitro and in Vivo. Neurosurgery 2005, 56, 155–162; discussion 162. [Google Scholar] [CrossRef]
- Combs, S.E.; Heeger, S.; Haselmann, R.; Edler, L.; Debus, J.; Schulz-Ertner, D. Treatment of Primary Glioblastoma Multiforme with Cetuximab, Radiotherapy and Temozolomide (GERT)--Phase I/II Trial: Study Protocol. BMC Cancer 2006, 6, 133. [Google Scholar] [CrossRef] [PubMed]
- von Achenbach, C.; Silginer, M.; Blot, V.; Weiss, W.A.; Weller, M. Depatuxizumab Mafodotin (ABT-414)-Induced Glioblastoma Cell Death Requires EGFR Overexpression, but Not EGFR(Y1068) Phosphorylation. Mol Cancer Ther 2020, 19, 1328–1339. [Google Scholar] [CrossRef]
- Phillips, A.C.; Boghaert, E.R.; Vaidya, K.S.; Mitten, M.J.; Norvell, S.; Falls, H.D.; DeVries, P.J.; Cheng, D.; Meulbroek, J.A.; Buchanan, F.G.; et al. ABT-414, an Antibody-Drug Conjugate Targeting a Tumor-Selective EGFR Epitope. Mol Cancer Ther 2016, 15, 661–669. [Google Scholar] [CrossRef]
- Mamot, C.; Ritschard, R.; Wicki, A.; Stehle, G.; Dieterle, T.; Bubendorf, L.; Hilker, C.; Deuster, S.; Herrmann, R.; Rochlitz, C. Tolerability, Safety, Pharmacokinetics, and Efficacy of Doxorubicin-Loaded Anti-EGFR Immunoliposomes in Advanced Solid Tumours: A Phase 1 Dose-Escalation Study. Lancet Oncol 2012, 13, 1234–1241. [Google Scholar] [CrossRef] [PubMed]
- Mamot, C.; Drummond, D.C.; Greiser, U.; Hong, K.; Kirpotin, D.B.; Marks, J.D.; Park, J.W. Epidermal Growth Factor Receptor (EGFR)-Targeted Immunoliposomes Mediate Specific and Efficient Drug Delivery to EGFR- and EGFRvIII-Overexpressing Tumor Cells. Cancer Res 2003, 63, 3154–3161. [Google Scholar] [PubMed]
- Kasenda, B.; König, D.; Manni, M.; Ritschard, R.; Duthaler, U.; Bartoszek, E.; Bärenwaldt, A.; Deuster, S.; Hutter, G.; Cordier, D.; et al. Targeting Immunoliposomes to EGFR-Positive Glioblastoma. ESMO Open 2022, 7, 100365. [Google Scholar] [CrossRef] [PubMed]
- Louis, D.N.; Perry, A.; Reifenberger, G.; von Deimling, A.; Figarella-Branger, D.; Cavenee, W.K.; Ohgaki, H.; Wiestler, O.D.; Kleihues, P.; Ellison, D.W. The 2016 World Health Organization Classification of Tumors of the Central Nervous System: A Summary. Acta Neuropathol 2016, 131, 803–820. [Google Scholar] [CrossRef] [PubMed]
- Hasselbach, L.A.; Irtenkauf, S.M.; Lemke, N.W.; Nelson, K.K.; Berezovsky, A.D.; Carlton, E.T.; Transou, A.D.; Mikkelsen, T.; deCarvalho, A.C. Optimization of High Grade Glioma Cell Culture from Surgical Specimens for Use in Clinically Relevant Animal Models and 3D Immunochemistry. J Vis Exp 2014, e51088. [Google Scholar] [CrossRef] [PubMed]
- Di Tomaso, T.; Mazzoleni, S.; Wang, E.; Sovena, G.; Clavenna, D.; Franzin, A.; Mortini, P.; Ferrone, S.; Doglioni, C.; Marincola, F.M.; et al. Immunobiological Characterization of Cancer Stem Cells Isolated from Glioblastoma Patients. Clin Cancer Res 2010, 16, 800–813. [Google Scholar] [CrossRef] [PubMed]
- Ciechomska, I.A.; Gielniewski, B.; Wojtas, B.; Kaminska, B.; Mieczkowski, J. EGFR/FOXO3a/BIM Signaling Pathway Determines Chemosensitivity of BMP4-Differentiated Glioma Stem Cells to Temozolomide. Exp Mol Med 2020, 52, 1326–1340. [Google Scholar] [CrossRef] [PubMed]
- Ciechomska, I.A.; Przanowski, P.; Jackl, J.; Wojtas, B.; Kaminska, B. BIX01294, an Inhibitor of Histone Methyltransferase, Induces Autophagy-Dependent Differentiation of Glioma Stem-like Cells. Sci Rep 2016, 6, 38723. [Google Scholar] [CrossRef] [PubMed]
- Dobin, A.; Davis, C.A.; Schlesinger, F.; Drenkow, J.; Zaleski, C.; Jha, S.; Batut, P.; Chaisson, M.; Gingeras, T.R. STAR: Ultrafast Universal RNA-Seq Aligner. Bioinformatics 2013, 29, 15–21. [Google Scholar] [CrossRef] [PubMed]
- Liao, Y.; Smyth, G.K.; Shi, W. The R Package Rsubread Is Easier, Faster, Cheaper and Better for Alignment and Quantification of RNA Sequencing Reads. Nucleic Acids Res 2019, 47, e47–e47. [Google Scholar] [CrossRef] [PubMed]
- Love, M.I.; Huber, W.; Anders, S. Moderated Estimation of Fold Change and Dispersion for RNA-Seq Data with DESeq2. Genome Biol 2014, 15, 550. [Google Scholar] [CrossRef] [PubMed]
- Wang, G.-M.; Cioffi, G.; Patil, N.; Waite, K.A.; Lanese, R.; Ostrom, Q.T.; Kruchko, C.; Berens, M.E.; Connor, J.R.; Lathia, J.D.; et al. Importance of the Intersection of Age and Sex to Understand Variation in Incidence and Survival for Primary Malignant Gliomas. Neuro Oncol 2022, 24, 302–310. [Google Scholar] [CrossRef] [PubMed]
- Yang, W.; Warrington, N.M.; Taylor, S.J.; Whitmire, P.; Carrasco, E.; Singleton, K.W.; Wu, N.; Lathia, J.D.; Berens, M.E.; Kim, A.H.; et al. Sex Differences in GBM Revealed by Analysis of Patient Imaging, Transcriptome, and Survival Data. Sci Transl Med 2019, 11. [Google Scholar] [CrossRef] [PubMed]
- Carrano, A.; Juarez, J.J.; Incontri, D.; Ibarra, A.; Guerrero Cazares, H. Sex-Specific Differences in Glioblastoma. Cells 2021, 10. [Google Scholar] [CrossRef] [PubMed]
- Popova, S.N.; Bergqvist, M.; Dimberg, A.; Edqvist, P.-H.; Ekman, S.; Hesselager, G.; Ponten, F.; Smits, A.; Sooman, L.; Alafuzoff, I. Subtyping of Gliomas of Various WHO Grades by the Application of Immunohistochemistry. Histopathology 2014, 64, 365–379. [Google Scholar] [CrossRef] [PubMed]
- Conroy, S.; Kruyt, F.A.E.; Joseph, J. V; Balasubramaniyan, V.; Bhat, K.P.; Wagemakers, M.; Enting, R.H.; Walenkamp, A.M.E.; den Dunnen, W.F.A. Subclassification of Newly Diagnosed Glioblastomas through an Immunohistochemical Approach. PLoS One 2014, 9, e115687. [Google Scholar] [CrossRef]
- Mazzoleni, S.; Politi, L.S.; Pala, M.; Cominelli, M.; Franzin, A.; Sergi Sergi, L.; Falini, A.; De Palma, M.; Bulfone, A.; Poliani, P.L.; et al. Epidermal Growth Factor Receptor Expression Identifies Functionally and Molecularly Distinct Tumor-Initiating Cells in Human Glioblastoma Multiforme and Is Required for Gliomagenesis. Cancer Res 2010, 70, 7500–7513. [Google Scholar] [CrossRef] [PubMed]
- Loh, Y.-H.; Wu, Q.; Chew, J.-L.; Vega, V.B.; Zhang, W.; Chen, X.; Bourque, G.; George, J.; Leong, B.; Liu, J.; et al. The Oct4 and Nanog Transcription Network Regulates Pluripotency in Mouse Embryonic Stem Cells. Nat Genet 2006, 38, 431–440. [Google Scholar] [CrossRef] [PubMed]
- Pal, R.; Ravindran, G. Assessment of Pluripotency and Multilineage Differentiation Potential of NTERA-2 Cells as a Model for Studying Human Embryonic Stem Cells. Cell Prolif 2006, 39, 585–598. [Google Scholar] [CrossRef]
- Lathia, J.D.; Mack, S.C.; Mulkearns-Hubert, E.E.; Valentim, C.L.L.; Rich, J.N. Cancer Stem Cells in Glioblastoma. Genes Dev 2015, 29, 1203–1217. [Google Scholar] [CrossRef]
- Kalluri, R.; Weinberg, R.A. The Basics of Epithelial-Mesenchymal Transition. J Clin Invest 2009, 119, 1420–1428. [Google Scholar] [CrossRef] [PubMed]
- Ribatti, D.; Tamma, R.; Annese, T. Epithelial-Mesenchymal Transition in Cancer: A Historical Overview. Transl Oncol 2020, 13, 100773. [Google Scholar] [CrossRef] [PubMed]
- Mahabir, R.; Tanino, M.; Elmansuri, A.; Wang, L.; Kimura, T.; Itoh, T.; Ohba, Y.; Nishihara, H.; Shirato, H.; Tsuda, M.; et al. Sustained Elevation of Snail Promotes Glial-Mesenchymal Transition after Irradiation in Malignant Glioma. Neuro Oncol 2014, 16, 671–685. [Google Scholar] [CrossRef] [PubMed]
- Kahlert, U.D.; Nikkhah, G.; Maciaczyk, J. Epithelial-to-Mesenchymal(-like) Transition as a Relevant Molecular Event in Malignant Gliomas. Cancer Lett 2013, 331, 131–138. [Google Scholar] [CrossRef] [PubMed]
- Vasaikar, S. V; Deshmukh, A.P.; den Hollander, P.; Addanki, S.; Kuburich, N.A.; Kudaravalli, S.; Joseph, R.; Chang, J.T.; Soundararajan, R.; Mani, S.A. EMTome: A Resource for Pan-Cancer Analysis of Epithelial-Mesenchymal Transition Genes and Signatures. Br J Cancer 2021, 124, 259–269. [Google Scholar] [CrossRef] [PubMed]
- Iwadate, Y. Epithelial-Mesenchymal Transition in Glioblastoma Progression. Oncol Lett 2016, 11, 1615–1620. [Google Scholar] [CrossRef] [PubMed]
- Krex, D.; Klink, B.; Hartmann, C.; von Deimling, A.; Pietsch, T.; Simon, M.; Sabel, M.; Steinbach, J.P.; Heese, O.; Reifenberger, G.; et al. Long-Term Survival with Glioblastoma Multiforme. Brain 2007, 130, 2596–2606. [Google Scholar] [CrossRef] [PubMed]
- Johnson, D.R.; O’Neill, B.P. Glioblastoma Survival in the United States before and during the Temozolomide Era. J Neurooncol 2012, 107, 359–364. [Google Scholar] [CrossRef] [PubMed]
- Turanli, B.; Altay, O.; Borén, J.; Turkez, H.; Nielsen, J.; Uhlen, M.; Arga, K.Y.; Mardinoglu, A. Systems Biology Based Drug Repositioning for Development of Cancer Therapy. Semin Cancer Biol 2021, 68, 47–58. [Google Scholar] [CrossRef] [PubMed]
- Pushpakom, S.; Iorio, F.; Eyers, P.A.; Escott, K.J.; Hopper, S.; Wells, A.; Doig, A.; Guilliams, T.; Latimer, J.; McNamee, C.; et al. Drug Repurposing: Progress, Challenges and Recommendations. Nat Rev Drug Discov 2019, 18, 41–58. [Google Scholar] [CrossRef] [PubMed]
- Oliva, C.R.; Zhang, W.; Langford, C.; Suto, M.J.; Griguer, C.E. Repositioning Chlorpromazine for Treating Chemoresistant Glioma through the Inhibition of Cytochrome c Oxidase Bearing the COX4-1 Regulatory Subunit. Oncotarget 2017, 8, 37568–37583. [Google Scholar] [CrossRef] [PubMed]
- Shchors, K.; Massaras, A.; Hanahan, D. Dual Targeting of the Autophagic Regulatory Circuitry in Gliomas with Repurposed Drugs Elicits Cell-Lethal Autophagy and Therapeutic Benefit. Cancer Cell 2015, 28, 456–471. [Google Scholar] [CrossRef] [PubMed]
- Weyerhäuser, P.; Kantelhardt, S.R.; Kim, E.L. Re-Purposing Chloroquine for Glioblastoma: Potential Merits and Confounding Variables. Front Oncol 2018, 8, 335. [Google Scholar] [CrossRef] [PubMed]
- Mazurek, M.; Litak, J.; Kamieniak, P.; Kulesza, B.; Jonak, K.; Baj, J.; Grochowski, C. Metformin as Potential Therapy for High-Grade Glioma. Cancers (Basel) 2020, 12. [Google Scholar] [CrossRef] [PubMed]
- Würth, R.; Pattarozzi, A.; Gatti, M.; Bajetto, A.; Corsaro, A.; Parodi, A.; Sirito, R.; Massollo, M.; Marini, C.; Zona, G.; et al. Metformin Selectively Affects Human Glioblastoma Tumor-Initiating Cell Viability: A Role for Metformin-Induced Inhibition of Akt. Cell Cycle 2013, 12, 145–156. [Google Scholar] [CrossRef] [PubMed]
- Zhong, S.; Liu, S.; Shi, X.; Zhang, X.; Li, K.; Liu, G.; Li, L.; Tao, S.; Zheng, B.; Sheng, W.; et al. Disulfiram in Glioma: Literature Review of Drug Repurposing. Front Pharmacol 2022, 13, 933655. [Google Scholar] [CrossRef] [PubMed]
- Cruz Da Silva, E.; Mercier, M.-C.; Etienne-Selloum, N.; Dontenwill, M.; Choulier, L. A Systematic Review of Glioblastoma-Targeted Therapies in Phases II, III, IV Clinical Trials. Cancers (Basel) 2021, 13. [Google Scholar] [CrossRef] [PubMed]
- Stupp, R.; Mason, W.P.; van den Bent, M.J.; Weller, M.; Fisher, B.; Taphoorn, M.J.B.; Belanger, K.; Brandes, A.A.; Marosi, C.; Bogdahn, U.; et al. Radiotherapy plus Concomitant and Adjuvant Temozolomide for Glioblastoma. N Engl J Med 2005, 352, 987–996. [Google Scholar] [CrossRef] [PubMed]
- Lee, S.Y. Temozolomide Resistance in Glioblastoma Multiforme. Genes Dis 2016, 3, 198–210. [Google Scholar] [CrossRef] [PubMed]
- Kaina, B.; Christmann, M.; Naumann, S.; Roos, W.P. MGMT: Key Node in the Battle against Genotoxicity, Carcinogenicity and Apoptosis Induced by Alkylating Agents. DNA Repair (Amst) 2007, 6, 1079–1099. [Google Scholar] [CrossRef]
- Lee, J.-K.; Liu, Z.; Sa, J.K.; Shin, S.; Wang, J.; Bordyuh, M.; Cho, H.J.; Elliott, O.; Chu, T.; Choi, S.W.; et al. Pharmacogenomic Landscape of Patient-Derived Tumor Cells Informs Precision Oncology Therapy. Nat Genet 2018, 50, 1399–1411. [Google Scholar] [CrossRef] [PubMed]
- Jung, J.; Gilbert, M.R.; Park, D.M. Isolation and Propagation of Glioma Stem Cells from Acutely Resected Tumors. Methods Mol Biol 2016, 1516, 361–369. [Google Scholar] [CrossRef] [PubMed]
- Rich, J.N.; Eyler, C.E. Cancer Stem Cells in Brain Tumor Biology. Cold Spring Harb Symp Quant Biol 2008, 73, 411–420. [Google Scholar] [CrossRef] [PubMed]
- Huang, Z.; Cheng, L.; Guryanova, O.A.; Wu, Q.; Bao, S. Cancer Stem Cells in Glioblastoma--Molecular Signaling and Therapeutic Targeting. Protein Cell 2010, 1, 638–655. [Google Scholar] [CrossRef] [PubMed]
- Xie, Y.; Bergström, T.; Jiang, Y.; Johansson, P.; Marinescu, V.D.; Lindberg, N.; Segerman, A.; Wicher, G.; Niklasson, M.; Baskaran, S.; et al. The Human Glioblastoma Cell Culture Resource: Validated Cell Models Representing All Molecular Subtypes. EBioMedicine 2015, 2, 1351–1363. [Google Scholar] [CrossRef] [PubMed]
- Roura, A.-J.; Szadkowska, P.; Poleszak, K.; Dabrowski, M.J.; Ellert-Miklaszewska, A.; Wojnicki, K.; Ciechomska, I.A.; Stepniak, K.; Kaminska, B.; Wojtas, B. Regulatory Networks Driving Expression of Genes Critical for Glioblastoma Are Controlled by the Transcription Factor C-Jun and the Pre-Existing Epigenetic Modifications. bioRxiv 2022, 2022.07.18.500476. [Google Scholar] [CrossRef]
- Abdullah, K.G.; Bird, C.E.; Buehler, J.D.; Gattie, L.C.; Savani, M.R.; Sternisha, A.C.; Xiao, Y.; Levitt, M.M.; Hicks, W.H.; Li, W.; et al. Establishment of Patient-Derived Organoid Models of Lower-Grade Glioma. Neuro Oncol 2022, 24, 612–623. [Google Scholar] [CrossRef] [PubMed]
- Post, G.R.; Dawson, G. Characterization of a Cell Line Derived from a Human Oligodendroglioma. Mol Chem Neuropathol 1992, 16, 303–317. [Google Scholar] [CrossRef] [PubMed]
- Kelly, J.J.P.; Blough, M.D.; Stechishin, O.D.M.; Chan, J.A.W.; Beauchamp, D.; Perizzolo, M.; Demetrick, D.J.; Steele, L.; Auer, R.N.; Hader, W.J.; et al. Oligodendroglioma Cell Lines Containing t(1;19)(Q10;P10). Neuro Oncol 2010, 12, 745–755. [Google Scholar] [CrossRef] [PubMed]
- Rohle, D.; Popovici-Muller, J.; Palaskas, N.; Turcan, S.; Grommes, C.; Campos, C.; Tsoi, J.; Clark, O.; Oldrini, B.; Komisopoulou, E.; et al. An Inhibitor of Mutant IDH1 Delays Growth and Promotes Differentiation of Glioma Cells. Science 2013, 340, 626–630. [Google Scholar] [CrossRef] [PubMed]
- Jones, L.E.; Hilz, S.; Grimmer, M.R.; Mazor, T.; Najac, C.; Mukherjee, J.; McKinney, A.; Chow, T.; Pieper, R.O.; Ronen, S.M.; et al. Patient-Derived Cells from Recurrent Tumors That Model the Evolution of IDH-Mutant Glioma. Neurooncol Adv 2020, 2, vdaa088. [Google Scholar] [CrossRef] [PubMed]
- Lee, J.; Kotliarova, S.; Kotliarov, Y.; Li, A.; Su, Q.; Donin, N.M.; Pastorino, S.; Purow, B.W.; Christopher, N.; Zhang, W.; et al. Tumor Stem Cells Derived from Glioblastomas Cultured in BFGF and EGF More Closely Mirror the Phenotype and Genotype of Primary Tumors than Do Serum-Cultured Cell Lines. Cancer Cell 2006, 9, 391–403. [Google Scholar] [CrossRef] [PubMed]
- Vogel, T.W.; Zhuang, Z.; Li, J.; Okamoto, H.; Furuta, M.; Lee, Y.-S.; Zeng, W.; Oldfield, E.H.; Vortmeyer, A.O.; Weil, R.J. Proteins and Protein Pattern Differences between Glioma Cell Lines and Glioblastoma Multiforme. Clin Cancer Res 2005, 11, 3624–3632. [Google Scholar] [CrossRef] [PubMed]
- Phillips, H.S.; Kharbanda, S.; Chen, R.; Forrest, W.F.; Soriano, R.H.; Wu, T.D.; Misra, A.; Nigro, J.M.; Colman, H.; Soroceanu, L.; et al. Molecular Subclasses of High-Grade Glioma Predict Prognosis, Delineate a Pattern of Disease Progression, and Resemble Stages in Neurogenesis. Cancer Cell 2006, 9, 157–173. [Google Scholar] [CrossRef] [PubMed]
- Motomura, K.; Natsume, A.; Watanabe, R.; Ito, I.; Kato, Y.; Momota, H.; Nishikawa, R.; Mishima, K.; Nakasu, Y.; Abe, T.; et al. Immunohistochemical Analysis-Based Proteomic Subclassification of Newly Diagnosed Glioblastomas. Cancer Sci 2012, 103, 1871–1879. [Google Scholar] [CrossRef] [PubMed]
- Jankowska, S.; Lewandowska, M.; Masztalewicz, M.; Sagan, L.; Nowacki, P.; Urasińska, E. Molecular Classification of Glioblastoma Based on Immunohistochemical Expression of EGFR, PDGFRA, NF1, IDH1, P53 and PTEN Proteins. Pol J Pathol 2021, 72, 1–10. [Google Scholar] [CrossRef]
- Endoh, H.; Ishibashi, Y.; Yamaki, E.; Yoshida, T.; Yajima, T.; Kimura, H.; Kosaka, T.; Onozato, R.; Tanaka, S.; Mitsudomi, T.; et al. Immunohistochemical Analysis of Phosphorylated Epidermal Growth Factor Receptor Might Provide a Surrogate Marker of EGFR Mutation. Lung Cancer 2009, 63, 241–246. [Google Scholar] [CrossRef] [PubMed]
- Louis, D.N.; Perry, A.; Wesseling, P.; Brat, D.J.; Cree, I.A.; Figarella-Branger, D.; Hawkins, C.; Ng, H.K.; Pfister, S.M.; Reifenberger, G.; et al. The 2021 WHO Classification of Tumors of the Central Nervous System: A Summary. Neuro Oncol 2021, 23, 1231–1251. [Google Scholar] [CrossRef] [PubMed]
- Takano, S.; Tian, W.; Matsuda, M.; Yamamoto, T.; Ishikawa, E.; Kaneko, M.K.; Yamazaki, K.; Kato, Y.; Matsumura, A. Detection of IDH1 Mutation in Human Gliomas: Comparison of Immunohistochemistry and Sequencing. Brain Tumor Pathol 2011, 28, 115–123. [Google Scholar] [CrossRef] [PubMed]
- Lukashchuk, N.; Vousden, K.H. Ubiquitination and Degradation of Mutant P53. Mol Cell Biol 2007, 27, 8284–8295. [Google Scholar] [CrossRef]
- Jin, X.; Kim, L.J.Y.; Wu, Q.; Wallace, L.C.; Prager, B.C.; Sanvoranart, T.; Gimple, R.C.; Wang, X.; Mack, S.C.; Miller, T.E.; et al. Targeting Glioma Stem Cells through Combined BMI1 and EZH2 Inhibition. Nat Med 2017, 23, 1352–1361. [Google Scholar] [CrossRef]
- Bhat, K.P.L.; Balasubramaniyan, V.; Vaillant, B.; Ezhilarasan, R.; Hummelink, K.; Hollingsworth, F.; Wani, K.; Heathcock, L.; James, J.D.; Goodman, L.D.; et al. Mesenchymal Differentiation Mediated by NF-ΚB Promotes Radiation Resistance in Glioblastoma. Cancer Cell 2013, 24, 331–346. [Google Scholar] [CrossRef] [PubMed]
- Lo, H.-W.; Hsu, S.-C.; Xia, W.; Cao, X.; Shih, J.-Y.; Wei, Y.; Abbruzzese, J.L.; Hortobagyi, G.N.; Hung, M.-C. Epidermal Growth Factor Receptor Cooperates with Signal Transducer and Activator of Transcription 3 to Induce Epithelial-Mesenchymal Transition in Cancer Cells via up-Regulation of TWIST Gene Expression. Cancer Res 2007, 67, 9066–9076. [Google Scholar] [CrossRef] [PubMed]
- Wendt, M.K.; Balanis, N.; Carlin, C.R.; Schiemann, W.P. STAT3 and Epithelial-Mesenchymal Transitions in Carcinomas. JAKSTAT 2014, 3, e28975. [Google Scholar] [CrossRef] [PubMed]
- Sullivan, N.J.; Sasser, A.K.; Axel, A.E.; Vesuna, F.; Raman, V.; Ramirez, N.; Oberyszyn, T.M.; Hall, B.M. Interleukin-6 Induces an Epithelial-Mesenchymal Transition Phenotype in Human Breast Cancer Cells. Oncogene 2009, 28, 2940–2947. [Google Scholar] [CrossRef] [PubMed]
- Orzan, F.; Pagani, F.; Cominelli, M.; Triggiani, L.; Calza, S.; De Bacco, F.; Medicina, D.; Balzarini, P.; Panciani, P.P.; Liserre, R.; et al. A Simplified Integrated Molecular and Immunohistochemistry-Based Algorithm Allows High Accuracy Prediction of Glioblastoma Transcriptional Subtypes. Lab Invest 2020, 100, 1330–1344. [Google Scholar] [CrossRef] [PubMed]
- Van Meir, E.G.; Hadjipanayis, C.G.; Norden, A.D.; Shu, H.-K.; Wen, P.Y.; Olson, J.J. Exciting New Advances in Neuro-Oncology: The Avenue to a Cure for Malignant Glioma. CA Cancer J Clin 2010, 60, 166–193. [Google Scholar] [CrossRef] [PubMed]
- Tilak, M.; Holborn, J.; New, L.A.; Lalonde, J.; Jones, N. Receptor Tyrosine Kinase Signaling and Targeting in Glioblastoma Multiforme. Int J Mol Sci 2021, 22. [Google Scholar] [CrossRef] [PubMed]
- Han, Y.; Caday, C.G.; Nanda, A.; Cavenee, W.K.; Huang, H.J. Tyrphostin AG 1478 Preferentially Inhibits Human Glioma Cells Expressing Truncated Rather than Wild-Type Epidermal Growth Factor Receptors. Cancer Res 1996, 56, 3859–3861. [Google Scholar] [PubMed]
- Gan, H.K.; Walker, F.; Burgess, A.W.; Rigopoulos, A.; Scott, A.M.; Johns, T.G. The Epidermal Growth Factor Receptor (EGFR) Tyrosine Kinase Inhibitor AG1478 Increases the Formation of Inactive Untethered EGFR Dimers. Implications for Combination Therapy with Monoclonal Antibody 806. J Biol Chem 2007, 282, 2840–2850. [Google Scholar] [CrossRef] [PubMed]
- Nagane, M.; Levitzki, A.; Gazit, A.; Cavenee, W.K.; Huang, H.J. Drug Resistance of Human Glioblastoma Cells Conferred by a Tumor-Specific Mutant Epidermal Growth Factor Receptor through Modulation of Bcl-XL and Caspase-3-like Proteases. Proc Natl Acad Sci U S A 1998, 95, 5724–5729. [Google Scholar] [CrossRef] [PubMed]
- Lei, W.; Mayotte, J.E.; Levitt, M.L. Enhancement of Chemosensitivity and Programmed Cell Death by Tyrosine Kinase Inhibitors Correlates with EGFR Expression in Non-Small Cell Lung Cancer Cells. Anticancer Res 1999, 19, 221–228. [Google Scholar] [PubMed]
- Busse, D.; Doughty, R.S.; Ramsey, T.T.; Russell, W.E.; Price, J.O.; Flanagan, W.M.; Shawver, L.K.; Arteaga, C.L. Reversible G(1) Arrest Induced by Inhibition of the Epidermal Growth Factor Receptor Tyrosine Kinase Requires up-Regulation of P27(KIP1) Independent of MAPK Activity. J Biol Chem 2000, 275, 6987–6995. [Google Scholar] [CrossRef] [PubMed]
- Nagane, M.; Narita, Y.; Mishima, K.; Levitzki, A.; Burgess, A.W.; Cavenee, W.K.; Huang, H.J. Human Glioblastoma Xenografts Overexpressing a Tumor-Specific Mutant Epidermal Growth Factor Receptor Sensitized to Cisplatin by the AG1478 Tyrosine Kinase Inhibitor. J Neurosurg 2001, 95, 472–479. [Google Scholar] [CrossRef] [PubMed]
- Perera, R.M.; Narita, Y.; Furnari, F.B.; Gan, H.K.; Murone, C.; Ahlkvist, M.; Luwor, R.B.; Burgess, A.W.; Stockert, E.; Jungbluth, A.A.; et al. Treatment of Human Tumor Xenografts with Monoclonal Antibody 806 in Combination with a Prototypical Epidermal Growth Factor Receptor-Specific Antibody Generates Enhanced Antitumor Activity. Clin Cancer Res 2005, 11, 6390–6399. [Google Scholar] [CrossRef] [PubMed]
- Johns, T.G.; Luwor, R.B.; Murone, C.; Walker, F.; Weinstock, J.; Vitali, A.A.; Perera, R.M.; Jungbluth, A.A.; Stockert, E.; Old, L.J.; et al. Antitumor Efficacy of Cytotoxic Drugs and the Monoclonal Antibody 806 Is Enhanced by the EGF Receptor Inhibitor AG1478. Proc Natl Acad Sci U S A 2003, 100, 15871–15876. [Google Scholar] [CrossRef] [PubMed]
- Ellis, A.G.; Doherty, M.M.; Walker, F.; Weinstock, J.; Nerrie, M.; Vitali, A.; Murphy, R.; Johns, T.G.; Scott, A.M.; Levitzki, A.; et al. Preclinical Analysis of the Analinoquinazoline AG1478, a Specific Small Molecule Inhibitor of EGF Receptor Tyrosine Kinase. Biochem Pharmacol 2006, 71, 1422–1434. [Google Scholar] [CrossRef] [PubMed]
- Weller, M.; Felsberg, J.; Hartmann, C.; Berger, H.; Steinbach, J.P.; Schramm, J.; Westphal, M.; Schackert, G.; Simon, M.; Tonn, J.C.; et al. Molecular Predictors of Progression-Free and Overall Survival in Patients With Newly Diagnosed Glioblastoma: A Prospective Translational Study of the German Glioma Network. Journal of Clinical Oncology 2009, 27, 5743–5750. [Google Scholar] [CrossRef] [PubMed]
- Weller, M.; Stupp, R.; Reifenberger, G.; Brandes, A.A.; van den Bent, M.J.; Wick, W.; Hegi, M.E. MGMT Promoter Methylation in Malignant Gliomas: Ready for Personalized Medicine? Nat Rev Neurol 2010, 6, 39–51. [Google Scholar] [CrossRef] [PubMed]
- Binabaj, M.M.; Bahrami, A.; ShahidSales, S.; Joodi, M.; Joudi Mashhad, M.; Hassanian, S.M.; Anvari, K.; Avan, A. The Prognostic Value of MGMT Promoter Methylation in Glioblastoma: A Meta-Analysis of Clinical Trials. J Cell Physiol 2018, 233, 378–386. [Google Scholar] [CrossRef]
- Sareen, H.; Ma, Y.; Becker, T.M.; Roberts, T.L.; de Souza, P.; Powter, B. Molecular Biomarkers in Glioblastoma: A Systematic Review and Meta-Analysis. Int J Mol Sci 2022, 23. [Google Scholar] [CrossRef]
- Comprehensive Genomic Characterization Defines Human Glioblastoma Genes and Core Pathways. Nature 2008, 455, 1061–1068. [CrossRef] [PubMed]
- Zhang, H.; Bajraszewski, N.; Wu, E.; Wang, H.; Moseman, A.P.; Dabora, S.L.; Griffin, J.D.; Kwiatkowski, D.J. PDGFRs Are Critical for PI3K/Akt Activation and Negatively Regulated by MTOR. J Clin Invest 2007, 117, 730–738. [Google Scholar] [CrossRef] [PubMed]
- Sunayama, J.; Matsuda, K.-I.; Sato, A.; Tachibana, K.; Suzuki, K.; Narita, Y.; Shibui, S.; Sakurada, K.; Kayama, T.; Tomiyama, A.; et al. Crosstalk Between the PI3K/MTOR and MEK/ERK Pathways Involved in the Maintenance of Self-Renewal and Tumorigenicity of Glioblastoma Stem-Like Cells. Stem Cells 2010, 28, 1930–1939. [Google Scholar] [CrossRef] [PubMed]
- Mendoza, M.C.; Er, E.E.; Blenis, J. The Ras-ERK and PI3K-MTOR Pathways: Cross-Talk and Compensation. Trends Biochem Sci 2011, 36, 320–328. [Google Scholar] [CrossRef] [PubMed]
- Butt, O.H.; Zhou, A.Y.; Huang, J.; Leidig, W.A.; Silberstein, A.E.; Chheda, M.G.; Johanns, T.M.; Ansstas, G.; Liu, J.; Talcott, G.; et al. A Phase II Study of Laser Interstitial Thermal Therapy Combined with Doxorubicin in Patients with Recurrent Glioblastoma. Neurooncol Adv 2021, 3, vdab164. [Google Scholar] [CrossRef] [PubMed]
Figure 1.
Characterization of glioma patients cohort and transcriptomic and protein-based subtyping of patient-derived primary cell cultures (A-B) Graphical representation of sex (A) and age (B) of patients in the analyzed glioma cohort. Red line represents the mean age. (C) The proliferation capacity of glioblastoma patient-derived primary cell cultures and normal human astrocytes (NHA) determined by MTT metabolism assay, n=3, mean ± SD. (D) Doubling time of primary glioma cell cultures and NHA as a non-malignant control. (E) RNAseq of patient-derived cell cultures represented at the heatmap with Verhaak signatures (MES, CL, PN and NE) for glioblastoma subtypes. (F) Representative immunoblots illustrating the markers of glioblastoma subtypes: IDH1 R132H, CHI3L1, pSTAT3, STAT3 (MES); EGFR (CL); PDGFRα, TP53 (PN) in cultures of human glioma cells, NHA and NTERA-2 cells (NTERA). (G) Quantification of immunoblots. The level of a protein of interest in NHA cells equals 1 and is marked by a solid black line. β-actin was used as a loading control. NHA serves as a non-malignant control, whereas NTERA as a positive control for stemness properties, n=2, mean ± SD.
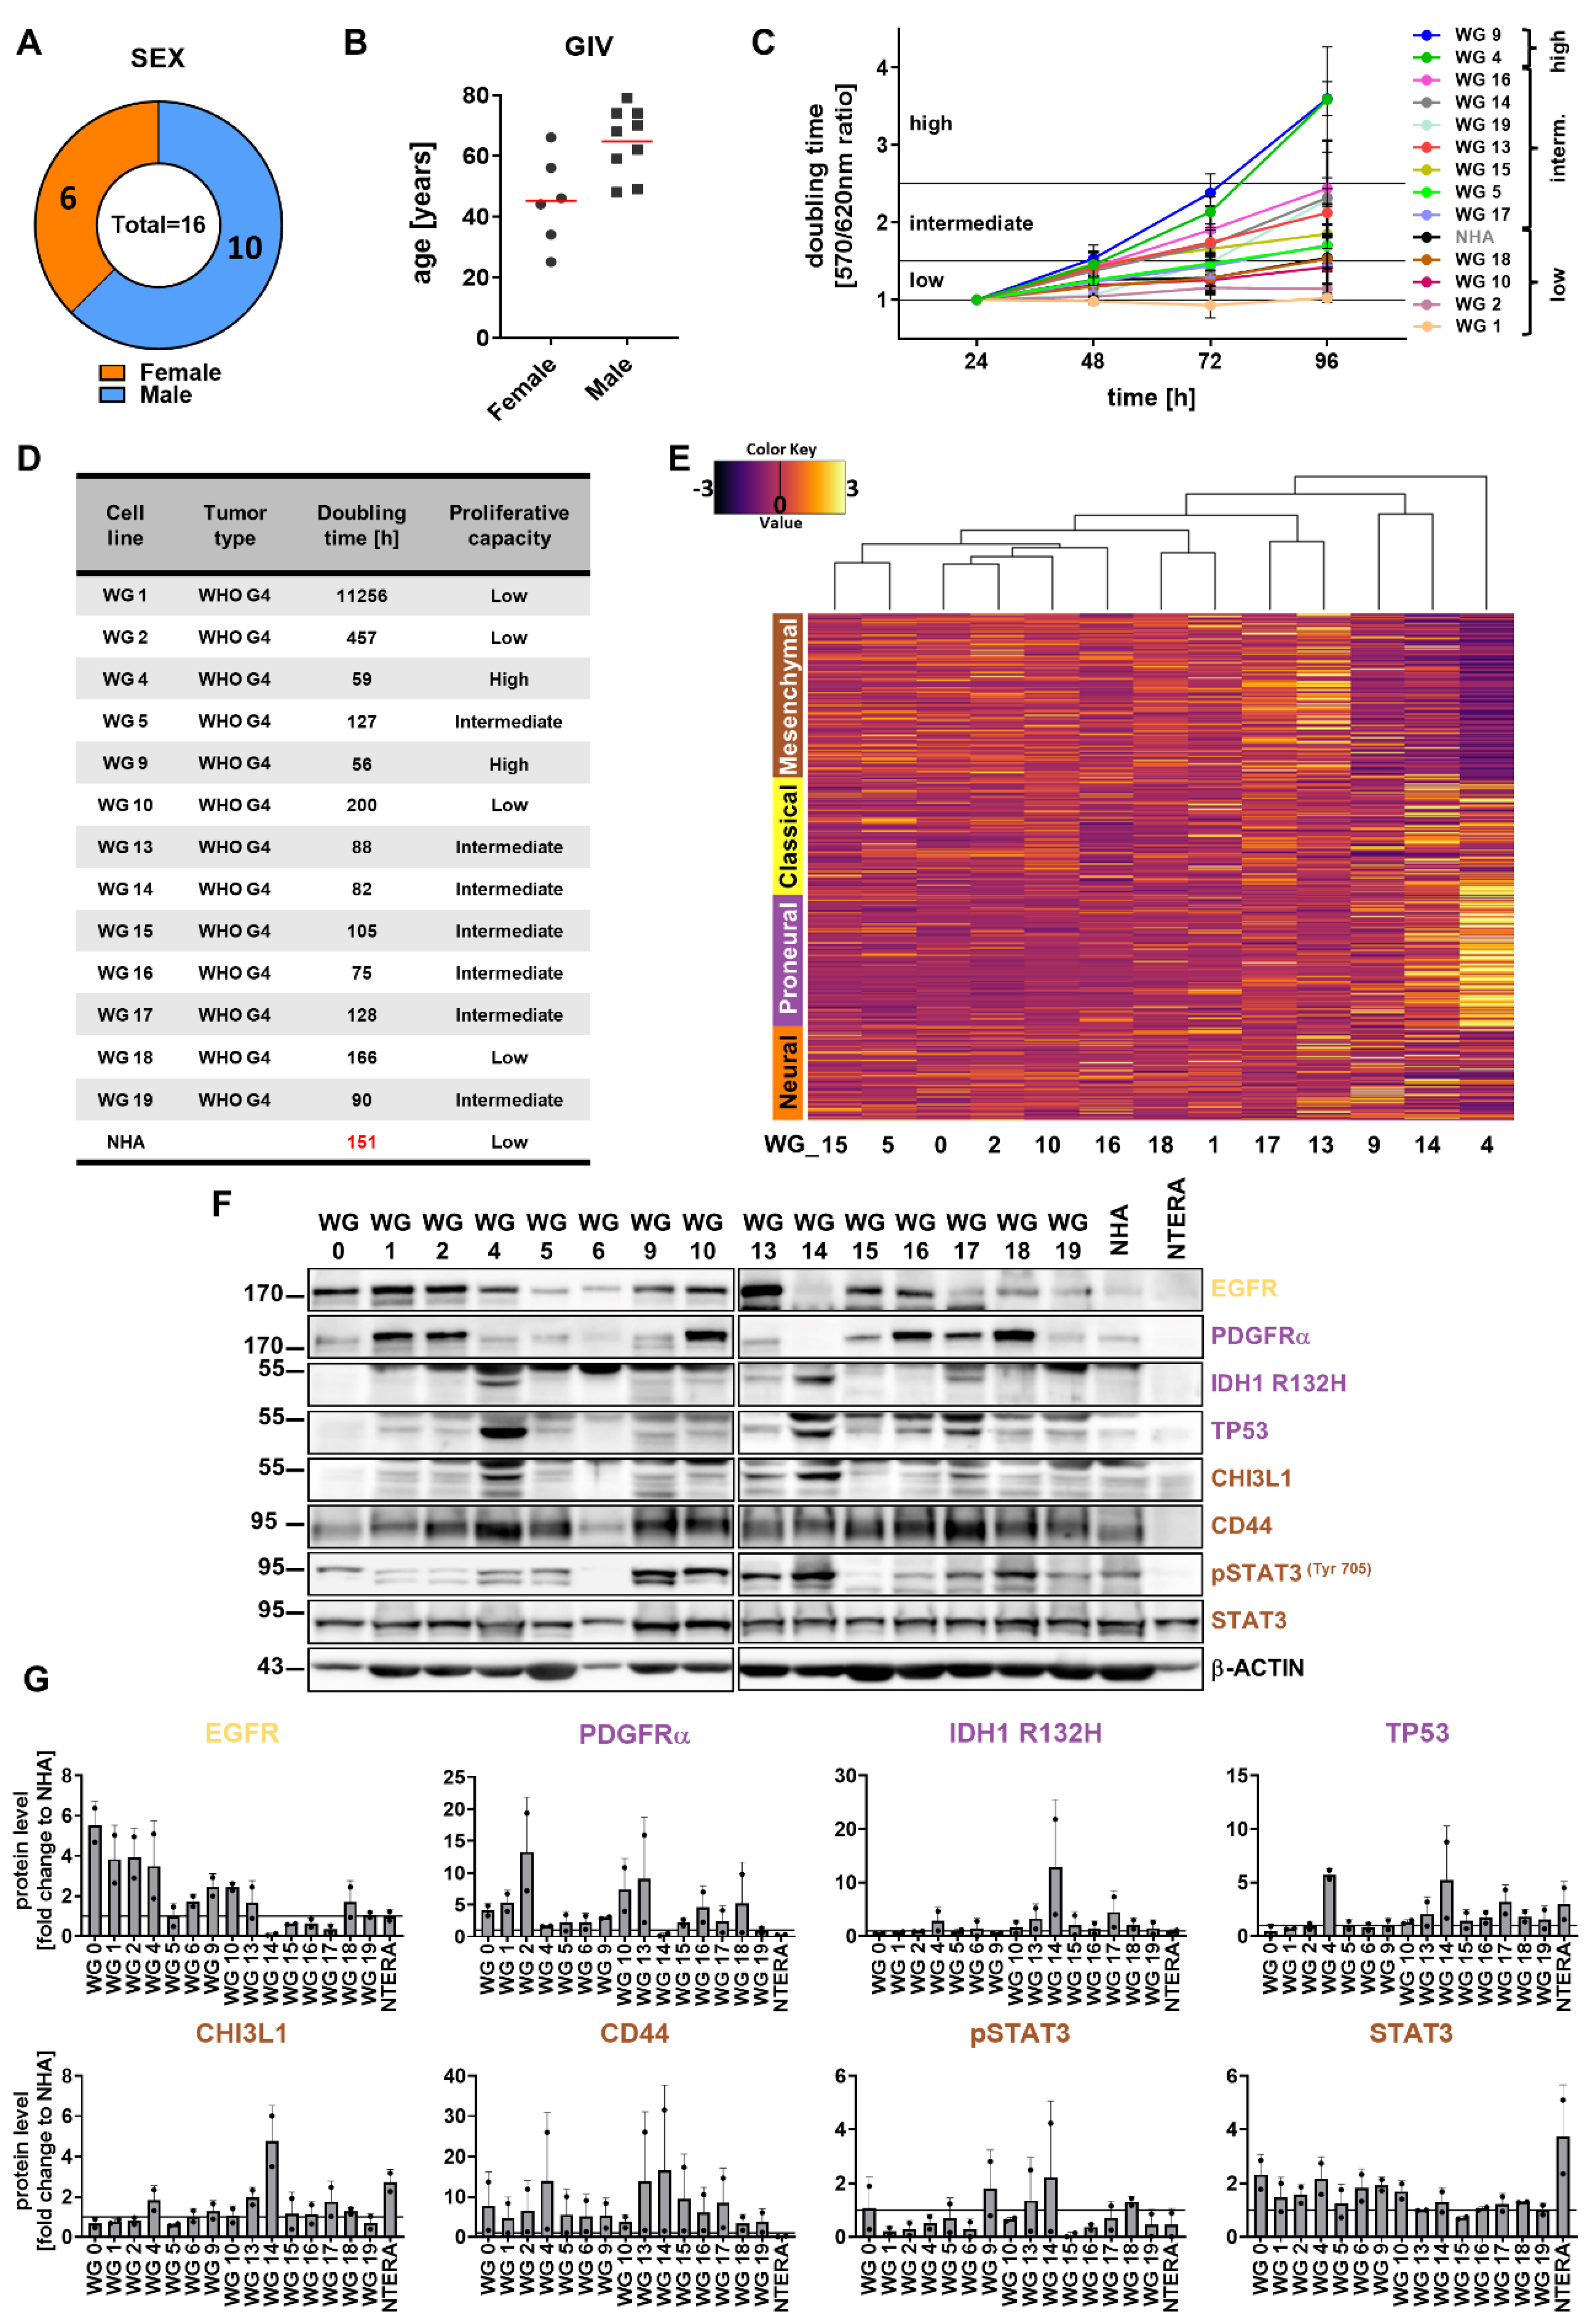
Figure 2.
Stemness and differentiation markers across primary cell cultures. (A) RNAseq of primary cell cultures represented as heatmap with stemness (indicated by blue color) and differentiation (red color) related genes. (B) Expression of selected differentiation (GFAP, TUBBIII) and stemness (SOX2, NESTIN) related genes in human patient-derived primary cultures and NHA as a control. The RT-qPCR data are shown as delta Ct values relative to the 18S expression. (C) Representative immunoblots showing GFAP, β-TUB III and SOX2 levels in glioma primary cultures, NHA and NTERA cells. (D) Quantification of immunoblots. The level of a protein of interest in control cells equals 1 and is marked by a solid black line. β-actin was used as a loading control. NHA serves as a non-malignant control, whereas NTERA as a positive control with stemness properties. Statistical analysis was performed using one way ANOVA with Dunnett’s post hoc test to NHA cells (*p<0.05, **p<0.01, ***p<0.001), n=2, mean ± SD (E) Representative immunofluorescent staining of WG4, WG13, WG14 and WG17 cells displaying the stemness properties, toward the stemness (NESTIN, SOX2) and differentiation (GFAP, β-TUB III, MAP2) markers. White arrows indicate positive nuclear staining. Scale bar: 100 µm.
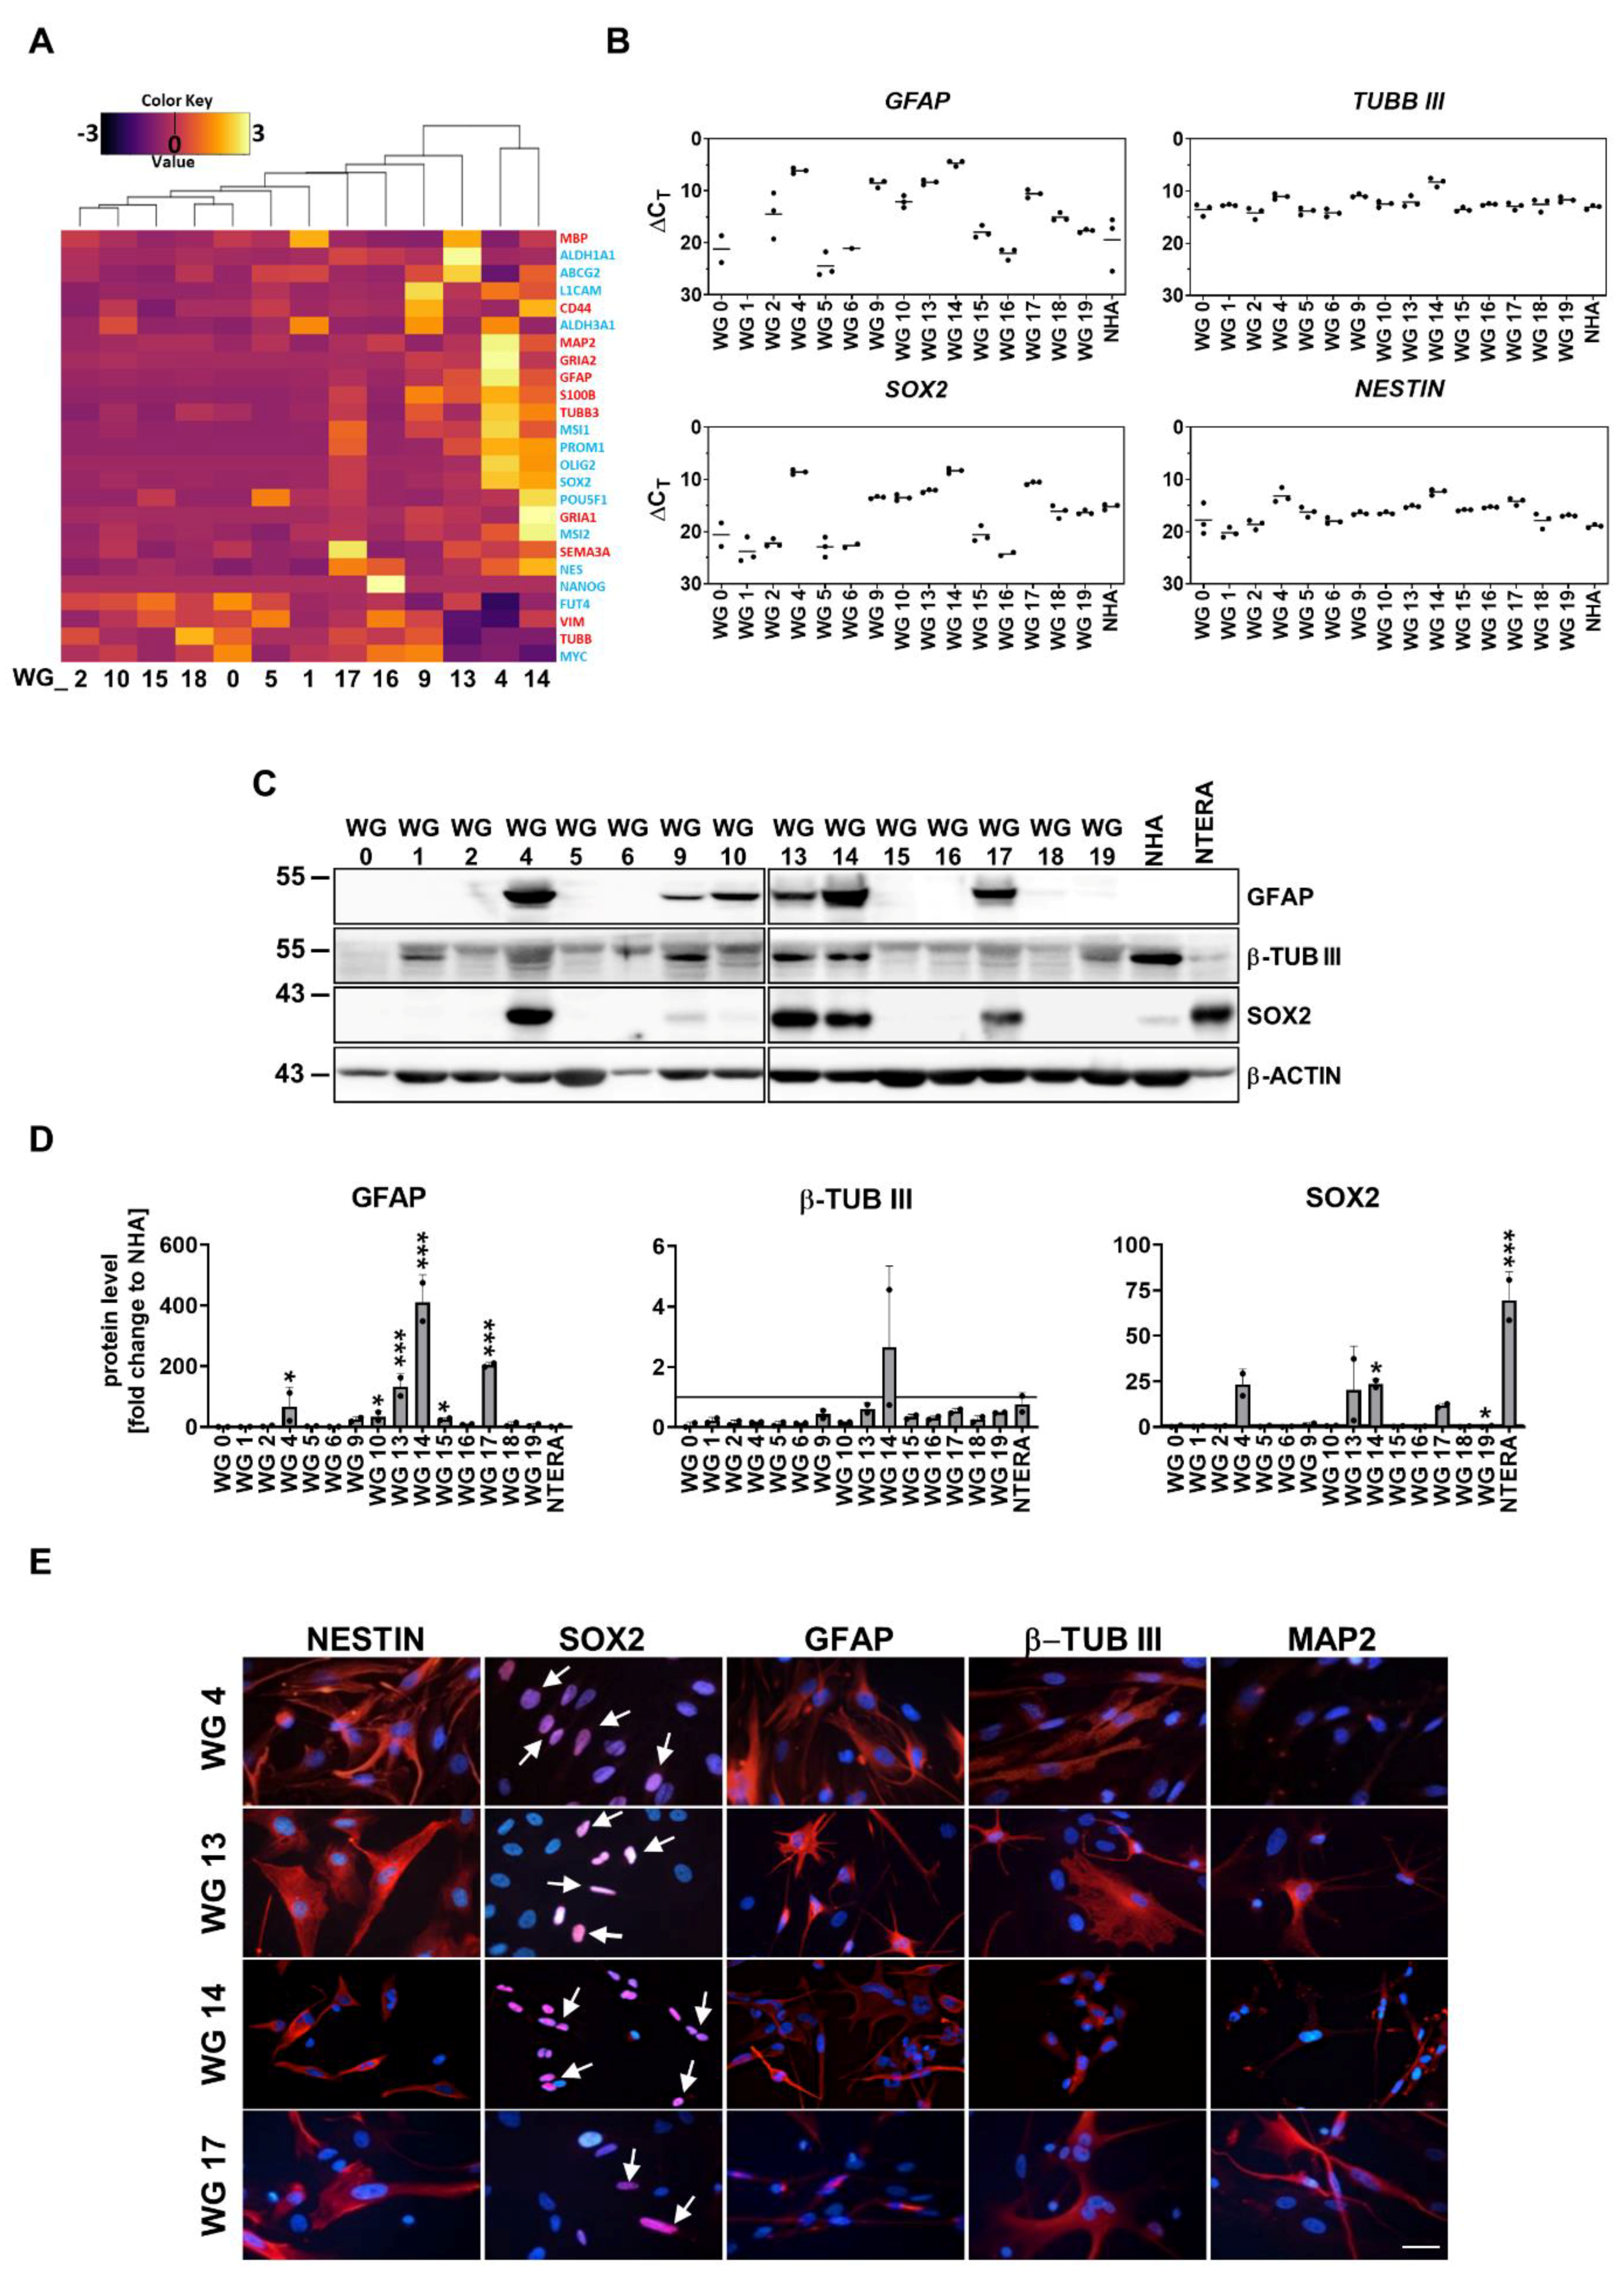
Figure 3.
Characterization of stemness properties of GBM-derived sphere and adherent cell cultures. (A) Morphology of WG14 and L0125 cells in the presence of serum containing media (marked as FBS) or in the growth factors containing media (marked as sph). L0125 serves as a control cell line with stemness properties. (B) Representative immunoblots showing levels of GFAP, β-TUB III (differentiation markers) and OLIG2, SOX2, NANOG, OCT4 (stemness markers) in glioma primary cell cultures, NHA, NTERA, L0125 and L0627 cells. (C) Quantification of immunoblots. The level of a protein of interest in NHA equals 1 and is marked by a solid black line. β-ACTIN was used as a loading control. Statistical analysis was performed using t-test comparing values in sph and FBS groups (*p<0.05, **p<0.01, ***p<0.001), n≥2, ±SD. (D) Expression of chosen differentiation (GFAP, TUBBIII) and stemness (OLIG2, SOX2, NESTIN) related genes in WG14 human patient-derived primary cells, L0125 and L0627 cells, cultured with FBS or with defined media (sph). The RT-qPCR data are shown as delta Ct values relative to the 18S expression. Statistical analysis was performed using t-test (*p<0.05, **p<0.01, ***p<0.001), n≥2, mean ± SD.
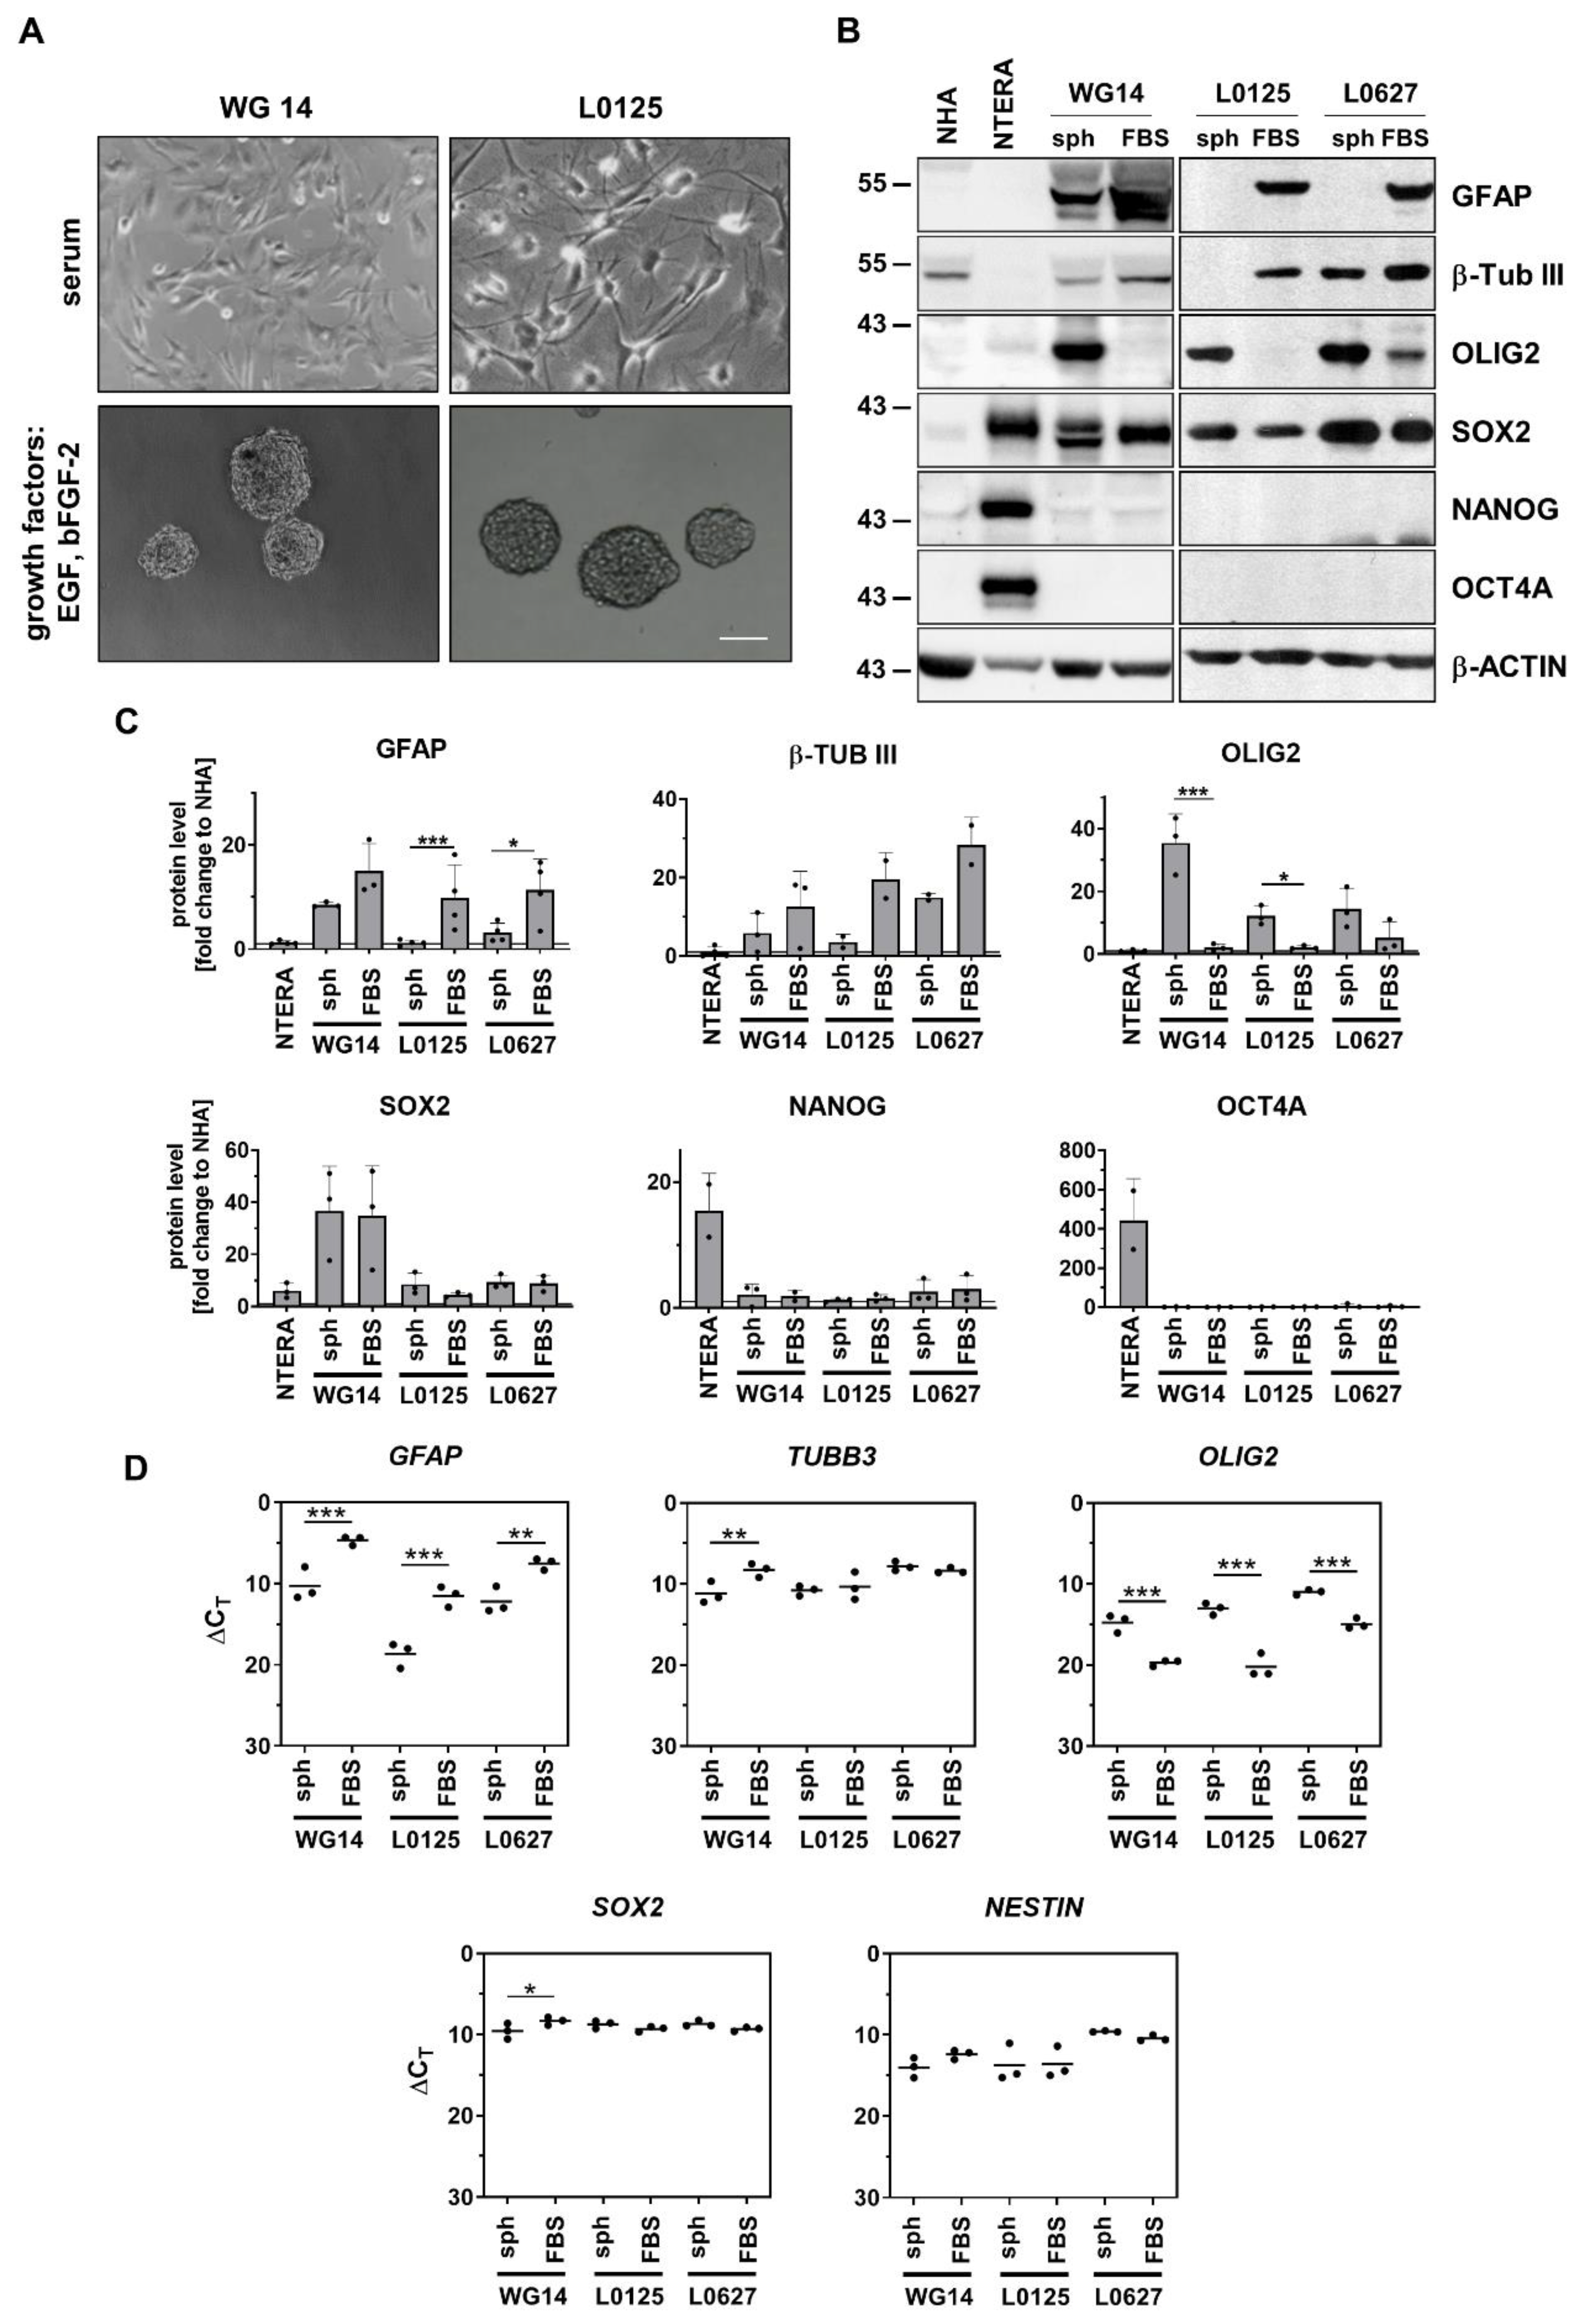
Figure 4.
Epithelial mesenchymal transition (EMT) related genes and proteins in human primary glioma cell cultures (A) Representative immunoblots showing the EMT markers levels in glioma primary cultures, NHA and NTERA cells. (B) Quantification of immunoblots. The level of a protein of interest in NHA cells equals 1 and is marked by a solid black line. β-ACTIN was used as a loading control. Statistical analysis was performed using one way ANOVA with Dunnett’s post hoc test comparing values obtained in tumor cells to NHA cells (*p<0.05, **p<0.01, ***p<0.001), n=2, mean ± SD. (C) Quantification of glioma cell migration using an in vitro scratch assay. Results are presented as the percentage of scratch coverage after 18 h, n=3, mean ± SD.
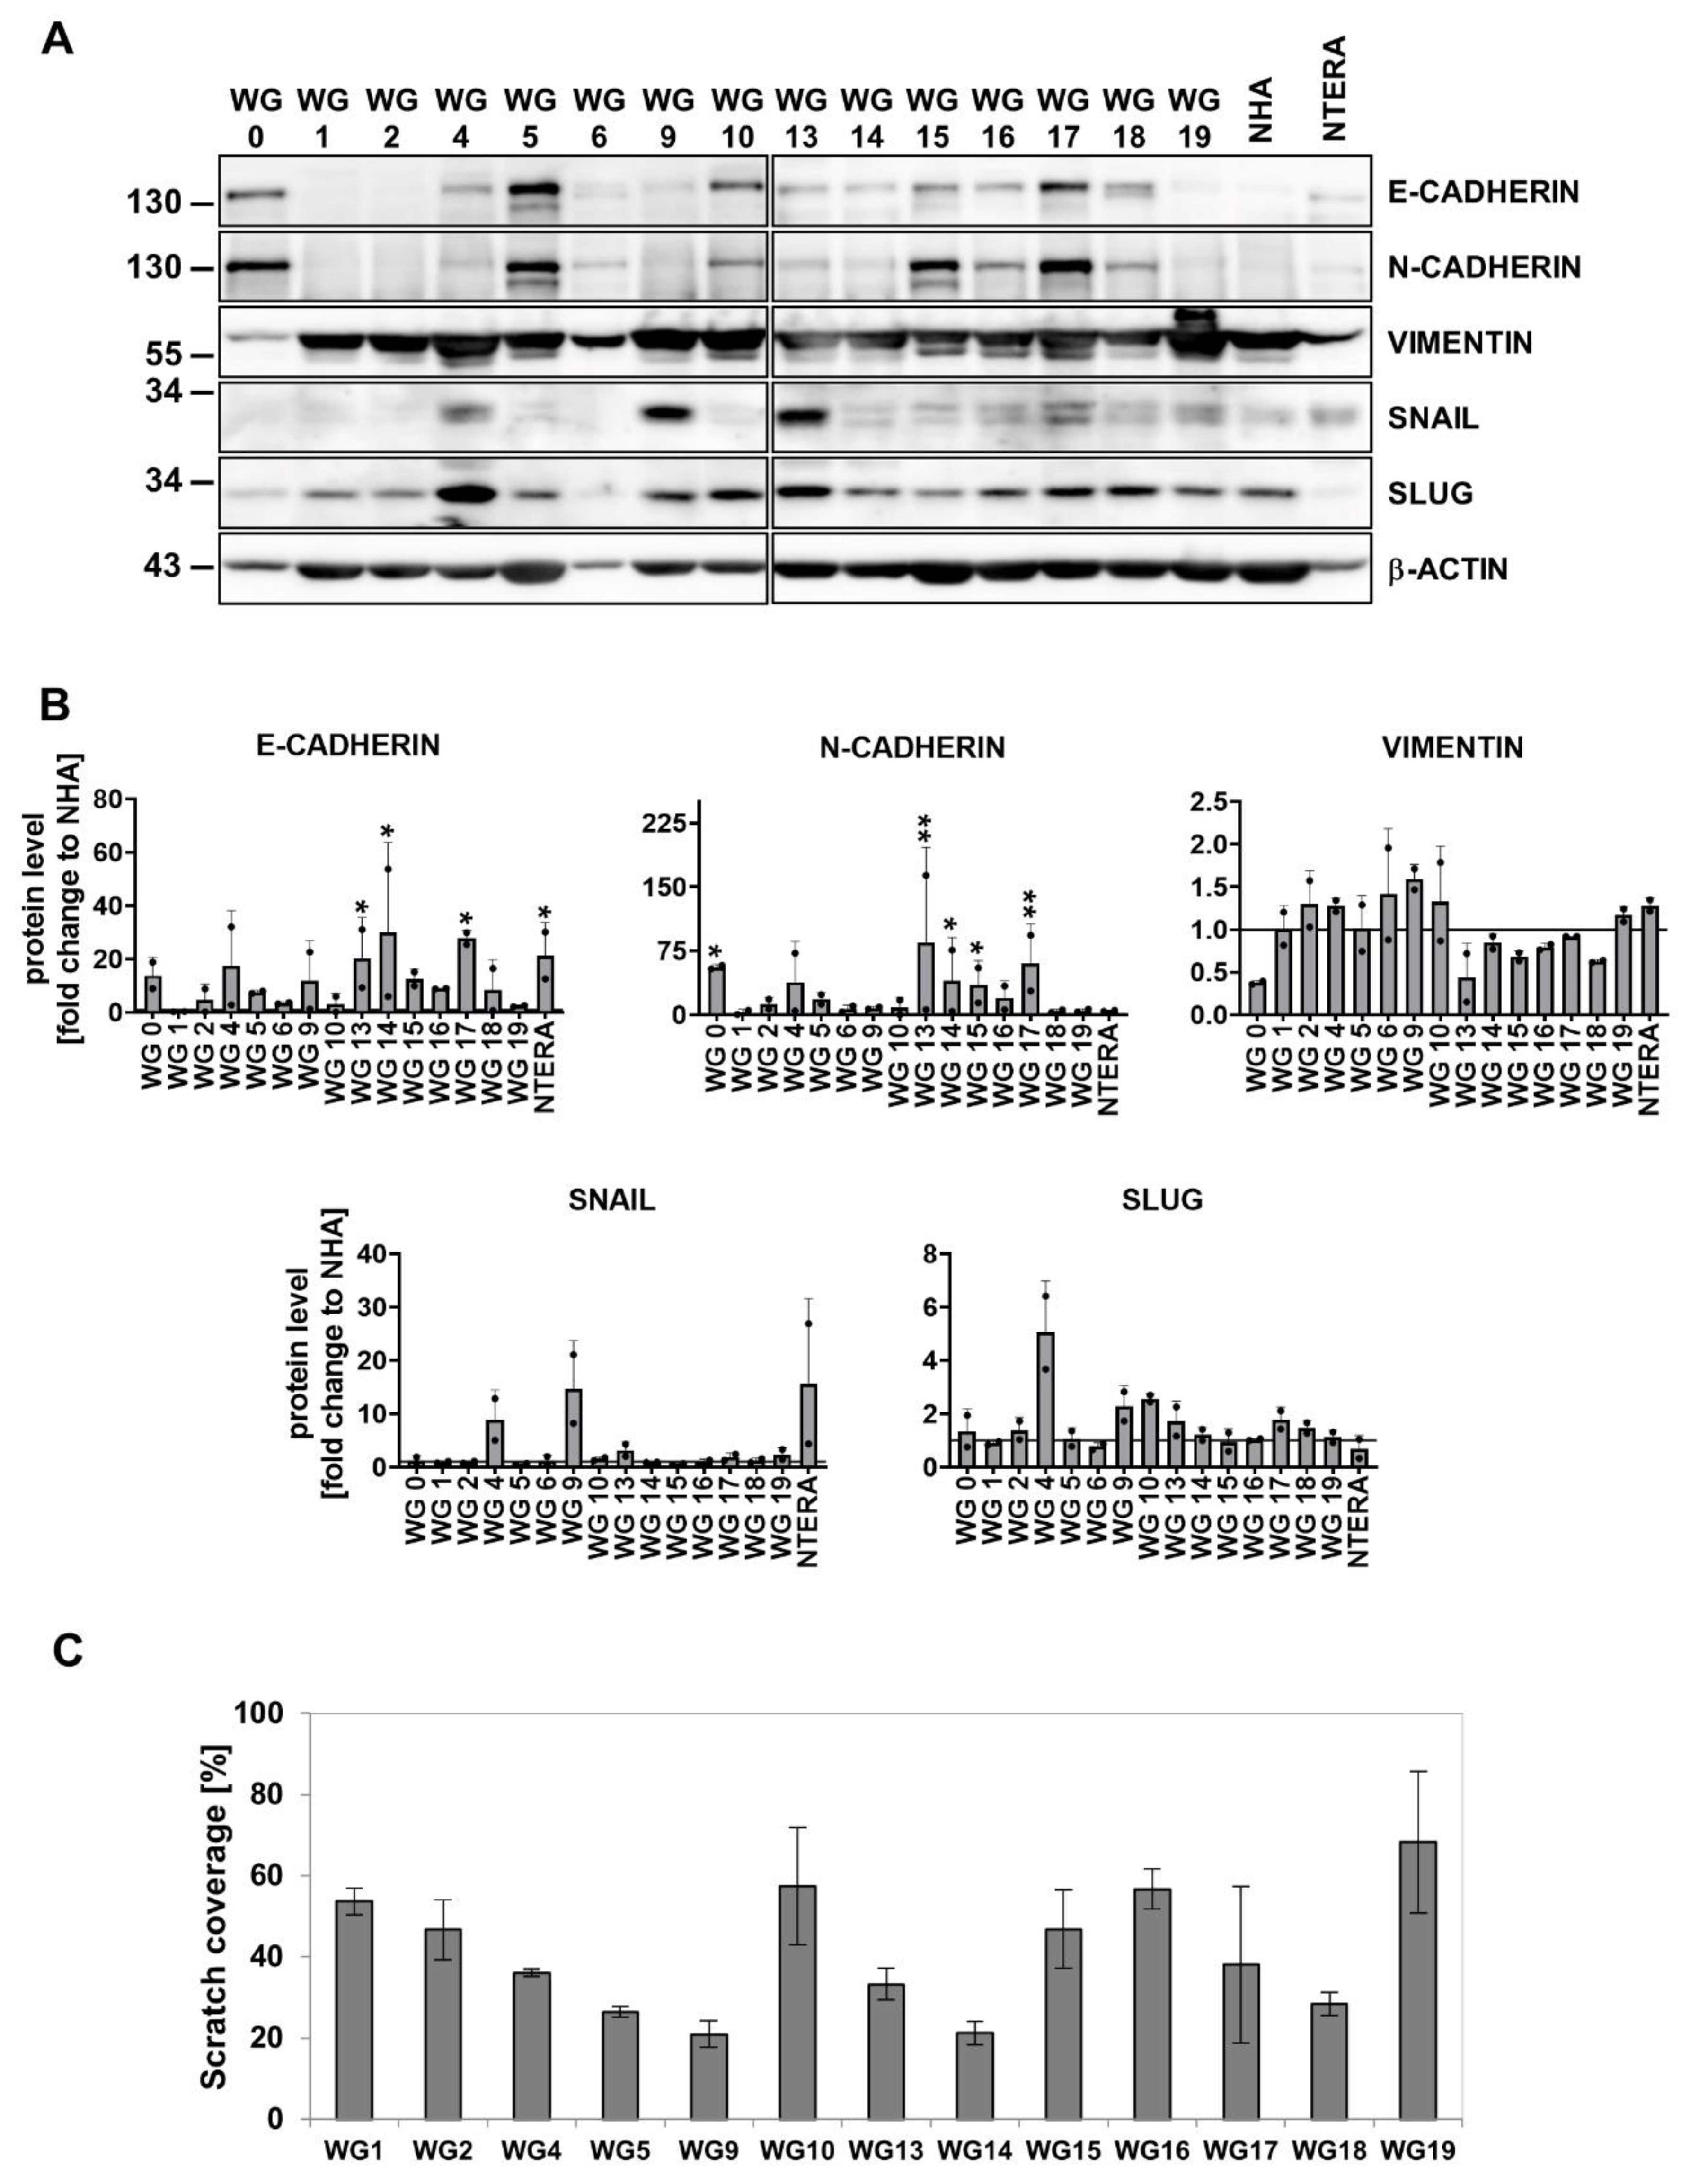
Figure 5.
MGMT promoter methylation and the impact of TMZ on primary glioma cell cultures. (A) Evaluation of the MGMT promoter methylation in primary glioma cell cultures and (B) a summary table. (C) Microscopic images of WG4, WG14 and WG9 treated with TMZ (1 mM, 72 h). Scale bar: 100 µm. (D) Viability of WG4, WG14 and WG9 cells after TMZ treatment, determined by MTT metabolism test. The viability of untreated cells was set as 100% and marked with a black solid line. Statistical analysis was performed on raw data using t-test in comparison of treated to control groups (*p<0.05, **p<0.01, ***p<0.001), n=5, mean ± SD. (E) Representative immunoblots showing the levels of apoptotic proteins: cleaved caspase 3, cleaved caspase 7 and cleaved PARP (cl. CASP 3, cl. CASP 7, cl. PARP, respectively) in TMZ treated WG4, WG14 and WG9 cells. (F) Quantification of immunoblots. The level of a protein of interest in control cells equals 1 and is marked by a solid black line. β-actin was used as a loading control. Statistical significance was determined by one-way ANOVA followed by Dunnett’s post hoc test in comparison of treated to untreated cells (*p<0.05, **p<0.01, ***p<0.001) or between the cell lines (#p<0.05, ##p<0.01, ###p<0.001), n=3, mean ± SD.
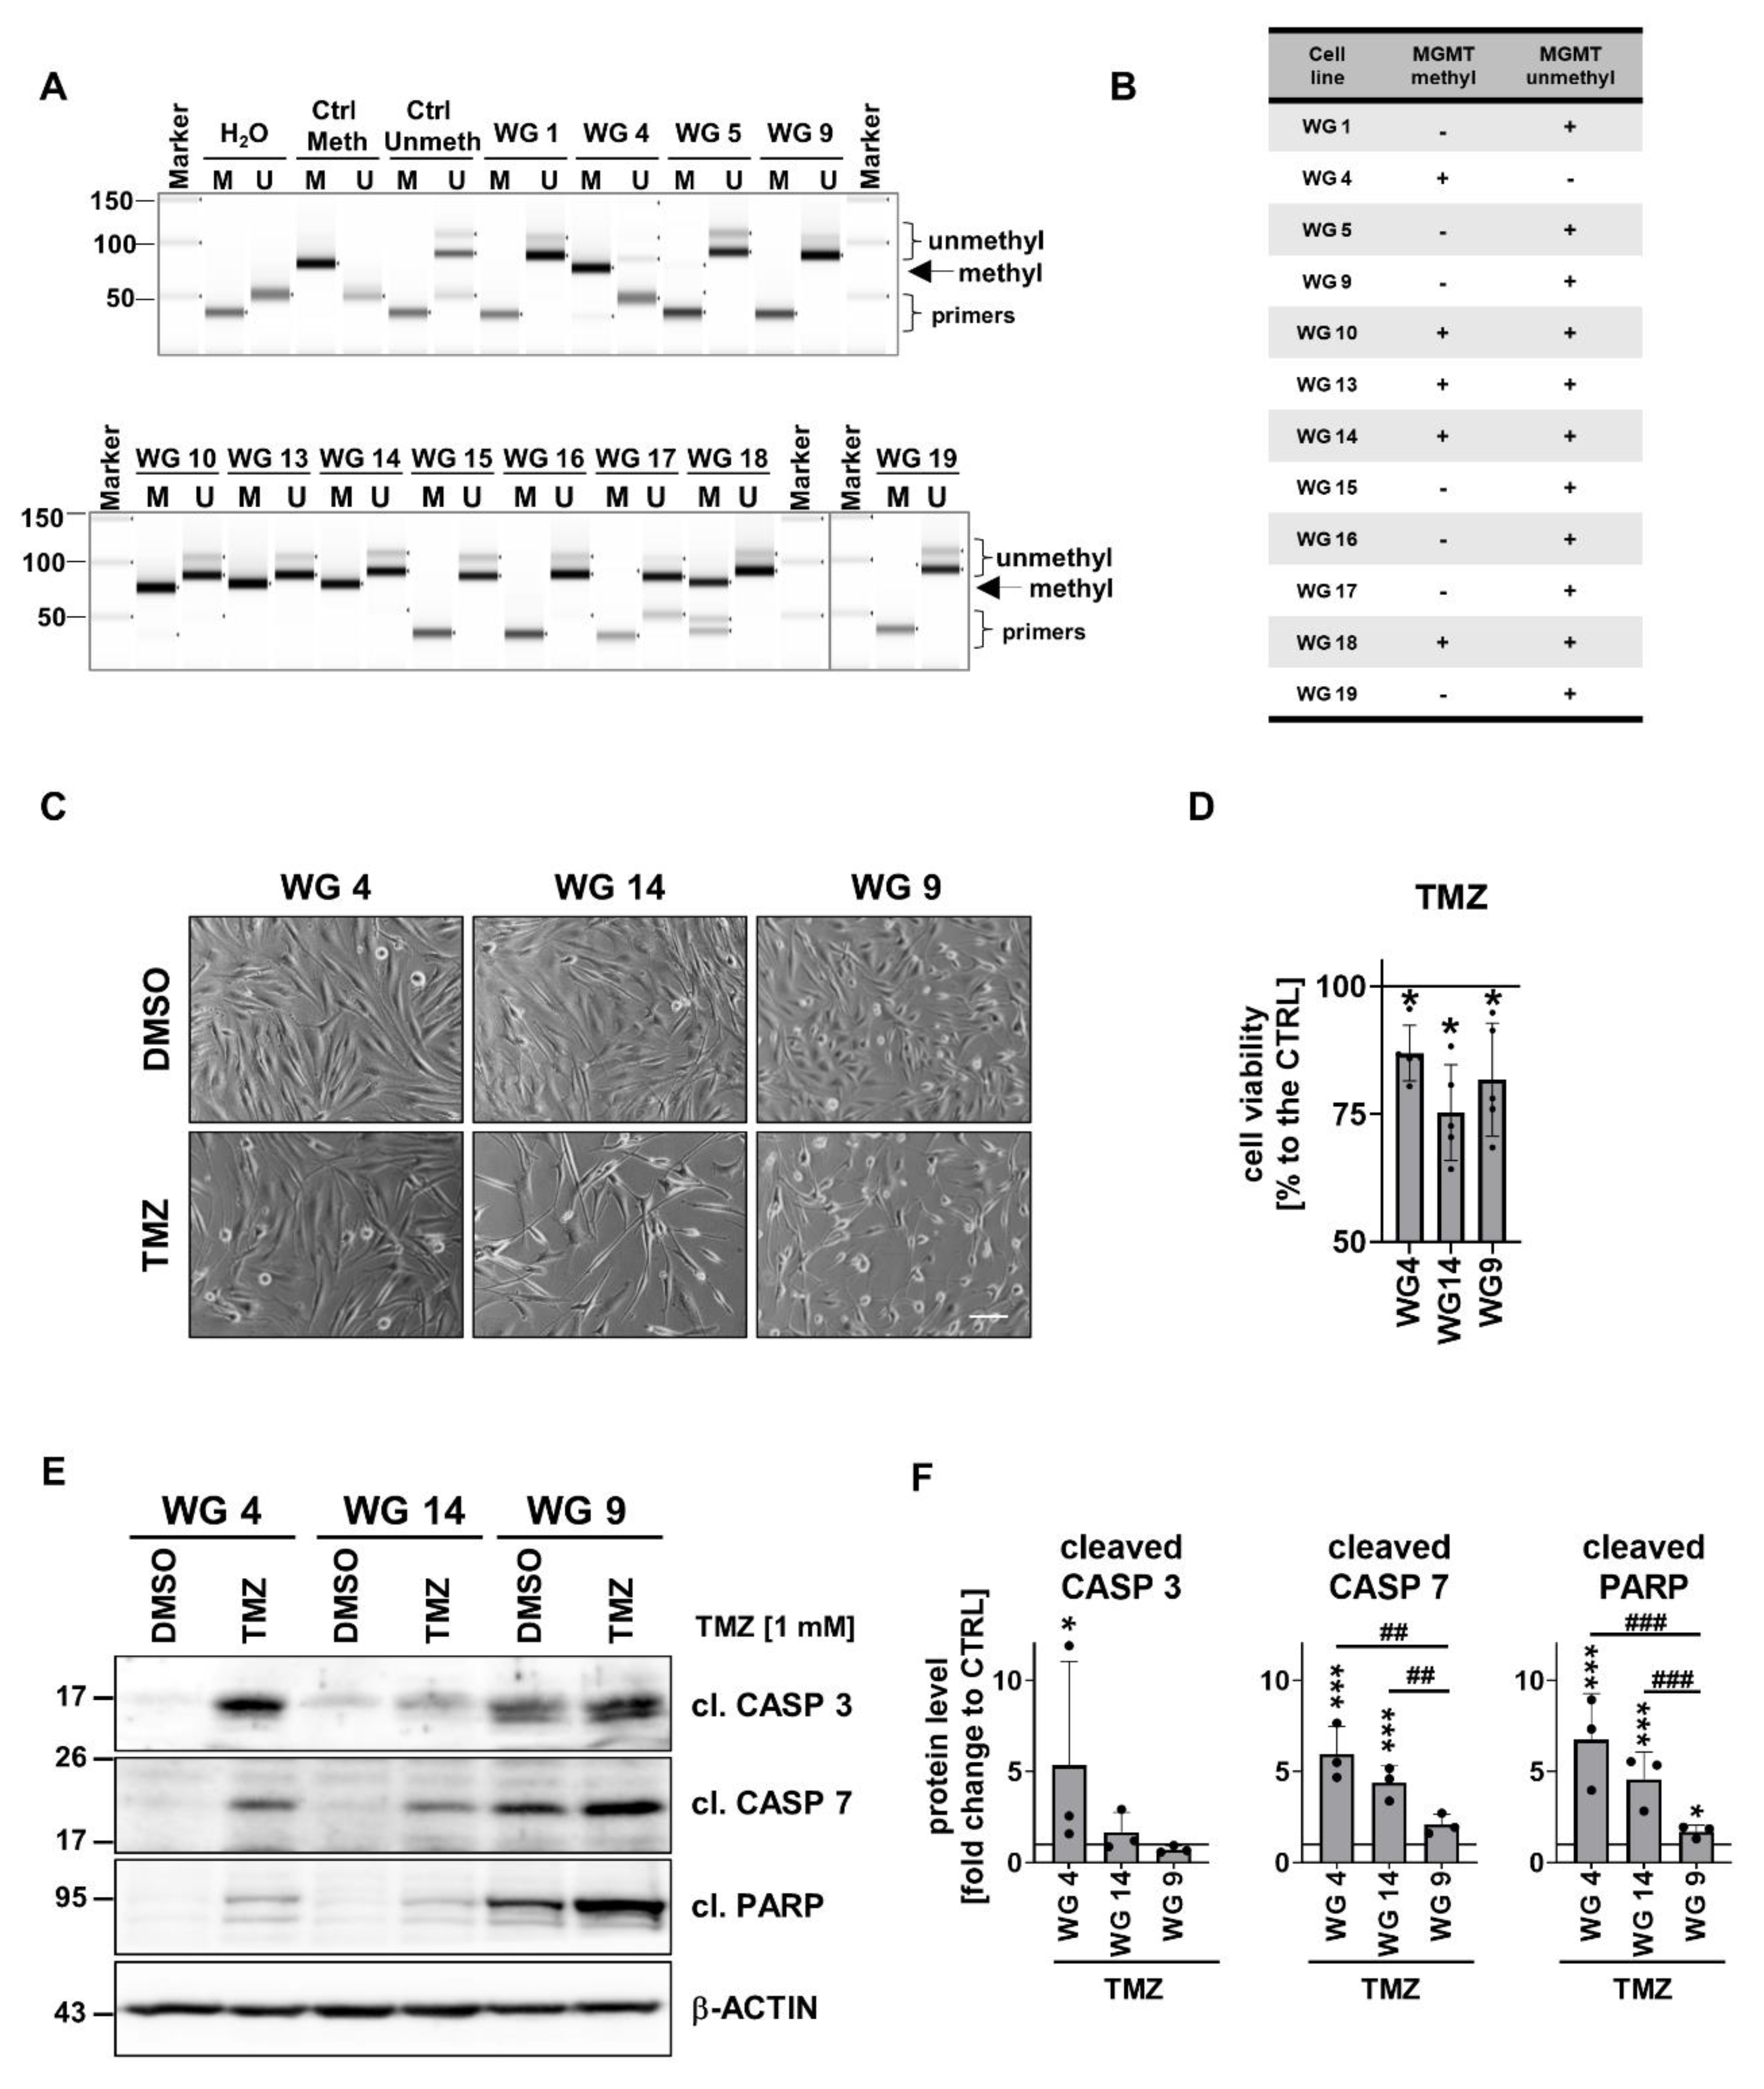
Figure 6.
Treatment with the EGFR inhibitor AG1478 modifies sensitivity of glioma cells to TMZ. (A) Representative immunoblots of phosphorylated proteins involved in EGFR signaling pathways in WG4, WG14 and WG9 cells in the presence (6 h) and absence of 10 µM AG1478 (AG). (B) The densitometric quantification. The level of a protein of interest in control cells equals 1 and is marked by a solid black line. β-ACTIN was used as a loading control. Statistical significance was determined by t-test in comparison of treated to non-treated cells (*p<0.05, **p<0.01, ***p<0.001), n≥3, mean ± SD. (C) Viability of WG4, WG14 and WG9 cells after 10 µM AG alone or combined with 1 mM TMZ (AG+TMZ) for 72 h was determined with a PrestoBlue test. Viability of the control group was set as 100% and marked by a black solid line. Statistical significance was determined on raw data by one-way ANOVA followed by Dunnett’s post hoc test in comparison of treated to untreated cells (*p<0.05, **p<0.01, ***p<0.001) or by one-way ANOVA followed by uncorrected Fisher’s LSD test between the groups: AG or TMZ vs AG+TMZ (#p<0.05, ##p<0.01, ###p<0.001), n=3,mean ± SD. (D) Representative immunoblots detecting the apoptosis markers: cleaved caspase 7 and cleaved PARP (cl. CASP 7, cl. PARP, respectively), and phospho-STAT3 (pSTAT3) and STAT3 of WG4, WG14 and WG9 cells treated with 10 µM AG, 1 mM TMZ or with combination of AG+TMZ for 72 h. (E) Quantification of immunoblots. The level of protein of interest in control cells equals 1 and is marked by a solid black line. β-ACTIN was as a loading control. Statistical significance was determined by one-way ANOVA followed by Dunnett’s post hoc test in comparison of treated to untreated control cells (*p<0.05, **p<0.01, ***p<0.001) or by one-way ANOVA followed by uncorrected Fisher’s LSD test between the groups: AG or TMZ vs AG+TMZ (#p<0.05, ##p<0.01, ###p<0.001), n≥3, mean ± SD.
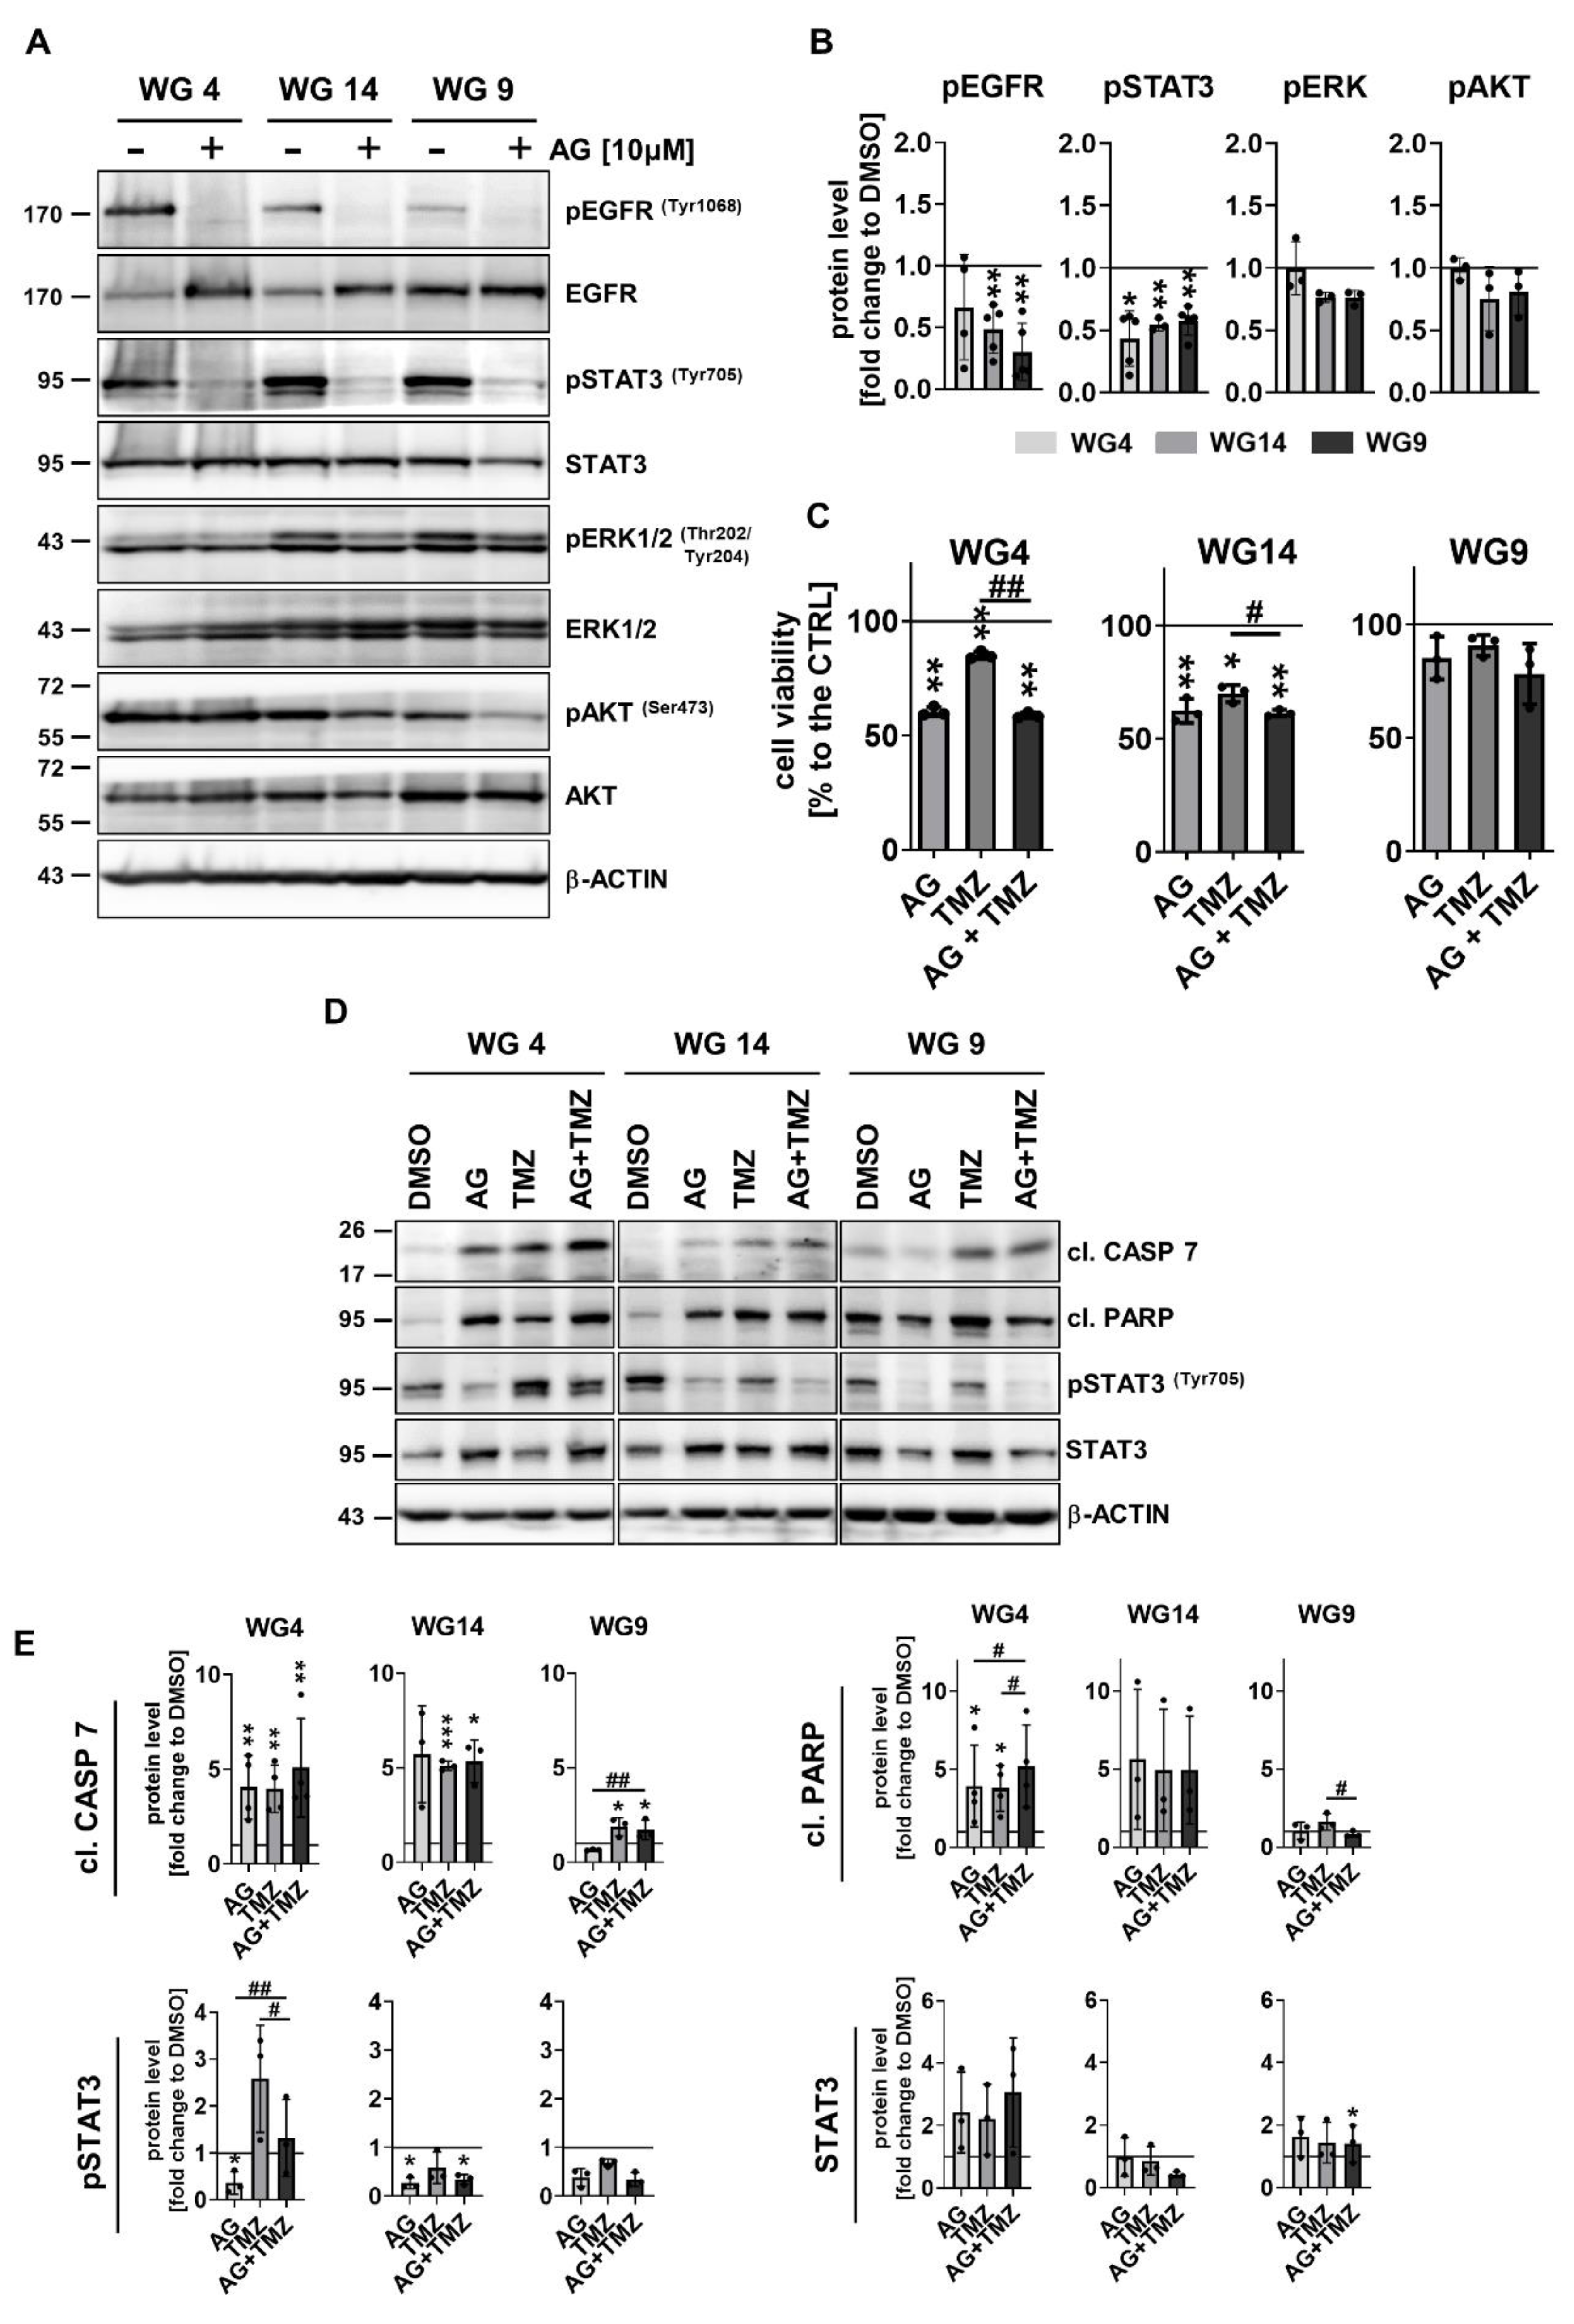
Figure 7.
AG1478 enhanced cytotoxicity exerted by DOX in primary glioma cell cultures. (A) Representative immunoblots showing the apoptosis markers: cleaved caspase 7 and cleaved PARP (cl. CASP 7, cl. PARP, respectively) in WG4, WG14 and WG9 cells treated with DOX for 48 h. (B) Densitometric quantification of effects of DOX at the high doses: 0.5 and 1 mM. The level of a protein of interest in control cells equals 1 and is marked by a solid black line. β-ACTIN was used as a loading control. Statistical significance was determined by one-way ANOVA followed by Dunnett’s post hoc test (*p<0.05, **p<0.01, ***p<0.001), n=3, mean ± SD. (C) Cell viability of WG4, WG14 and WG9 cells after 10 µM AG, 0.5 mM DOX or combined, AG+DOX treatment for 48 h, determined by PrestoBlue test. Viability of the control group was set as 100% and marked by a black solid line. Statistical significance was determined on raw data by one-way ANOVA followed by Dunnett’s post hoc test in comparison to untreated control cells (*p<0.05, **p<0.01, ***p<0.001) or by one-way ANOVA followed by uncorrected Fisher’s LSD test between the groups: AG or DOX vs AG+DOX (#p<0.05, ##p<0.01, ###p<0.001), n≥3, mean ± SD. (D) Representative immunoblots detecting the apoptosis markers: cleaved caspase 7 and cleaved PARP (cl. CASP 7, cl. PARP, respectively) of WG4, WG14 and WG9 cells treated with 10 µM AG, 0.5 mM DOX or with combination of AG+DOX for 48 h with (E) the densitometric quantification. The level of a protein of interest in control cells equals 1 and is marked by a solid black line. Statistical significance was determined by one-way ANOVA followed by Dunnett’s post hoc test in comparison to untreated control cells (*p<0.05, **p<0.01, ***p<0.001) or by one-way ANOVA followed by uncorrected Fisher’s LSD test between the groups: AG or DOX vs AG+DOX (#p<0.05, ##p<0.01, ###p<0.001), n=3, mean ± SD.
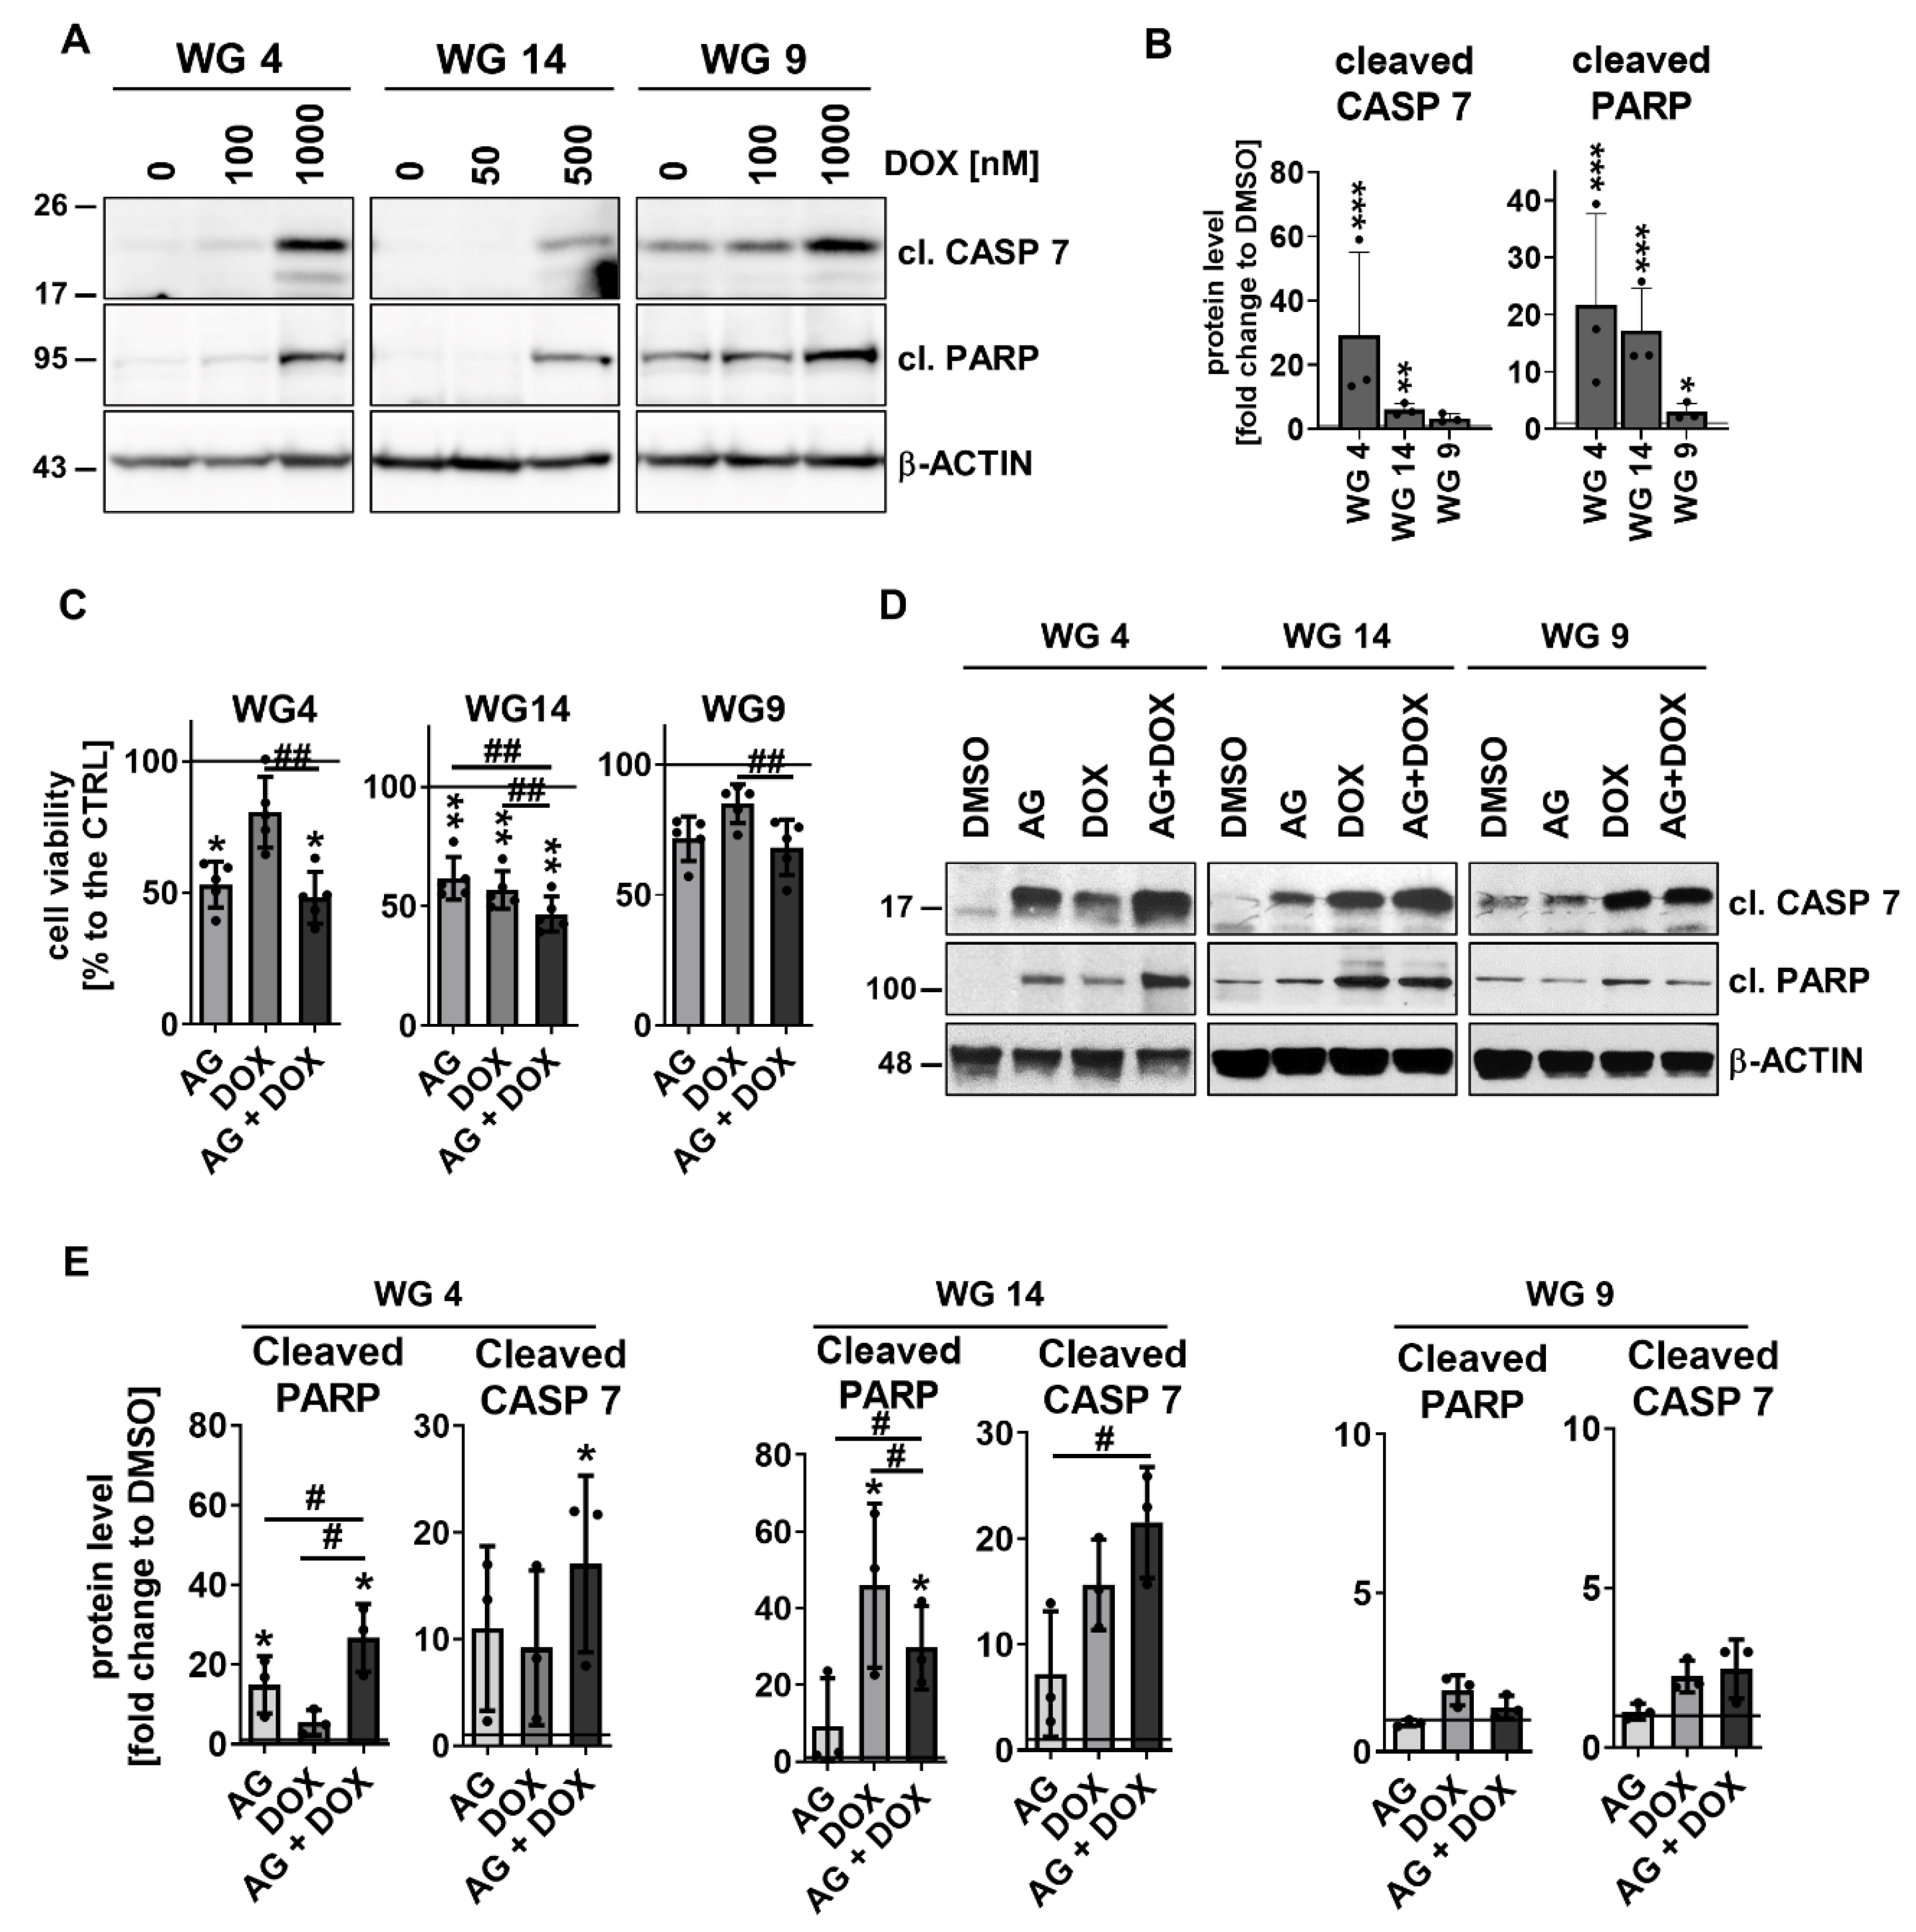
Disclaimer/Publisher’s Note: The statements, opinions and data contained in all publications are solely those of the individual author(s) and contributor(s) and not of MDPI and/or the editor(s). MDPI and/or the editor(s) disclaim responsibility for any injury to people or property resulting from any ideas, methods, instructions or products referred to in the content. |
© 2023 by the authors. Licensee MDPI, Basel, Switzerland. This article is an open access article distributed under the terms and conditions of the Creative Commons Attribution (CC BY) license (http://creativecommons.org/licenses/by/4.0/).
Copyright: This open access article is published under a Creative Commons CC BY 4.0 license, which permit the free download, distribution, and reuse, provided that the author and preprint are cited in any reuse.


