
Submitted:
27 January 2023
Posted:
28 January 2023
You are already at the latest version
Abstract
The development of autonomous vehicles is becoming increasingly popular and gathering real world data is considered a valuable task. Many datasets have been published recently in the autonomous vehicle sector, with synthetic datasets gaining particular interest due to availability and cost. For a real implementation and correct evaluation of vehicles at higher levels of autonomy it is also necessary to consider human interaction, which is precisely something that lacks in existing datasets. In this article the UPCT dataset is presented, a public dataset containing high quality, multimodal data obtained using state of the art sensors and equipment installed onboard the UPCT’s CICar autonomous vehicle. The dataset includes data from a variety of perception sensors including 3D LiDAR, cameras, IMU, GPS, encoders, as well as driver biometric data and driver behaviour questionnaires. In addition to the dataset, the software developed for data synchronisation and processing has been made available. The quality of the dataset was validated using an end-to-end neural network model with multiple inputs to obtain speed and steering wheel angle and obtained very promising results.
Keywords:
autonomous vehicle
; data set
; multidriver
; biometric
1. Introduction
Rapid advances in artificial intelligence, electronics, information and communications technology (leading to miniaturization and improved performance of computers, sensors and networks) have led to the development of several Autonomous Vehicle technologies [1]. This together with new consumption habits and environmental awareness, where technology is part of the basic principal that allows us to be more efficient and sustainable, has led to a considerable increase in the amount of research carried out on autonomous vehicles, making this the latest trend in the automotive industry [2]. Evidently, there is plenty of motivation and willingness to speed up progress, especially with the recent success of Big Data, Machine Learning and Deep Neural Networks.
Given the growing popularity in the development of autonomous vehicles, the collection of real data is considered a valuable task, with it being necessary for this sector to provide high-quality, multimodal and real-world datasets which can be used for benchmarking, simulation development, algorithms testing and diverse computer vision training exercises, among others.
The vehicle used for the data collection is usually equipped with a variety of sensors, such as cameras, Light Detection and Ranging (LiDAR) sensors, RADAR, GPS, and Inertial Measurement Units (IMU). The raw data obtained by these sensors is recorded on a disk while the vehicle is being driven manually. Subsequently, the recorded data be used to train and test different algorithms for autonomous driving, e.g., vehicle/pedestrian detection and tracking, Simultaneous Localization and Mapping (SLAM) and motion estimation [3].
In this context, many datasets have been published, a summary of the most popular datasets and their features is presented in Table 1. These datasets vary greatly in terms of traffic conditions, sensor configuration, application focus, data format, size, tool support, as well as other aspects. The most sought-after datasets dedicated to autonomous vehicle systems (AVS) are the so-called multimodal datasets. These datasets have gained particular attention over o-modal datasets, as an individual sensor is insufficient to provide a complete perception of the environment. Furthermore, the most exploited sensors in this field, such as cameras, LIDARs, radars, etc., offer complementary data and their collaboration can guarantee a better understanding of the surroundings [3].
Table 1 provides a comparison of the main existing datasets, at both an academic and professional level and consists of a brief survey of datasets relevant to the development of autonomous driving systems. We focus on the most comparable and recent datasets, which strongly emphasize multimodal sensor data. We present them in chronological order.
Despite the large number of existing studies, most of these datasets do not provide raw data, but instead offer labelled data to support training and evaluation, in particular semantic segmentation techniques. Obtaining real labelled data in large quantities is far from trivial. To start with, it is arduous and expensive to deploy multiple vehicles to collect images and data in a wide range of environmental, weather and lighting conditions. Secondly, the task of manually classifying each image is extremely time consuming. Lastly, the accuracy of manually produced labels may be inconsistent across the dataset. These reasons, along with the level of fidelity achieved by 3D graphics engines, have encouraged the creation and adoption of synthetic datasets of artificial data based on scenes recreated by simulators [10].
As stated in the work by [17], this method of offering already labelled and even segmented data often presents problems in data quality due to the methods or models used. Another disadvantage of those models trained using only synthetic datasets is that in real world scenarios these tend to perform poorly, suffering from domain shift [18,19].
On the other hand, for a real implementation and correct evolution of autonomous vehicles at levels 4-5, it is also necessary to consider human interaction. Whether to infer a pedestrian’s intent to cross the road, identify a driver’s intent to perform a certain manoeuvre or detect potentially reckless moves, autonomous vehicles must have a high-level understanding of human behaviour. In most existing datasets, it is precisely this human data factor which lacks. As can be seen in Table 1, apart from out proposal (UPCT) dataset, the existing datasets dedicated to autonomous vehicles do not include biometric data or driver behaviour.
In this article we present the UPCT dataset, a public set of high quality, multimodal data, obtained using state of the art sensors equipped by the CICar autonomous vehicle belonging to the UPCT (Cameras, LiDAR, IMU, GPS, Encoders), as well as driver’s biometric data and driver questionnaires. In this way, our dataset offers the data acquired during 20 manual driving tests carried out by different drivers on an urban circuit, which consists of a circular route in the town of Fuente Alamo. To facilitate the use of the dataset, three large subgroups of data have been differentiated: Perception, Positioning and Driver data (biometrics and Driver Behaviour Questionnaire) and both the pre-processed raw data and the code which facilitates its use have been made available.
2. Materials and Methods
2.1. Experimental Design
To obtain the data, we decided to carry out ad-hoc driving tests with a group of 50 healthy subjects of different age and sex from the Region of Murcia (Spain), following the distribution shown in Table 2. The subjects were in possession of a valid type B driving licence (for driving cars, vans, and in general vehicles with a maximum authorised mass of 3500 Kg) at the time of the test. After performing the tests, the results of some subjects were excluded due to technical problems during the performance of the test or during the recording of the results, leaving a total of n=20 subjects (11 male/9 female) with valid raw data to make up the final dataset.
2.1.1. Driver Test Design
Before starting the experiment, in addition to the informed consent, each subject filled in two questionnaire: (1) the Biographic Questionnaire, and (2) the Driver Behaviour Questionnaire.
- The Biographic Questionnaire identifies key facts about the subject, such as gender, age, and driving record.
- The Driver Behaviour Questionnaire (DBQ) collects self-reported data from the drivers, as there are no objective records of driving behaviour and previous traffic violations. The original DBQ consists of 50 items and is used to score the following three underlying factors: errors, violations, and lapses.
For this experiment we have chosen to use the Spanish Driver Behaviour Questionnaire (SDBQ) [20], a shorter version adapted to Spanish drivers consisting of 28 items adapted to the peculiarities of the Spanish population. The version used consists of four factors, composed as follows: 6 traffic law violation items, 6 violation/aggressive manifestation items, 8 error items, and 8 lapse items. Participants were asked to indicate, on a 5-point scale, how often they had been involved in the behaviors or situations mentioned in the questionnaire.
2.1.2. Driving Test Design
The driving test consists of one of the participating drivers, who has been equipped with a non-invasive smartband device, manually driving the UPCT-CICar vehicle (the equipment onboard and its characteristics will be explained in more detail in the following platform setup subsection) and following a previously established and identical route which is the same for all tests.
The selected route is an urban circuit in the town of Fuente Álamo in the Region of Murcia, Spain, with the tests performed by multiple drivers manually driving the UPCT-CICar in real traffic situations (see Figure 1). This route provides a significant Point of Interest (POI) of typical urban driving situations : a) intersections with priority and with “Give way”; b) joining a roundabout, internal circulation and leaving the roundabout; c) circulation in streets with “green wave” traffic lights; d) traffic jams; e) rapid incorporation to a high-density road through a side lane; and f) pedestrian traffic on public roads.
In order to contemplate a variety of environmental and driving conditions, the tests were carried out at different times of the day (morning, afternoon or night). In the following Figure 2 you can see some images of the dataset, where different situations captured during the tests are shown.
After each driving test, the data acquired from the vehicle’s perception systems (LiDARs and cameras), positioning systems (IMU, GPS, rotation angle, acceleration, etc) and biometric data from the driver is transferred to the central server.
2.1.3. Platform Setup
For this work, the UPCT autonomous vehicle (UPCT-CICar [21]), was driven by a human pilot in manual mode. CICar is a real-world prototype, based on an electric commercial vehicle, the Renualt Twizy, which has undergone a series of modifications to provide it with the required functionality and has been equipped with multiple sensors (LiDAR, cameras, IMU, GPS, encoders, etc) necessary for an autonomous vehicle. This platform setup integrates a perception system, a control system, and a processing system.
Perception System: The purpose of a sensor system is to collect data from the surrounding environment of the AV and send that data to the control system. These sensors measure different physical quantities, which are typically selected to overlap each other, providing the redundant information needed to correctly merge and correlate the information. In our autonomous vehicle two types of sensors are used to measure the environment: short-range sensors (up to 10 m) and long-range sensors. Installed short-range sensors include a Sick 2D laser ranging scanner and time-of-flight camera. The long-range sensors are a 3D LIDAR scanner and a camera in the visible spectrum. Table 3 and Figure 3 show the different devices involved in data acquisition during the tests, as well as the details of the variables involved in obtaining them.
Driver Biometric System: The drivers’ biometric signal collection system has been carried out using a non-invasive wearable device, bracelet type, called Empatica E4. The Empatica E4 is a wrist-worn top-quality sensor device considered as a Class IIa Medical Device according to 93/42/EEC Directive. Empatica E4 device measures the acceleration data (ACC), as well as other physiological parameters, namely the Blood Volume Pulse (BVP), from which the Heart Rate Variability (HRV) and the Inter Beat Interval (IBI) are derived as well, skin temperature (TEMP) and also changes in certain electrical properties of the skin such as the Electrodermal Activity (EDA). For the creation of our dataset, among the several measurements recorded by the Empatica E4, this signal was considered, since it provides information better suited for activity recognition. A summary of the technical specifications of the accelerometer sensor is detailed in Table 4.
Control System: the main control systems of the Renault Twizy have been automated in order to allow the vehicle to be autonomously controlled. The modified systems are the steering wheel, the brake pedal, and the accelerator pedal (see mechanical modification in Figure 3). Despite the fact that all driving will be manual and not autonomous, the system will record the data with two controller drives through a CAN bus. The Compact Rio cRIO 9082 controls the accelerator, brake and steering wheel movements with the CAN-Open communication protocol, as well as I/O signals.
Processing System: Each sensor works with its own sample rate, and in most cases, this is different between devices. The achieve the synchronisation of the data and accurately reconstruct the temporal sequence, time stamps haven been generated to synchronise the operating start and finish times. All of this is controlled and synchronised by the on-board processing system.
3. Results
As a result of the different executions of the experiment with the participating subjects, a raw data set has been obtained that has been curated and published in a repository. The data in the repository is organized under three major directories: (1) Driver, (2) Perception and (3) Position. The distribution of the data in the different directories is detailed below.
3.1. Driver Directory
This directory contains the information regarding the drivers, from the questionnaires completed before the test, and the biometric data obtained during the test. The directory contains 20 Biometric_XX.csv files (one per driver, where XX is the driver identifier number), and a DBQ.csv file with the data collected from the Biographic Questionnaire and the Driver Behaviour Questionnaire forms.
For the composition of the Biometric_XX.csv files, a normalised sampling frequency of 4 Hz has been used and in the case of sensors with lower frequencies, the table has been completed with NaN fields, with the HR column being the only one affected as the sample rate of this field is 1 Hz. The Biometric_XX.csv files have the following table format, where each column contains the following information:
- (TIME): The first column corresponds to the time stamp expressed as a unix timestamp in UTC.
- (TEMP): Data from the temperature sensor expressed as degrees in Celsius (°C).
- (EDA) Measurement of electrodermal activity by capturing electrical conductance (inverse of resistance) across the skin. The data provided is raw data obtained directly from the sensor expressed in microsiemens (μS).
- (BVP) The BVP is the blood volume pulse and is the raw output of the PPG sensor. The PPG/BVP is the input signal to algorithms that calculate Inter beat Interval Times (IBI) and Heart Rate (HR) as outputs.
- (HR): This file contains the average heart rate values calculated at 10 second intervals. They are not derived from a real-time read, but are processed after the data is loaded into a session.
- (ACC_X, ACC_Y, ACC_Z) Data from the 3-axis accelerometer sensor. The accelerometer is configured to measure acceleration in the range [-2g, 2g]. Therefore, the unit in this file is 1/64g. Data from x, y, and z axis are displayed in the sixth, seventh and eighth columns, respectively.
The DBQ.csv file is made up of a total of 45 columns, where the first column contains the subject identifier. The rest of the columns correspond to each of the items from the Biographic Questionnaire and the Driver Behaviour Questionnaire forms, where the last 25 columns are the questions from the DBQ form.
3.2. Perception Directory
This directory contains:
- 20 .bin type files, called perceptionXX.bin, where XX corresponds to the identifier number assigned to each driver at the time of the test.
- 20 images from the RGB-D camera (front view).
In the .bin file, the data from the 3D LiDAR sensor, 2D LiDAR sensors, TOF cameras, obtained by the CICar perception system is saved. The data from these sensors was recorded continuously during the driving test, with data packets being written by the different sensors one after the other and at the exact moment in which they arrived at the system, without contemplating an established order of sensor reading and recording.
Each data packet consists of a header made up of two 32-bit integers, which identifies the source of the data followed by the data as it was received from the sensors. The header format is as follows:
uint32_t head [2];
- head[0]: indicates the size in bytes of the packet received by the sensor.
- head[1]: contains a sensor identifier which shows the source of the data packet received.
The sensor identifiers are the following:
// Packet identifiers in the data file
static const uint32_t LIDAR_PACKET_ID = 0x4C494452; // 3D LiDAR
static const uint32_t GPS_PACKET_ID = 0x475053; // GPS
static const uint32_t NMEA_STRING_ID = 0x4E4D4541; //
static const uint32_t M420_FRAME_ID = 0x4D343230; // Camera ToF
static const uint32_t T551_FRONT_ID = 0x54354652; // Front 2D LiDAR
static const uint32_t T551_BACK_ID = 0x5435424B; // Rear 2D LiDAR
The following is a .bin file example:
(uint32_t) 1206 // Data packet size 1206 bytes
(uint32_t) 0x4C494452 // Data source: 3D LiDAR
(char [1206]) { ... } // 1206-byte vector with 3D LiDAR data
(uint32_t) 230524 // Size of data packet 230524 bytes
(uint32_t) 0x4D343230 // Data source: ToF camera
(char [230524]) { .. } // 230524-byte vector with ToF data.
(uint32_t) 1206 // Size of data packet 1206 bytes
(uint32_t) 0x4C494452 // Data source: 3D LiDAR
(char [1206]) { .... } // 1206-byte vector with 3D LiDAR data.
(uint32_t) 1206 // Size of data packet 1206 bytes
(uint32_t) 0x4C494452 // Data source: 3D LiDAR
(char [1206]) { .... } // 1206-byte vector with 3D LiDAR data.
(uint32_t) 921 // Size of data packet 921 bytes
(uint32_t) 0x54354652 // Data source: Front 2D LiDAR
(char [921]) { ..... } // 921-byte vector with Front 2D LiDAR data.
To facilitate the use and processing of the data, a program has been developed that allows the data from each sensor to be extracted separately and independently into an additional .bin file. In this case, by separating the data into different files, the data packet identifier is not necessary, but synchronisation with the system is lost. Therefore, to avoid loss of synchronisation between the data packet of each sensor, the time stamp of the exact moment of capture must be included. The .bin file format for each independent sensor is as follows:
uint32_t segundos // Capture timestamp seconds
uint32_t microseg // Capture timestamp microseconds
uint32_t numbytes // Number of bytes in the data packet
char datos[numbytes] // ’raw’ data packet from the sensor
This structure is repeated continuously for each data packet until the end of the file.
Furthermore, the data has been pre-processed and the LiDAR 3D, LIDAR 2D and ToF camera data from each test carried out They have been merged into a single point cloud and extracted to a .csv file called POINTCLOUD_XX.csv, where XX is the identifier assigned to each driver at the start of the test.
3.3. Position Directory
This directory contains the information regarding the position system, obtained during the driving tests. The directory contains 20 Position_XX.csv files, one for each driver where XX is the driver identifier number. Each of these systems collect information from the GPS, IMU and Encoder sensors.
The Position_XX.csv files are saved in the following table format, where each column contains the following information:
- (TIME) This first column contains the timestamp of the session expressed as a unix UTC timestamp
- (LATITUDE) latitude values obtained by the GPS
- (LONGITUD) longitude values obtained by the GPS
- (ALTITUDE) altitude values obtained by the GPS
- (STERING_ANGLE): Steering wheel angle
- (SPEED): Speed/(m/s)
- (DISTANCE_TRAVELLED)
- (LIN_ACEL_X): acceleration obtained around the x-axis, obtained in g
- (LIN_ACEL_Y): acceleration obtained around the y-axis, obtained in g
- (LIN_ACEL_Z): acceleration obtained around the z-axis, obtained in g
- (ANG_VEL_X): angular velocity obtained around the x-axis, in degrees/second.
- (ANG_VEL_Y): angular velocity obtained around the y-axis, in degrees/second
- (ANG_VEL_Z): angular velocity obtained around the x-axis, in degrees/second.
The acceleration or angular velocity values are given by four bytes. These bytes correspond to a real number according to the IEEE-754 standard. The IEEE-754 standard is the most widely used for the representation of floating point numbers.
4. Technical Validation
4.1. Driver Test Validation
To validate the data regarding the drivers, the following actions were carried out:
- A first validation is carried out by measuring the reliability of the data obtained from the DBQS tests carried out on the drivers. The reliability of the questionnaires was obtained with the entire sample, finding the Cronbach’s alpha indices and the two Guttman halves. The values to interpret the reliability were: <.50 unacceptable; 0.50≥poor<0.60; 0.60≥questionable/doubtful<0.70; 0.70≥acceptable<0.80; 0.90 ≥good<0.90; and ≥0.90 excellent. The Cronbach Alapha coefficient is 0.796, which shows that the DBQ data set in this experiment has credibility [22].
- Missing data E4 data of 7 participants (driver 1, driver 5, driver 17, driver 21, driver 30, driver 42, driver 45) were excluded due to a device malfunction during data collection. While physiological signals in the dataset are mostly error-free with most of the files complete above 95%, a portion of data is missing due to issues inherent to devices or a human error.
Raw data from the Empatica device was downloaded in csv format and analyzed with the Kubios tool [23]. Kubios offers five artefact correction options based on very low to very high thresholds. No correction of the artifacts analyzed by Kubios was necessary This is not sur-prising, since the Empatica E4 already uses an algorithm that removes wrong IBIs or other wrong signals [24].
4.2. Driving Test Validation
Once the driving tests have been completed, a manual verification phase has been carried out on the data obtained (see Figure 4), where the data from those tests where reading or writing failures occurred, or failures in the test itself (routes, drivers, etc) has been discarded.
- Checking for abnormalities during the test. The time elapsed for the completion of each test has been checked, passing a filter, and discarding those tests in which the time has been either very short or too long. Data of 5 participants (driver 4, driver 17, driver 23, driver 29, driver 40) were excluded.
-
Checking for errors in reading the sensors or writing to the disk. For each of the tests, the correct sending of information by the sensors during the test is verified. Those tests where a total or partial failure has been detected have been discarded. To detect these failures, the following aspects were checked:
- All files exist on the disk. At the end of each test, the number of files generated has been checked. The absence of any of the files implies a failure to read or write the data occurred, therefore this test was discarded completely. Data of 4 participants (driver 1, driver 10, driver 31, driver 34) were excluded.
- Empty files. It has been verified that the files generated all contain data, discarding those tests where empty files have been detected. Data of 2 participants (driver 35, driver 36) were excluded.
- Exploratory data analysis. Taking into account the different types of data processed, the different types of descriptive analytics have been chosen: (1) Analysis of data deviation. A standard deviation analysis has been applied to those data with discrete values (average speed, time traveled, etc.), discarding those data with a sharp deviation. Data of 2 participants (driver 11, driver 38) were excluded (2) Time series analysis: most of the data correspond to time series of data, with a certain variation of speed, for this reason it has been decided to use the Dynamic Time Warping (DTW) technique.
- Checking for driving route failures. For each of the tests carried out, the route taken by the driver during the test has been verified, to make sure the driver stuck to the route initially stipulated. The test where a small deviation from the track occurred has been discarded. To verify this, the following checks were made: (1) steering wheel rotation pattern during the test, given that for the same trajectory the steering wheel rotation pattern must be similar for all the tests. (2) GPS trajectory, the trajectory has been painted and the tests that do not comply with the marked route have been eliminated.
After this first screening process, a quality validation of the resulting data is performed, as to guarantee the quality of the data (see Figure 4). Our validation method comprised three steps: (1) Quality control of variables. (2) Quality control of support media. (3) Experimental validation.
4.2.1. Quality Control of Variables
An analysis of the internal structure of the set of circumstances of the DBQ form (content validity) has been performed. To be able to apply a factorial analysis correctly, those items with a declaration frequency of less than 5% were eliminated. Subsequently, and since the items on the form are dichotomous variables, the tetrachoric correlation coefficient was applied to obtain the correlation matrix between the 28 items.
The reliability of the questionnaires was obtained with the entire sample, finding the Cronbach’s alpha indices and the two Guttman halves. The values to interpret the reliability were: <.50 unacceptable; 0.50≥poor<0.60; 0.60≥questionable/doubtful<0.70; 0.70≥acceptable<0.80; 0.90 ≥good<0.90; and ≥0.90 excellent. The Cronbach Alapha coefficient is 0.796.
Secondly, outliers in the acquired data, those values notably different compared to the patterns present in the rest of the data, may be due to errors in reading and writing the data from the sensors. Certain deviations were detected in the data from the GPS, due to momentary loss of signal or where the position has been calculated with a fewer number of satellites. In those cases in which the losses are less than two consecutive time intervals, a prediction of the vehicle’s position is made. For cases where the loss is greater, the tests have been discarded. To apply this prediction a constant acceleration Kalman filter has been used.
4.2.2. Quality Control of Support Media
The clocks of all the sensors and devices were synchronised at the start of each experimental test session. All devices are controlled by the control unit on board the vehicle, which provides a perfect temporal and spatial synchronisation of the data obtained by the sensors (see Figure 5).
It has been verified that the data obtained by the encoder is synchronised with that from the rest of the sensors. This was achieved by checking the distance indicated by the encoder coincides with the distance calculated between two consecutive GPS timestamps (GNSS). This was done using the Havershine expression shown in Equation (1), where d is the distance in metres between two points on the Earth’s surface; r is the Earth’s radius (6378 km); φ1 and φ2 are the latitudes in radians; ψ1 and ψ2 are the longitudes in radians of two consecutive timestamps.
The indirect data provided by the encoder has also been verified, for example that the speed matches the direct data measurements provided by the GPS.
4.2.3. Experimental Validation
Finally, the most conclusive validation presented in this document was performed, the usability analysis of the data contained in the final dataset. The work by Navarro et al [18] presents a mixed data input end-to-end model which used the front images obtained by the vehicle and angular speeds to predict the speed and steering wheel angle with a mean error of 1.06%. An exhaustive optimization process of the convolutional blocks has demonstrated that it is possible to design lightweight end-to-end architectures with a high performance more suitable for the final implementation in autonomous driving.
Author Contributions
Conceptualization, F.R., P.J.N., L.M., and E.S.; methodology, F.R., P.J.N., L.M., and E.S.; software, P.J.N. and F.R.; validation, F.R. and L.M.; formal analysis, F.R., P.J.N., L.M., and E.S.; investigation, F.R., P.J.N., L.M., and E.S.; resources, F.R. and P.J.N.; data curation, P.J.N., L.M., F.R. and C.F.-I.; writing—original draft preparation, F.R., P.J.N., L.M.; writing—review and editing, F.R., P.J.N., L.M., and E.S.; All authors have read and agreed to the published version of the manuscript.
Funding
This work was partially supported by AEI METROPOLIS (ref. PLEC2021-007609) Spanish Government projects.
Informed Consent Statement
Informed consent was obtained from all subjects involved in the study.
Data Availability Statement
The data set presented here, which is available within Figshare and released under a CC-BY 4.0 license. https://figshare.com/s/4b9a25a958c3ec578362.
Acknowledgments
In this section, you can acknowledge any support given which is not covered by the author contribution or funding sections. This may include administrative and technical support, or donations in kind (e.g., materials used for experiments).
Conflicts of Interest
The authors declare no conflict of interest.
References
- C. Olaverri-Monreal, «Autonomous vehicles and smart mobility related technologies», Infocommunications Journal, vol. 8, n.o 2, pp. 17-24, 2016.
- M. Alawadhi, J. Almazrouie, M. Kamil, y K. A. Khalil, «A systematic literature review of the factors influencing the adoption of autonomous driving», International Journal of Systems Assurance Engineering and Management, vol. 11, n.o 6, pp. 1065-1082, dic. 2020. [CrossRef]
- F. Rosique, P. J. Navarro, C. Fernández, y A. Padilla, «A Systematic Review of Perception System and Simulators for Autonomous Vehicles Research», Sensors, vol. 19, n.o 3, p. 648, ene. 2019. [CrossRef]
- R. Kesten et al., «Lyft Level 5 AV Dataset 2019», 2019.
- H. Caesar et al., «Nuscenes: A multimodal dataset for autonomous driving», en Proceedings of the IEEE Computer Society Conference on Computer Vision and Pattern Recognition, 2020, pp. 11618-11628. [CrossRef]
- Scale AI y Hesai, «Pandaset Open Dataset», 2019.
- P. Sun et al., «Scalability in Perception for Autonomous Driving: Waymo Open Dataset», 2019.
- J. Geyer et al., «A2D2: Audi Autonomous Driving Dataset», arXiv:2004.06320 [cs, eess], abr. 2020, Accedido: 11 de mayo de 2021. [En línea]. Disponible en: http://arxiv.org/abs/2004.06320.
- E. Alberti, A. Tavera, C. Masone, y B. Caputo, «IDDA: A Large-Scale Multi-Domain Dataset for Autonomous Driving», IEEE Robotics and Automation Letters, vol. 5, n.o 4, pp. 5526-5533, oct. 2020. [CrossRef]
- Z. Yang, Y. Zhang, J. Yu, J. Cai, y J. Luo, «End-to-end Multi-Modal Multi-Task Vehicle Control for Self-Driving Cars with Visual Perceptions», en Proceedings - International Conference on Pattern Recognition, nov. 2018, vol. 2018-Augus, pp. 2289-2294. [CrossRef]
- B. Hurl, K. Czarnecki, y S. Waslander, «Precise Synthetic Image and LiDAR (PreSIL) Dataset for Autonomous Vehicle Perception», en 2019 IEEE Intelligent Vehicles Symposium (IV), jun. 2019, pp. 2522-2529. [CrossRef]
- D. Wang, J. Wen, Y. Wang, X. Huang, y F. Pei, «End-to-End Self-Driving Using Deep Neural Networks with Multi-auxiliary Tasks», Automotive Innovation, vol. 2, n.o 2, pp. 127-136, jun. 2019. [CrossRef]
- A. Geiger, P. Lenz, C. Stiller, y R. Urtasun, «Vision meets robotics: The KITTI dataset», The International Journal of Robotics Research, vol. 32, n.o 11, pp. 1231-1237, sep. 2013. [CrossRef]
- X. Huang, P. Wang, X. Cheng, D. Zhou, Q. Geng, y R. Yang, «The ApolloScape Open Dataset for Autonomous Driving and Its Application», IEEE Transactions on Pattern Analysis and Machine Intelligence, vol. 42, n.o 10, pp. 2702-2719, oct. 2020. [CrossRef]
- «Dataset Overview – Cityscapes Dataset». https://www.cityscapes-dataset.com/dataset-overview/ (accedido 30 de noviembre de 2022).
- A. Mimouna et al., «OLIMP: A Heterogeneous Multimodal Dataset for Advanced Environment Perception», Electronics, vol. 9, n.o 4, Art. n.o 4, abr. 2020. [CrossRef]
- P. Koopman y M. Wagner, «Challenges in Autonomous Vehicle Testing and Validation», SAE Int. J. Trans. Safety, vol. 4, n.o 1, pp. 15-24, abr. 2016. [CrossRef]
- P. J. Navarro, L. Miller, F. Rosique, C. Fernández-Isla, y A. Gila-Navarro, «End-to-End Deep Neural Network Architectures for Speed and Steering Wheel Angle Prediction in Autonomous Driving», Electronics, vol. 10, n.o 11, Art. n.o 11, ene. 2021. [CrossRef]
- J. Cai, W. Deng, H. Guang, Y. Wang, J. Li, y J. Ding, «A Survey on Data-Driven Scenario Generation for Automated Vehicle Testing», Machines, vol. 10, n.o 11, Art. n.o 11, nov. 2022. [CrossRef]
- E. L. de Cózar, J. Sanmartín, J. G. Molina, J. M. Aragay, y A. Perona, «Behaviour Questionnaire (SDBQ).», p. 15.
- R. Borraz, P. J. Navarro, C. Fernández, y P. M. Alcover, «Cloud Incubator Car: A Reliable Platform for Autonomous Driving», Applied Sciences, vol. 8, n.o 2, Art. n.o 2, feb. 2018. [CrossRef]
- Z. Deng, D. Chu, C. Wu, Y. He, y J. Cui, «Curve safe speed model considering driving style based on driver behaviour questionnaire», Transportation Research Part F: Traffic Psychology and Behaviour, vol. 65, pp. 536-547, ago. 2019. [CrossRef]
- «Kubios HRV - Heart rate variability», Kubios. https://www.kubios.com/ (accedido 7 de diciembre de 2022).
- «How is IBI.csv obtained?», Empatica Support. https://support.empatica.com/hc/en-us/articles/201912319-How-is-IBI-csv-obtained- (accedido 7 de diciembre de 2022).
Figure 1.
Circuito seleccionado para las pruebas de conducción.
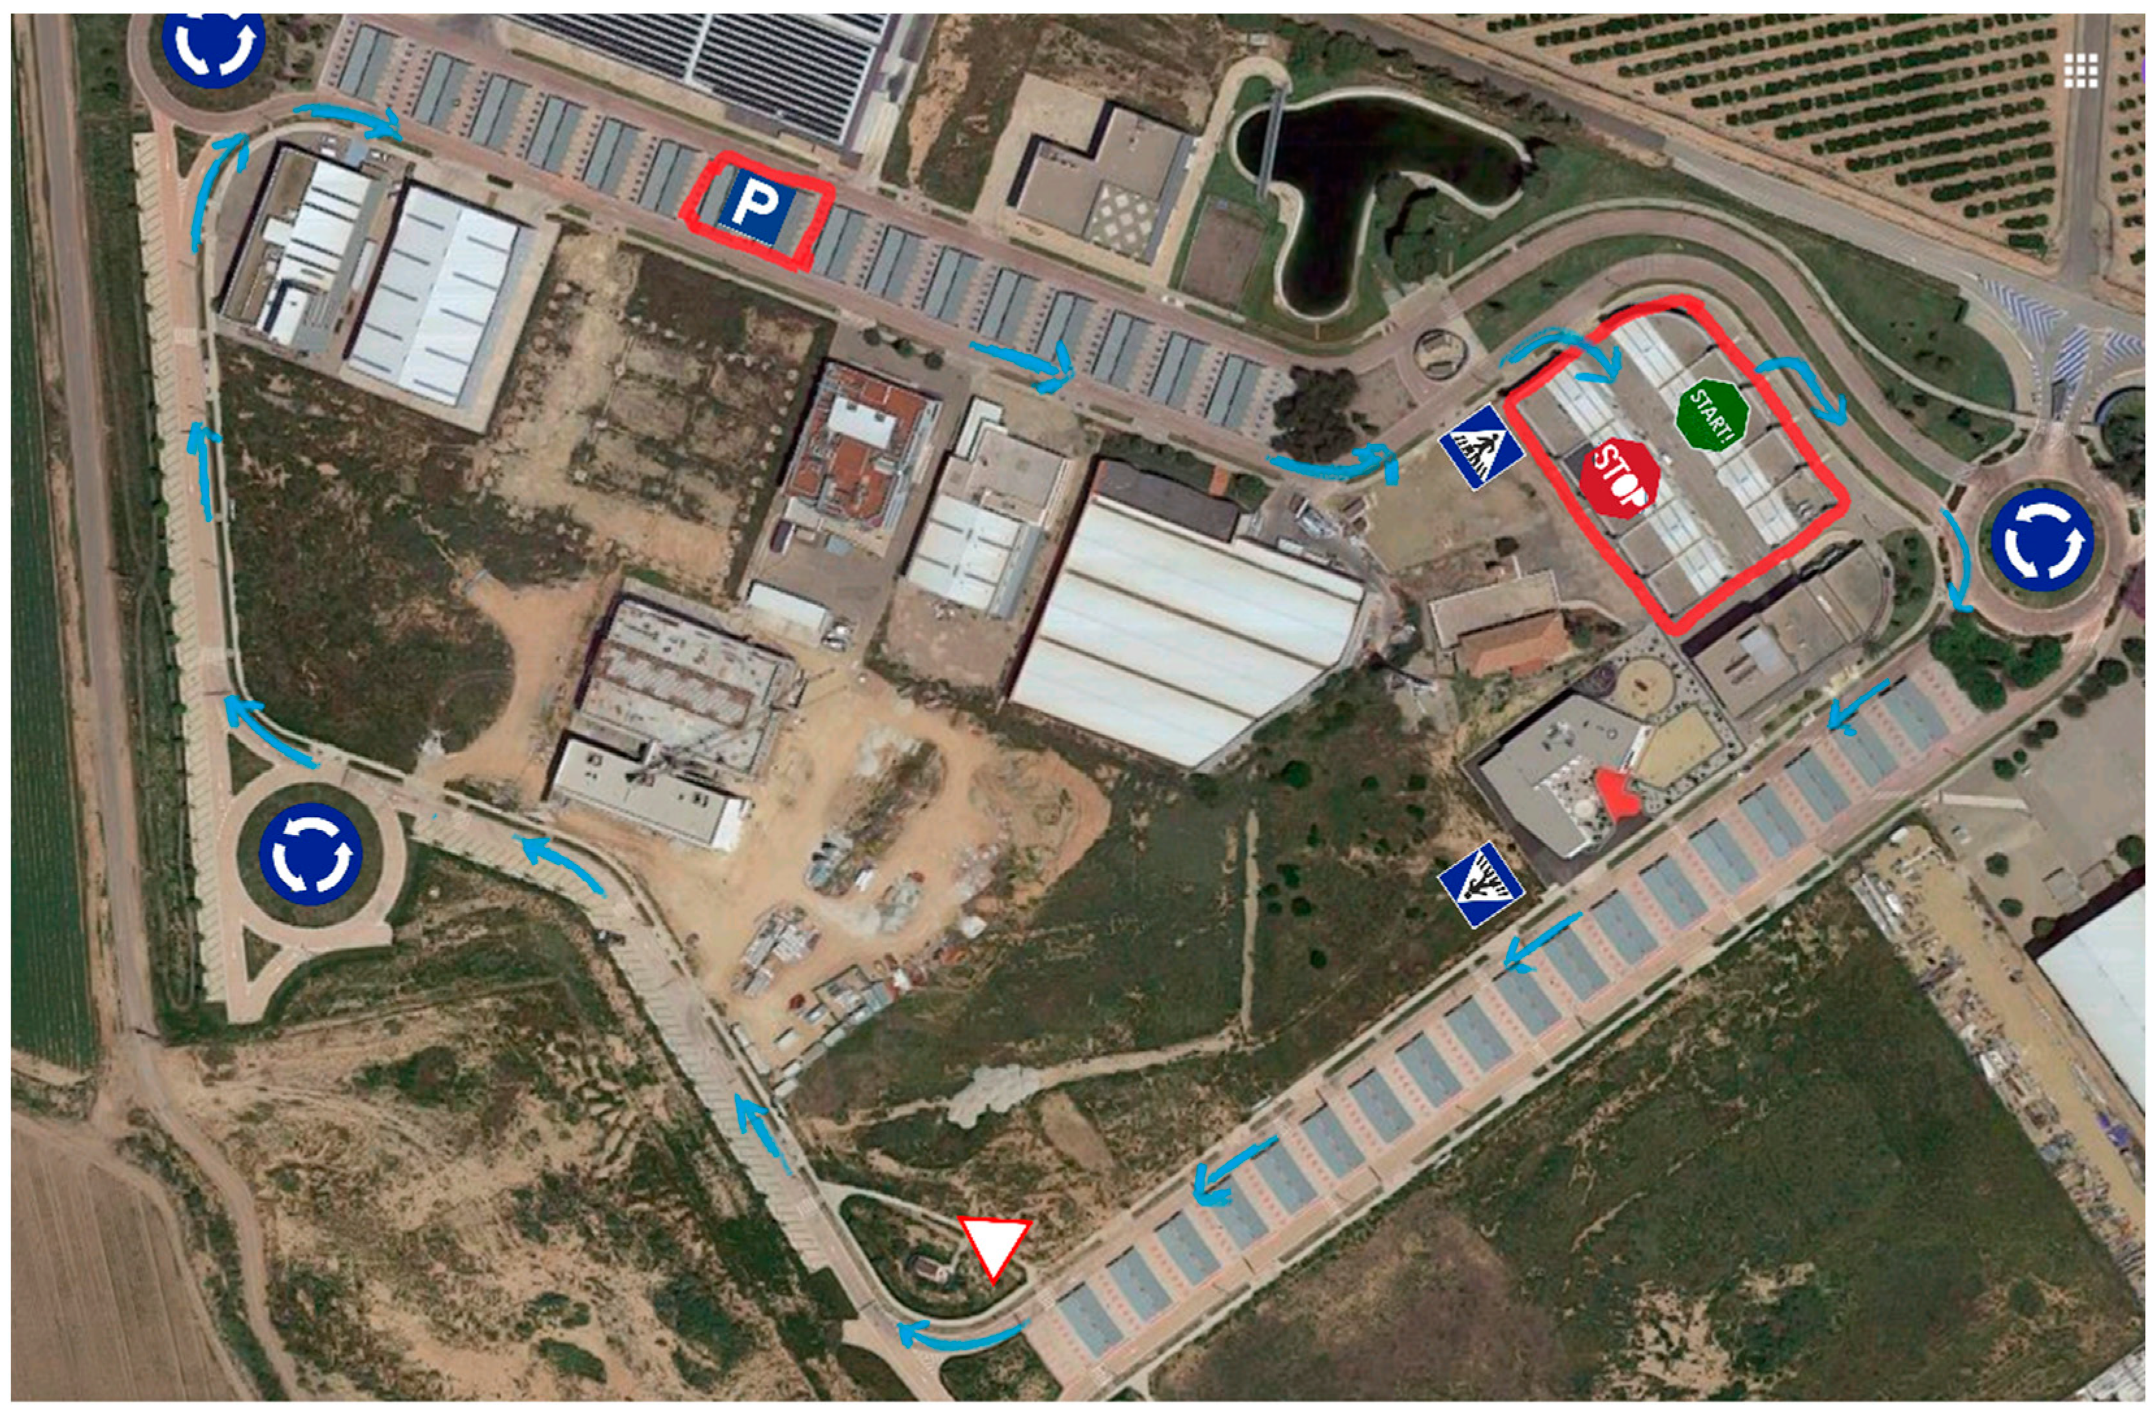
Figure 2.
Images from dataset. a) pedestrian crossing; b) saturation of the illumination on the road; (c) car braking; (d) complex shadows on the road.
Figure 2.
Images from dataset. a) pedestrian crossing; b) saturation of the illumination on the road; (c) car braking; (d) complex shadows on the road.
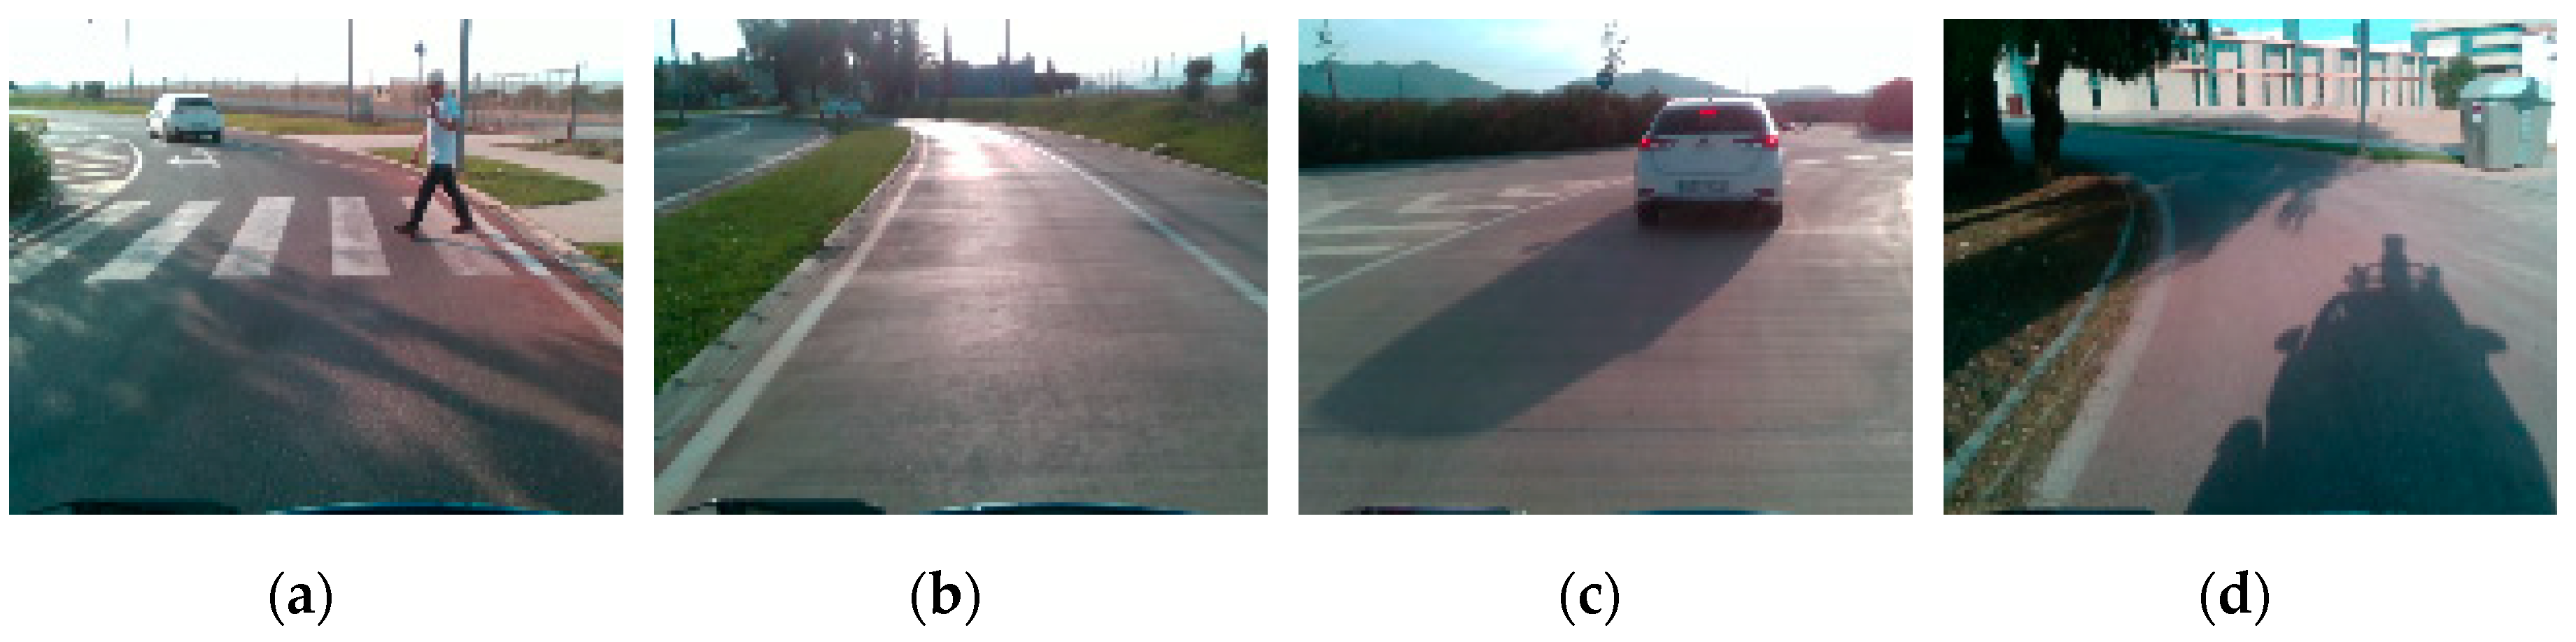
Figure 3.
Autonomous vehicle UPCT-CICar and its different sensors and devices.
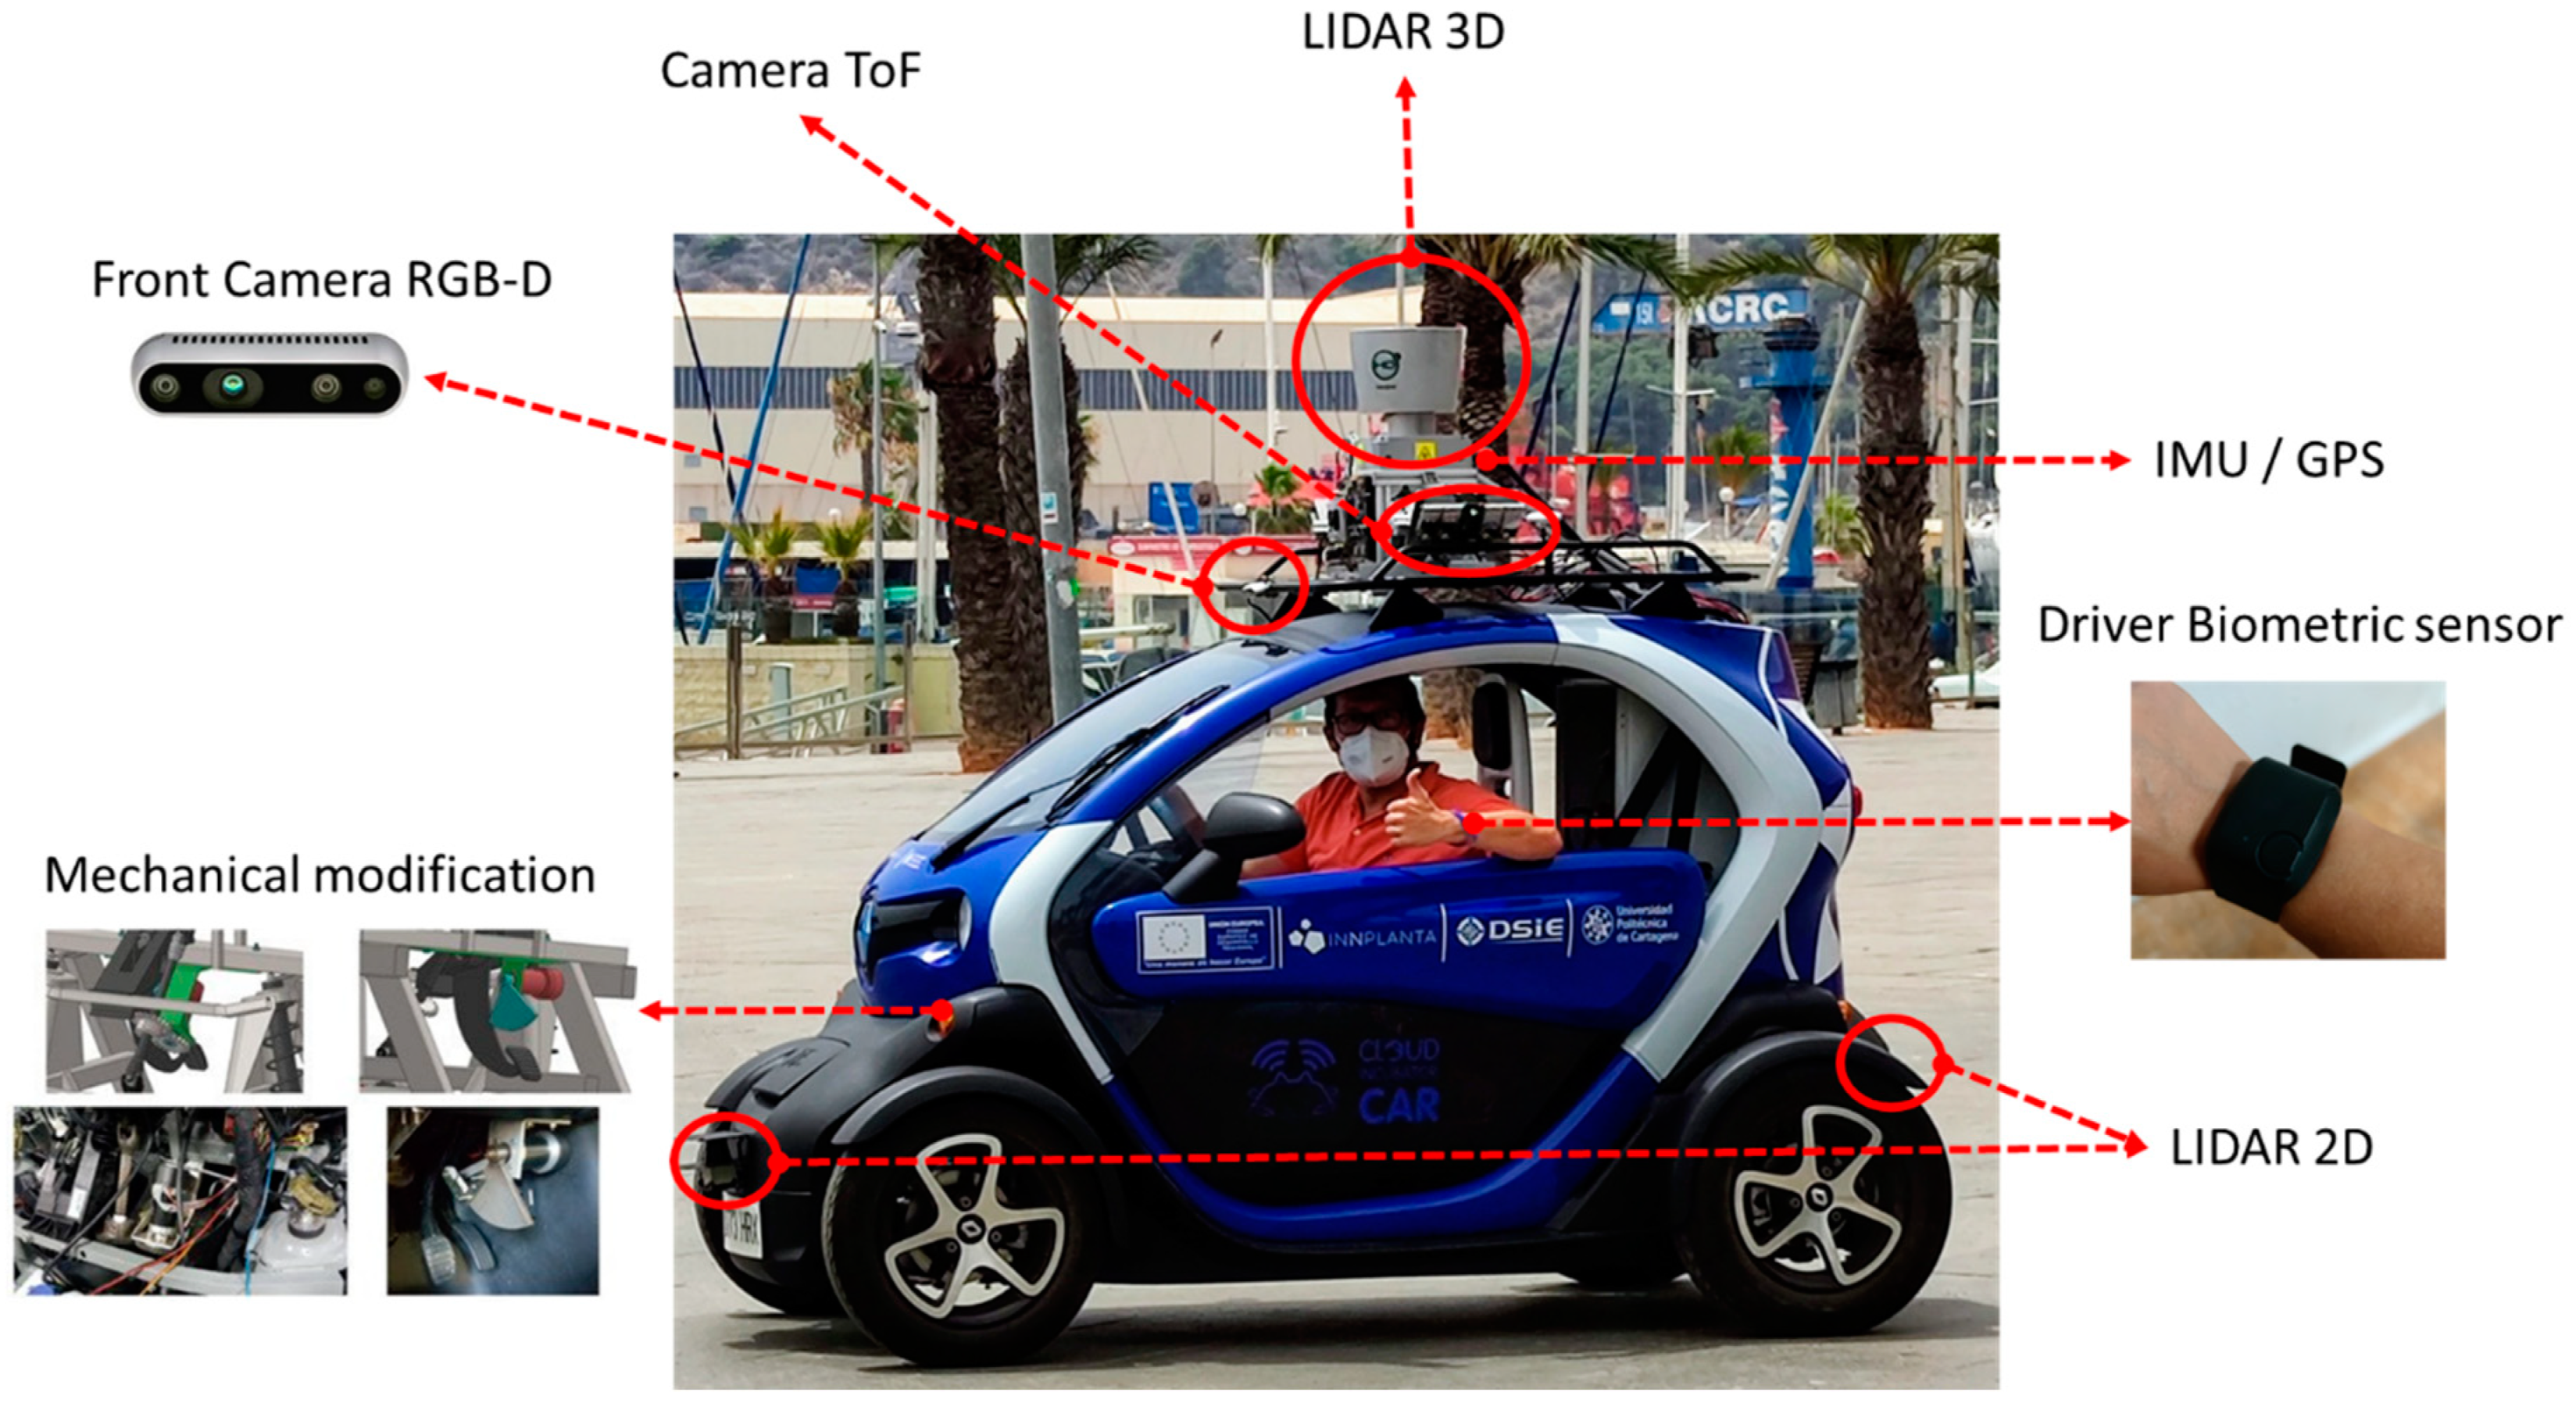
Figure 4.
Verification process.
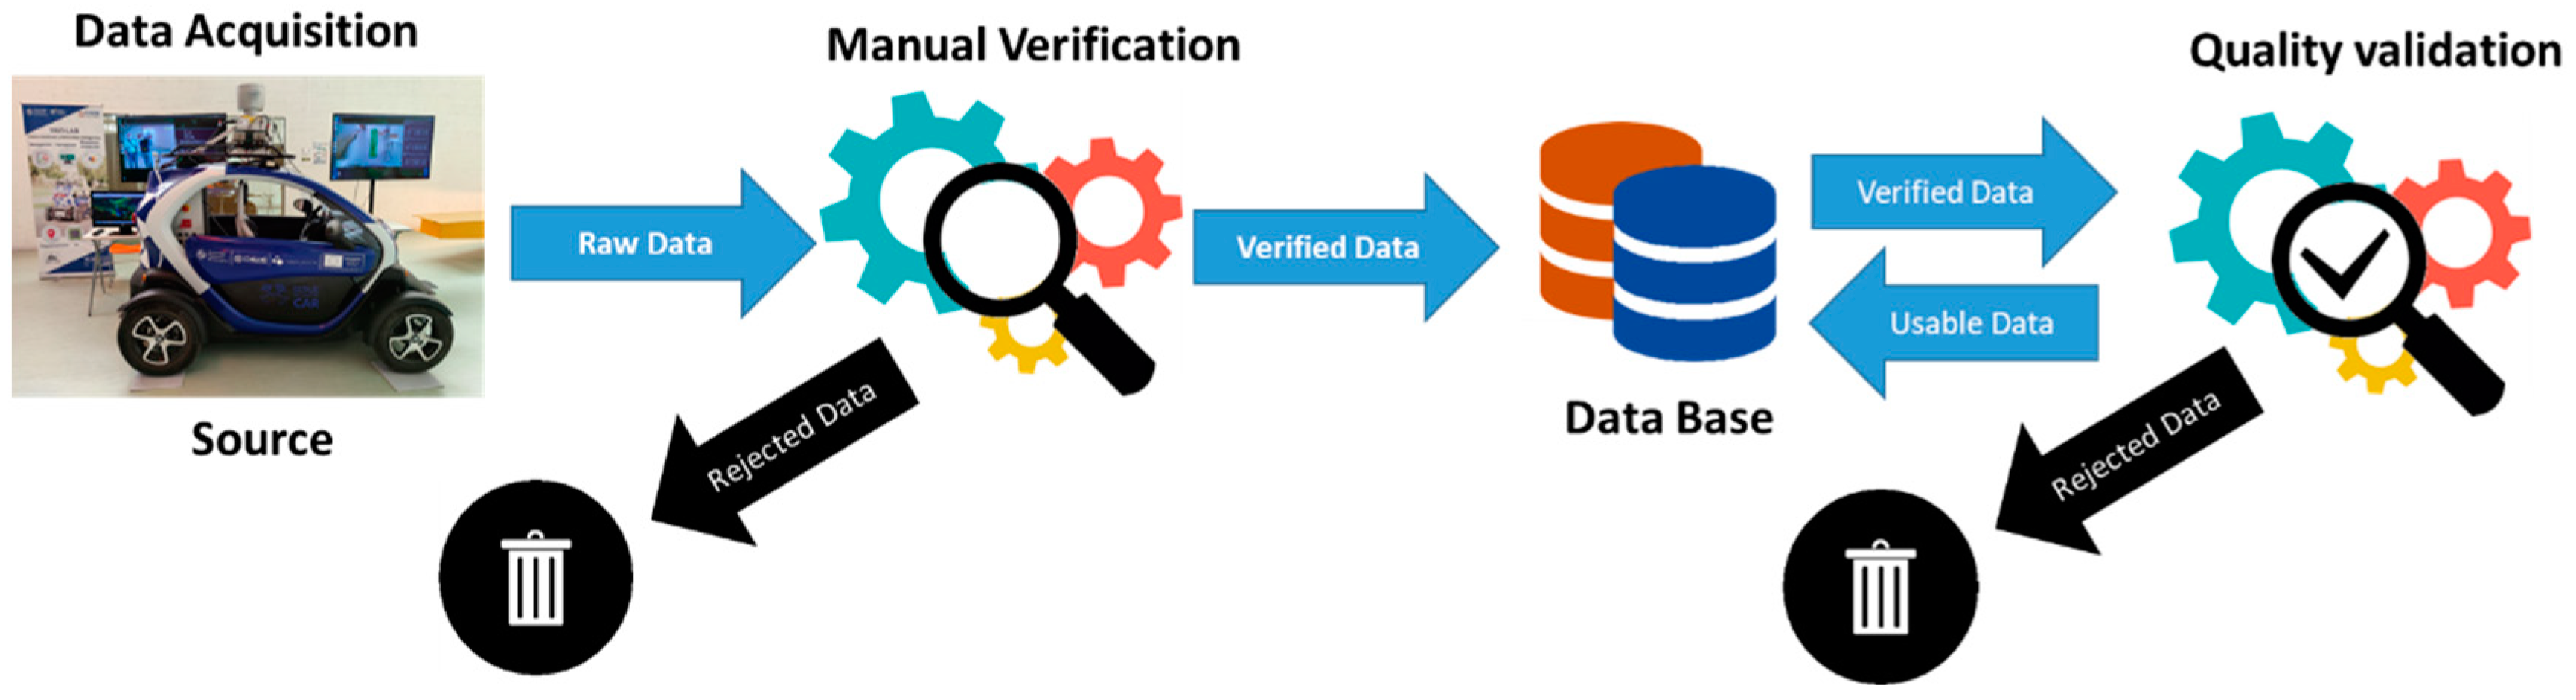
Figure 5.
Data synchronisation with timestamp. a) accelerator; b) break; (c) distance; (d) steering wheel angle.
Figure 5.
Data synchronisation with timestamp. a) accelerator; b) break; (c) distance; (d) steering wheel angle.
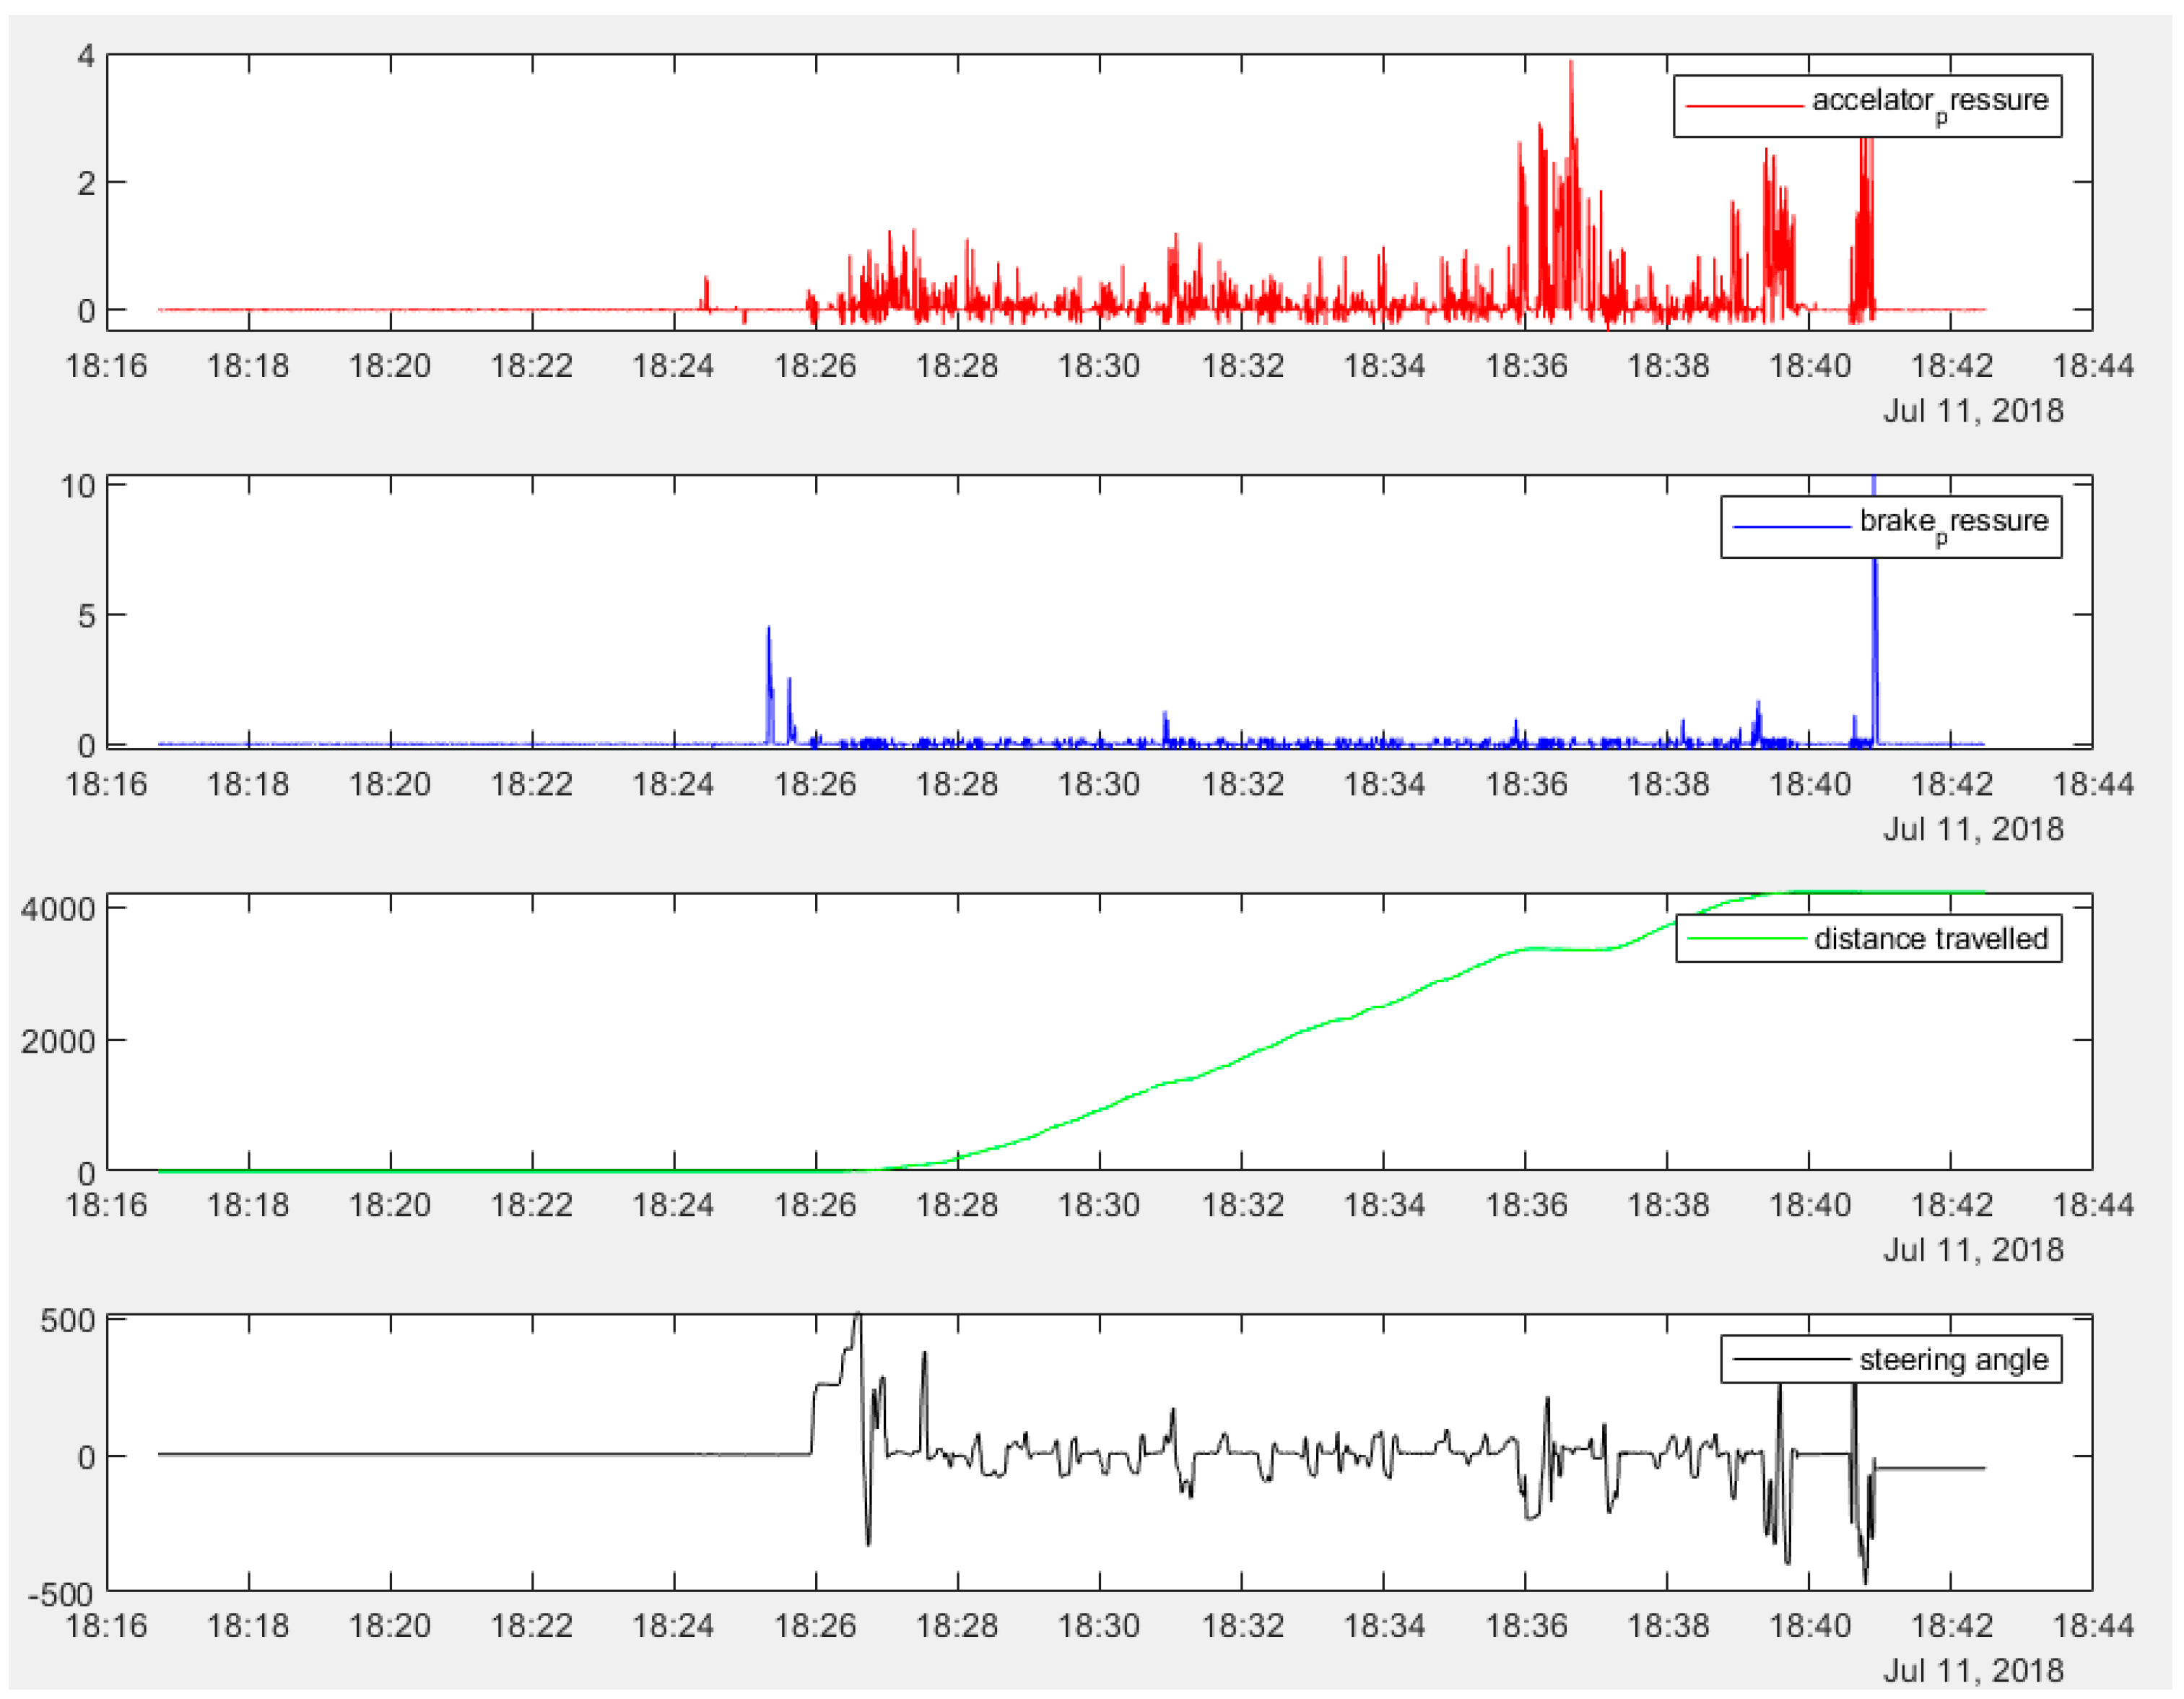

Table 1.
Comparison of the main Datasets.
| Ref./Year | Samples | Image Type | LIDAR | RADAR | IMU / GPS | ControlActions | Raw data | Driver data | Real data | Biometrics data | Driver Behaviour |
|---|---|---|---|---|---|---|---|---|---|---|---|
| UPCT | 78 K | RGB, Depth | Yes | No | Yes | Steering wheel, Speed | Yes | Yes | Yes | Yes | Yes |
| Lyft L5 [4] /2019 | 323 K | RGB | Yes | No | Yes | - | Yes | No | Yes | No | No |
| nuScenes [5] /2019 | 1.4 M | RGB | Yes | Yes | Yes | - | Partial | No | Yes | No | No |
| Pandaset [6] /2019 | 48 K | RGB | Yes | No | Yes | - | Partial | No | Yes | No | No |
| Waymo [7] /2019 | 1 M | RGB | Yes | No | Yes | - | Yes | No | Yes | No | No |
| A2D2 [8] /2020 | 392 K | RGB | Yes | No | Yes | Steering angle, brake, accelerator | Partial | No | Yes | No | No |
| IDDA [9] /2020 | 1 M | RGB, Depth | No | No | No | - | No | No | No | No | No |
| Udacity [10] /2016 | 34 K | RGB | Yes | No | Yes | Steering wheel | Yes | No | No | No | No |
| PreSIL [11] /2019 | 50 K | RGB | Yes | No | No | - | No | No | No | No | No |
| GAC [12]/2019 | 3.24 M | RGB | No | No | No | Steering wheel, Speed | N/A | No | Yes | No | No |
| KITTI [13] /2012 | 15 K | RGB | Yes | No | Yes | - | Yes | No | Yes | No | No |
| Appollo Scape [14] /2020 | 100 K | RGB | Yes | No | No | - | No | No | Yes | No | No |
| Cityscapes [15] /2020 | 25 K | RGB | No | No | Yes | - | No | No | Yes | No | No |
| OLIMP [16] /2020 | 47 K | RGB | No | Yes | No | - | Yes | No | Yes | No | No |
Table 2.
Demographic distribution of subjects by gender and age.
| Categories | n Initial | % Initial | n Final | % Final | |
|---|---|---|---|---|---|
| Gender | Male | 26 | 52 | 11 | 55 |
| Female | 24 | 48 | 9 | 45 | |
| Age | 18-24 | 6 | 12 | 3 | 15 |
| 25-44 | 22 | 44 | 10 | 50 | |
| 45-64 | 17 | 34 | 5 | 25 | |
| >=65 | 5 | 10 | 2 | 10 |
Table 3.
Sensor data in CICar.
| Device | Variable | Details |
|---|---|---|
| LiDAR 3D | Scene | Long-range sensors 3D High-Definition LIDAR (HDL64SE supplied by Velodyne) Its 64 laser beams spin at 800 rpm and can detect objects up to 120 m away with an accuracy of 2 cm. 1.3 Million Points per Second Vertical FOV : 26.9° |
| 2 x LiDAR 2D | Scene | Short-range sensors Sick laser 2D TIM551 Operating range 0.05 m ... 10 m Horizontal FOV 270° Frequency 15 Hz Angular resolution 1° Range 10% of reflectance 8 m |
| 2 x ToF | Scene | Short-range sensors ToF Sentis3D-M420Kit cam Range: Indoor: 7 m Outdoor: 4 m, Horizontal FOV: 90° |
| RGB-D | Scene | Short-range sensors Depth Camera D435 Intel RealSense range 3m Up to 90 fps Depth FOV: 87° × 58° RGB FOV: 69° × 42° |
| IMU | Localization, Longitudinal and transversal Acceleration | NAV440CA-202 Inertial Measurement Unit (IMU) 3-axis accelerometer Bandwidth: 25 Hz Pitch and roll accuracy of < 0.4°, Position Accuracy < 0.3 m |
| GPS | Localization | EMLID RTK GNSS Receiver 7 mm positioning precision |
| Encoder | Distance | |
| Biometric sensors | Driver Biometric signals | Empatica E4 EDA Sensor (GSR Sensor), PPG Sensor, Infrared Thermopile, 3-axis Accelerometer |
Table 4.
Biometric variables details.
| Variable | Sampling Frequency | Signal range [min, max] | Details |
|---|---|---|---|
| ACC | 32 Hz | [-2g, 2g] | Accelerometer 3 axes data (x,y,z). |
| EDA | 4 Hz | [0.01µS, 100µS] | Electrodermal activity by capturing electrical conductance (inverse of resistance) across the skin. |
| BVP | 64 Hz | n/a | Blood Volume Pulse. |
| IBI | 64 Hz | n/a | Inter-beat interval (obtained from the BVP signal) |
| HR | 1 Hz | n/a | Average Heart Rate (obtained from the BVP signal). Values calculated at 10 second intervals. |
| TEMP | 4 Hz | [−40ºC, 115ºC] | Skin Temperature. |
Disclaimer/Publisher’s Note: The statements, opinions and data contained in all publications are solely those of the individual author(s) and contributor(s) and not of MDPI and/or the editor(s). MDPI and/or the editor(s) disclaim responsibility for any injury to people or property resulting from any ideas, methods, instructions or products referred to in the content. |
© 2023 by the authors. Licensee MDPI, Basel, Switzerland. This article is an open access article distributed under the terms and conditions of the Creative Commons Attribution (CC BY) license (http://creativecommons.org/licenses/by/4.0/).
Copyright: This open access article is published under a Creative Commons CC BY 4.0 license, which permit the free download, distribution, and reuse, provided that the author and preprint are cited in any reuse.


