
Submitted:
24 January 2023
Posted:
26 January 2023
You are already at the latest version
Abstract
Rotor blade bearings enable the rotor blades to pivot about their longitudinal axis and thus control the power output and reduce the loads acting on the wind turbine. Over a design period of 20 years, rolling bearings are exposed to frequent oscillating movements with amplitude ratios of x/2b>1, especially due to new control concepts such as Individual Pitch Control, which can lead to wear and a reduction in service life. The objective of the paper is to identify the dominant wear mechanisms and their consequences for the operation of oscillating bearings. Oscillating experiments with increasing number of cycles on angular contact ball bearings of two different sizes (type 7208 and 7220), show that the damage initiation starts with adhesive and corrosive wear mechanisms, which result in a sharp increase of the torque as well as the wear volume on the bearing raceway. As the number of cycles increases, an abrasive mechanism occurs, resulting in a lower slope of the wear curve and a smoothing of the resulting wear depressions. The wear and torque curves are evaluated and classified using an energy-wear approach according to Fouvry.
Keywords:
grease lubrication
; false brinelling
; oscillating bearing
; pitch bearing
; wear
1. Introduction
Oscillating Bearings in Wind Turbines
Grease lubricated oscillating rolling element bearings can be found in various industrial applications. One example are rotor blade bearings of wind turbines. Rotor blade bearings are large slewing bearings. Stochastic wind conditions lead to transient loads acting on the bearings in 5 degrees of freedom. In addition, the interface parts like rotor blades and the hub can have complex and changing stiffness properties, which affect load distribution and deformation of the bearings. Furthermore, the environment, like low temperatures and high humidity, adds to the challenging operating conditions.
Several bearing designs are in use, with the four-point contact double row ball bearing being the most common design for modern wind turbines. The blade bearing connects the rotor blade to the hub and enables rotation of the blade along its longitudinal axis. This so-called pitching movement changes the angle of attack of the rotor blades and thus influences the power output and the loads acting on the wind turbine. The pitch controller changes the pitch angle of all rotor blades to limit the power output above rated wind speed and keep the rotational speed of the rotor constant. This is usually called collective pitch control (CPC), as all three blades are subject to the same pitch angle changes [1]. In addition, there are more advanced pitch control strategies which enable other features like load mitigation or wake steering [2,3]. These more advanced pitch controller set ups have in common, that every blade is controlled individually. Hence, the controller can react to different inflow conditions across the rotor plane –e. g., induced by the vertical wind shear-– with each individual blade to lower the fatigue relevant load cycles on the structure of the wind turbine. This method is usually called individual pitch control (IPC). Recent investigations showed that IPC in contrast to CPC can decrease the number of very small oscillation movements and leads to generally larger oscillation amplitudes [4,5]. These oscillation angles depend on the individual controller and turbine design and do not allow for a general statement. However, it can be stated that with respect to the available investigations based on reference wind turbine models that the amount of oscillating movement with an amplitude ratio is higher when using an IPC controller. The amplitude ratio is defined as the quotient of the distance that the center of the contact travels relative to the bearing raceway x and the width of the contact ellipse . Figure 1 illustrates the amplitude ratio .
In addition, Behnke et al. and Wandel et al. found, that the very small oscillation movements are most likely not the most critical ones when it comes to wear as a failure mode and the middle range of amplitude ratios has a greater impact [5,6] . However, the stochastic nature of the wind and operating conditions of the wind turbine as well as the influence of the specific order of occurrence of cyclic movements of the blade bearings makes rating the risk of wear damage a very difficult topic. Thus, there is a certain risk, that site specific wind conditions stay between cut in and rated wind speeds for long periods of time and IPC operation can add up over 13 000 cycles without significant change in the mean angle of oscillation [7]. This makes a better understanding of the wear mechanisms especially for a comparably low number of oscillation cycles valuable. This paper focuses on investigating those small angular oscillations with constant oscillation frequency and amplitude regarding their impact on wear development. The next chapter will describe these wear provoking operating conditions in more detail.
Wear in oscillating bearings
The wear problem in oscillating rolling bearings has been known since 1937, when Almen investigated damage to wheel bearings of passenger cars transported on diesel ships and introduced the name False Brinelling for such wear marks [8]. It has been understood, e. g., through the work of Vingsbo and Grebe, that the amplitude ratio and thus the oscillation angle has a decisive influence on the underlying wear mechanisms [9,10]. Bearings subjected to oscillations with very small amplitudes can result in surface-induced fatigue cracks. Detailed studies on these operating conditions have been carried out by Grebe, Schwack, Shadow, and others [11,12,13]. It has been assumed up to now that small oscillation angles are more critical with regard to wear initiation, and that increasing amplitude ratios lead to improved lubricant film formation preventing wear. However, investigations by Wandel have shown that an amplitude ratio of for example can more critical than an amplitude ratio of [6]. Only significantly larger amplitude ratios counteract the initiation of wear. As stated before, new controller concepts such as IPC increasingly cause oscillations with amplitude ratios . In this amplitude range, the number of research papers focusing on wear is significantly lower than in the range of . In 1997, Phaner-Groutorbe used scanning tunnel microscopy (STM) to show how the microscopic surface structure changes locally in individual wear marks on the bearing raceway surface. Other publications deal with lubrication mechanisms and the effectiveness of greases in preventing wear damage. Summarized from the publications of Maruyama, Saatchi, Wandel, Kita, and Shima, a high oil release as well as a low grease consistency and a high mobility of the base oil are crucial to prevent wear [14,15,16,17,18]. The suitability of lubricants for oscillating bearing applications is often determined using standard tests such as the Fafnir-test and the SNR-FEB2-test [19,20]. The Fafnir-test is is specified in an ASTM standard, and uses thrust ball bearings with an outside diameter of 35.69 mm oscillated at an amplitude ratio of and an oscillation frequency of Hz for 22 hours at a maximum contact pressure between GPa. The European equivalent, the SNR-FEB2-test, uses type 51206 thrust ball bearings with an outer diameter of mm that are oscillated at an amplitude ratio of and a frequency of Hz for 50 hours at a maximum contact pressure of GPa. In both tests the bearing washers are weighed before and after the test to determine the mass loss. The standard does not include in situ measurement of the wear progress or the bearing torque, which is why the development of wear volume over time has not yet been publicly documented. The aim of this paper is to analyse the development of wear in angular contact ball bearings that are subjected to oscillations at amplitude ratios of which are especially interesting for IPC-Controllers in wind turbines. For this purpose each wear mark of the bearing is analysed phenomenologically and quantitatively at different stages in the wear progress in order to understand which wear mechanisms are active at which point in time. Thus, it can be deduced at which stage the use of protective measures such as protection runs, as reported by Stammler could be effective [21]. Furthermore, a connection of the measured results to a well-known energy wear approach according to Fouvry will be established and discussed [22]. This allows a distinction of the wear mechanisms.
2. Materials and Methods
2.1. Experimental Setup
The experiments presented in this paper were carried out on two different setups. One setup was used to perform the experiments on type 7208 angular contact ball bearings (ACBB), the other one uses type 7220 ACBB. The basic structure of the test rigs is similar, thus only one rig is explained in detail. Figure 2 shows the above mentioned test setup for the type 7208 angular contact ball bearings. A position-controlled asynchronous servo motor allows oscillation with variable amplitude and frequency. It drives a shaft on which two unsealed angular contact ball bearings are mounted in x-arrangement (facet-to-face). Drive and shaft are connected by a torque measurement shaft with an integrated incremental encoder. The bearings are axially loaded by a hydraulic load unit. The temperature on the bearing outer rings during the tests is monitored by PT100 sensors.
2.2. Methods of Analysis
In order to gain an understanding of the mechanisms involved in the wear progression the angle synchronous torque during the test run is recorded. Figure 3 shows two exemplary torque curves over the oscillation angle. The curve shows a torque curve of an undamaged bearing as was first explained by Dahl et al. and later further discussed by Todd et al. [23,24]. With the slope s of the curve after the reversal point that comes from an elastic response of the contacting partners and the steady-state torque at fully developed rolling. For an undamaged bearing the steady-state torque is close to the maximum torque during an oscillation cycle . During the course of our tests the shape of the torque curve changes so that curves like the blue one in Figure 3 emerge. Here, a significantly increased is observed in the reversal points. The angle-synchronous torque allows the calculation of the dissipated friction energy , which can be viewed as the integral of the enclosed areas of N friction curves. In Figure 3 the areas (green) and (blue) are displayed for the exemplary torque curves.
The aim of the determination of the friction energy is to find a relation between dissipated energy and wear volume on the bearing raceway according to Fouvry [22].
A laser scanning microscope is used to determine the worn material volume on the bearing raceway surface. To calculate the wear volume of the 7208 bearings, a topographical image of the whole wear mark with surrounding non-worn areas is acquired. The non-worn areas are interpolated with second-degree functions to create a model of the original raceway surface. By subtracting the worn surface from the original surface, a difference image is created from which the worn volume of a damage mark is determined.
In contrast to the laser scanning microscopic measurements of the 7208 bearings, the procedure is applied differently for the larger bearings of type 7220. Due to the larger dimension of the wear mark, about 4 x 8 mm, the curvature of of the raceway makes a complete topographic examination difficult and time consuming. Therefore, only a section of the wear mark was investigated with the laser scanning microscope using the same procedure as described above. To gain repeatable results, the lateral extension of the wear mark is investigated to find the position of the upper third part of the wear mark, which is usually characterized by the most prominent wear damage. Hence, the measured wear volume calculated for the 7220 bearing are not reflecting the total amount of worn material per damage mark. Instead, they are used as a benchmark to characterize the wear damage produced by different test configurations and parameter sets. As the wear volume only covers a fraction of the wear mark it is multiplied by factor of 15, which is derived from dividing the height of the contact ellipse at a pressure of 2.5 GPa by the height of laser scan. The idea of this factor is to achieve a wear volume, which closer represents a complete wear mark. Even if the absolute values after adjusting are inaccurate, it simplifies the comparison of results.
In addition to the topography images taken with the laser scanning microscope, optical microscopic images of the damage were taken to provide a visual assessment of the damage. However, it is not only difficult to perform laser scans for evaluating the wear volume but also difficult to process light microscopic images. The curvature of the raceways and the shiny appearance lead to strong reflections which are hard to avoid and interfere with the visual impression of the wear marks. Hence, the light microscopic images of the 7220 bearing raceways just show sections which cover a window of about 0.53 mm in height and 4.4 mm in width. Due to the different microscope used for the light microscopic images, they have far less reflections and appear more dull in comparison with the images taken from the 7208 bearings.
To compare the results of the different bearing sizes investigated in this paper with respect to the energy wear factor, the measured wear volume and measured friction torque are adjusted to describe the wear factor for a single ball raceway contact. Hence, the friction torque measured for a set of two bearings is divided by 2 and the number of ball raceway contacts per bearing.
2.3. Experimental Conditions
In this section the conditions for the tests carried out on the different bearing sizes are explained in detail. All experiments were done with a fully formulated grease paste that is commonly used in rotor blade bearing applications. The grease parameters are listed in Table 1.
2.3.1. Experimental Conditions 7208 bearings
For this test, an axial load of 12 kN which leads to a contact pressure of 2 GPa in the contact between inner ring and rolling element was applied. An oscillation frequency of 5 Hz and an oscillation angle of 7 or an amplitude ratio are chosen.
The choice of operating conditions was based on the previously described frequent ratios occurring in IPC-controllers, as well as on previously performed parameter studies with the same bearing type [6,18]. These have already shown that the conditions are particularly critical for early wear initiation. The bearings are each filled with 10 ml of grease through a syringe. Afterwards the bearings are mounted and continuously rotated at 10 for 20 rotations, so that an even distribution of grease is ensured. Afterwards the oscillating test sequence is initiated. To be able to follow the progression of the raceway damage, tests with an increasing number of cycles were conducted, i. e., a pair of bearings was run for a defined number of for example 1 000 Cycles and afterwards dismounted, cleaned and prepared for the optical analysis. Subsequently a fresh pair of bearings was tested for 10 000 cycles under the same test conditions and so on. The tested parameters are listed in Table 2.
2.3.2. Experimental Conditions on 7220 Bearings
The tests with the bearings of type 7220 are conducted at an axial load of 90 kN. This axial force translates to contact pressure of about of 2.5 GPa at the contacts between rolling elements and inner ring. The oscillation frequency is set to 0.5 Hz and the oscillation angle for the sinusoidal movement is . This set of parameters translates to an ratio of 2.6 with a frequency which is typical for corresponding operating conditions in a wind turbine. Each of the bearings is thoroughly cleaned from corrosion protection and lubricated with about 160 ml of the test grease (see Table 1). After assembly of the bearings in the test rig and before any cyclic movements are applied, the load is applied to the bearings while at least 100 full rotations are performed while checking the driving torque signal. This procedure not only ensures a proper seating of the bearings but also a good grease distribution. As with the bearings of type 7208, several tests are carried out whereas the more general test parameters like load, oscillating frequency and angle are kept constant the number of cycles is changed for different tests. The parameters are listed in Table 2.
3. Results
In this section, the light microscope images, as well as the topography measurements with the laser scanning microscope are evaluated. In addition, the recorded torque is analyzed and a connection is made between the dissipated energy and the measured wear volume.
3.1. Wear Development 7208
To show how the damage marks on the inner raceway of the bearings are developing Figure 5 shows representative damage marks after different cycle counts. Figure 5a) shows a contact area with starting corrosive wear after 1 000 cycles. At this cycle count most contact areas are not showing signs of severe wear, others like the one in the figure are partly showing corrosive wear. After 20 000 cycles (Figure 5b)) every contact area shows severe damage that has spread over the entire area swept by the rolling elements. In the damage mark, smaller micropitts and as a result a rough looking surface can be observed. In addition, reddish-brown and blackish-brown corrosive products are visible. At a more advanced stage, after 80 000 cycles, the damage pattern shown in Figure 5c) appears. Some parts of the wear mark still appear reddish-brown and on the left side at middle height a bigger material spall can be observed. It is also noticeable that large parts of the damage mark have been smoothed and have a mirror-like appearance. After 160 000 cycles (Figure 5d)), as after 80 000 cycles, a material spall is found on the right side of the mark at mid-height. Almost no corrosive products can be seen in the damage mark; these are only found at the outline of the mark. At this point, almost the entire ground of the damage mark appears to be polished and has a mirror-like appearance.
The wear volumes of the individual wear marks are shown in Figure 6. For each bearing examined after a defined number of cycles, a corresponding polar plot is shown, divided into 14 segments corresponding to the number of rolling elements. The mass loss of the marks on the inner ring is shown in green and the mass loss of the marks on the outer ring at the respective position on the bearing ring is shown in blue. The mass loss is determined by the measured wear volume and the density of 100Cr6 of . After 1 000 cycles most of the marks are still undamaged and almost no macroscopic wear can be determined with the applied method. After 10 000 cycles, a clear increase in mass loss can be seen, especially on the outer ring. It is also clear that all marks around the circumference of the bearing show macroscopic wear, but not all damage marks wear uniformly. While some marks already show a mass loss of 0.4 mg, other contact points lost less than 0.2 mg. The mass loss on the inner ring is still significantly lower than on the outer ring. After 20 000 cycles, a significant increase in mass loss can also be recorded on the inner ring. Here, the difference between the individual wear marks is even more noticeable. While individual marks show less than 0.1 mg, one wear mark already has a mass loss of 0.6 mg. As expected, the mass loss continues to increase with increasing number of cycles and reaches its maximum at 160 000 cycles, which corresponds to the maximum tested cycles. Here, a maximum of approx. 1m2 mg per mark is measured on the inner ring.
Figure 7 shows the measured wear volumes in a box-plot. The wear volume is shown on the y-axis and the number of cycles on the x-axis. The determined values of the inner ring are again shown in green, the values of the outer ring in blue. The median of the values is represented by a black dot in a white circle. The ends of the thick bars represent the quantile and quantile, respectively, the ends of the thin bars the minimum and maximum, respectively, and the fetch circles in the corresponding color the outliers. It is noticeable that –as was to be expected from the previously shown figure– the scattering of the wear volumes per damage mark is large, i. e., not every rolling element raceway system behaves in the same way. If we follow the wear volume at the inner and outer ring, we notice a degressive trend with increasing cycle number. A steep increase during the first 20 000 cycles is followed by a significantly shallower rise in the range from 80 000 to 160 000 cycles. It is also noticeable, that the slope of wear volume on the outer ring is greater in the initial phase than the slope of the wear curve on the inner ring. Towards the end of the experiments, the slope equalizes.
In order to establish a connection between the wear volume and torque, both the progression of the maximum torque per oscillation cycle (black), the summed wear volume on the bearing raceway (blue), and the summed frictional energy are shown versus the number of cycles in Figure 8. The course of the maximum torque starts at a low value of less than 2 Nm. After about 3 000 cycles, the torque starts to increase steeply and reaches a local maximum value of about 23 Nm after about 50 000 cycles. Up to the end of the test at 160 000 cycles, the torque remains almost constant in the further course and only increases by around 1 Nm. The green curve in Figure 8 shows the accumulated dissipated energy, which results from the torque curves as described in Section 2.2. The frictional energy shows a degressive behaviour, unlike what one would expect from the maximum torque. At this point, it is important to take a closer look at the shape of the torque curves over the number of cycles. This is because even if the maximum torque remains at an almost constant high level towards the end of the test, the enclosed area within the torque curves decreases from a certain point in time onward.
Figure 9 shows selected torque curves at the times when the bearings were analysed for wear. In light green is the torque curve after 1 000 cycles, which is similar in shape to the curve one would expect for an undamaged bearing, see Section 2.2. After 10 000 cycles, the shape is still qualitatively similar to the expected curve for an undamaged bearing, but the torque during the oscillation cycle has already increased significantly. The maximum torque during the oscillation cycle of approx. 10 Nm is reached about 1.5 after the reversal points. After 20 000 cycles the shape of the curve starts to change. Peaks start to form at the reversal points, which are decisive for the maximum torque in the following curves. But even in the middle of the curve around an angle of , the torque has continued to increase. From this point on, pronounced peaks form at the reversal points, which lead to an increase in the maximum torque. In the middle of the oscillation cycle around an angle of , however, the torque decreases. While values of Nm are observed at for the curve at 20 000 cycles, after 160 000 cycles only approx. Nm are measured.
The effects shown explain how the dissipated energy can be related to the maximum torque. In the last step, the relationship between wear volume and dissipated energy is established. For this purpose, the linearly interpolated wear volume is divided by half of the accumulated dissipated energy at the current cycle number n to obtain an energy wear factor according to Fouvry.
This results in the energy wear factor shown in Figure 10. For the first 3 000 cycles, which show no increase in torque, it is assumed that the grease lubrication is still effective to prevent wear in most contacts, so that . From this point on, there is a steep increase to a value of about at 10 000 cycles. Subsequently, degressively decreases until becoming almost constant after 80 000 cycles. The horizontal black lines are energy wear coefficients measured by Fouvry in a different test setup that will be further discussed in Section 4.
3.2. Wear Development 7220
The paper aims at identifying different wear mechanisms caused during the experiments by investigating the wear marks after and the torque signals during the tests. In addition to the investigation of 7208 bearings, this paper covers slightly larger bearings of type 7220. Despite the larger bearing size, the appearance of wear damage and its characteristics are very similar. Figure 11 shows a compilation of several photographic images of sections of wear marks produced with test parameters listed in Section 2.3.
The phenomenological investigation of the wear marks show different stages of wear damage. After about 1 000 cycles reddish-brown and blackish-brown corrosive products can be found on the raceway areas affected by the oscillating movements. With increasing cycle number this corrosive wear spreads to almost the complete width of about . In addition, the surface becomes rougher and local erosion of the surface is forming till 5 000 cycles. With further increasing number of cycles, the appearance becomes shiny and polished. The corrosive products seem to disappear. However, there are no large differences between 40 000 and 340 000 cycles, despite the wear mark looking a bit more polished towards the center.
The optical analyses of the topography of the wear marks leads to the results described in this section. The differences in applied analysing methods with respect to the wear volume are described in Section 2.2.
Figure 12 shows the wear volume calculation of several investigated wear marks and tested bearings at different numbers of cycles. The data points are the mean values of several wear marks investigated with respect to the associated amount of cycles. The graph is characterised by a steep increase of wear volume between 500 and 40 000 oscillation cycles. Increasing the number of cycles even further does not lead to a significant increase in wear volume. Even after 1 million cycles the characteristic wear volume has only roughly doubled compared to 40 000 cycles. However, the number of tests conducted for such high amount of cycles is limited, which makes the interpretation somewhat difficult.
As discussed in the previous chapters the torque signal is a strong indicator of wear damage forming on the raceways. Figure 13 shows the torque development for a test with 40 000 oscillation cycles and test parameters from Table 2.
The graph shows the peak torque value for each oscillation cycle during the test and the linear interpolated wear volume from the data points from Figure 12 scaled according to Section 2.2 to represent one wear mark. The underlying test and its data will be investigated in more detail. The torque signal is characterized by a steep rise, starting with only a few cycles of movement. The steep rise has an almost linear characteristic starting from the load depended baseline torque of the bearings of about 15 Nm for the very first cycles and ending at about 55 Nm at about 10 000 cycles. Between 10 000 and 20 000 cycles, the torque level declines to about 35 Nm. No major change in the torque signal can be observed between 20 000 and 40 000 cycles. In contrast to the investigations with type 7208 bearings, the changes in the friction torque seem to happen at fewer oscillating cycles. Figure 14 shows the first 2 000 oscillation cycles from Figure 13. The first 50 cycles are characterized by a decreasing friction torque. Afterwards the friction torque is rising according to the foregoing description.
According to the phenomenological investigation of wear marks derived from tests with different amount of cycles, different wear mechanisms seem to be present during the experiments distinguishable by the amount of oscillation cycles and the friction torque development. Besides investigating the peak torque per cycle, the torque during an oscillation cycle reveals some changes throughout the experiments pointing towards different wear mechanisms comparable to the investigation with type 7208 bearings.
Figure 15 shows the torque signal plotted over the oscillation angle at different numbers of cycles during the same test like in Figure 13. The oscillating movement with an oscillation angle of was carried out at a mean oscillation angle of with a sinusoidal characteristic. Hence, the turning points of the movements are at and and the position is characterised by the highest rolling speed of about . Starting with the first cycles, the characteristic of the torque curve changes. Between 10 and 10 000 cycles the torque signal rises noticeably at the position where the speed is at its highest value. In addition the torque level at the turning points also rises with more cycles leading to an overall larger area and wider appearance of the torque curve. From 10 000 cycles on, the shape of the torque curve changes its characteristics again. The torque level at high speeds seems to decrease, whereas the torque level at the turning points is rising even further.
A similar behaviour can be observed in Figure 9 during the tests with type 7208 bearings. As indicated in the previous chapter, the change in shape of the torque curves is associated with a degressive change in dissipated energy during every cycle. Analogous to the investigation of the smaller bearings, the relationship between wear volume and dissipated energy is evaluated for the type 7220 bearings. Hence, the energy wear factor according to 2 is calculated for the underlying test. Characterised by the friction torque development over the first cycles, no wear damage is considered for the first 50 cycles due to the slight decrease in friction torque. However, the steep increase in friction torque for the continuing cycles is associated with failing lubrication but wear volume measurements and the images of wear mark show (see Figure 11) that it takes about 1 000 cycles to form first corrosive wear damages and loss of material. Figure 16 shows the calculated energy wear factor for the underlying test of type 7220 bearings with 40 000 cycles. Similar to the smaller bearings, it is characterised by a steep increase over the very fist cycles, beginning at about 500 cycles. However, the peak value is reached earlier than for the 7208 bearings. The energy wear factor is decreasing after the peak value and reaches an almost constant value of about at 10 000 cycles.
4. Discussion
Parameter studies (see [6,18]) have shown that under certain operating conditions it is possible for grease-lubricated oscillating rolling bearings to operate without damage, at least for a short term. However, if the operating conditions result in severe starvation and solid contact between the rolling element and raceway, adhesion between the contact partners can occur due to the similarity of the materials. If micro-welds are torn apart by a forced movement, material pitting and particle formation will occur. The resulting particles have a high specific and reactive metallic surface area, which leads to oxidation of these particles. In the initial phase of the experiments shown, roughened surfaces with small material spalls as well as color changes indicative of corrosion can be seen in the damage marks. This is accompanied by a significant increase in torque over the entire oscillation cycle and a high energy wear coefficient. Based on these observations, the authors assume that the primary damage mechanism adhesion is responsible for the false brinelling damage in the initial phase, as it was also assumed by Tomlinson, Godfrey, and Almen. In the further course of wear process, the wear ground of the damage marks is increasingly smoothed.
The reason for the smoothing could be oxide particles, which act as an abrasive third body in the rolling element raceway contact due to their high hardness and chemical inertness. The particles are ground into increasingly finer particles in contact and act as a separating abrasive intermediate medium that prevents direct metallic contact and thus adhesion between the rolling element and raceway. For the raceway surface, the particles, which may be mixed with lubricant to form a paste, act like abrasive polish and lead to smoothing and the mirror-like appearance of the wear base. The hypothesis that an abrasive mechanism is dominant in the later stages of the test is supported by the fact that the energy-wear factor has a comparable magnitude to the factors determined by Fouvry [22]. Here, Fouvry investigated material pairings, which are not prone to adhesion due to their material properties, but to abrasive and corrosive wear. In Figure 10 two lines with constant energy wear coefficients are plotted, which were determined in his pin-on-disc experiments. The lower line at 25 600 was determined for a material pairing of Alumina and HSS-Steal, the upper line at approx. 57 000 for a pairing of and Alumina and sintered steel (DC1). The material properties, including those of 100Cr6, of which the bearings and rolling elements investigated here are made, are listed in Table 3. It should be noted that Fouvry’s tests were performed on dry contacts without lubrication. Since the energy-wear coefficients are nevertheless of a similar order of magnitude to the bearing tests under grease lubrication, it can be assumed that the lubricant only initially has a wear-inhibiting effect, but becomes almost useless in the course of the tests. This paper shows the results from tests conducted with two different bearing sizes lubricated with the same grease. All foregoing descriptions of the different wear mechanisms apply to the investigations on both bearing sizes. However, there are differences in the test results. Looking at Figure 17 the wear initiation and the transition between adhesion and abrasion happens earlier for the larger bearings.
For the investigations, it was assumed that the lubrication is effective until a torque increase can be recorded. Up to this torque increase, it is assumed in a simplified way that the dissipated energy mainly results from shearing of the fluid in the contact and does not have a relevant share in the raceway wear. From the torque increase onward, it is assumed that a parched contact is present and that the dissipated energy can be directly related to the occuring wear. Figure 17 shows the two curves of the energy wear factor for the two bearing types 7208 (blue) and 7220 (green). It is noticeable that the blue curve only starts to increase at approx. 3 000 cycles, whereas the green curve already starts to increase after 50 cycles. The maximum of the two curves is shifted by approximately the same cycle amount. The transition from the adhesive damage range with an increased energy wear factor to the abrasive damage range with an almost constant, lower energy wear factor occurs earlier and somewhat steeper in the larger bearings (green) than in the small bearings (blue). The reason for the fact that the damage process starts earlier and proceeds faster in the larger bearings is possibly the lubricant behavior close to the contact. The long semi-axis a of the contact ellipse for the tests of the 7220 bearings is about twice as long as for the 7208 bearings. If one assumes that after an initial phase in which the grease is displaced from the contact by the oscillating motion, the base oil bleeding from the side reservoirs has a decisive influence on the lubrication of the contact. A larger half axis a of the contact is disadvantageous as shown by the investigations of Cen into starved lubrication of rotating grease lubricated bearings [25]. Behnke et al. also show results of wear tests of real size blade bearings with the same grease as lubricant [5]. Especially for the smaller amplitude ratios wear already occurred for only 1 000 cycles, which matches the fast wear initiation obtained in the tests with the type 7220 bearings in this paper.
To be on the safe side, protective mechanisms such as lubrication cycles as proposed by Stammler et al. should therefore take place before a sharp increase in bearing torque due to lubrication failure and the onset of adhesive and corrosive damage. However, it has not yet been sufficiently clarified how exactly such damage affects the service life of, for example, a rotor blade bearing.
5. Conclusions
The investigations shown in this paper have illustrated the development of false brinelling damage both in terms of the visual appearance of the damage on the raceway and the volume of wear on the raceway. The results carried out on angular contact ball bearings of different sizes (type 7208, type 7220) show that false brinelling damage starts by adhesion and corrosion after an initial incubation period during which the lubricant can prevent severe damage on the raceway. This damage is manifested by red and black-brown discoloration and material pitts on the raceway surface. Damage initiation is accompanied by a steep increase in torque and wear volume. Damage initiation occurs earlier with larger bearings, presumably due to poorer lubricant supply to the contact because of the larger contact ellipse. The energy wear factor, which indicates how much wear volume occurs per dissipated energy, shows a maximum in the initial phase, after about 3 000 cycles for the type 7220 bearings and after about 5 000 cycles for the type 7208 bearings. In this range, it is assumed that the adhesive and corrosive damage mechanisms predominate. As the number of cycles increases, the energy wear factor decreases to about half of its maximum for both bearing types and remains at a near constant level from 10 000 cycles for the type 7220 bearings and from about 40 000 cycles for the type 7208 bearings onward. In this phase, the visual appearance of the marks changes from red or black-brown discoloration with pits, to increasingly smooth mirror-like appearing wear marks with increasing depth. Based on this appearance, it is assumed that an abrasive damage mechanism predominates in this phase. This assumption is consistent with the observation that the energy wear factor in this phase is approximately as large as the energy wear factors measured by Fouvry for abrasive wear in a ball-on-disc contact [26]. Finally, it can be concluded from the results that even a small number of cycles can lead to severe wear on the raceway surface. The initial phase is particularly critical due to the adhesive and corrosive wear mechanisms present. In addition, the initiation of wear seems to start significantly earlier in the larger rolling contact, which appears to be particularly critical with regard to the use in full-size rotor blade bearings.
Author Contributions
onceptualization, S.W. and A.B.; methodology, S.W. and A.B.; validation, S.W. and A.B.; formal analysis, S.W., A.B. and J.G.; investigation, S.W., A.B., N.B.; resources, S.W., A.B., and G.P.; writing—original draft preparation, S.W. and A.B.; writing—review and editing, S.W., A.B., N.B., and G.P.; visualization, S.W., A.B. and J.G.; supervision, G.P.; project administration, S.W., A.B. and G.P.; funding acquisition, S.W., A.B. and G.P. All authors have read and agreed to the published version of the manuscript.
Funding
This document is a result of the research projects "iBAC - intelligent Blade Bearing Amplitude Control" (grant number: 0324344A) and "HBDV - Highly Loaded Slewing Bearings" (grant number: 0324303A) funded by the Federal Ministry for Economic Affairs and Climate Action (Federal Republic of Germany) and of the project.
Data Availability Statement
The data presented in this study is available on request from the corresponding author.
Acknowledgments
The authors would like to thank Bela Lehnhardt for his support in assembling the bearings for the experiments.
Conflicts of Interest
The authors declare no conflict of interest. The funders had no role in the design of the study; in the collection, analyses, or interpretation of data; in the writing of the manuscript; or in the decision to publish the results.
Abbreviations
The following abbreviations are used in this manuscript:
| ACBB | Angular Contact Ball Bearing |
| HSS | High Speed Steel |
| IPC | Individual Pitch Control |
| CPC | Collective Pitch Control |
| f | Oscillation Frequency |
| Oscillation Angle | |
| Amplitude ratio. Ratio of moved distance x | |
| to double half-width of the contact ellipse b | |
| Maximum Contact Pressure | |
| Outer Diameter | |
| Steady State Torque | |
| Maximum Torque | |
| Dissipated Friction Energy | |
| Energy Wear Factor |
References
- Burton, T. Wind Energy Handbook,2nd ed., 2011.
- Bossanyi, E.A. Individual blade pitch control for load reduction. Wind Energy: An International Journal for Progress and Applications in Wind Power Conversion Technology 2003, 6, 119–128. [Google Scholar] [CrossRef]
- Barlas T.K., v. K.G. Review of state of the art in smart rotor control research for wind turbines. Progress in Aerospace Sciences 2010, 46, 1–27. [Google Scholar] [CrossRef]
- Stammler, M.; Thomas, P.; Reuter, A.; Schwack, F.; Poll, G. Effect of load reduction mechanisms on loads and blade bearing movements of wind turbines. Wind Energy 2020, 23, 274–290. [Google Scholar] [CrossRef]
- Behnke, K.; Schleich, F. Exploring Limiting Factors of Wear in Pitch Bearings of Wind Turbines with Real Scale Tests. Wind Energy Science Discussions 2022, 2022, 1–22. [Google Scholar] [CrossRef]
- Wandel, S.; Bader, N.; Schwack, F.; Glodowski, J.; Lehnhardt, B.; Poll, G. Starvation and relubrication mechanisms in grease lubricated oscillating bearings. Tribology International 2022, 165, 107276. [Google Scholar] [CrossRef]
- Schwack, F.; Halmos, F.; Stammler, M.; Poll, G.; Glavatskih, S. Wear in wind turbine pitch bearings—A comparative design study. Wind Energy 2022, 25, 700–718. [Google Scholar] [CrossRef]
- Almen, J.O. Lubricants and False Brinelling of Ball and Roller Bearing. Journal of Mechanical Engineering 1937, 59, 415–422. [Google Scholar]
- Vingsbo, O.; Söderberg, S. On Fretting Maps. Wear 1988, 1988, 131–147. [Google Scholar] [CrossRef]
- Grebe, M.; Molter, J.; Schwack, F.; Poll, G. Damage mechanisms in pivoting rolling bearings and their differentiation and simulation. Bearing World Journal 2018, 3, 72–85. [Google Scholar]
- Grebe, M. False Brinelling - Standstill marks at roller bearings. PhD thesis, Slovak University of Technology, Bratislava, 2012.
- Schwack, F. Untersuchungen zum Betriebsverhalten oszillierender Wälzlager am Beispiel von Rotorblattlagern in Windenergieanlagen. PhD thesis, Leibniz Universität Hannover, Hannover, 2020.
- Schadow, C. Stillstehende fettgeschmierte Wälzlager unter dynamischer Beanspruchung. PhD thesis, Otto-von-Guericke-Universität, Magdeburg, 2016.
- Kita, T.; Yamamoto, Y. Fretting wear performance of lithium 12-hydroxystearate greases for thrust ball bearing in reciprocation motion. Japanese Journal of Tribology 1997, 42, 782–783. [Google Scholar]
- Shima, M.; Jibiki, T. Fretting wear. Journal of Japanese Society of Tribologists 2008, 53, 462–468. [Google Scholar]
- Maruyama, T.; Saitou, T.; Yokouchi, A. Differences in Mechanisms for Fretting Wear Reduction between Oil and Grease Lubrication. Tribology Transactions 2016, 60, 497–505. [Google Scholar] [CrossRef]
- Saatchi, A. The Effect of Grease Composition on Fretting Wear. PhD thesis, University of Akron, 2019.
- Wandel, S.; Bader, N.; Glodowski, J.; Lehnhardt, B.; Leckner, J.; Schwack, F.; Poll, G. Starvation and Re-lubrication in Oscillating Bearings: Influence of Grease Parameters. Tribology Letters 2022, 70, 1–14. [Google Scholar] [CrossRef]
- American Society for Testing and Materials. ASTM D4170 : 2016 - Standard Test Method for Fretting Wear Protection by Lubricating Greases, 2016. [CrossRef]
- Francaise, N. NFT 60-199 - Aptitude à résister au faux effet Brinell, 1995.
- Stammler, M.; Poll, G.; Reuter, A. The influence of oscillation sequences on rolling bearing wear. Bearing World Journal 2019, 4, 19–25. [Google Scholar]
- Fouvry, S.; Liskiewicz, T.; Kapsa, P.; Hannel, S.; Sauger, E. An energy description of wear mechanisms and its applications to oscillating sliding contacts. Wear 2003, 255, 287–298. [Google Scholar] [CrossRef]
- Dahl, P. A solid friction model. Technical report, Aerospace Corp El Segundo Ca, 1968.
- Todd, M.; Johnson, K. A model for coulomb torque hysteresis in ball bearings. International journal of mechanical sciences 1987, 29, 339–354. [Google Scholar] [CrossRef]
- Cen, H.; Lugt, P.M. Replenishment of the EHL contacts in a grease lubricated ball bearing. Tribology international 2020, 146, 106064. [Google Scholar] [CrossRef]
Figure 1.
Illustration of the amplitude ratio . In dark blue the Hertzian contact ellipse in the reversal points of the oscillatory motion is shown.
Figure 1.
Illustration of the amplitude ratio . In dark blue the Hertzian contact ellipse in the reversal points of the oscillatory motion is shown.
Figure 2.
The upper part shows a picture of the complete test setup including the servo motor the torque shaft and the test unit. The lower part shows a drawing of the test unit that contains the two angular contact ball bearings of type 7208.
Figure 2.
The upper part shows a picture of the complete test setup including the servo motor the torque shaft and the test unit. The lower part shows a drawing of the test unit that contains the two angular contact ball bearings of type 7208.
Figure 3.
Two exemplary torque curves that can arise qualitatively during the experiments. In green the torque curve of the undamaged bearing, which corresponds to the model curve set up according to Dahl with the slope s and the steady-state torque , is shown. The qualitative torque at advanced damage formation is shown in blue. The area of the curves (green) and (blue), shown in transparent colors, correspond to the dissipated energy for the respective oscillation cycle.
Figure 4.
The left figure shows in blue/green the measured real profile of a damaged raceway surface of a 7220 bearing. The interpolated undamaged raceway surface is shown in black. The right figure shows the difference image of a damage mark in a 7208 bearing, which results from the difference of interpolated surface and real profile.
Figure 5.
Damage on the inner Raceway of a 7208 rolling element bearing for different oscillation cycle numbers N; Experimental parameters: contact pressure =2 GPa; oscillation Angle = 7; oscillation frequency f= 5 Hz; Grease: Fully formulated Li Grease
Figure 5.
Damage on the inner Raceway of a 7208 rolling element bearing for different oscillation cycle numbers N; Experimental parameters: contact pressure =2 GPa; oscillation Angle = 7; oscillation frequency f= 5 Hz; Grease: Fully formulated Li Grease
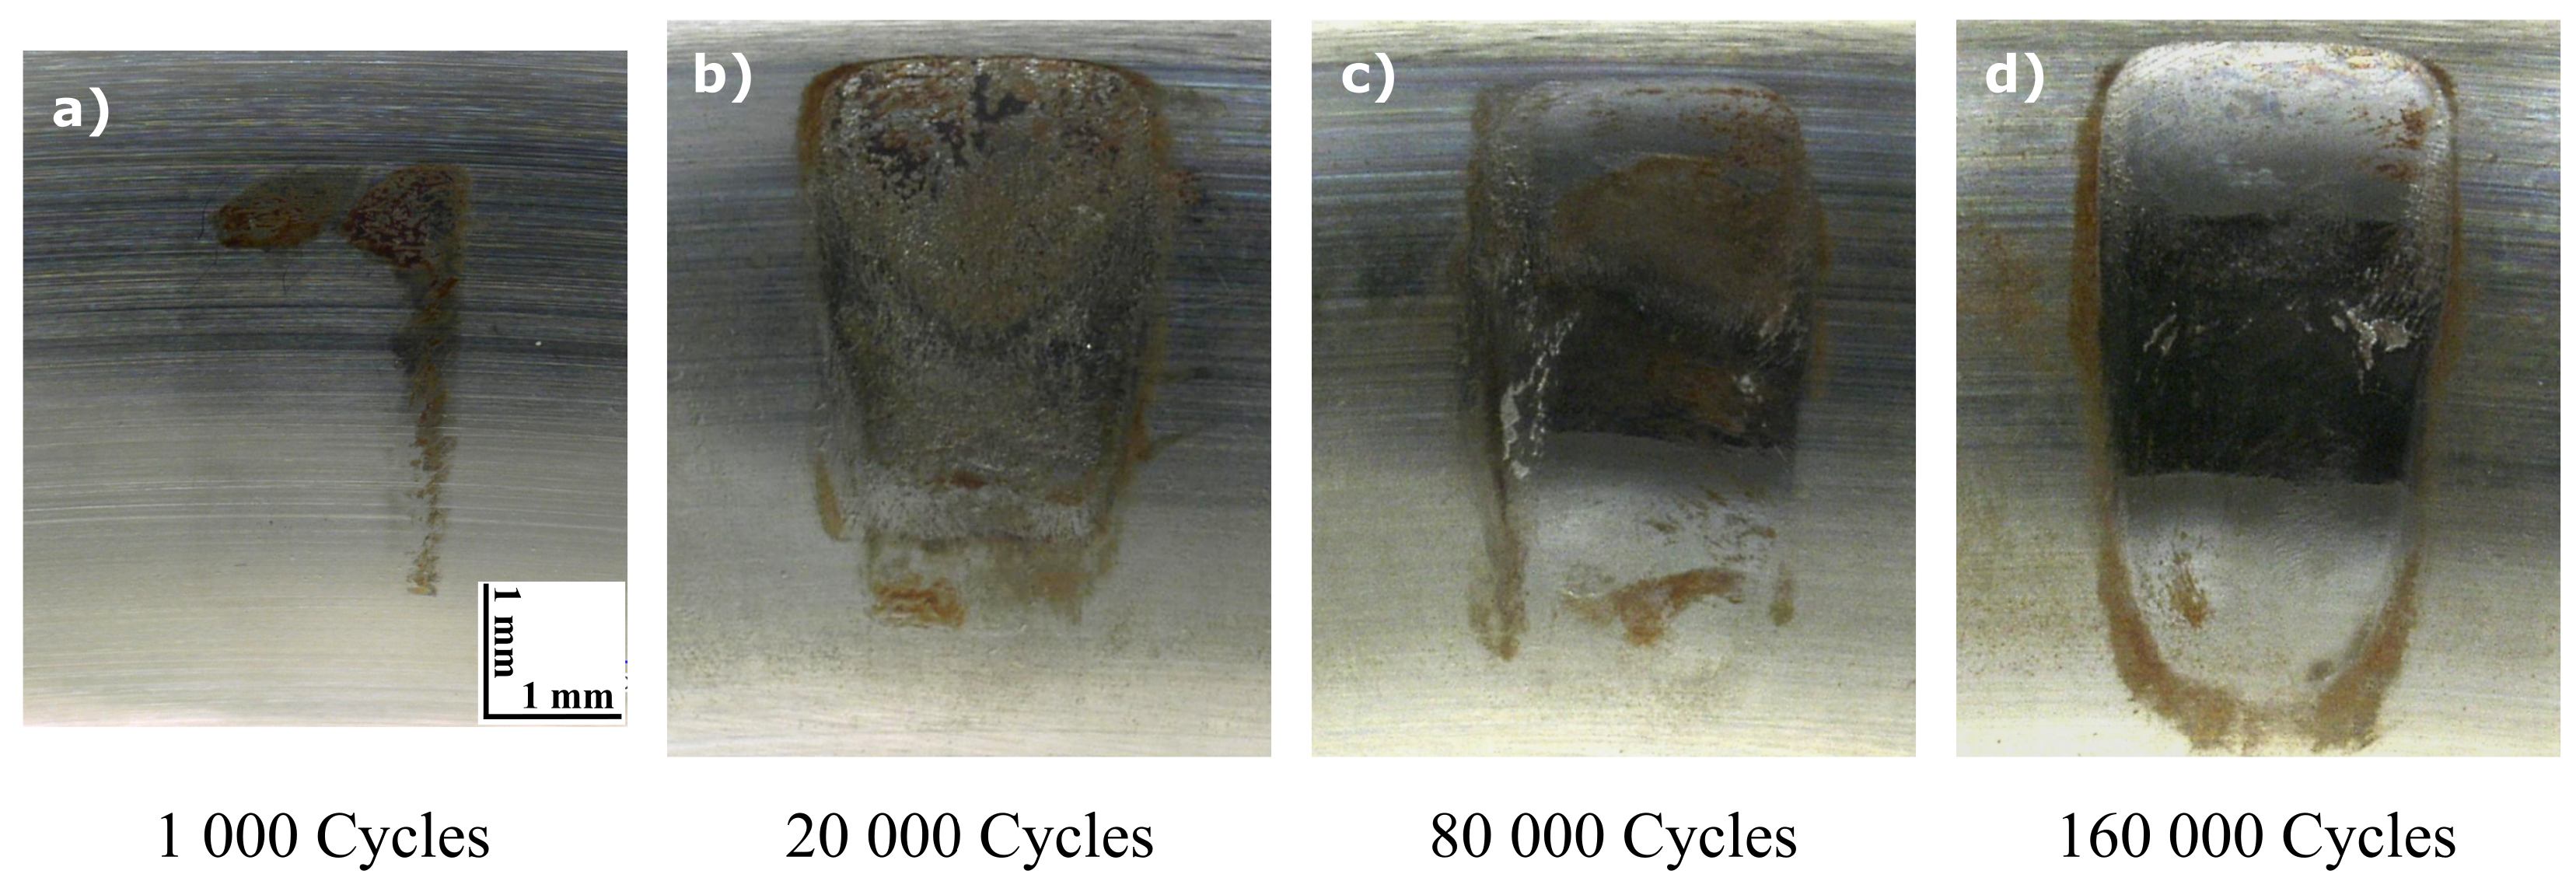
Figure 6.
Representation of the measured wear volumes of the individual damage marks on the raceway of the inner ring (green) and the raceway of the outer ring (blue).
Figure 6.
Representation of the measured wear volumes of the individual damage marks on the raceway of the inner ring (green) and the raceway of the outer ring (blue).
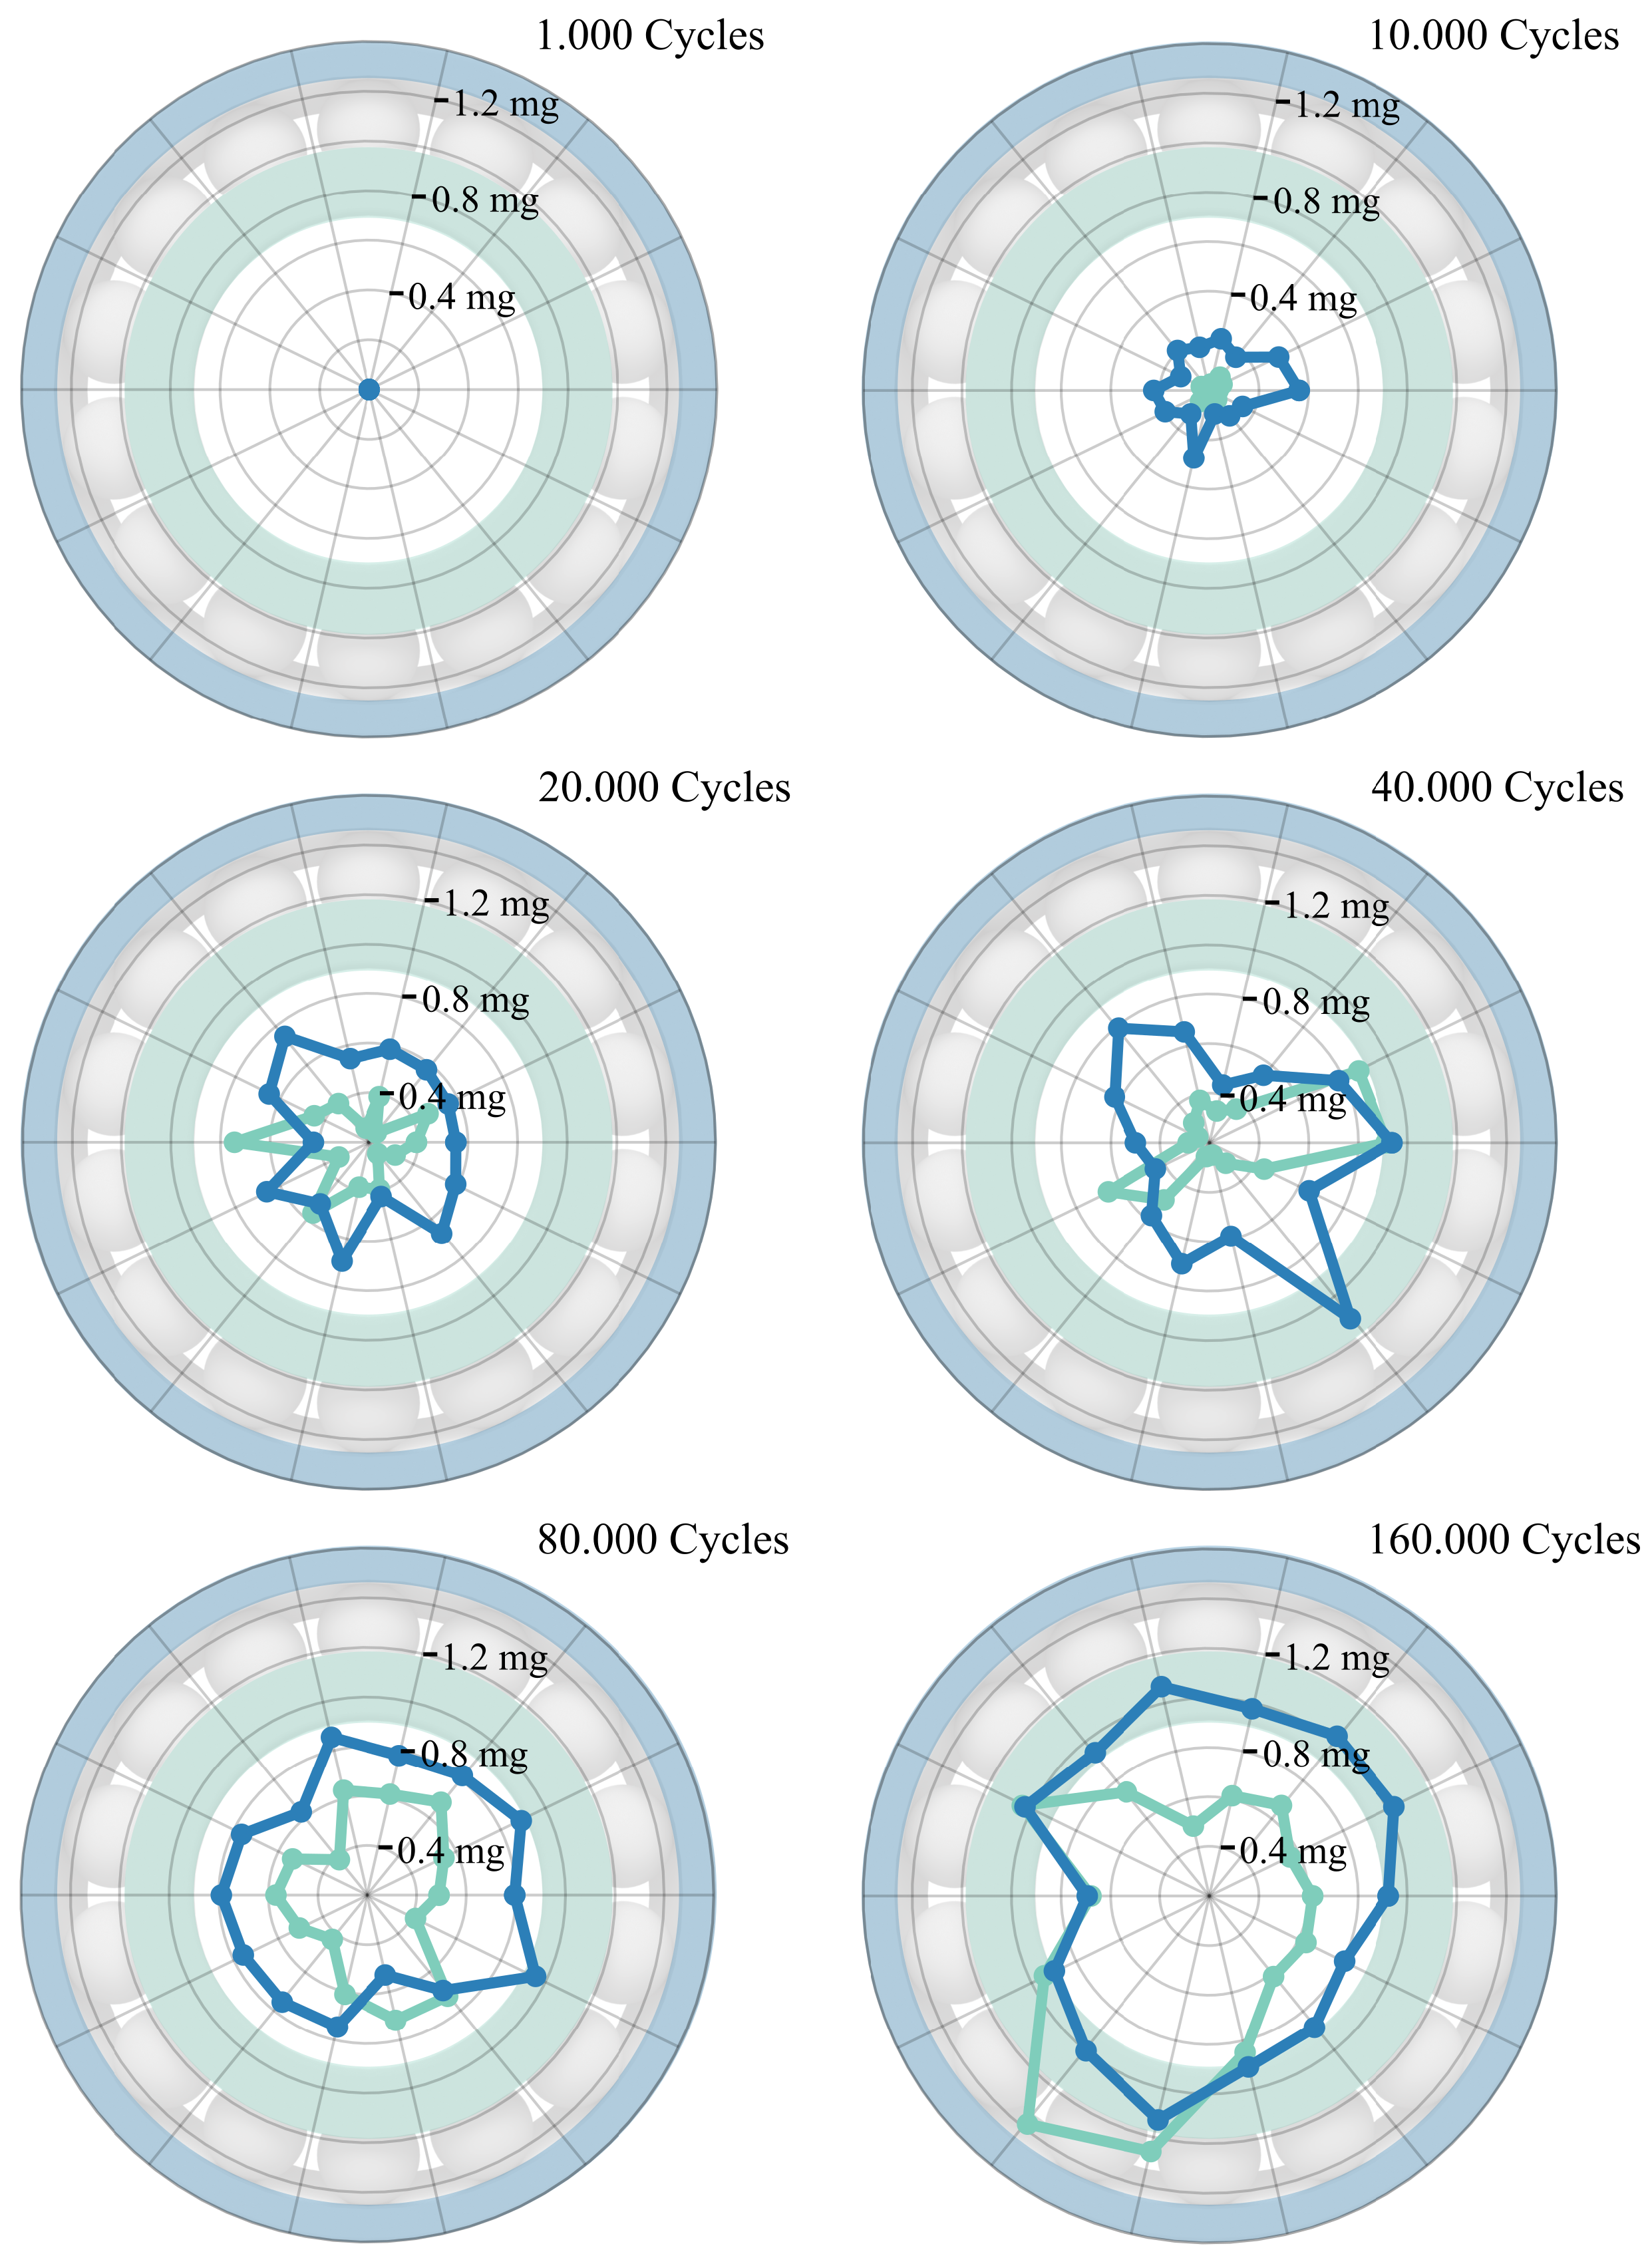
Figure 7.
Box plot of the mass loss per contact area on the raceway against the number of oscillation cycles. The turquoise boxes represent the results for the inner raceway, the dark blue boxes for the outer raceway.
Figure 7.
Box plot of the mass loss per contact area on the raceway against the number of oscillation cycles. The turquoise boxes represent the results for the inner raceway, the dark blue boxes for the outer raceway.
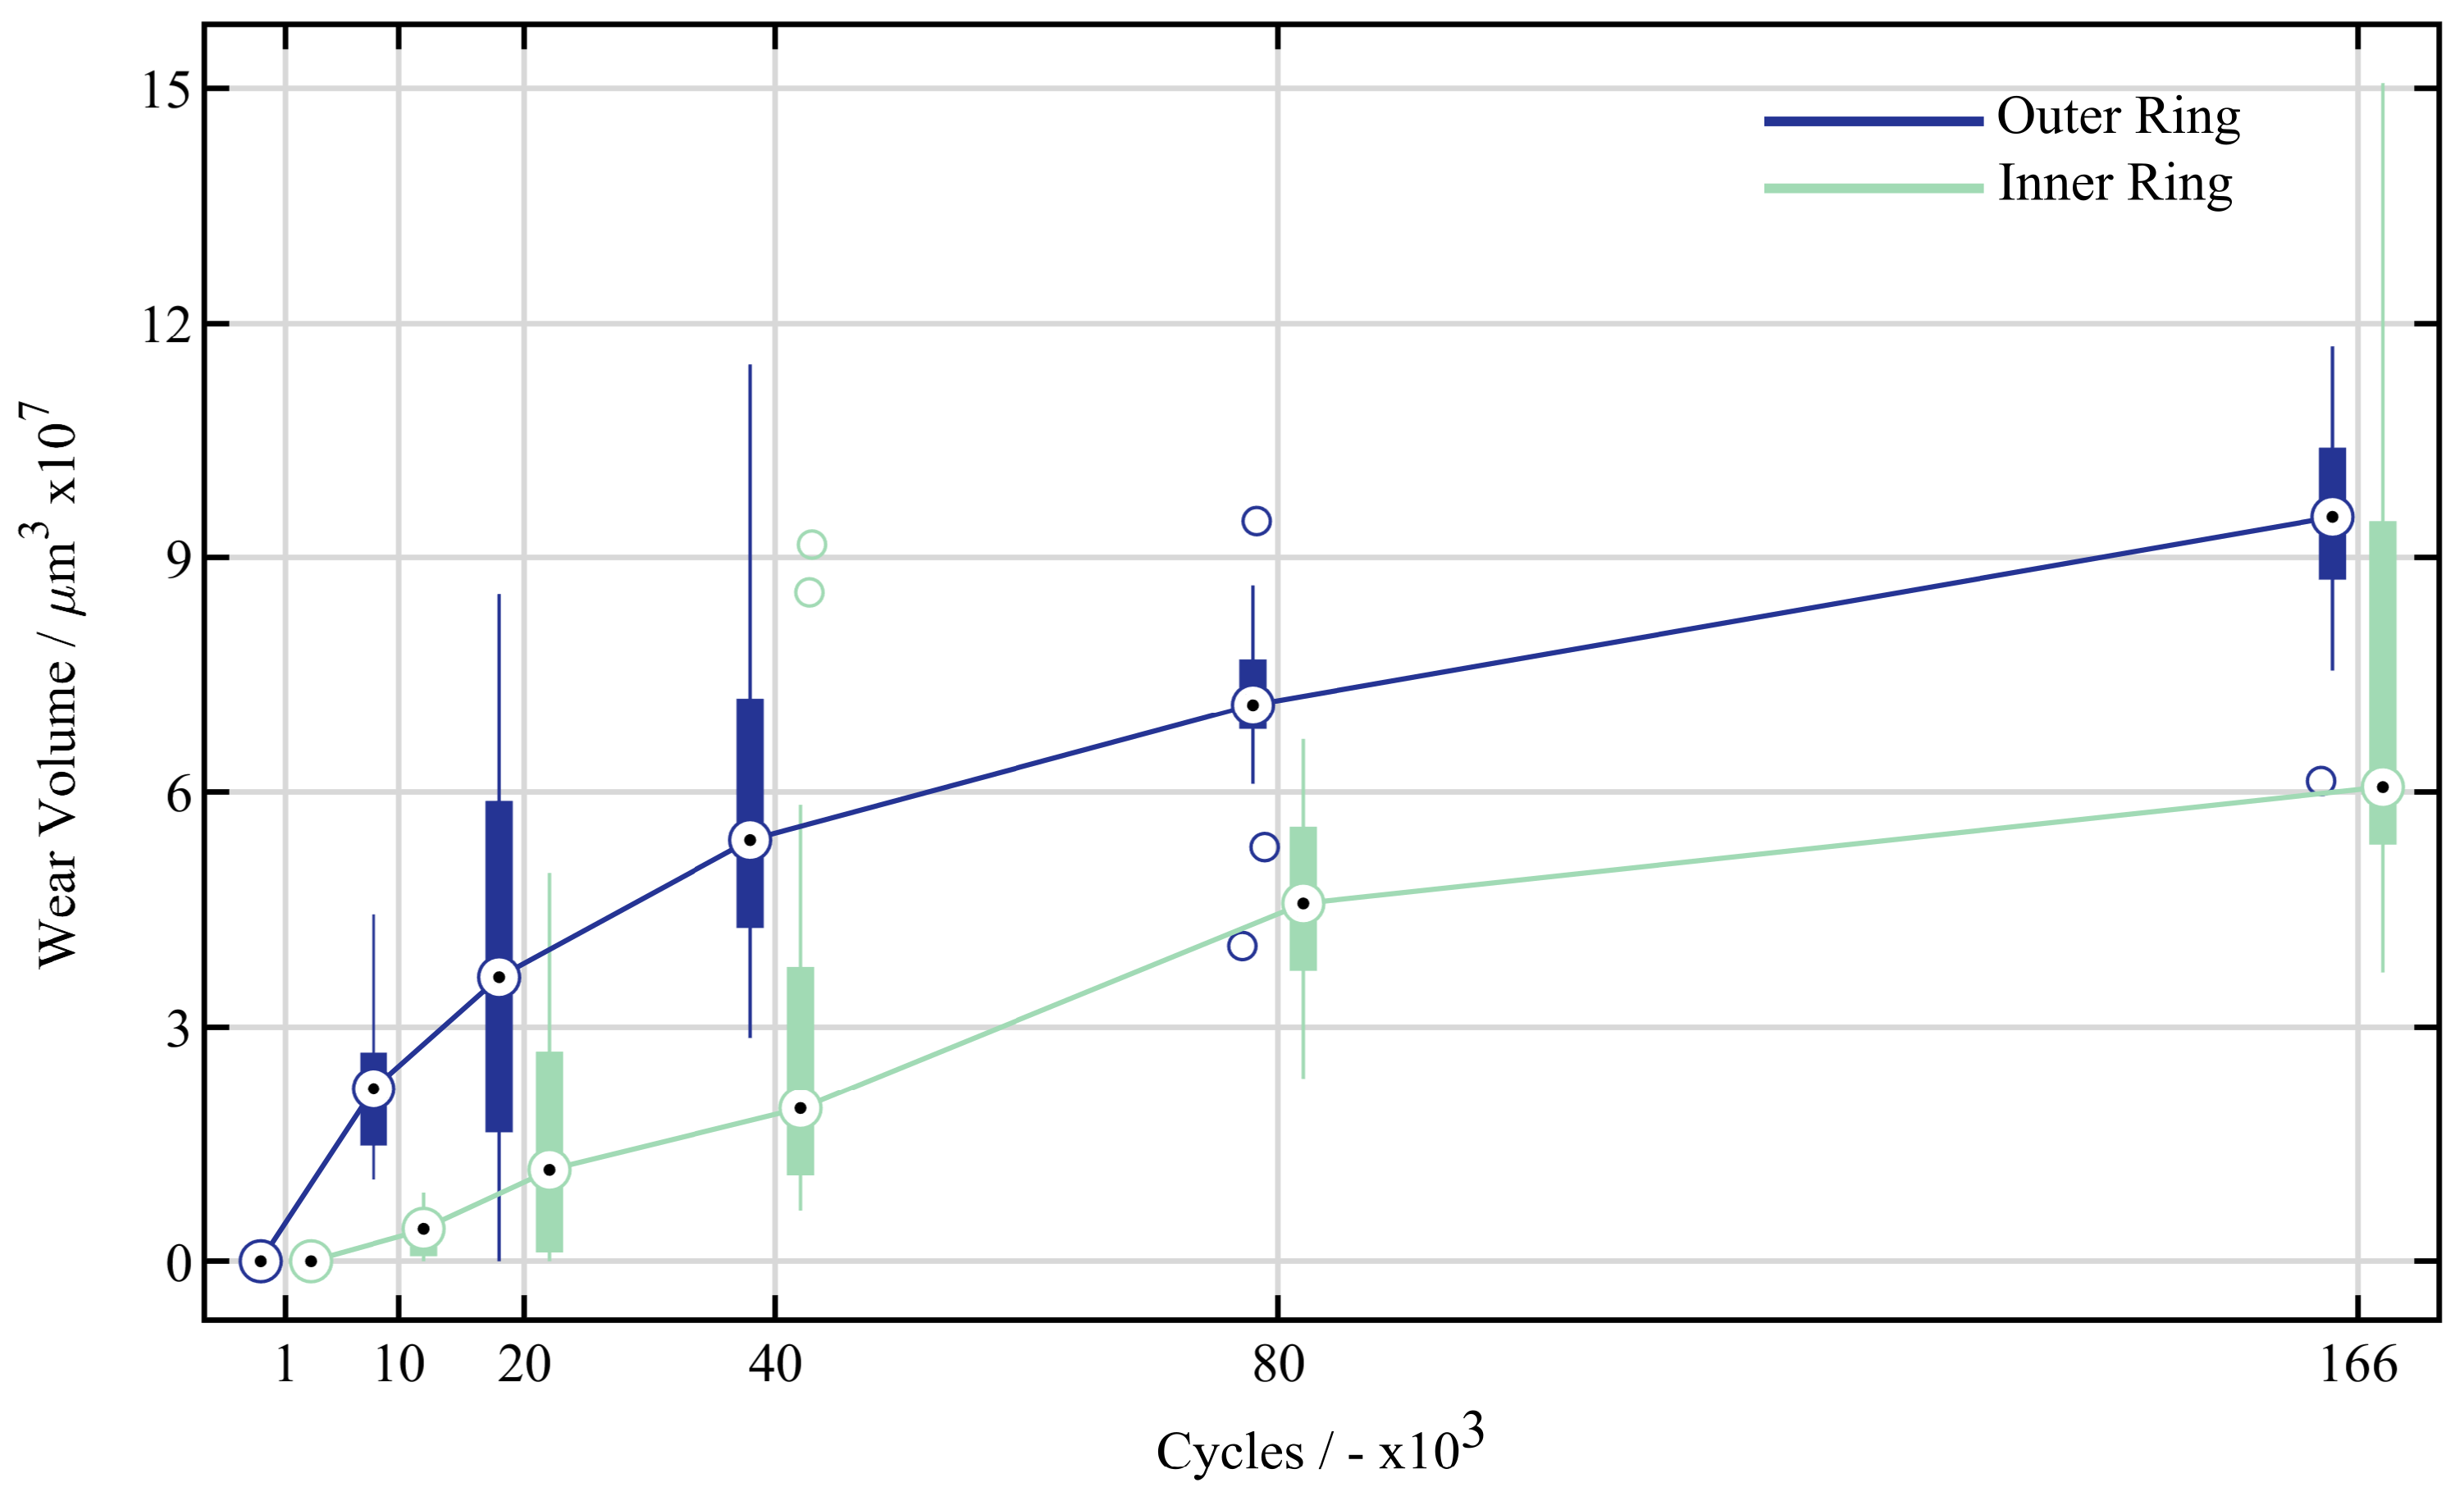
Figure 8.
Course of the maximum torque per oscillation cycle (black), the accumulated dissipated energy (green) and the linearly interpolated wear volume (blue) over the number of cycles.
Figure 8.
Course of the maximum torque per oscillation cycle (black), the accumulated dissipated energy (green) and the linearly interpolated wear volume (blue) over the number of cycles.
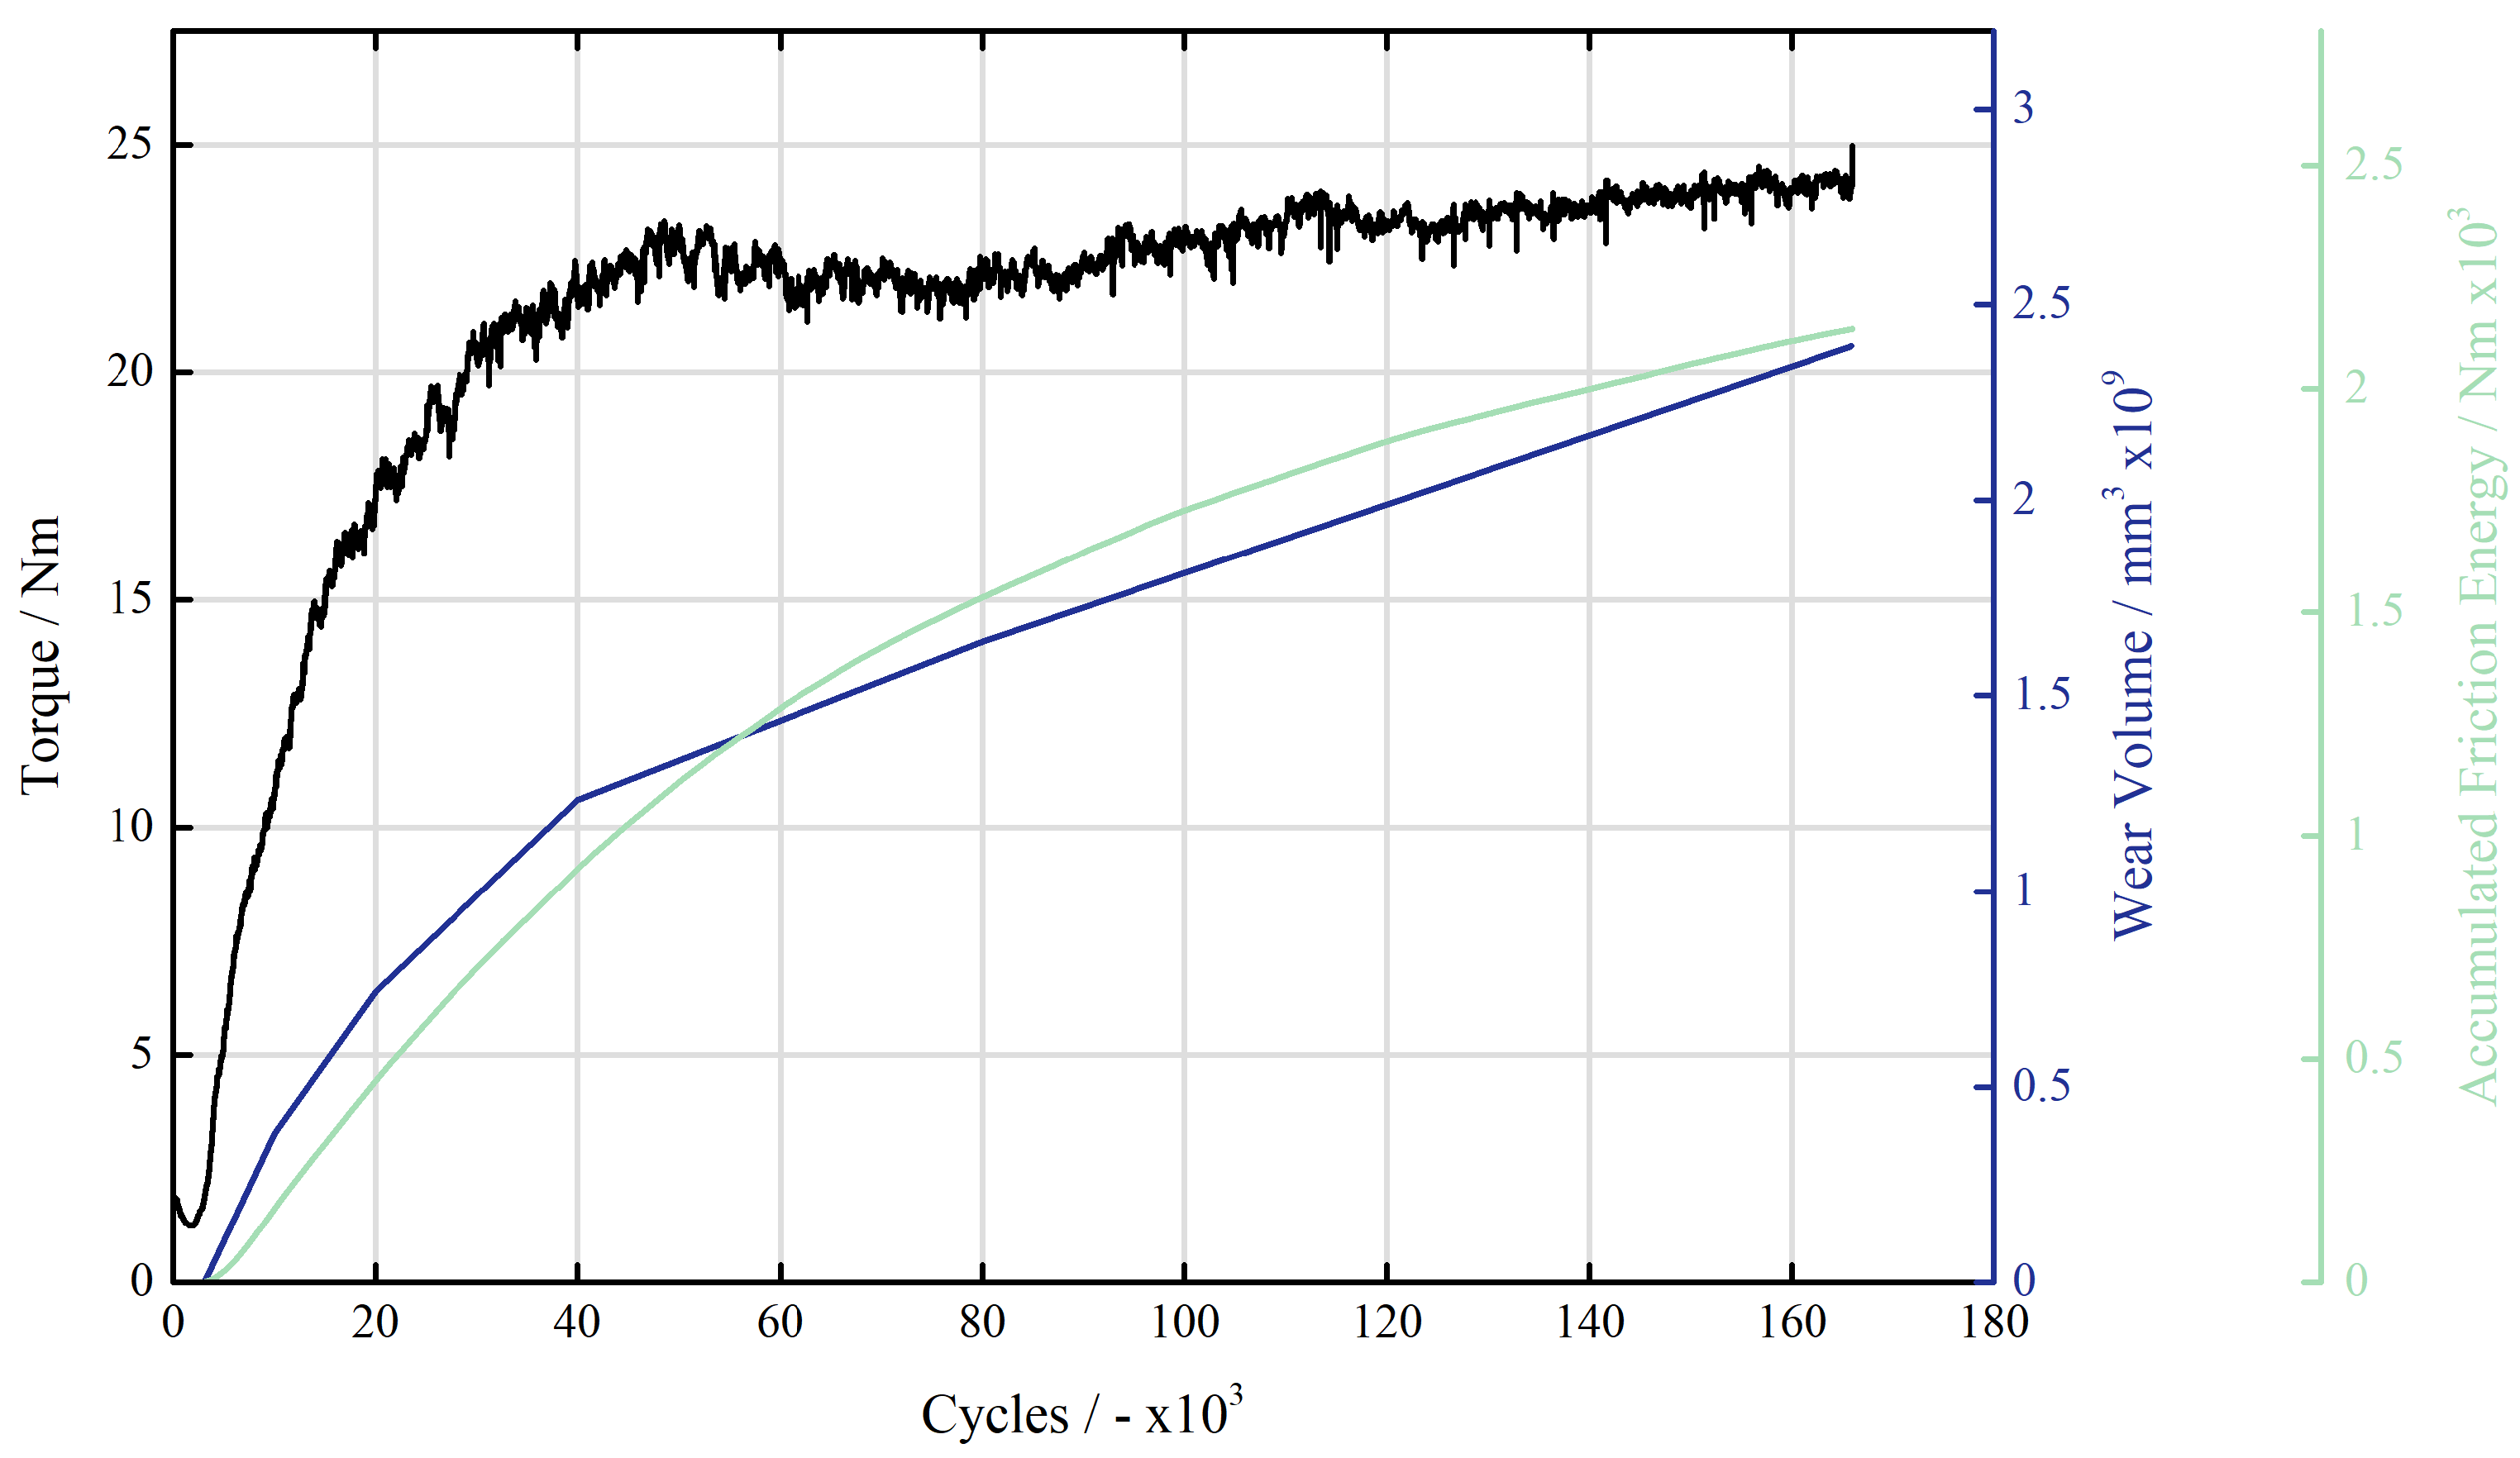
Figure 9.
Plot of torque curves versus oscillation angle for selected oscillation cycles during the test.
Figure 9.
Plot of torque curves versus oscillation angle for selected oscillation cycles during the test.
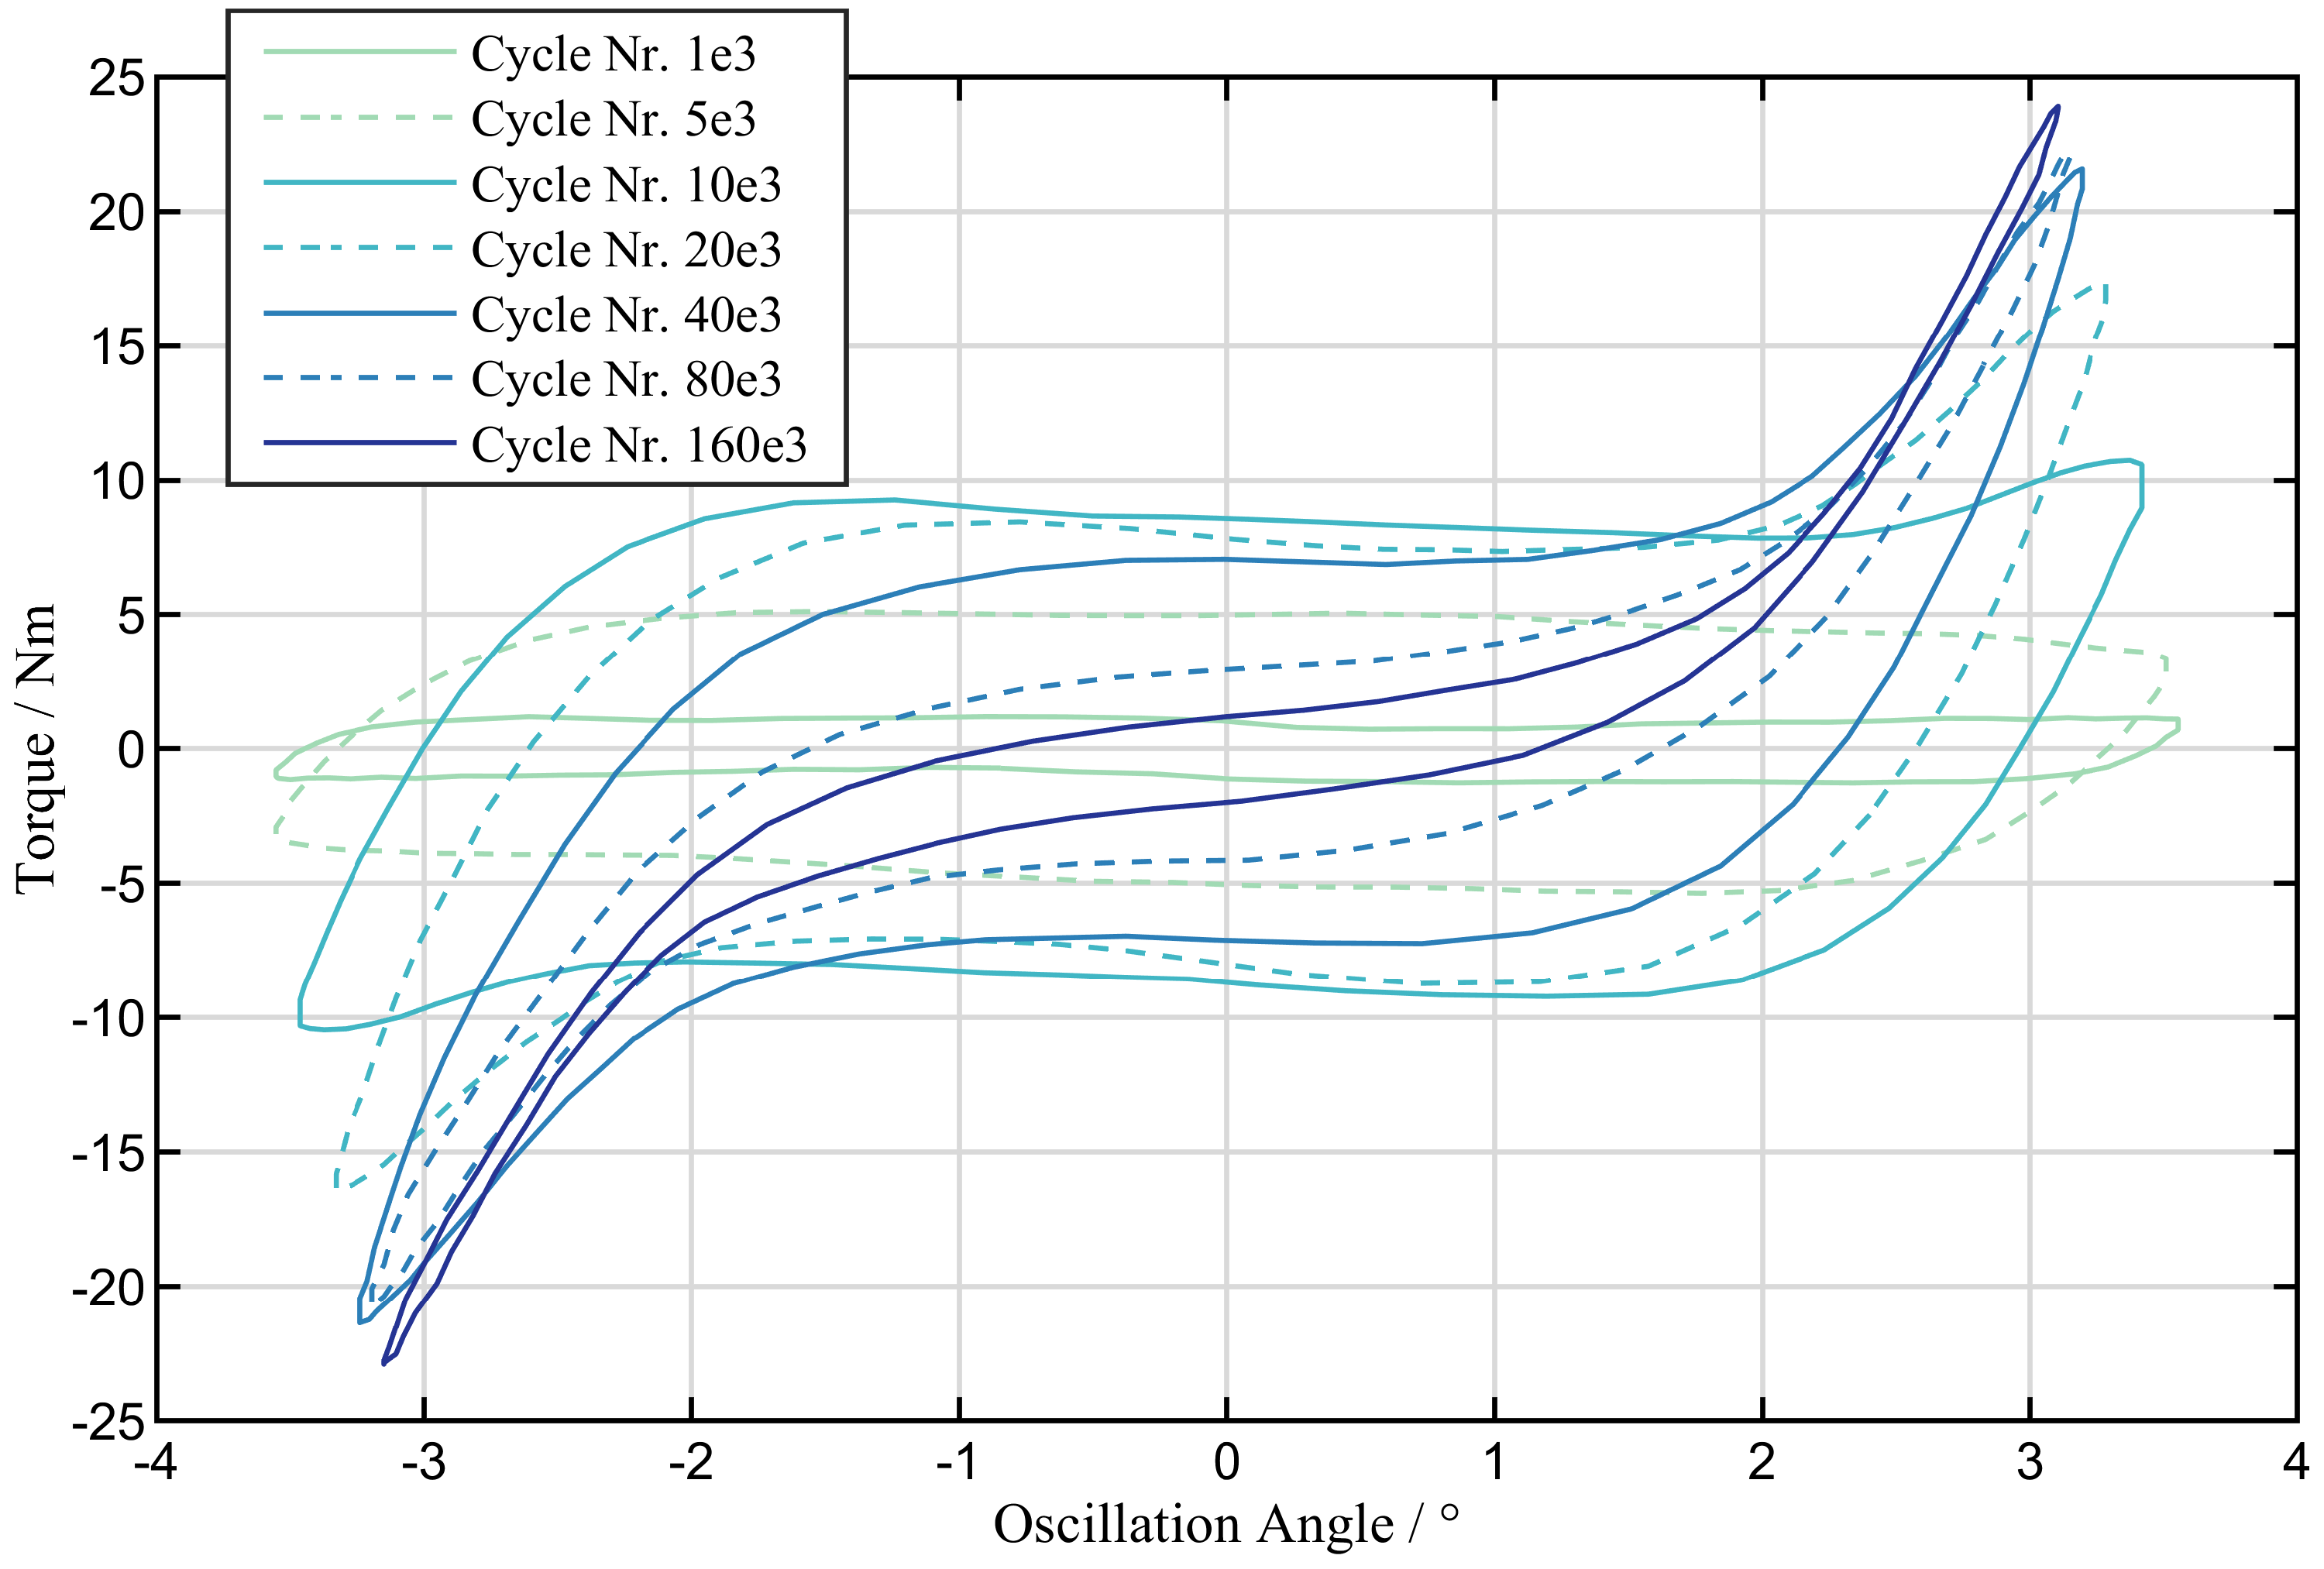
Figure 10.
Representation of the energy wear factor determined here above the number of cycles (blue). *Energy wear factor for an Alumina/SC652 contact in the oscillating ball-disk test under pure sliding found in [22]. ** Energy wear factor for an Alumina/DC1 contact in the oscillating ball-on-disc test with pure sliding found in [22].
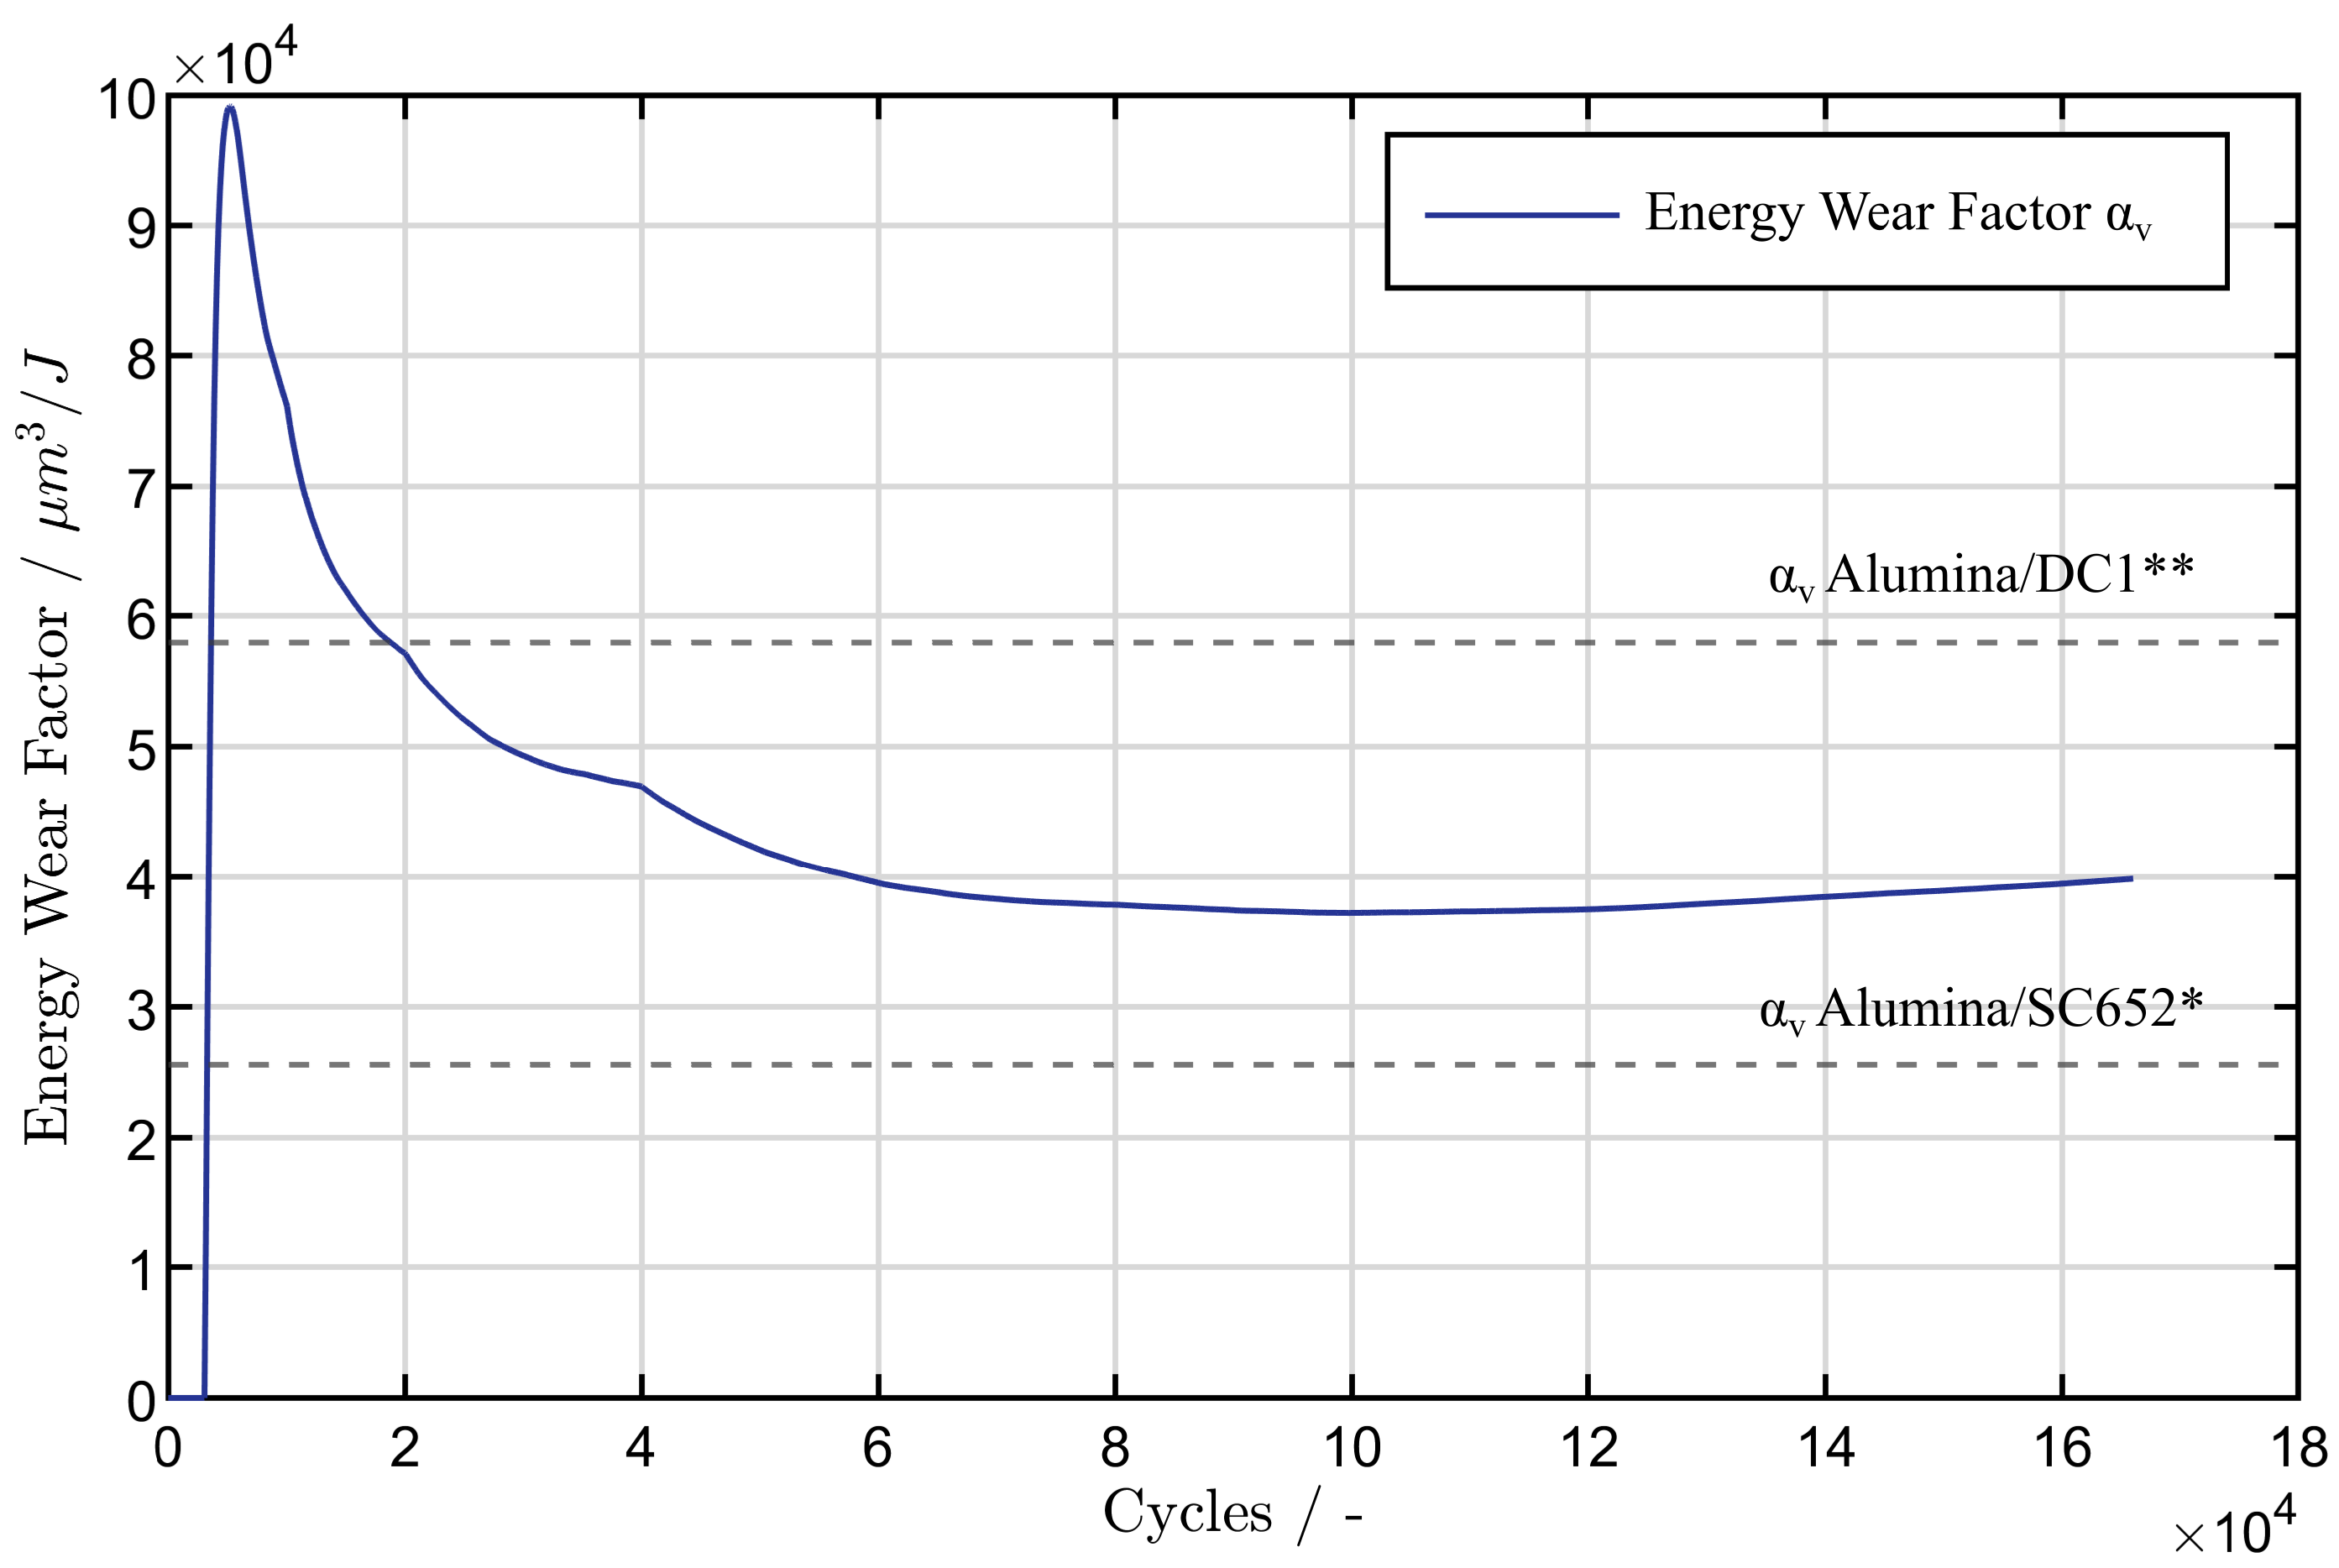
Figure 11.
Sectional images of wear damage marks of type 7220 bearings for different oscillation numbers in ascending order (top-bottom)
Figure 11.
Sectional images of wear damage marks of type 7220 bearings for different oscillation numbers in ascending order (top-bottom)
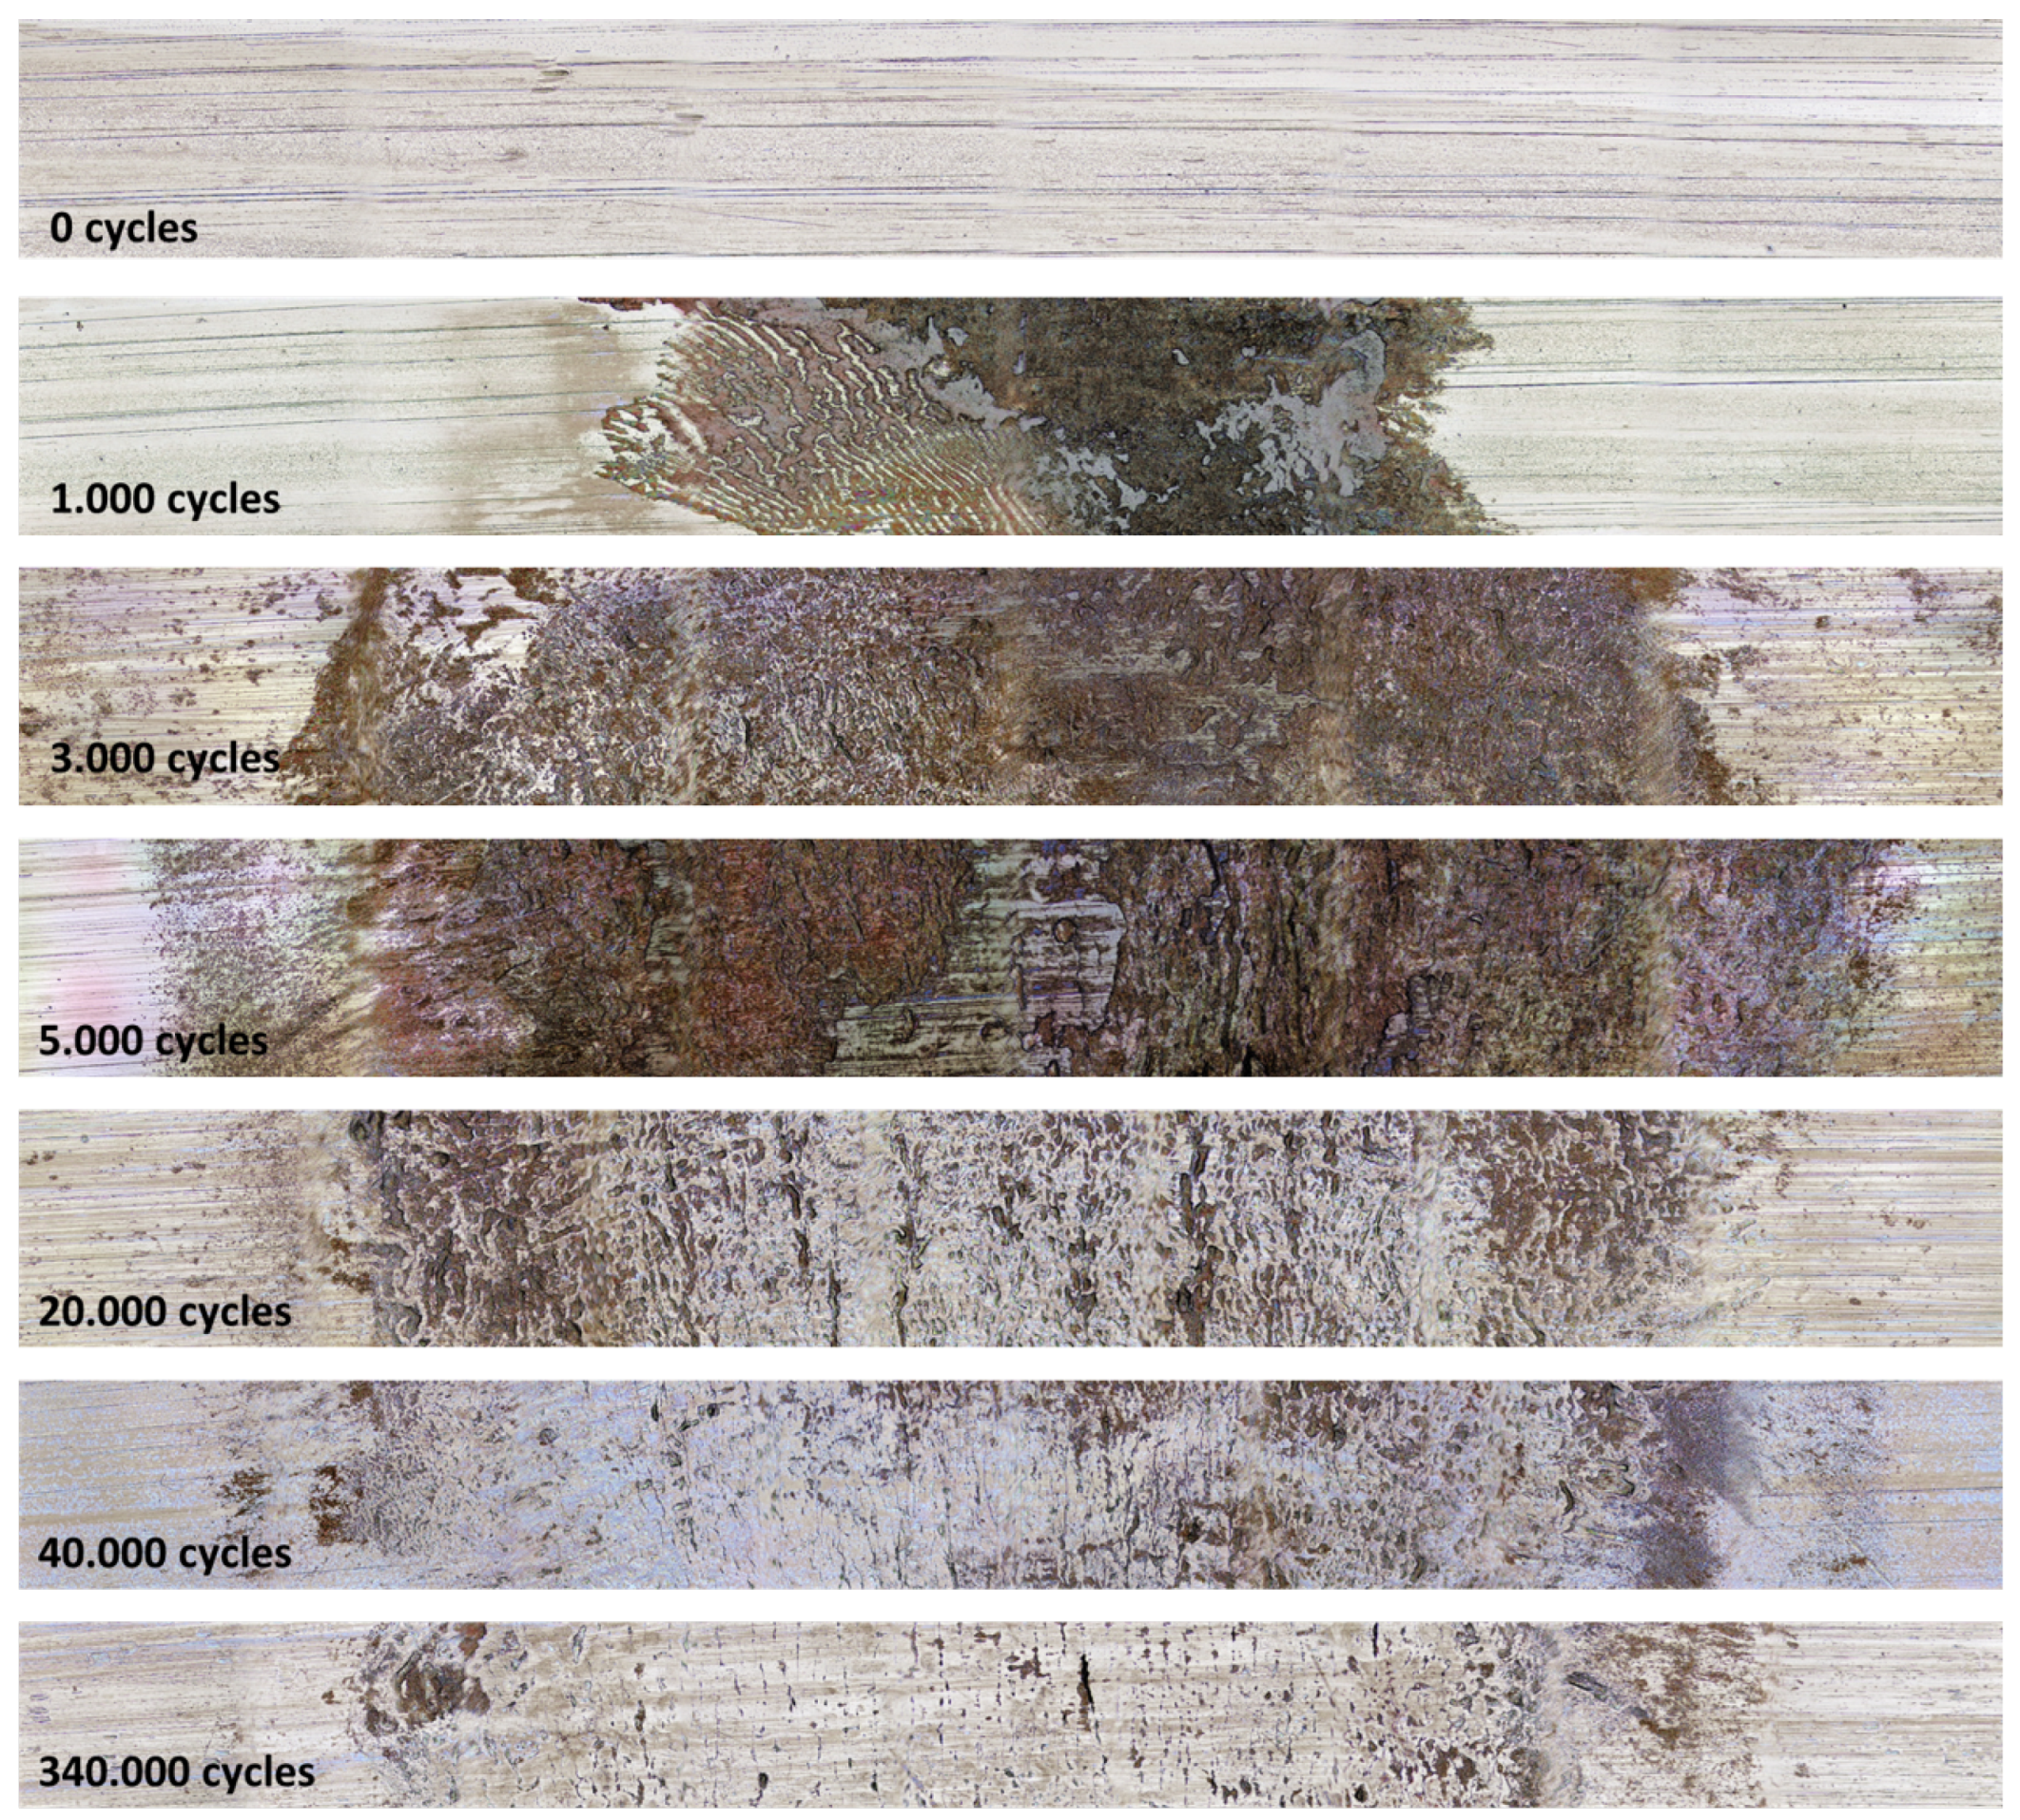
Figure 12.
Mean value of wear volume per wear mark section for different numbers of oscillation cycles
Figure 12.
Mean value of wear volume per wear mark section for different numbers of oscillation cycles
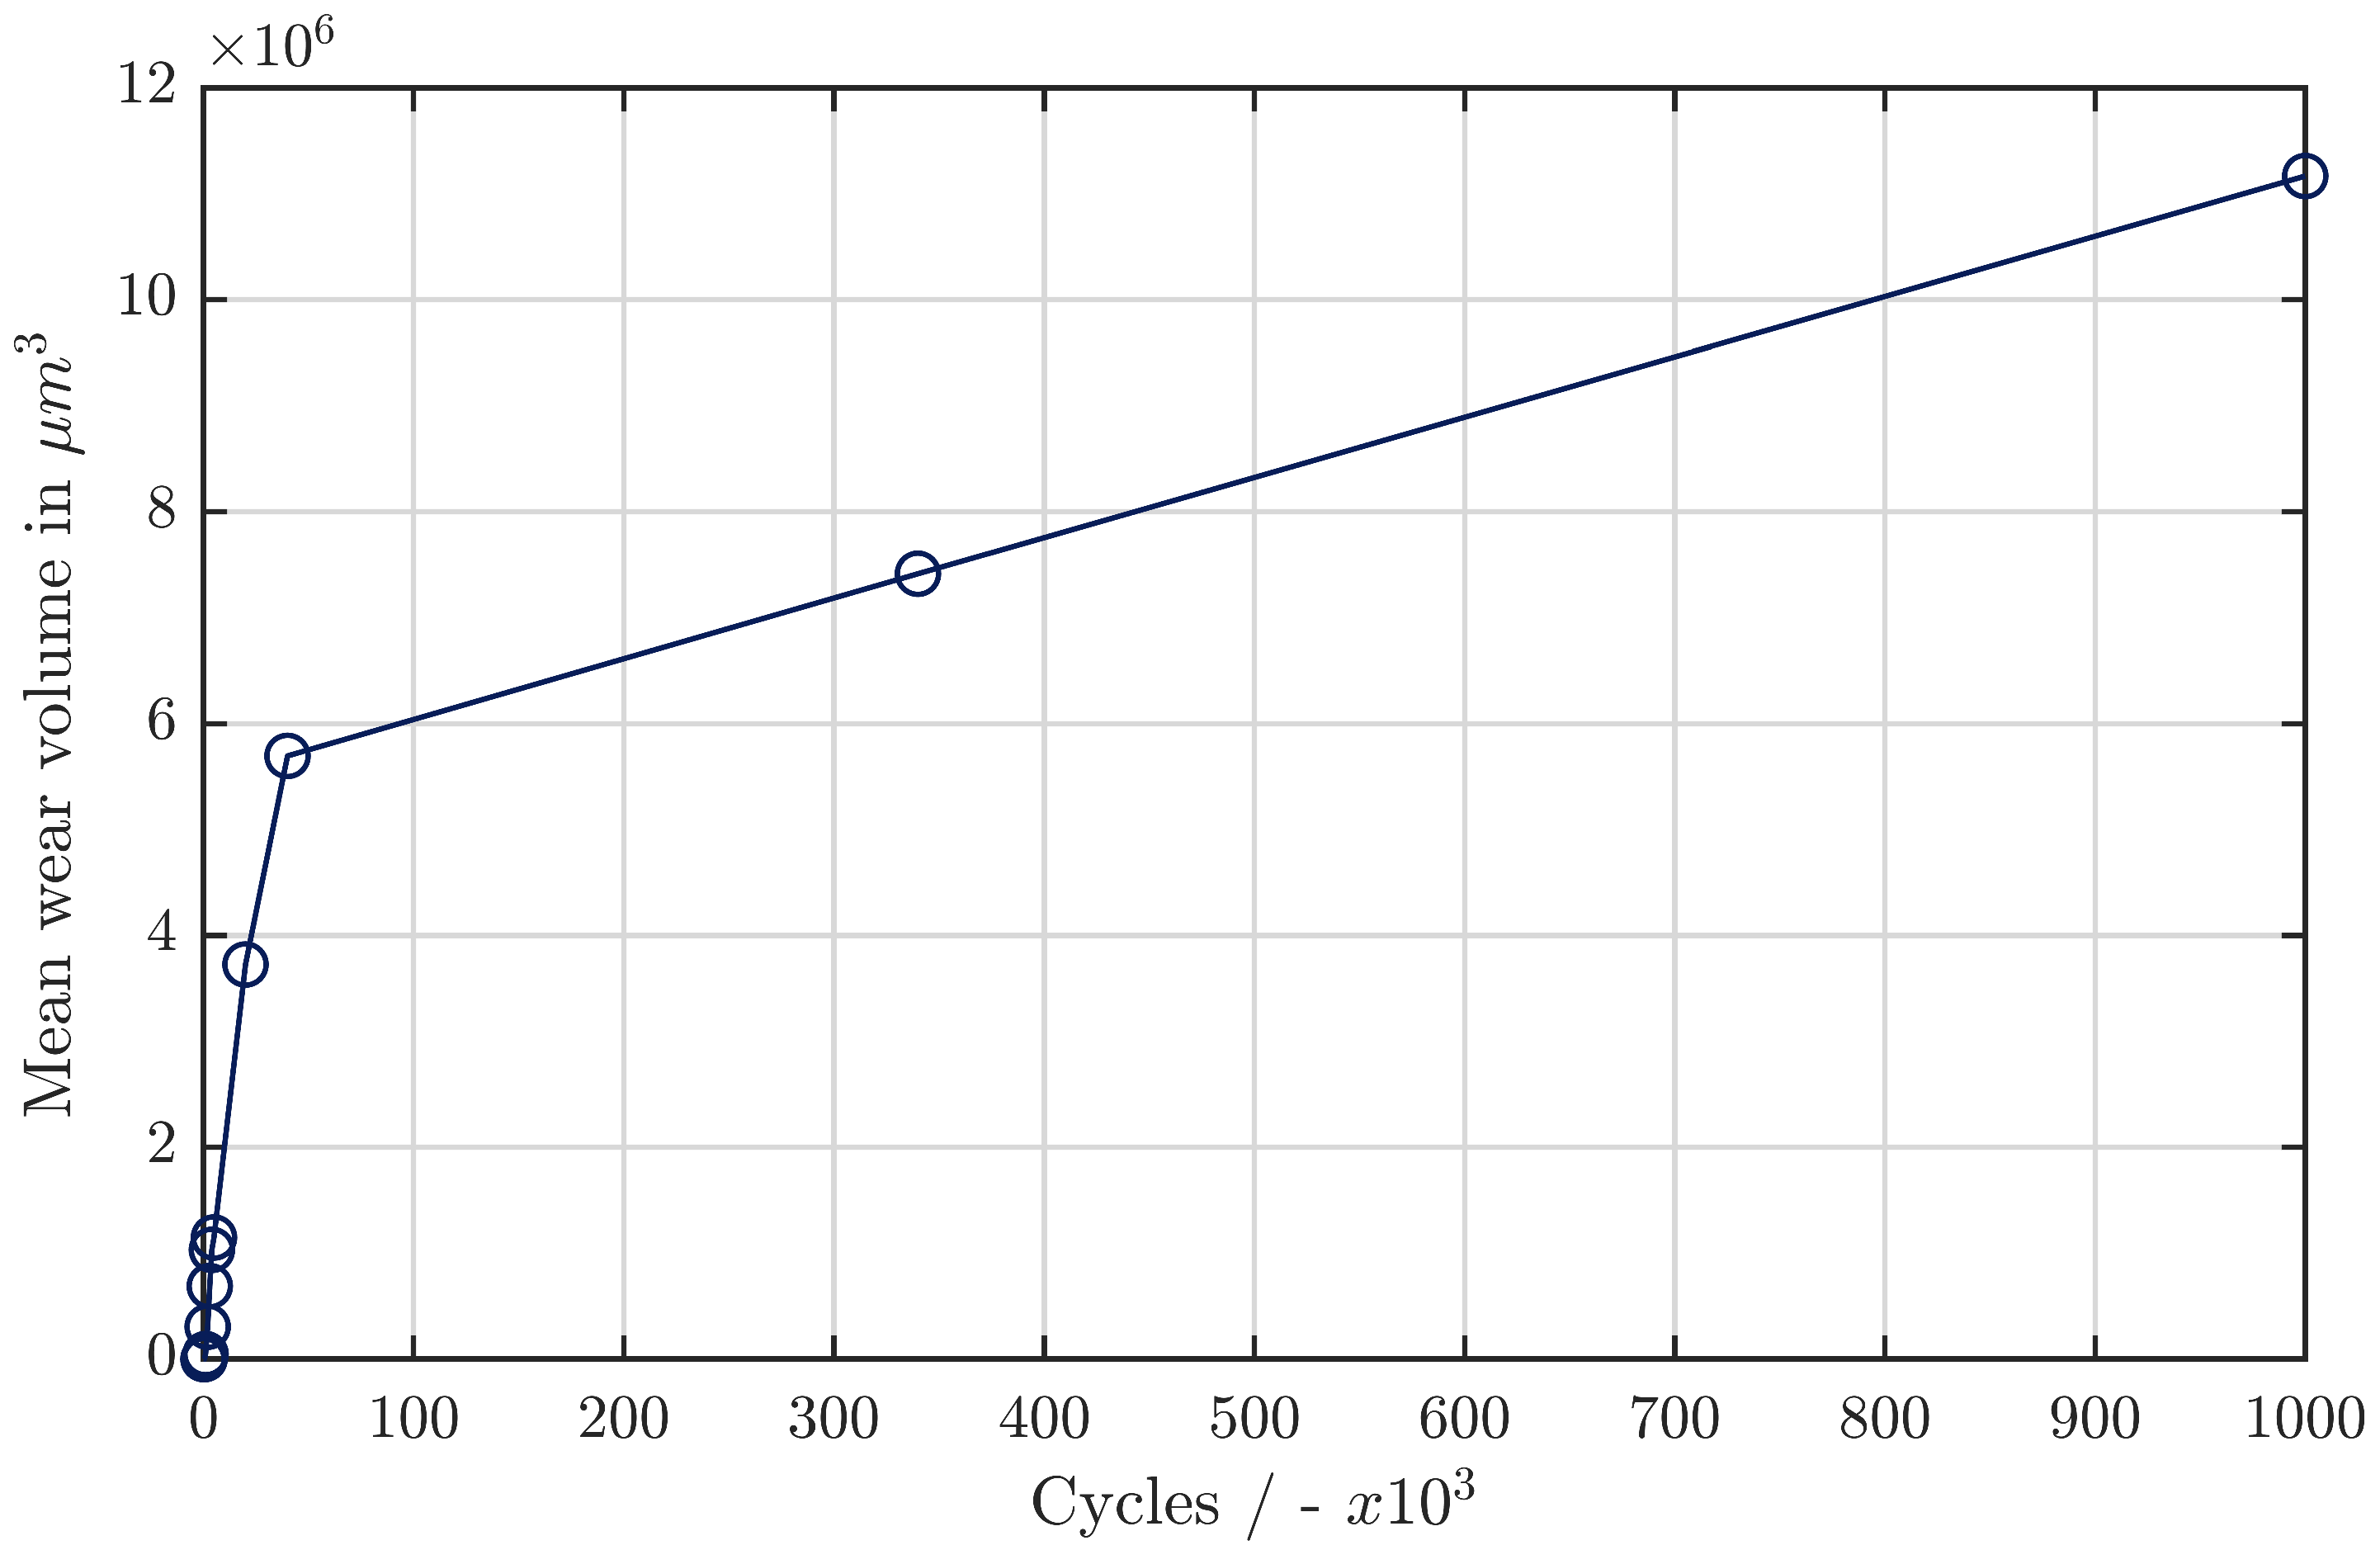
Figure 13.
Peak of torque signal and interpolated and scaled wear volume of one wear mark for each oscillation cycle during a test with 40 k cycles
Figure 13.
Peak of torque signal and interpolated and scaled wear volume of one wear mark for each oscillation cycle during a test with 40 k cycles
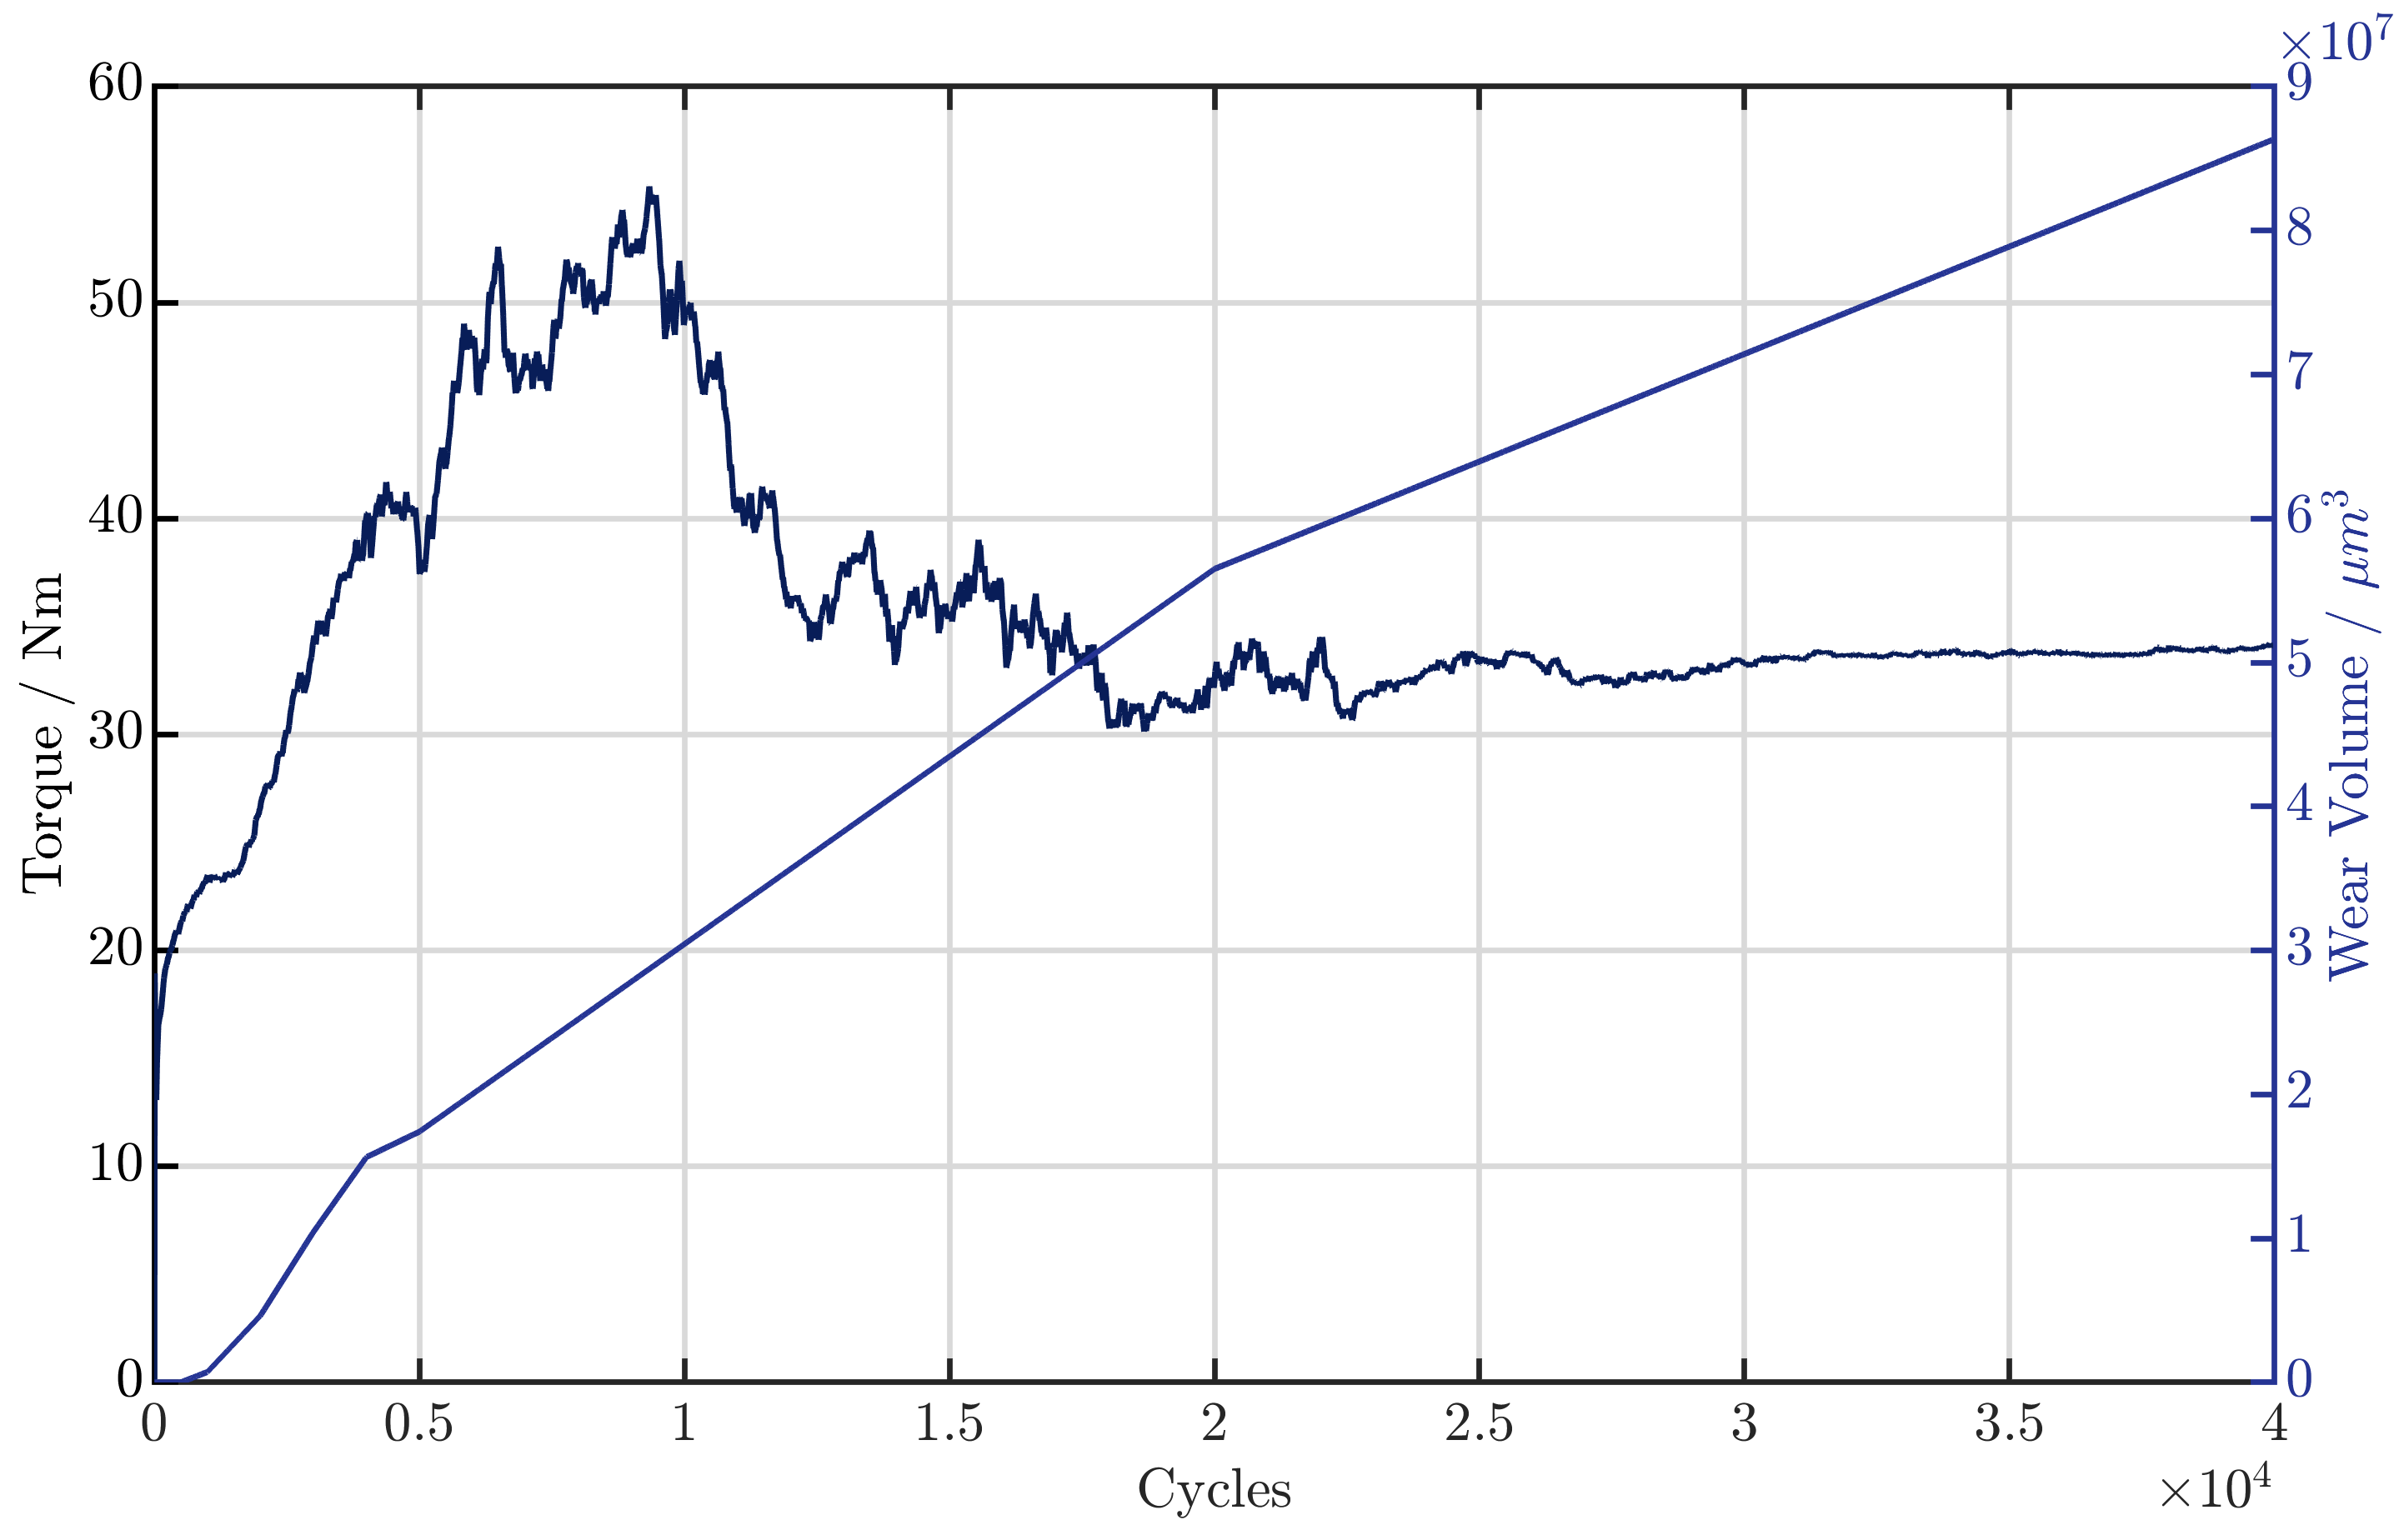
Figure 14.
Peak of torque signal for the first 2000 cycles
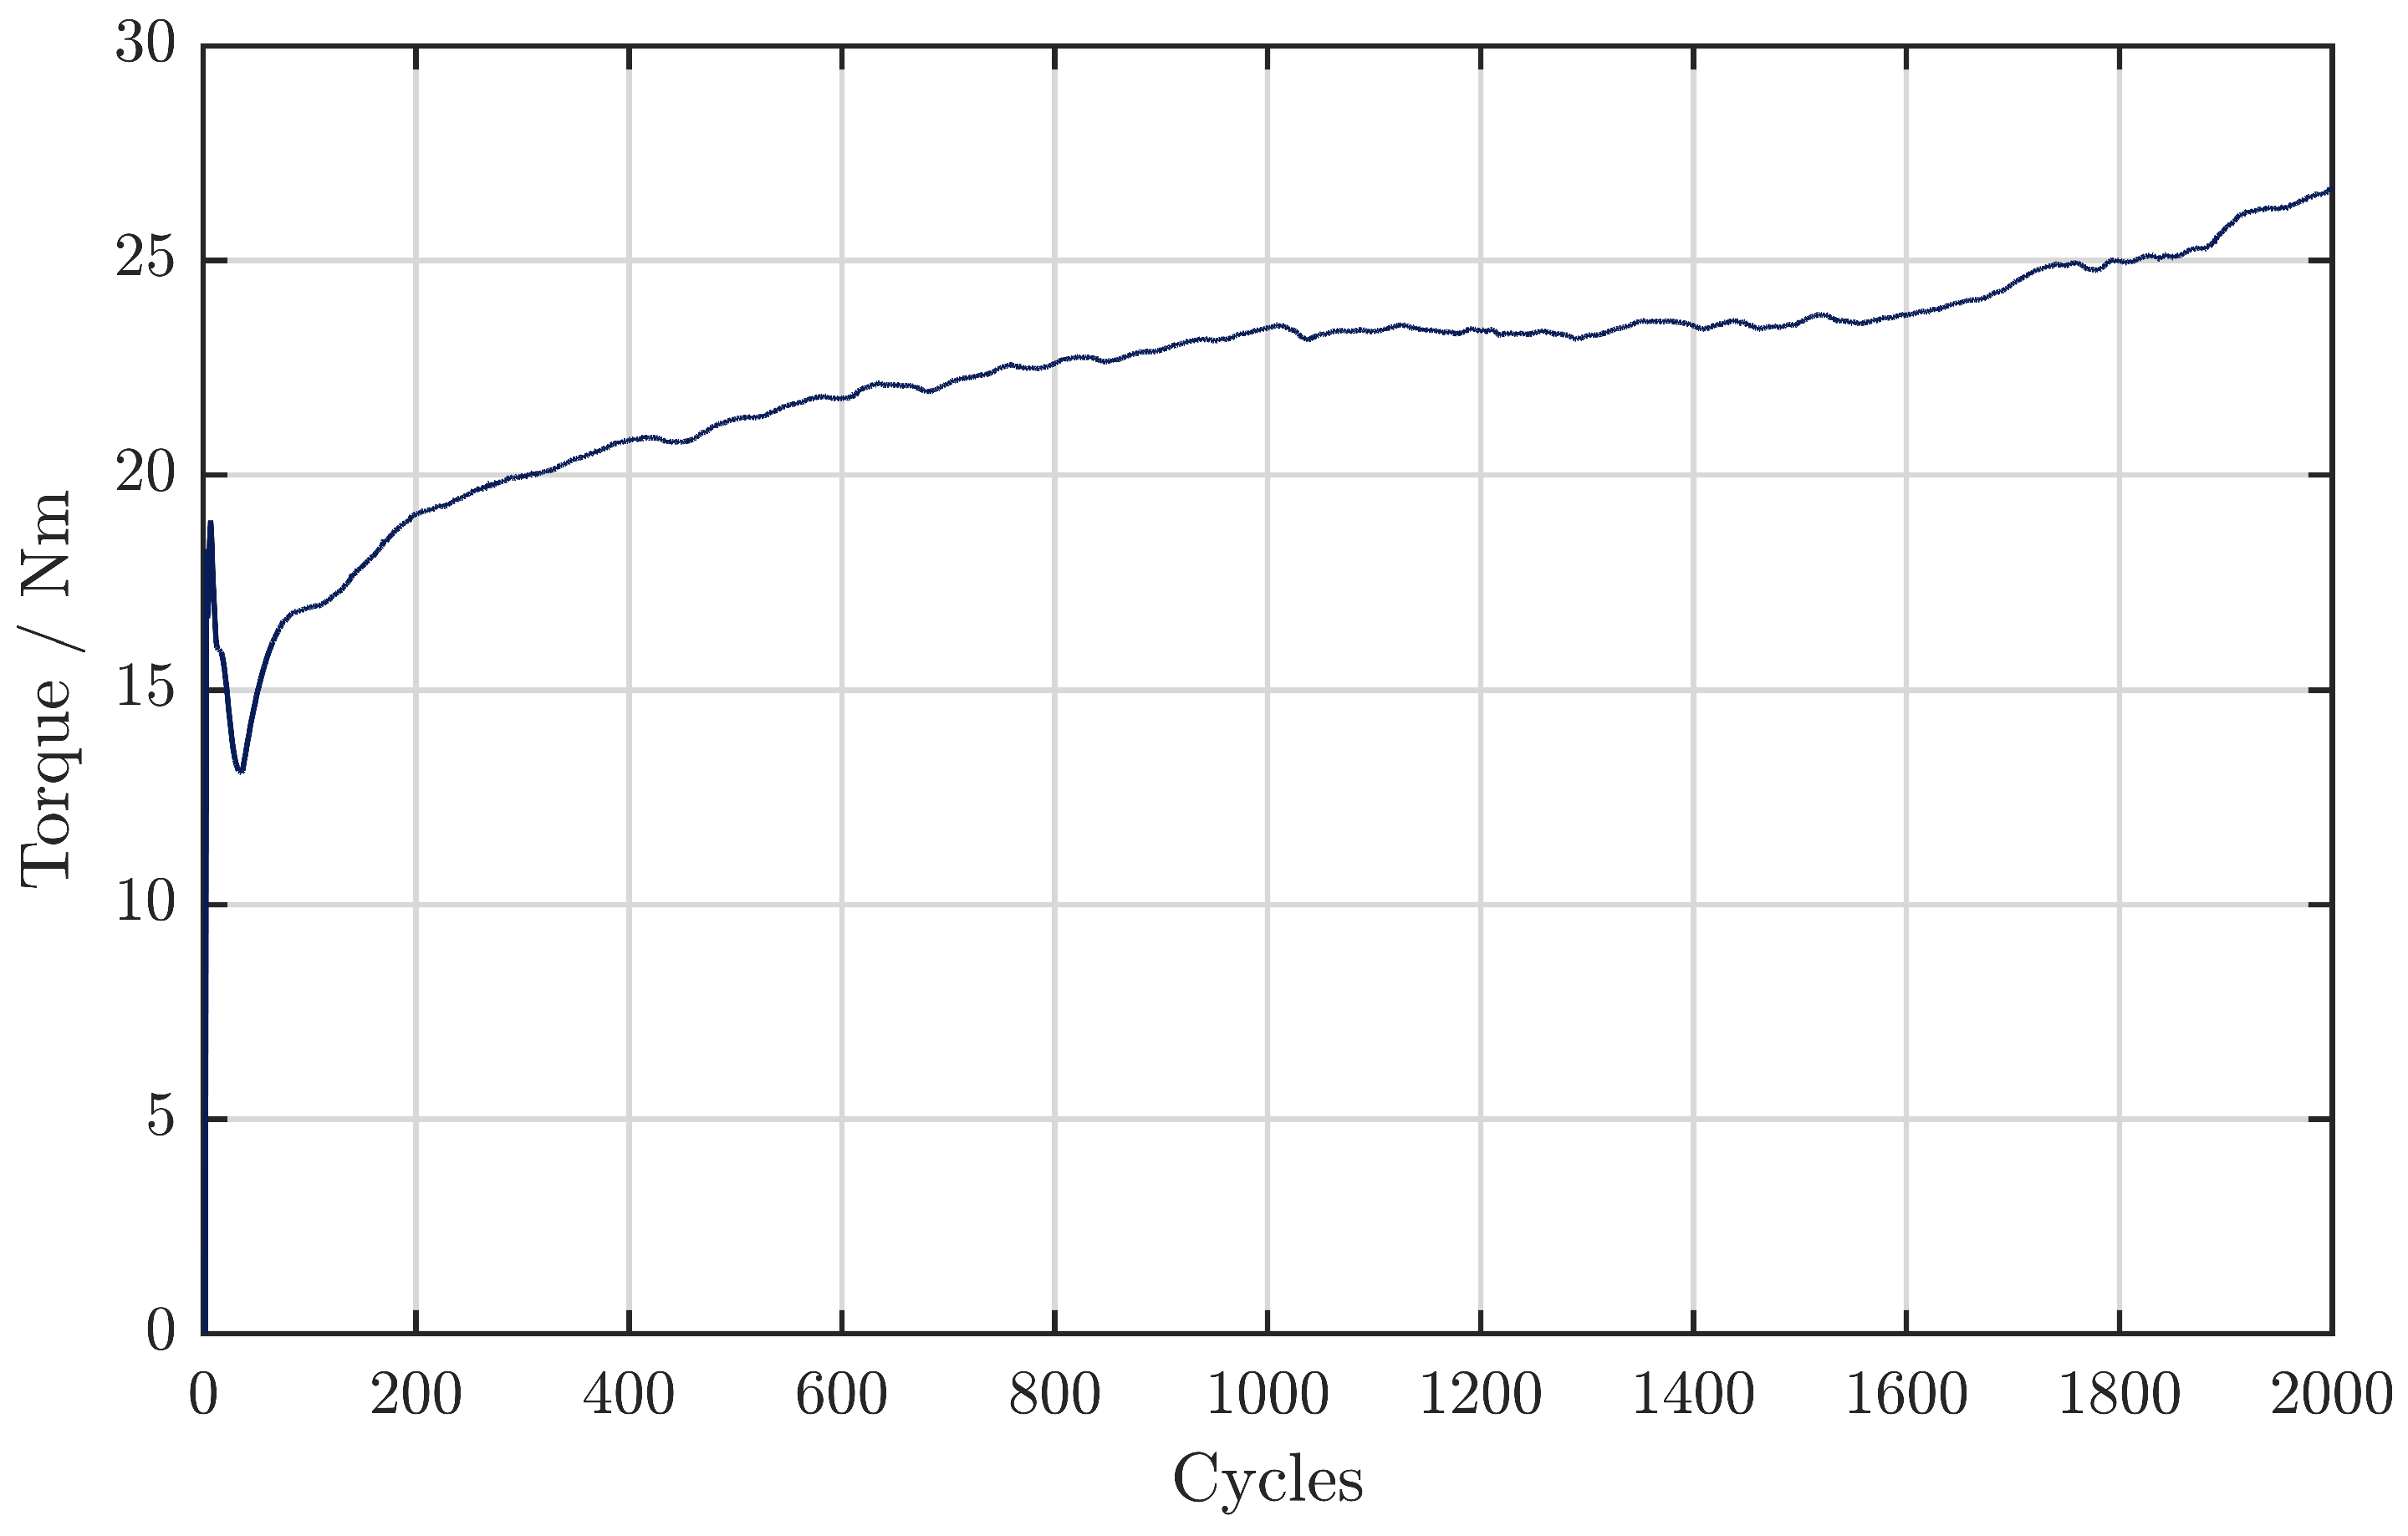
Figure 15.
Torque curves versus oscillation angle plotted at different numbers of cycles during a test with a total of 40 k cycles
Figure 15.
Torque curves versus oscillation angle plotted at different numbers of cycles during a test with a total of 40 k cycles
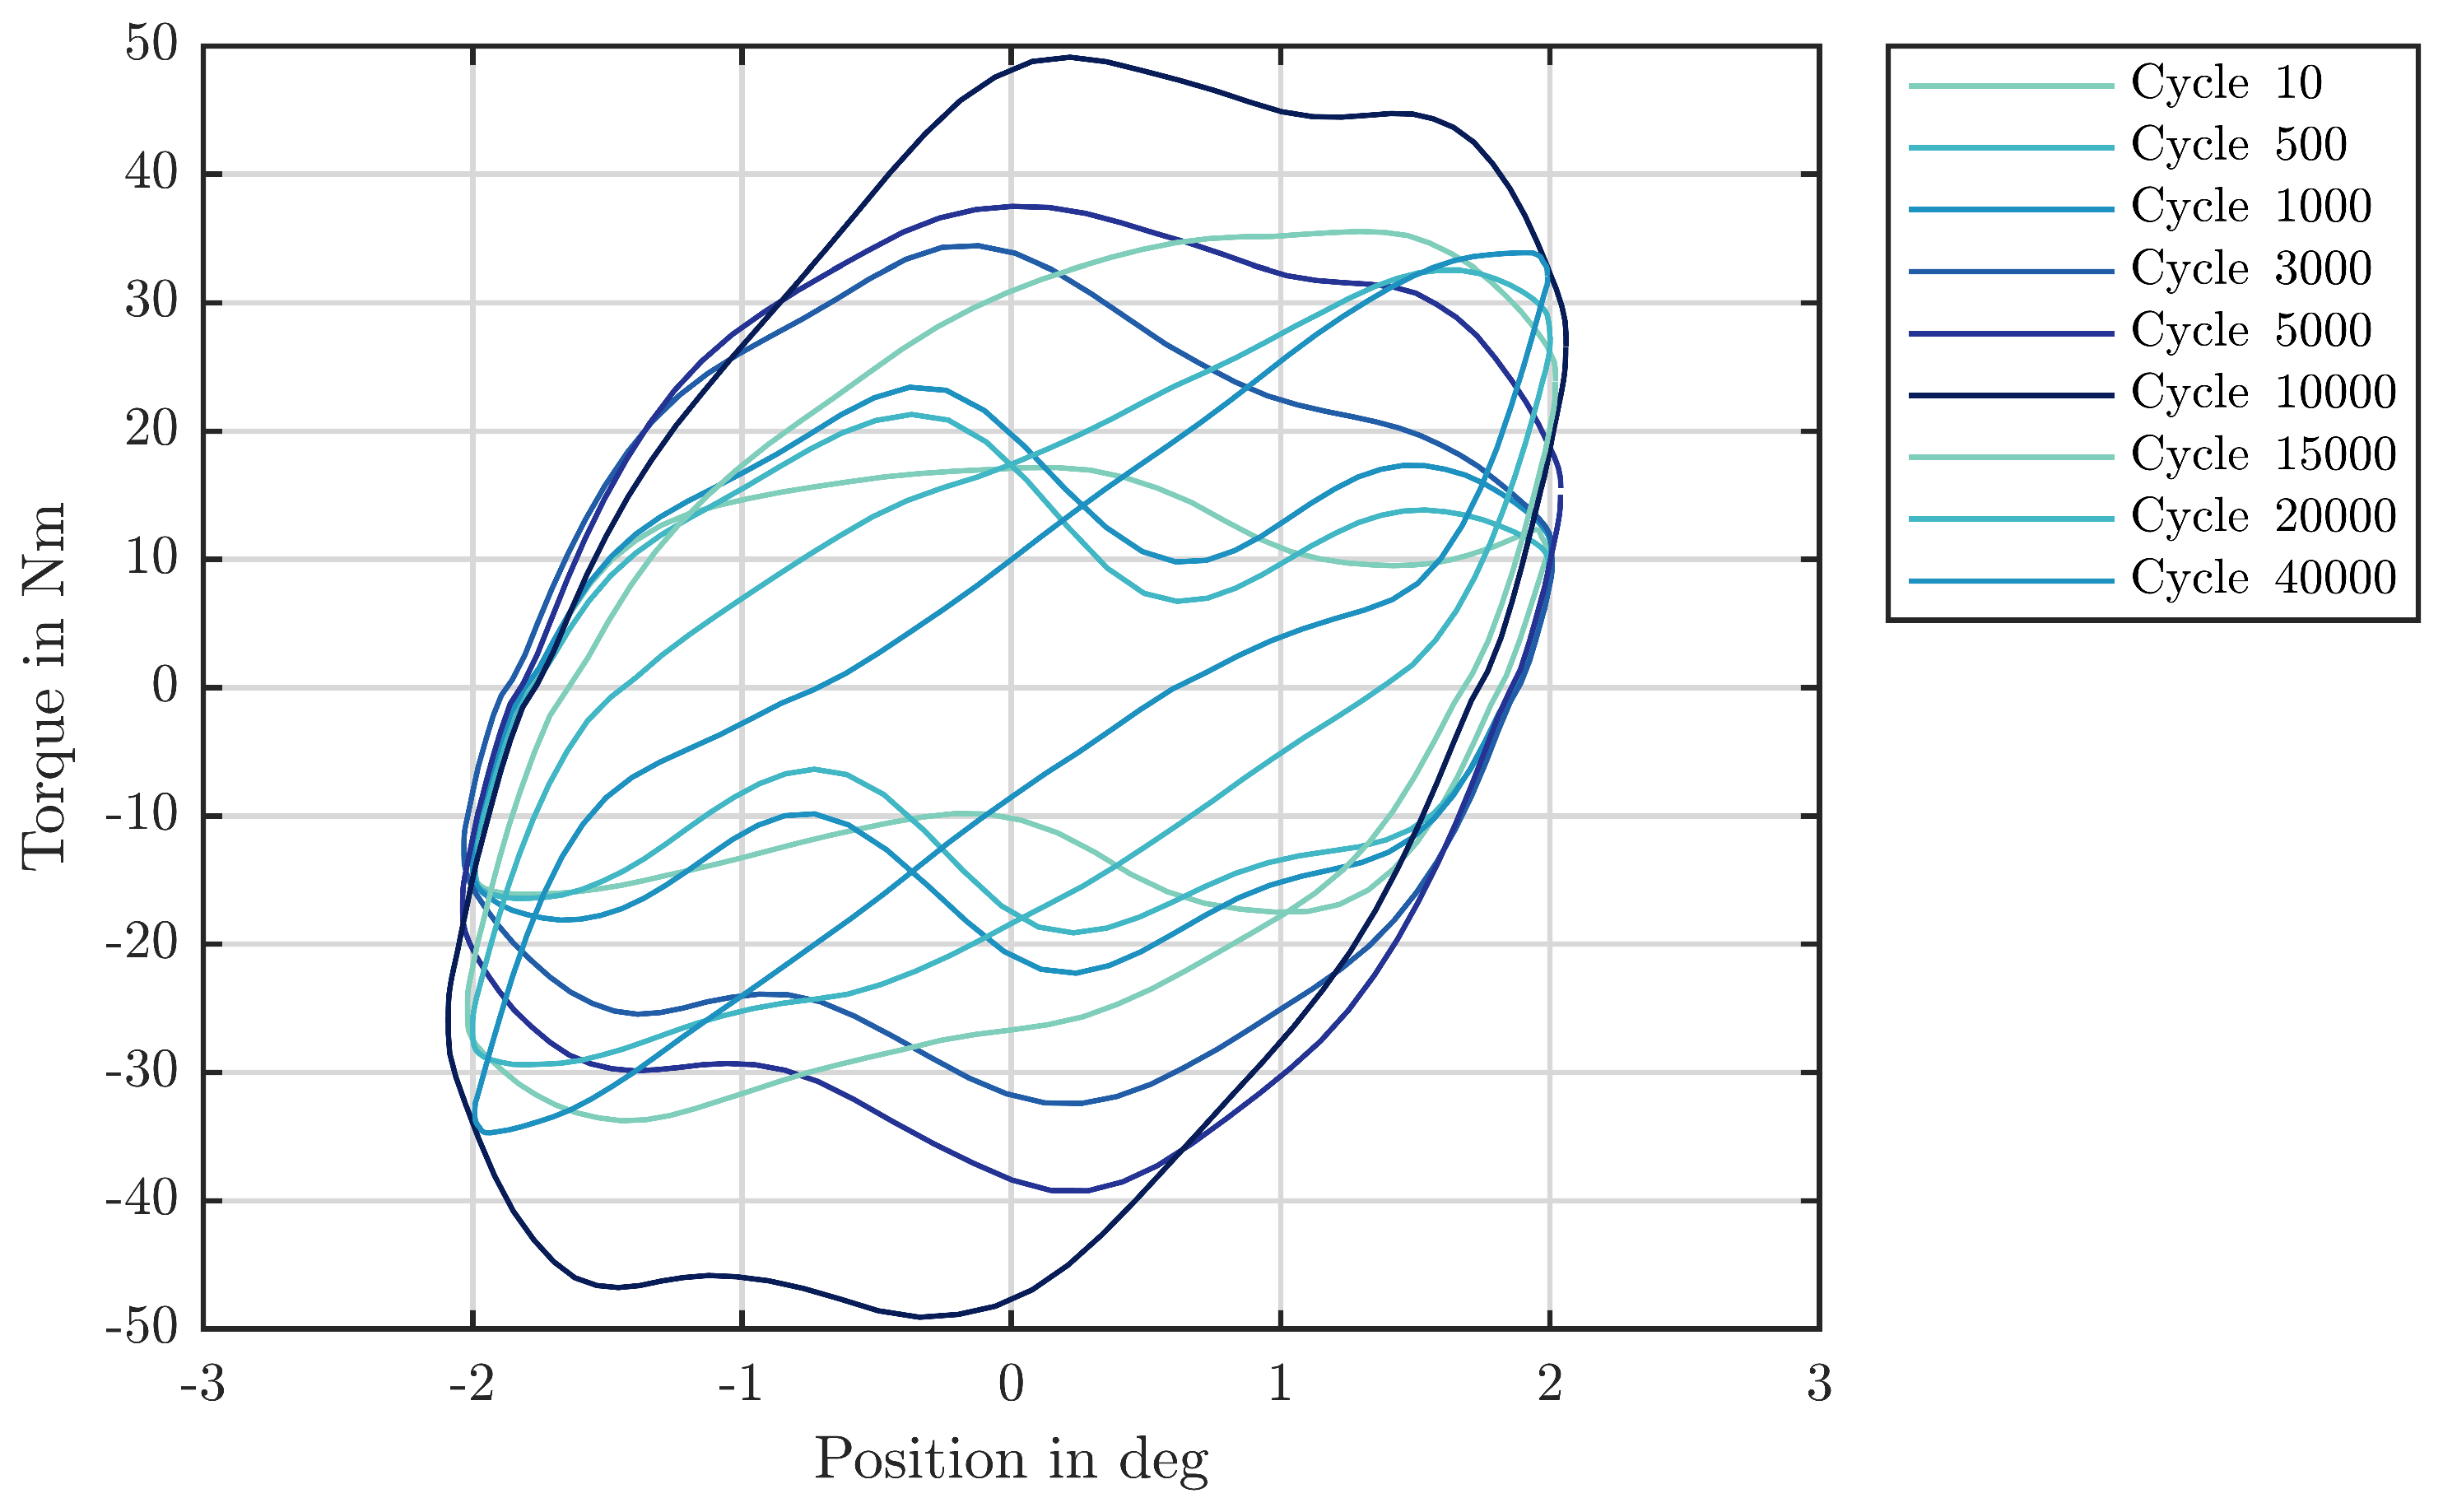
Figure 16.
Energy wear factor for a test with type 7220 bearings and 40 k cycles according to Section 2.3
Figure 16.
Energy wear factor for a test with type 7220 bearings and 40 k cycles according to Section 2.3
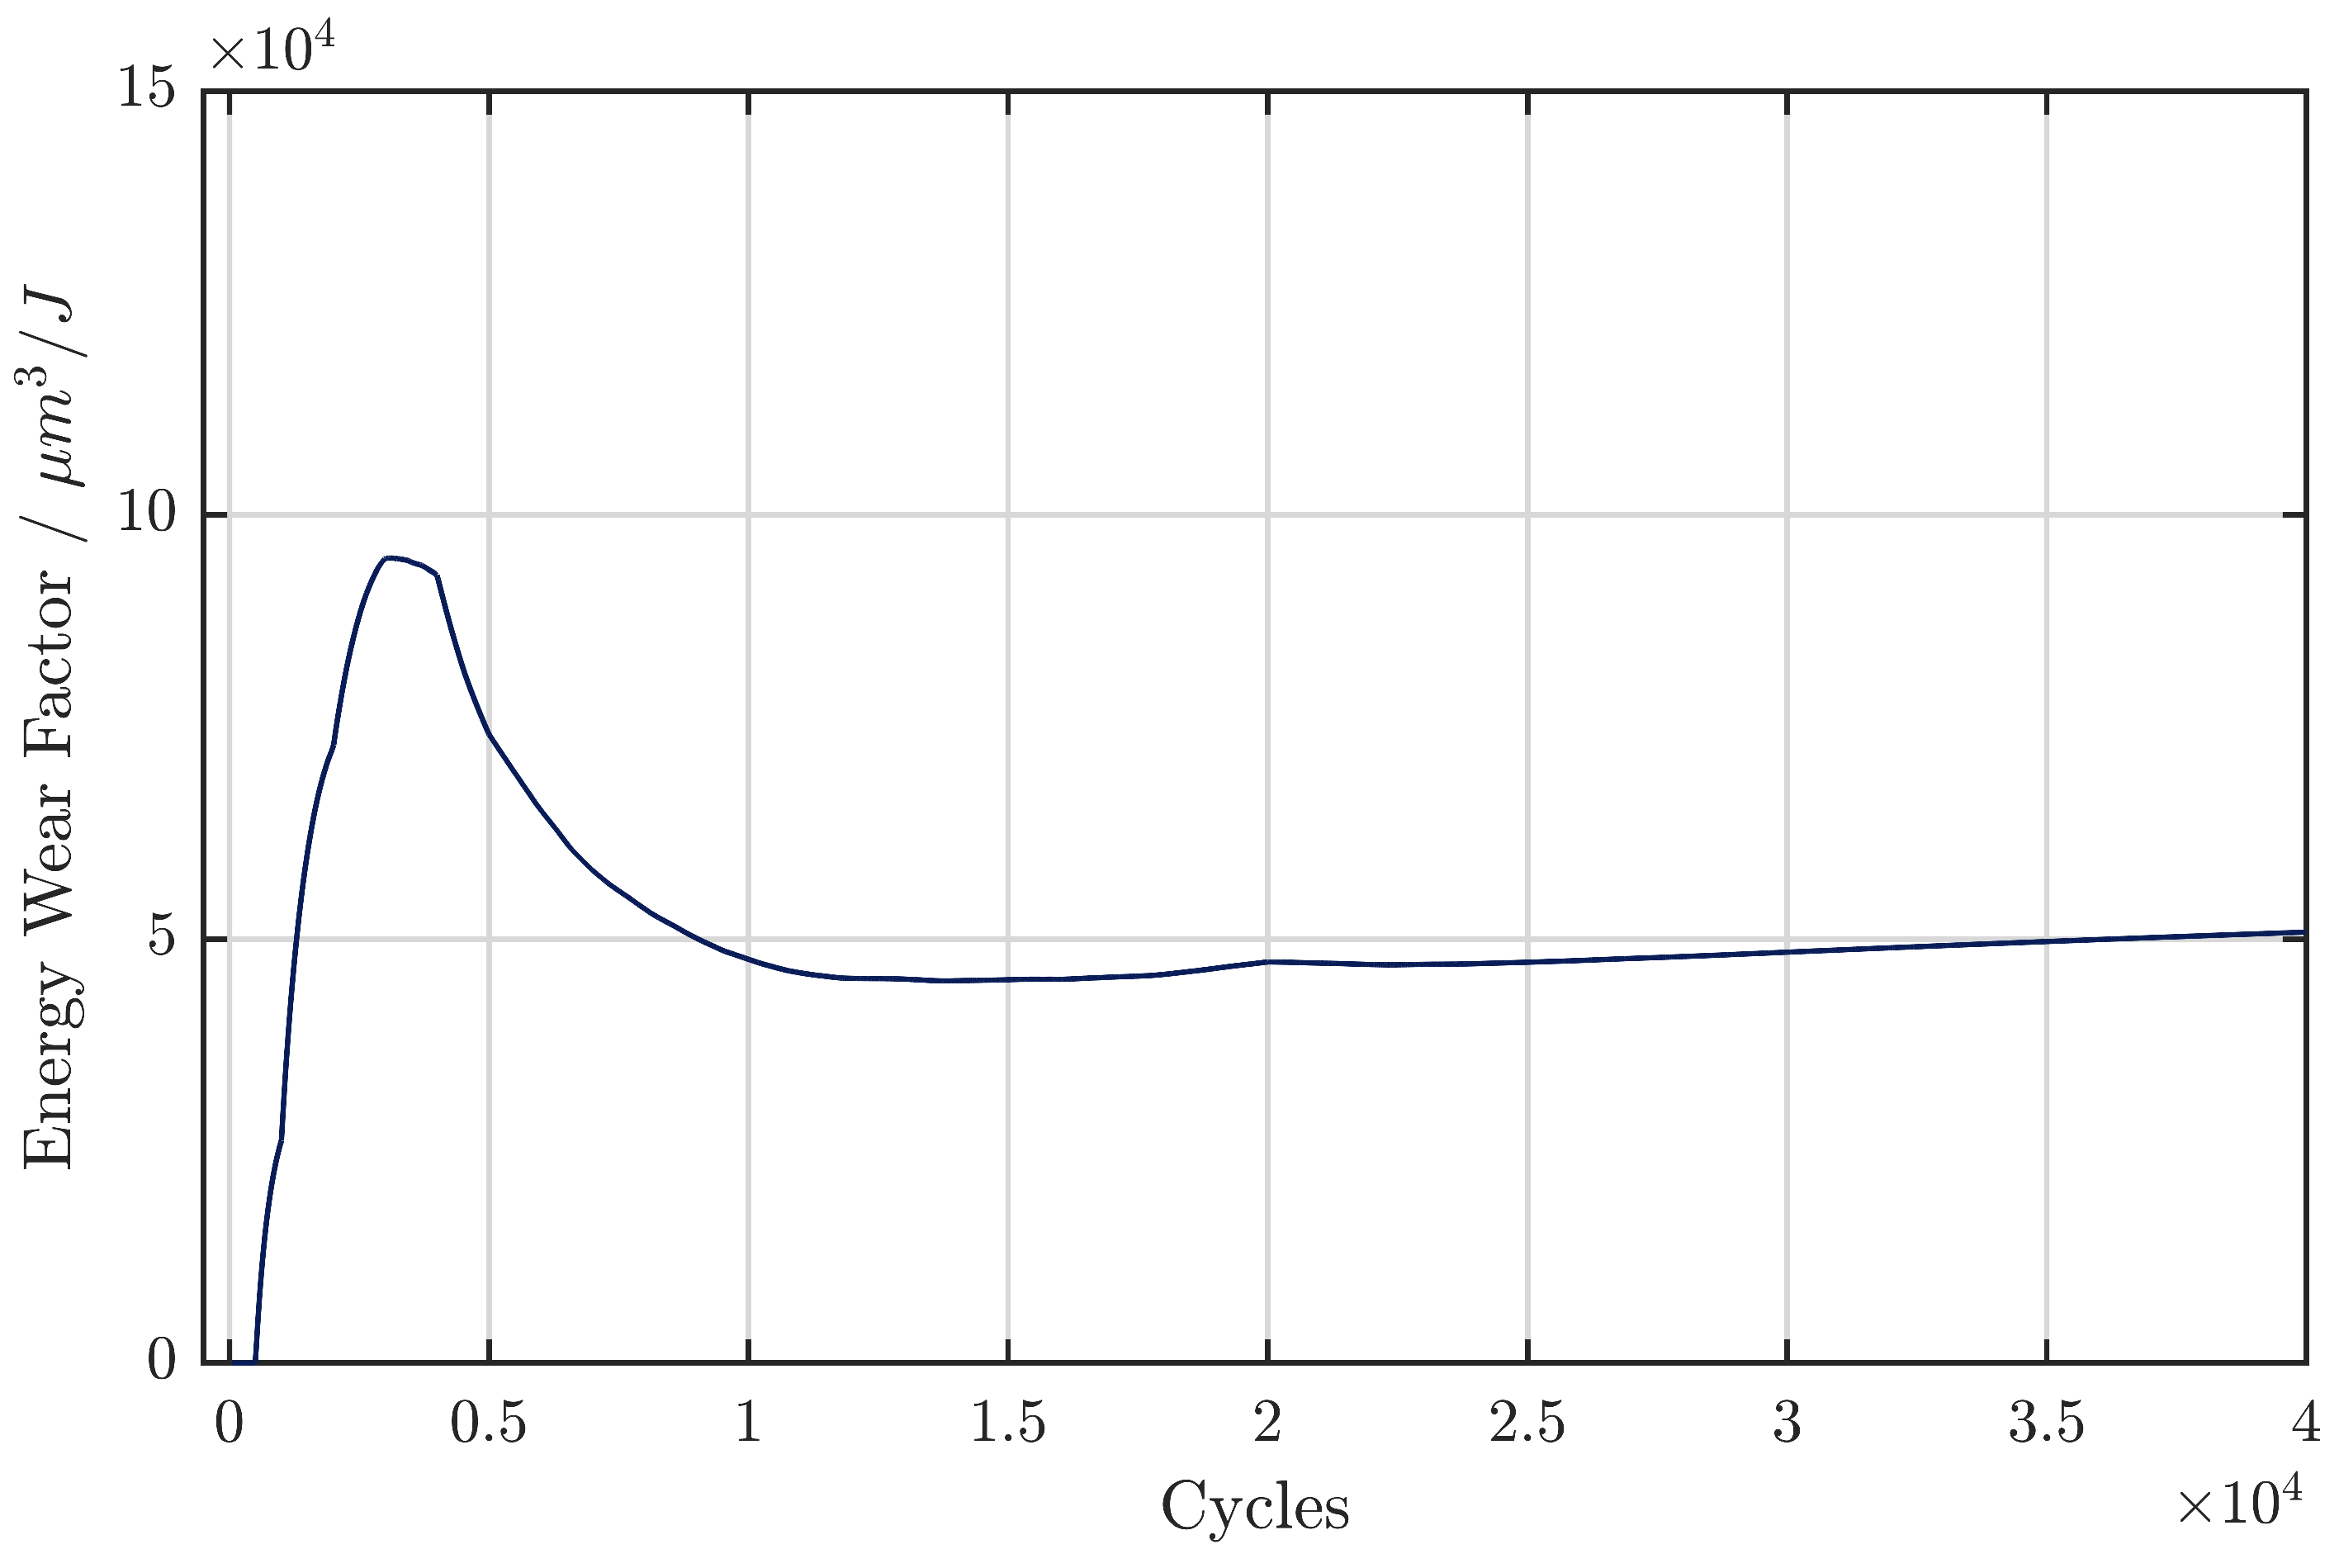
Figure 17.
Comparison of the curves of the energy wear factors for the tests with bearing type 7208 (green) and 7220 (blue). *Energy wear factor for an Alumina/SC652 contact in the oscillating ball-disk test under pure sliding found in [22]. ** Energy wear factor for an Alumina/DC1 contact in the oscillating ball-on-disc test with pure sliding found in [22].
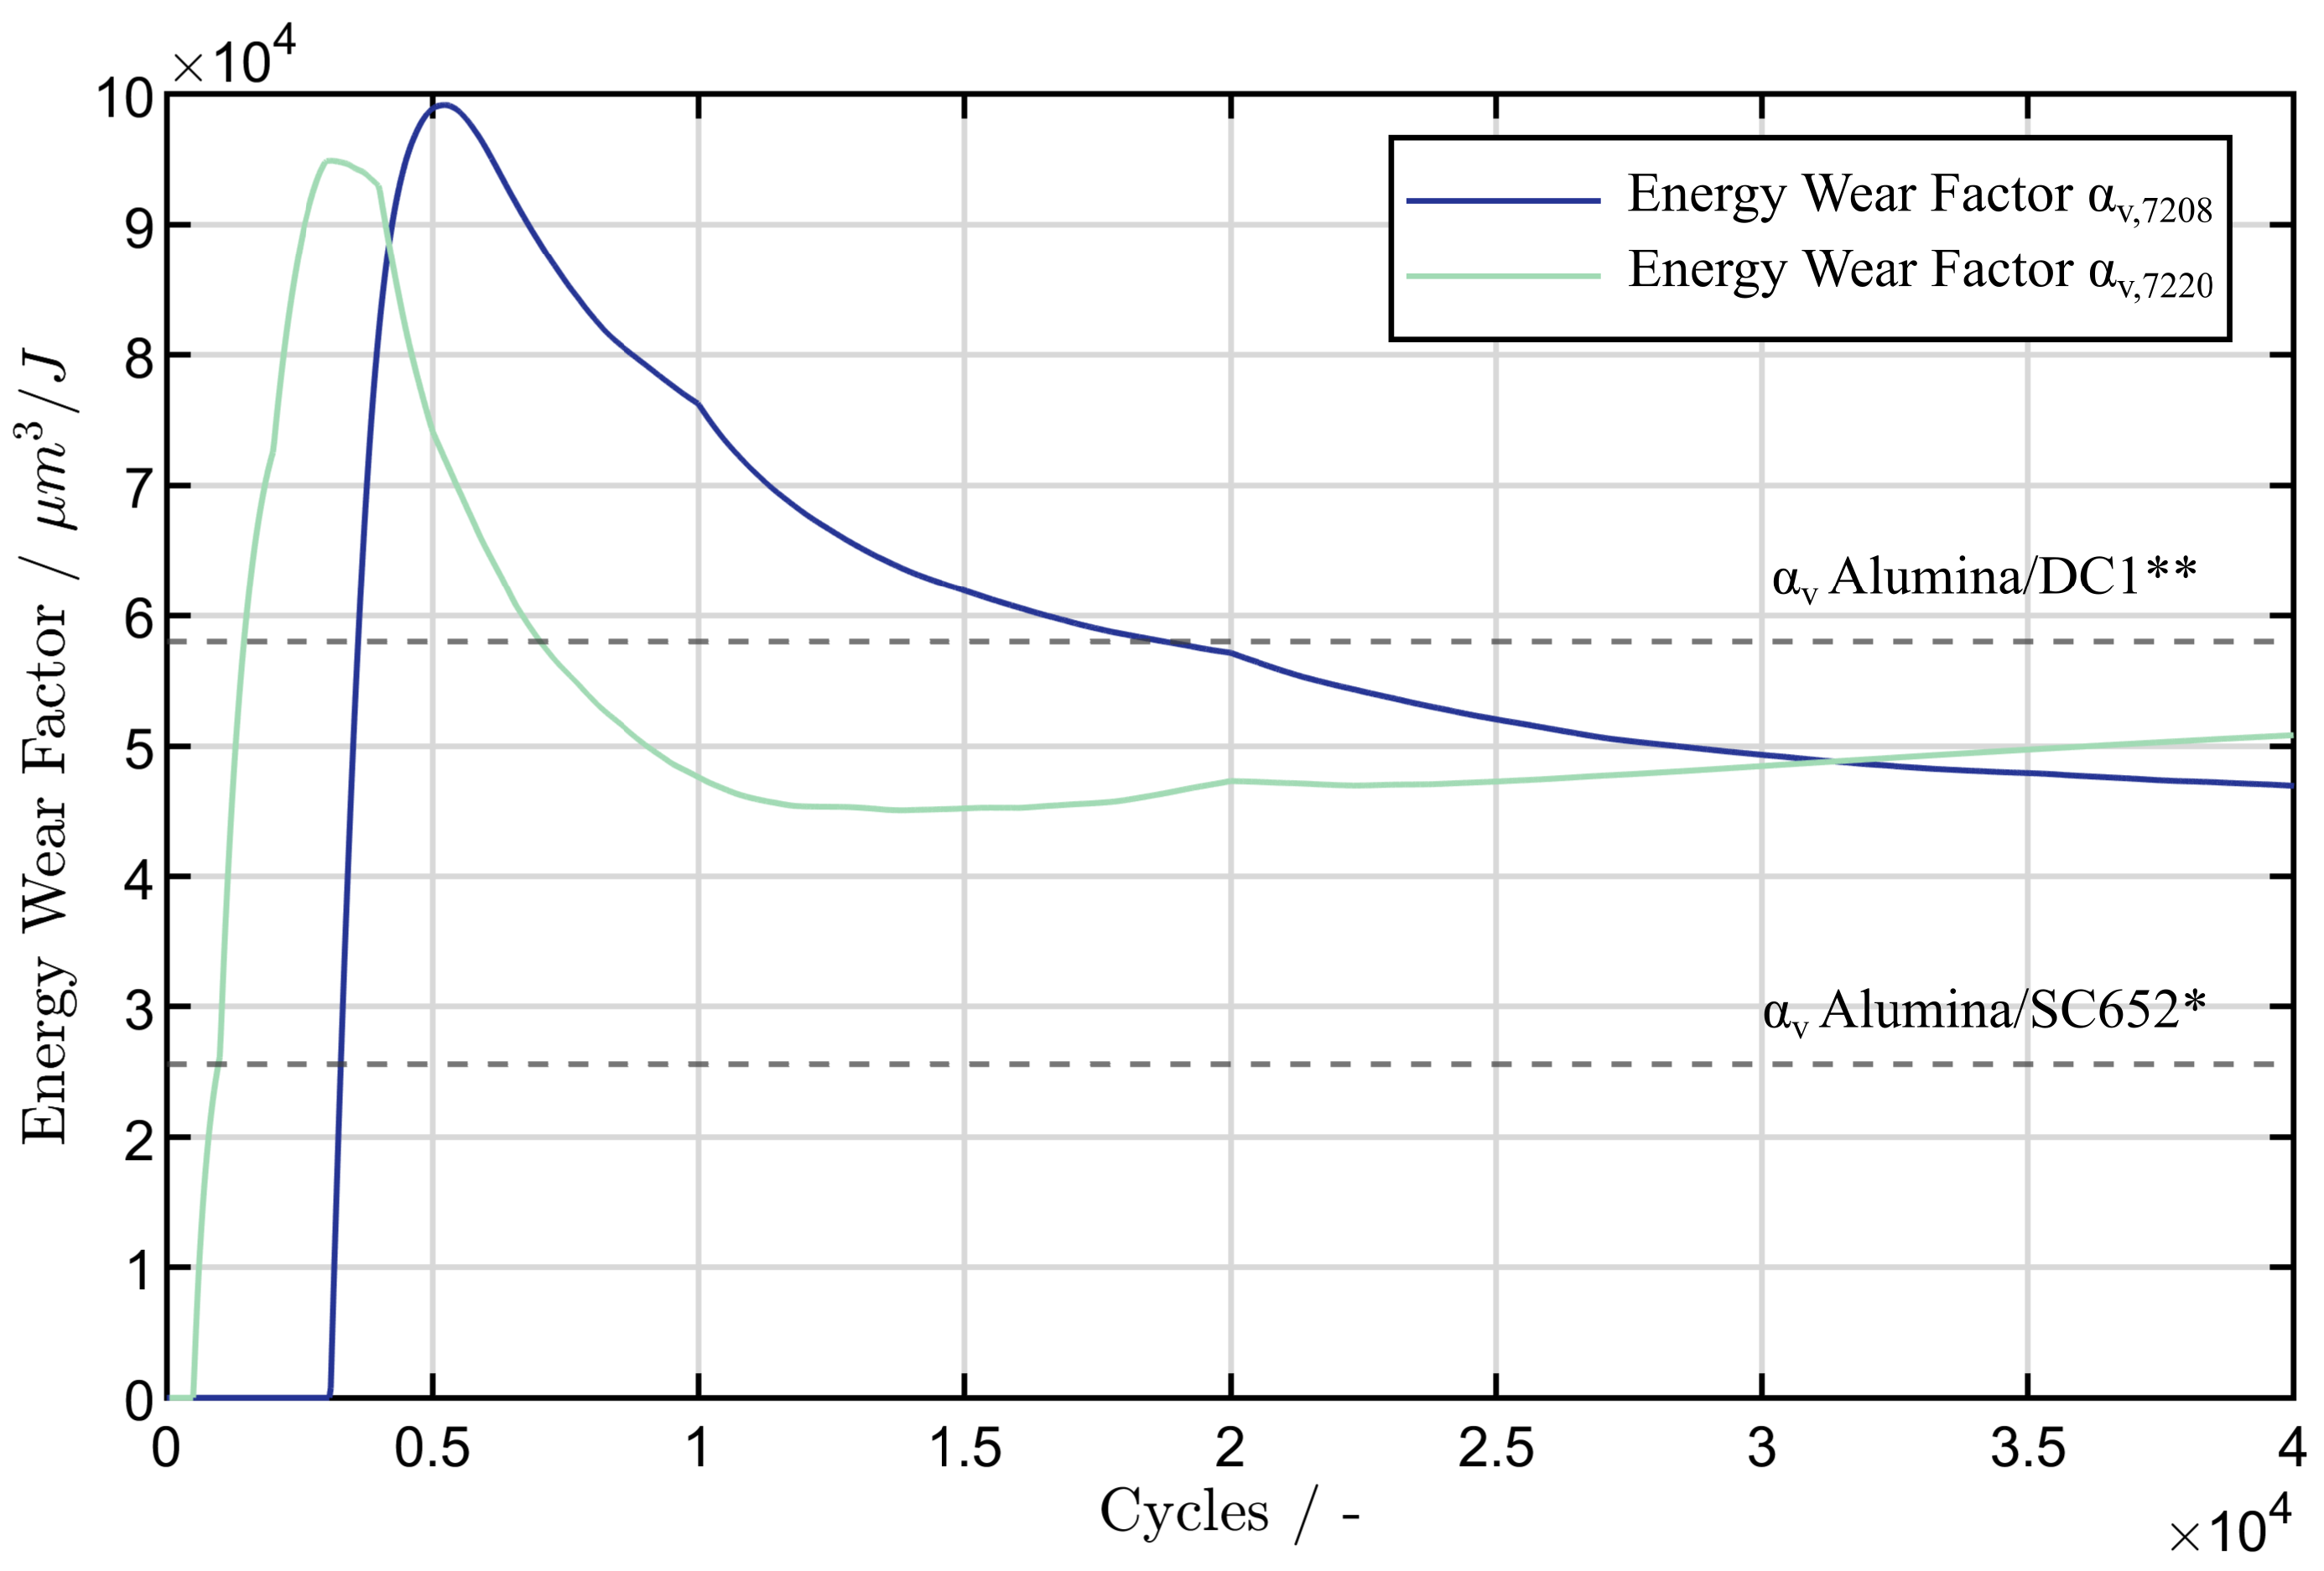

Table 1.
Grease properties
| Parameter | Grease 1 | Unit |
|---|---|---|
| Thickener Type | Lithium | - |
| Base Oil Type | synthetic (PAO) | - |
| Base Oil Viscosity | 50 | cSt at 40 C |
| Oil Separation Rate (IP 121) | 4 | % |
| Dropping Point | >180 | C |
| Additives | fully additivated + solid lubricants | - |
Table 2.
Test parameters for wear development on type 7208 and type 7220 bearings
| Parameter | 7208 | 7220 | Unit |
|---|---|---|---|
| Axial Load | 12.4 | 90 | kN |
| Oscillation Frequency f | 5 | 0.5 | Hz |
| Oscillation Angle | 7 | 4 | |
| Amplitude Ratio x/2b | 4 | 2.6 | - |
| Cycles | 1, 5, 10, 20, 40, 80, 160 | 0.5, 1, 2, 3, 4, 5, 20, 40, 340, 1000 | x10 |
Table 3.
Material properties
| Young’s modulus, E (GPa) | Poisson coefficient, | Hardness, H (HV) | |
|---|---|---|---|
| 100Cr6 | 210 | 0.3 | 800 |
| Alumina (counterbody) | 370 | 0.27 | 2300 |
| HSS (SC652) | 230 | 0.28 | 800 |
| DC1 (sintered steel) | 200 | 0.3 | 370 |
Disclaimer/Publisher’s Note: The statements, opinions and data contained in all publications are solely those of the individual author(s) and contributor(s) and not of MDPI and/or the editor(s). MDPI and/or the editor(s) disclaim responsibility for any injury to people or property resulting from any ideas, methods, instructions or products referred to in the content. |
© 2023 by the authors. Licensee MDPI, Basel, Switzerland. This article is an open access article distributed under the terms and conditions of the Creative Commons Attribution (CC BY) license (http://creativecommons.org/licenses/by/4.0/).
Copyright: This open access article is published under a Creative Commons CC BY 4.0 license, which permit the free download, distribution, and reuse, provided that the author and preprint are cited in any reuse.


