Submitted:
24 January 2023
Posted:
25 January 2023
Read the latest preprint version here
Abstract
Episcopic imaging using techniques such as High Resolution Episcopic Microscopy (HREM) and its variants, allows biological samples to be visualized in three dimensional over a large field of view. Quantitative analysis of these images is undertaken using a range of methods. In this systematic review, we look at trends in quantitative analysis of episcopic images and discuss avenues for further research. Papers published between 2011 and 2022 were analyzed for details about quantitative analysis approaches, methods of image annotation and choice of image processing software. It is shown that quantitative processing is becoming more common in episcopic microscopy and that manual annotation is the predominant method of image analysis. Our meta-analysis highlights where tools and methods still require development in this field, and we discuss what this means for the future of quantitative episcopic imaging, as well as how annotation and quantification may be automated and standardized across the field.
Keywords:
episcopic
; annotation
; quantification
1. Introduction
Episcopic microscopy refers to imaging techniques that utilize serial sectioning and block-face imaging to create high-resolution large-volume three-dimensional (3D) datasets. High Resolution Episcopic Microscopy (HREM) and its associated techniques: Optical HREM, Episcopic fluorescent image capture (EFIC) and multi-fluorescent HREM (MF-HREM), require samples to be embedded in a supporting material to allow automated sectioning at the micron scale. After each section is removed, an image is captured of the cut surface, enabling a 3D image stack to be constructed. While this review focuses on optical episcopic imaging, it is worth noting that an equivalent methodology exists in electron microscopy: serial block face scanning electron microscopy [1]. In contrast to serial histology, the image stack produced by episcopic microscopy is inherently aligned and therefore requires no registration step.
Each of the methods above have established experimental protocols across a range of biological samples; and, in the case of optical HREM and EFIC, have been used to test biological and medical hypotheses for over a decade [2]. Alongside the development of experimental protocols, there has also been development of image processing tools to extract quantitative information from HREM images.
Much of the quantitative analysis of HREM images to date has relied upon manual annotation of structures of interest, for example, to extract tissues volumes, surface areas or number of anomalies. As HREM can be a high-throughput imaging modality (particularly for mouse embryo studies), and the datasets produced may be very large, manual image processing can present a bottleneck both in terms of both computational resource and researcher time.
In this review we briefly outline the goals and methods of quantitative 3D image processing and present results from a systematic review into the current practices for image processing approaches in the episcopic imaging literature. Additionally, we highlight obstacles preventing wider use of quantitative image analysis. Finally, we propose avenues for further research and suggest what future developments we may expect.
1.1. Background on Episcopic Imaging Techniques
HREM was originally developed as a high-throughput platform for phenotyping transgenic mouse models [2,3,4] and has since been developed into a commercial system (Optical HREM, Indigo Scientific). For these embryo phenotypic studies eosin was added to the embedding medium, with image contrast resulting from eosin blocking (when bound to eosinophilic proteins, the fluorescence of unbound eosin is inhibited or frequency-shifted). This produces images with an appearance similar to the inverse of a traditional eosin staining in histology. Similarly, imaging of LacZ expression through x-gal staining has also been used in conjunction with eosin-HREM, using a secondary filter set. As with Eosin contrast, x-gal staining blocks the native fluorescence of the resin embedded sample.
Episcopic Fluorescence Image Capture (EFIC) is a variant of HREM in which samples are embedded in non-fluorescent resin and contrast is provided solely by the native autofluorescence of the tissue [5]. More recently MF-HREM was developed to enable imaging of multiple targeted fluorescent stains in a similar manner to other 3D optical imaging modalities such as light sheet or serial two-photon microscopy [6].
There are also variants of episcopic imaging which utilise cryosectioning to circumvent some of the difficulties of standard HREM sample preparation [7,8]. Rather than dehydrating and embedding samples in resin, cryosectioning episcopic microscopy requires that the samples are frozen to harden them and enable accurate sectioning, which is more time efficient and compatible with a greater number of fluorescent stains.
Applications of HREM and its variants have included large-scale embryo phenotyping to build up an atlas of embryonic-lethal gene knockouts (`Deciphering the Mechanisms of Developmental Disorders (DMDD)’ [4], assessing blood vessel morphology in human skin biopsies [9,10,11], in addition to other use cases where a large 3D field of view is essential.
1.2. The importance of quantitative image analysis
Quantitative image analysis is required for statistical analysis of results, allowing biological hypotheses to be tested and results to be reported with confidence. Moreover, quantification can be used to extract more information from image data and, when automated, facilitate high throughput analysis. Well established quantification pipelines allow researchers to standardise their image analysis, and the objectivity of quantitative analysis makes for more robust interpretations of data. Finally, quantised results can be used for further experiments such as in-silico modelling or training of a machine learning model.
Performing quantitative analysis on the large 3D data sets typically produced by episcopic imaging is a non-trivial task that requires specialised approaches depending on the data type and the aims of the analysis.
1.3. Methods of quantitative imaging
There are a few key methods for quantification that are relevant to episcopic imaging data analysis; as the pixel intensities of episcopic images do not correlate with biological properties (unlike techniques such as Bioluminescence Microscopy), analysis is largely dependent on image annotation. Annotation can take the form of object detection or segmentation. Object detection usually takes the form of a bounding box or arrow identifying the feature of interest, while segmentation labels every pixel within the feature as belonging to that feature (where this is done within the feature of interest only, it is referred to as instance segmentation; semantic segmentation requires every pixel in the image to be assigned to a class, e.g. vessel or background). Object detection is generally easier to achieve, but segmentation is more information-dense. Once an image is annotated, further analyses can be performed, for example object counting, distribution and morphometry of objects.
Annotation can be performed manually, by tracing or highlighting objects, or by computational means. Widely used methods include pixel intensity-thresholding, filtering (for example, Frangi filtering for blood vessel enhancement [12]) and, more recently, machine learning. The processing time, labour and level of expertise required varies depending on the method. Fully manual segmentations performed by a highly trained expert are generally considered the gold standard, but are time consuming and can vary between operators. Semi-automated methods may require expertise to fine-tune, whilst fully automated methods do not require human intervention, making them most suited to batch analysis. The ideal image processing pipeline is one which is fully automated to facilitate high throughput, objective results that can be replicated by all users with the same software implementation.
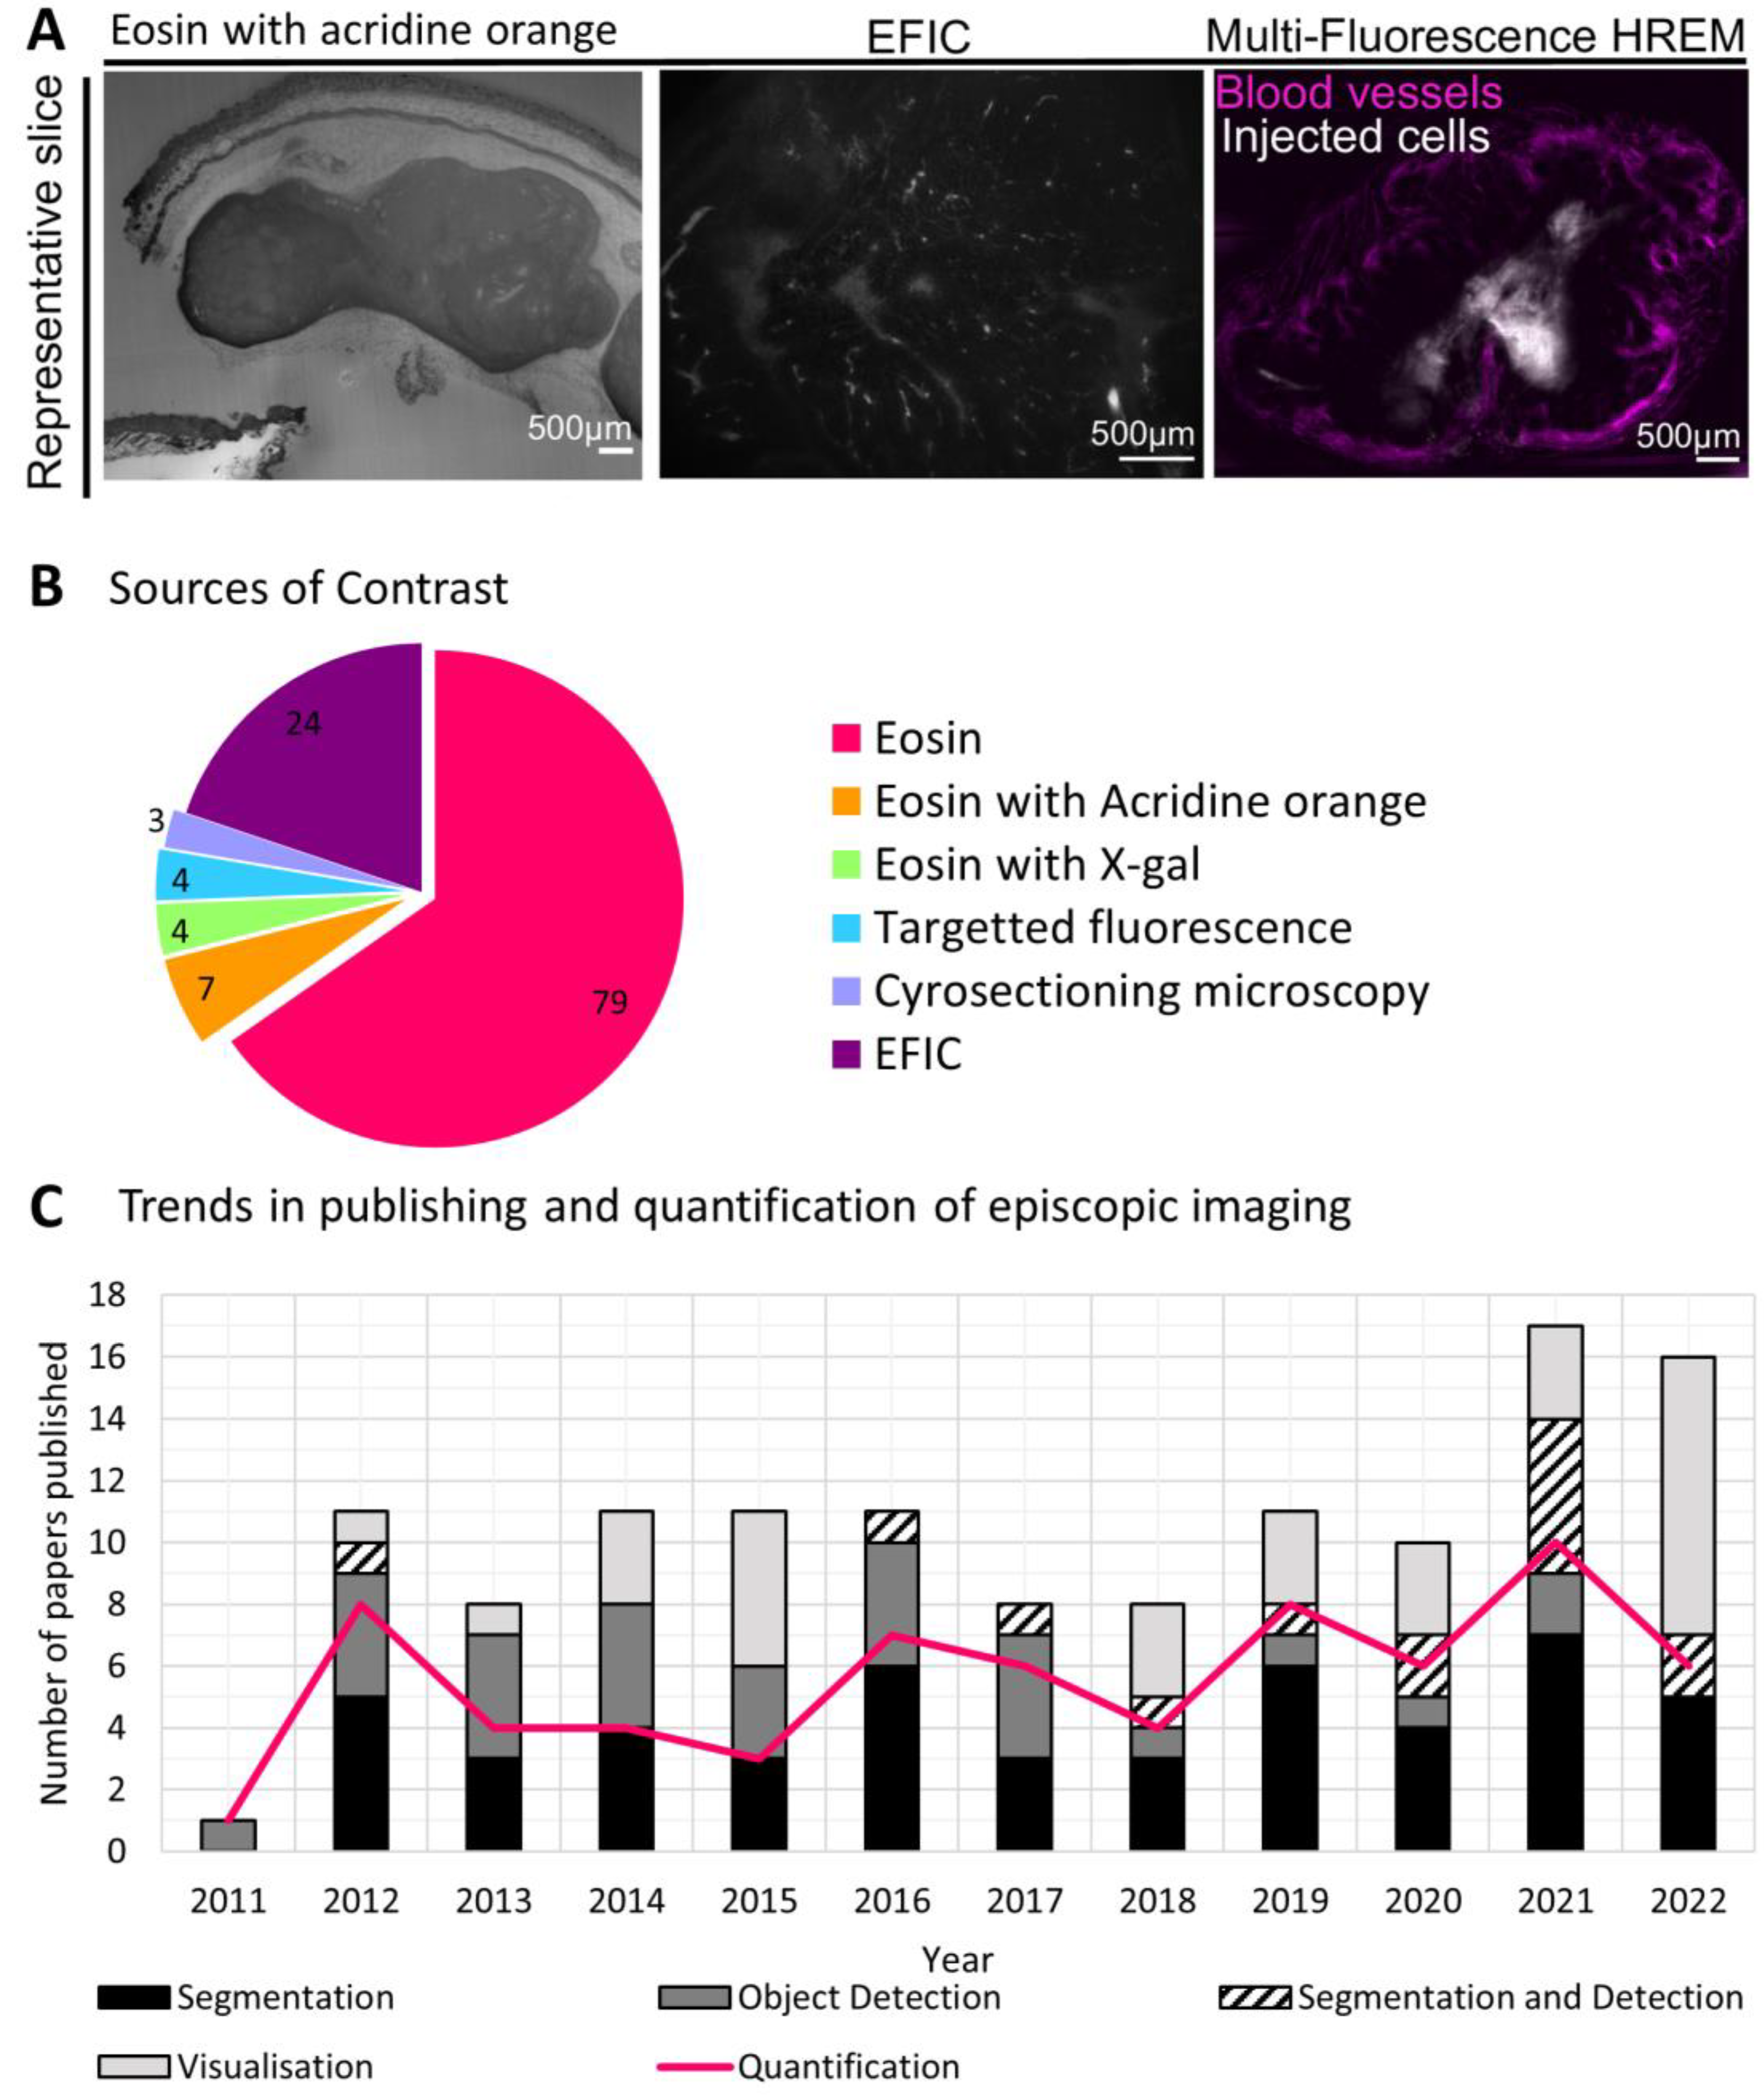
Figure 1.
Here a cluster of Paracoccidioides brasiliensis cells are annotated in a photomicrograph (source: CDC Public Health Image Library) by three different methods: object detection, instance segmentation and semantic segmentation. Object detection results in a region of interest (red border, right panel) while instance segmentation produces a mask of the area of each cell (colored regions, center panel) and semantic segmentation produces a binary image with each pixel labelled as ‘background’ (black) or ‘cell’ (white) (left panel).
2. Methods
Literature searches were performed in Google Scholar using the term "high resolution episcopic microscopy" OR "episcopic fluorescence image capture" (case ignored) with a date range of January 2011 to December 2022. 463 searches were initially returned. Based on the title, abstract and methods for these results, review articles were excluded alongside articles which did not use HREM, EFIC or a related episcopic technique. This left 167 relevant articles.
Subsequent exclusion criteria removed articles which did not use biological samples or were protocol descriptions only, without new experimental data or new image processing methods. Conference abstracts without enough detail to extract meta-analysis data were also excluded. From the remaining 123 articles, ten features were extracted:
- Year
- Contrast type
- Structure under investigation
- Model organism
-
Was annotation was performed?
- If yes: was this segmentation, object detection, or both?
- Was quantitative data presented?
- Method of annotation /quantification – organized into categories determined during analysis
- Software used
- Was the raw image data deposited in an online repository?
- The type of publication (paper, conference paper, thesis)
3. Results
3.1. Trends in prevalence of quantification
Since 2011, episcopic microscopy data has featured in 123 publications, including 115 journal papers, three conference papers, two correspondences, two doctoral theses and one case report. By far the most widely used contrast method has been eosin labelling (featured in 90 papers), sometimes combined with acridine orange or X-gal labelling (Figure 2a,b). EFIC was the second most used contrast method, being featured in 24 papers. Four papers used fluorescence labelling, each of which included segmentation of tissues and quantitative results. Three papers employed cryosectioning, of which two featured quantitative analysis. Data was made available online for 27 papers (22%), 17 of which were a part of the Deciphering Mechanisms of Developmental Disorders (DMDD) project [13].
The most commonly imaged species was mouse (85 papers), followed by human tissue (20 papers). There has been a strong focus on visualizing mouse embryos, in particular for assessing cardiac morphology (represented in 55 papers).
Over these past ten years, the number of papers published has averaged ten per year, with an increase in the last two years to 17 in 2021 and 16 in 2022. Of these papers, the proportion which provide quantitative image data has shifted: beginning at 75% of publications between 2011 and 2012, it dropped to below 50% from 2013 and 2015, then increased again in 2016 to 65% and remained at approximately that level until 2021. The proportion dropped again in 2022 to just 38% (Figure 2c). In total, just over half of the papers published since 2011 (56%) provided quantitative results, but where annotation was performed, that number increased to 70%, signifying the important role annotation plays in quantification. A quarter of the papers published in this time used episcopic imaging for visualization without annotation; often this data was presented alongside other experimental techniques such as in-vivo imaging, immunohistochemistry and genetic sequencing [14,15,16]. Segmentation of episcopic data has been increasingly featured in the literature over the last few years, apparently being favored over object detection since 2016.
3.2. Trends in methods of quantification
Through the analysis of the last decade of HREM papers, we have identified seven broad categories of quantitative analysis being performed on episcopic image data. We define these categories as:
- Scoring /counting of abnormalities (as defined in an atlas)
- Object counting (no agreed ontology needed)
- Registration based
- Hand 2D measurements of anatomic features after reslicing data
- 3D morphological analysis, for example: volumes, networks
- Fractal analysis of heart (standardized method)
- Other (for example, orientation of fibers)
3D morphological measurements were the most commonly applied method of quantification, occurring in 25 papers and becoming more prevalent over time (Figure 3a,b). This morphological analysis was often performed in conjunction with other methods such as scoring or counting of abnormalities. A potential limiting factor for use of this method is the need for segmentation, which was completed by hand in over half of the papers reviewed here. Simple segmentations were employed in many of these papers to remove background and enable measurements of volumes, surfaces areas and distances, but more advanced morphological analysis requires segmentation of complex tissue structures. For example, Sweeney et. al. [17] uses a fully segmented vessel network to create a graphical representation of the vascular connectivity. Producing such a segmentation, when done manually, is extremely labor intensive.
Scoring or counting of abnormalities was the second most widely employed method, appearing in 19 papers, and notable increased in use from 2016 onwards. This is potentially associated with the publication of the open source DMDD database and papers describing the detailed methodology for performing abnormality scoring based on the mammalian phenotyping dictionary. This trend therefore highlights the utility of open-source data platforms and widely available software for establishing a reproducible image quantification protocol. Scoring/ counting is also a method that does not require segmentation and thus can be more quickly achieved by an expert observer. The vast majority of papers employing a scoring of counting method did so manually. The drawbacks of these methods are that they may require a high degree of expertise to recognize abnormalities, and where there is a binary output for a given sample (e.g. normal versus abnormal) a large number of samples must be assessed to allow meaningful quantification.
Seven papers included fractal analysis of the heart. This is a standardized method that produces a quantitative measure of complexity or surface roughness (the fractal dimension, FD) wieldy used in cardiology [18]. Other quantification methods began appearing in papers from 2017 onwards. These include structure tensor analysis for calculating myocyte and neuron orientation [6,19,20], skeletonization algorithms for producing a graphical representation of vasculature [6,21], and measures of asymmetry [22].
3.3. Methods of image annotation
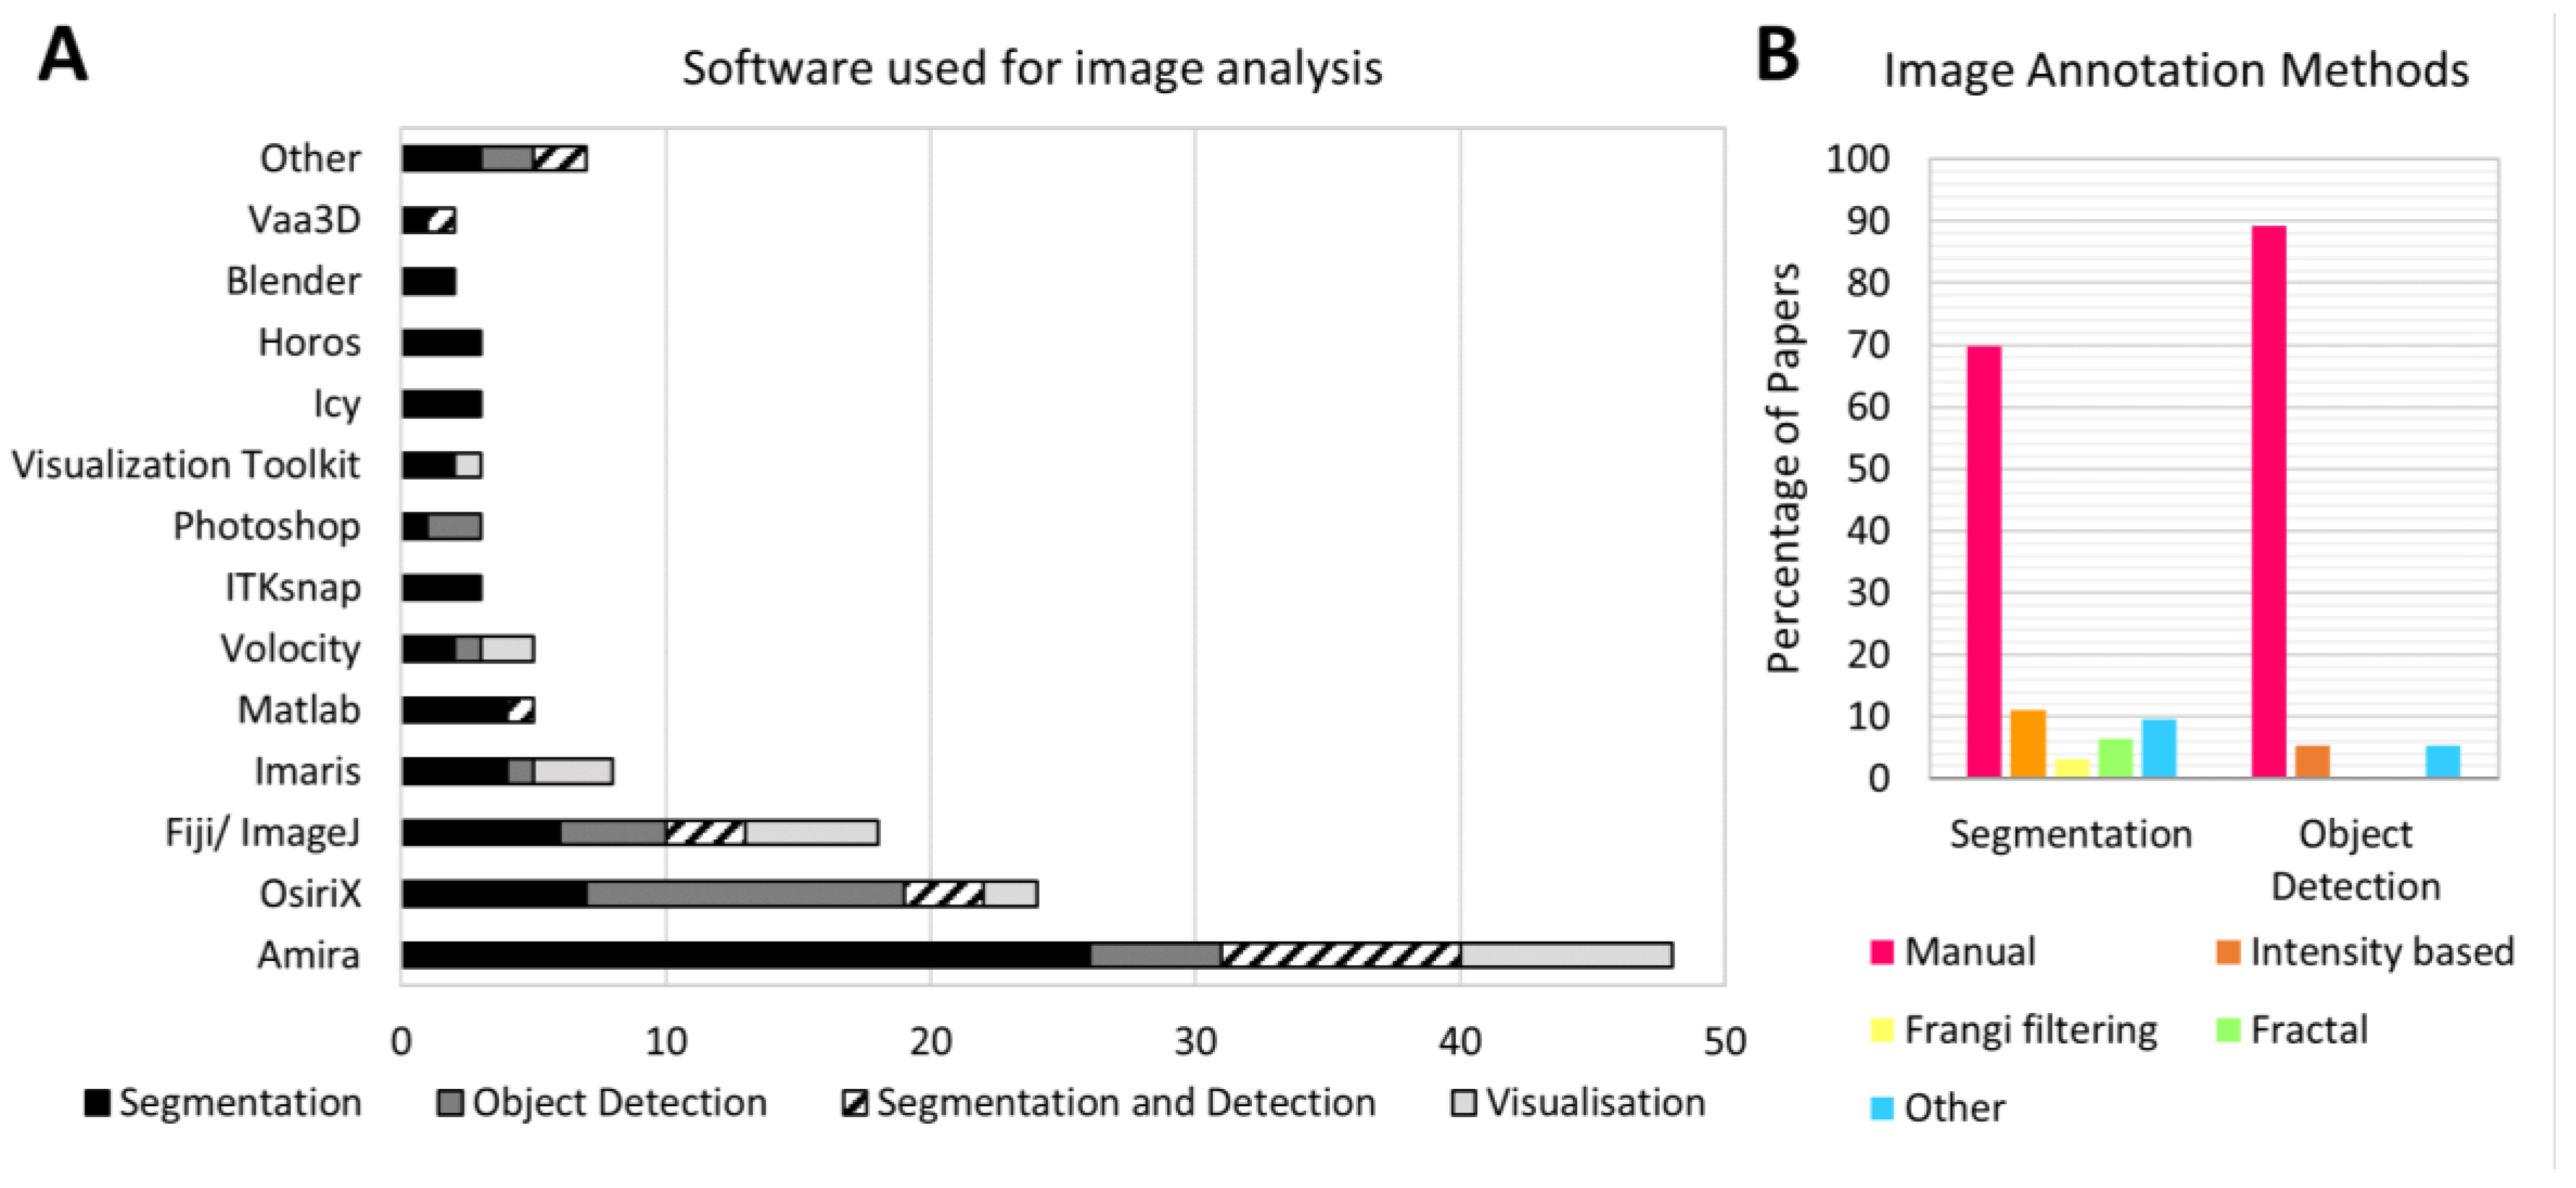
Manual annotation was the most common method for both object detection and segmentation. Overall, 76% of papers presenting quantitative image analysis relied, at least in part, on manual annotation (70% for papers employing segmentation, 89% for papers using object detection) (Figure 4b). Automated and semi-automated methods were less widely used: intensity thresholding was employed in six papers, while vasculature was segmented via Frangi filtering in two papers [23,24]. Some papers employed as specialized methods such as the MOST tracing algorithm in Vaa3D for neuron tracing [6,25] and the Vascular Modelling Toolkit (VMTK) for vessel segmentation [26].
A wide range of software was used to facilitate episcopic image analysis. Of the 20 software packages listed across all the reviewed papers, the most widely used were Amira (Thermofisher) (48 papers), OsiriX (Pixmeo) (24 papers) and Fiji/ ImageJ (18 papers) (Figure 4a). Amira was particularly popular for segmentation, while OsiriX was used more often for object detection. Commercial software continues to be preferred over open source alternatives: there were 35 instances of open source software being used for image analysis, compared to 99 instances of commercial software use. 22 papers did not list the software used for their analysis.
In three papers, deconvolution algorithms were used to overcome the image blurring caused by out-of-plane light from below the sample surface [6,24,25]. The asymmetric nature of this blurring necessitated a custom deconvolution algorithm in each case. Walsh et. al. [25] presents a detailed pipeline for asymmetric deconvolution and demonstrates how this enables more accuracy automated segmentation.
Asymmetric blurring is one of the reasons that automated methods might struggle to correctly annotate episcopic images. Additionally, where fluorescent labels are used, the fact that samples are whole-mount stained means they are likely to suffer from heterogenous levels of staining (due to poor penetration of the staining molecule into the center of the sample). The different forms of episcopic imaging also require different tools for annotation. This could explain the high proportion of papers relying on manual annotation, which represents a significant bottleneck for episcopic image analysis. This result highlights the need for new automated methods of annotation designed specifically for episcopic image data. One area of research that could address this need is future is machine learning-based image annotation.
4. Discussion
Publication of episcopic imaging data has increased over the last decade, demonstrating that episcopic microscopy continues to be a valuable tool for analyzing biological samples. Quantitative analysis of this data has also become more prevalent, with an increasing range of methodologies being used to extract quantitative data from episcopic images. However, the proportion of papers providing quantitative image analysis is still fairly low, averaging 54%, possibly due in part to the difficulties associated with image annotation: episcopic images are mostly annotated by hand, which can be extremely labor intensive. While some areas of analysis follow standardized methods (for example, fractal analysis of the heart and scoring of abnormalities according to an atlas) much of the quantification being performed is not standardized across research groups. 20 different software packages are used for analysis, most of which are commercially licensed and potentially expensive, while 22 papers did not list the software used. This makes reproducing and comparing results challenging, especially as different software packages provide different tools for visualization (for example, arbitrary reslicing) which can influence the manual segmentation produced.
6. Future Directions
For quantitative episcopic imaging to continue to grow as a technique, future work must focus on automated image annotation and standardized pipelines for quantitative analysis. Given recent trends, it is likely we will see continue to see more use of complex or multi-stage methodologies, for example segmentations that feed in to computer simulations. In these cases, a reproducible analysis pipeline is even more crucial to provide confidence in the analysis results. Making data easily available, using open source software, and clearly defining the analysis pipeline used in a published study are all ways researchers can contribute to more standardized and reproducible quantification methodologies. One exciting avenue for further research is machine learning-based image annotation. Episcopic image data is a prime candidate for machine learning (ML) approaches due to the availability of data in online repositories that could be used for training. The development of new tools, such as ML models, for episcopic image analysis will expand the use of episcopic imaging and create further possibilities for new applications.
Author Contributions
Conceptualization, C.W.; methodology, C.W.; formal analysis, N.H and C.W.; investigation, N.H., C.W. and L.G.; data curation, N.H., C.W. and L.G.; writing—original draft preparation, N.H. and C.W.; writing—review and editing, N.H., C.W., L.G. and S.W.; funding acquisition, S.W. All authors have read and agreed to the published version of the manuscript.
Funding
Please add: This research was funded by Cancer Research UK (C44767/A29458 and C23017/A27935) and EPSRC (EP/W007096/1). C.W. was supported by an MRC Skills Development fellowship (MR/S007687/1).
Institutional Review Board Statement
Not applicable.
Informed Consent Statement
Not applicable.
Data Availability Statement
An excel spreadsheet containing a summary of the published articles included in our meta-analysis, along with the data used to produce all figures within this review, is available for download via this link: https://github.com/natalie11/Systematic-review-of-HREM-quantiative-imaging.
Conflicts of Interest
The authors declare no conflict of interest.
References
- Denk, W.; Horstmann, H. Serial Block-Face Scanning Electron Microscopy to Reconstruct Three-Dimensional Tissue Nanostructure. PLOS Biol. 2004, 2, e329. [Google Scholar] [CrossRef] [PubMed]
- Weninger, W.J.; Geyer, S.H.; Mohun, T.J.; Rasskin-Gutman, D.; Matsui, T.; Ribeiro, I.; Costa, L.D.F.; Izpisúa-Belmonte, J.C.; Müller, G.B. High-Resolution Episcopic Microscopy: A Rapid Technique for High Detailed 3D Analysis of Gene Activity in the Context of Tissue Architecture and Morphology. Anat. Embryol. (Berl). 2006, 211, 213–221. [Google Scholar] [CrossRef] [PubMed]
- Weninger, W.J.; Mohun, T.J. Three-Dimensional Analysis of Molecular Signals with Episcopic Imaging Techniques. In Methods in molecular biology (Clifton, N.J.); Humana Press Inc: Totowa, NJ, 2007; Vol. 411, pp. 35–46. ISBN 1064-3745.
- Brown, S.D.M.; Moore, M.W.; Baldock, R.; Bhattacharya, S.; Copp, A.J.; Hemberger, M.; Houart, C.; Hurles, M.E.; Robertson, E.; Smith, J.C.; et al. Towards an Encyclopaedia of Mammalian Gene Function: The International Mouse Phenotyping Consortium. Dis. Model. Mech. 2012, 5, 289–292. [Google Scholar] [CrossRef]
- Weninger, W.J.; Mohun, T. Phenotyping Transgenic Embryos: A Rapid 3-D Screening Method Based on Episcopic Fluorescence Image Capturing. Nat. Genet. 2002, 30, 59–65. [Google Scholar] [CrossRef] [PubMed]
- Walsh, C.; Holroyd, N.; Finnerty, E.; Ryan, S.G.; Sweeney, P.W.; Shipley, R.J.; Walker-Samuel, S. Multi-Fluorescence High-Resolution Episcopic Microscopy (MF-HREM) for Three Dimensional Imaging of Adult Murine Organs. bioRxiv 2020, 2020.04.03.023978. [CrossRef]
- Hakimzadeh, N.; Van Lier, M.G.J.T.B.; Van Horssen, P.; Daal, M.; Ly, D.H.; Belterman, C.; Coronel, R.; Spaan, J.A.E.; Siebes, M. Selective Subepicardial Localization of Monocyte Subsets in Response to Progressive Coronary Artery Constriction. Am. J. Physiol. Heart Circ. Physiol. 2016, 311, H239–H250. [Google Scholar] [CrossRef] [PubMed]
- Symvoulidis, P.; Cruz Pérez, C.; Schwaiger, M.; Ntziachristos, V.; Westmeyer, G.G. Serial Sectioning and Multispectral Imaging System for Versatile Biomedical Applications. 2014 IEEE 11th Int. Symp. Biomed. Imaging, ISBI 2014 2014. 2014; 890–893. [Google Scholar] [CrossRef]
- Geyer, S.H.; Nöhammer, M.M.; Mathä, M.; Reissig, L.; Tinhofer, I.E.; Weninger, W.J. High-Resolution Episcopic Microscopy (HREM): A Tool for Visualizing Skin Biopsies. Microsc. Microanal. 2014, 20, 1356–1364. [Google Scholar] [CrossRef] [PubMed]
- Geyer, S.H.; Nöhammer, M.M.; Tinhofer, I.E.; Weninger, W.J. The Dermal Arteries of the Human Thumb Pad. J. Anat. 2013, 223, 603–609. [Google Scholar] [CrossRef] [PubMed]
- Tinhofer, I.E.; Zaussinger, M.; Geyer, S.H.; Meng, S.; Kamolz, L.P.; Tzou, C.H.J.; Weninger, W.J. The Dermal Arteries in the Cutaneous Angiosome of the Descending Genicular Artery. J. Anat. 2018, 232, 979–986. [Google Scholar] [CrossRef] [PubMed]
- Frangi, A.F.; Niessen, W.J.; Vincken, K.L.; Viergever, M.A. Multiscale Vessel Enhancement Filtering. Lect. Notes Comput. Sci. (including Subser. Lect. Notes Artif. Intell. Lect. Notes Bioinformatics) 1998, 1496, 130–137. [Google Scholar] [CrossRef]
- Mohun, T.; Adams, D.J.; Baldock, R.; Bhattacharya, S.; Copp, A.J.; Hemberger, M.; Houart, C.; Hurles, M.E.; Robertson, E.; Smith, J.C.; et al. Deciphering the Mechanisms of Developmental Disorders (DMDD): A New Programme for Phenotyping Embryonic Lethal Mice. Dis. Model. Mech. 2013, 6, 562–566. [Google Scholar] [CrossRef] [PubMed]
- Pokhrel, N.; Genin, O.; Sela-Donenfeld, D.; Cinnamon, Y. HREM, RNAseq and Cell Cycle Analyses Reveal the Role of the G2/M-Regulatory Protein, WEE1, on the Survivability of Chicken Embryos during Diapause. Biomedicines 2022, 10, 779. [Google Scholar] [CrossRef] [PubMed]
- Franck, G.; Even, G.; Gautier, A.; Salinas, M.; Loste, A.; Procopio, E.; Gaston, A.T.; Morvan, M.; Dupont, S.; Deschildre, C.; et al. Haemodynamic Stress-Induced Breaches of the Arterial Intima Trigger Inflammation and Drive Atherogenesis. Eur. Heart J. 2019, 40, 928–937. [Google Scholar] [CrossRef] [PubMed]
- Fazio, M.A.; Gardiner, S.K.; Bruno, L.; Hubbard, M.; Bianco, G.; Karuppanan, U.; Kim, J.; El Hamdaoui, M.; Grytz, R.; Downs, J.C.; et al. Histologic Validation of Optical Coherence Tomography-Based Three-Dimensional Morphometric Measurements of the Human Optic Nerve Head: Methodology and Preliminary Results. Exp. Eye Res. 2021, 205, 108475. [Google Scholar] [CrossRef] [PubMed]
- Sweeney, P.W.; Walsh, C.; Walker-Samuel, S.; Shipley, R.J. A Three-Dimensional, Discrete-Continuum Model of Blood Flow in Microvascular Networks. bioRxiv 2022, 2022.11.23.517681. [CrossRef]
- Captur, G.; Karperien, A.L.; Hughes, A.D.; Francis, D.P.; Moon, J.C. The Fractal Heart — Embracing Mathematics in the Cardiology Clinic. Nat. Rev. Cardiol. 2017, 14, 56. [Google Scholar] [CrossRef] [PubMed]
- Garcia-Canadilla, P.; Cook, A.C.; Mohun, T.J.; Oji, O.; Schlossarek, S.; Carrier, L.; McKenna, W.J.; Moon, J.C.; Captur, G. Myoarchitectural Disarray of Hypertrophic Cardiomyopathy Begins Pre-Birth. J. Anat. 2019, 235, 962–976. [Google Scholar] [CrossRef] [PubMed]
- Garcia-Canadilla, P.; Mohun, T.J.; Bijnens, B.; Cook, A.C. Detailed Quantification of Cardiac Ventricular Myocardial Architecture in the Embryonic and Fetal Mouse Heart by Application of Structure Tensor Analysis to High Resolution Episcopic Microscopic Data. Front. Cell Dev. Biol. 2022, 10, 2235. [Google Scholar] [CrossRef] [PubMed]
- Paul, W. Sweeney, C.W.S.W.-S.R.J.S. A Three-Dimensional, Discrete-Continuum Model of Blood Flow in Microvascular Networks. 2022.
- Le Garrec, J.F.; Domínguez, J.N.; Desgrange, A.; Ivanovitch, K.D.; Raphaël, E.; Bangham, J.A.; Torres, M.; Coen, E.; Mohun, T.J.; Meilhac, S.M. A Predictive Model of Asymmetric Morphogenesis from 3D Reconstructions of Mouse Heart Looping Dynamics. Elife 2017, 6. [Google Scholar] [CrossRef] [PubMed]
- Goyal, A.; Lee, J.; Lamata, P.; Van Den Wijngaard, J.; Van Horssen, P.; Spaan, J.; Siebes, M.; Grau, V.; Smith, N.P. Model-Based Vasculature Extraction from Optical Fluorescence Cryomicrotome Images. IEEE Trans. Med. Imaging 2013, 32, 56–72. [Google Scholar] [CrossRef] [PubMed]
- Horssen, P. Multiscale Analysis of Coronary Branching and Collateral Connectivity: Coupling Vascular Structure and Perfusion in 3D. 2012.
- Walsh, C.; Holroyd, N.; Shipley, R.; Walker-Samuel, S. Asymmetric Point Spread Function Estimation and Deconvolution for Serial-Sectioning Block-Face Imaging. Commun. Comput. Inf. Sci. 2020, 1248 CCIS, 235–249. [Google Scholar] [CrossRef]
- Yap, C.H.; Liu, X.; Pekkan, K. Characterizaton of the Vessel Geometry, Flow Mechanics and Wall Shear Stress in the Great Arteries of Wildtype Prenatal Mouse. PLoS One 2014, 9, e86878. [Google Scholar] [CrossRef]
Figure 2.
(a) Representative 2D slices are shown to illustrate the different sources of contrast used in episcopic imaging (eosin with acridine orange, EFIC (autofluorecence) and MR-HREM). All three panels show a subcutaneous murine tumor model. Different features are visible depending on the contrast source used. (b) The relative proportion of papers using each form of contrast is shown in a pie chart. Eosin contrast is by far the most widely used, followed by EFIC. (c) The trends in publishing of episcopic image data, the type of annotation performed and the presence of quantification are summarized. The number of papers publish per year has remained steady, but the proportion of those papers that include segmentation of episcopic image data has increased over time.
Figure 3.
(a) This graph shows the trends in methods of image quantification over the last decade. The number of papers employing any method of quantification increased over time, with scoring of abnormalities (method 1) and 3D morphological analysis (method 5) showing the greatest increase. (b) The total number of papers using each quantification method since 2011 are shown in a pie chart, highlighting the scoring of abnormalities and 3D morphological analysis as the two most commonly used methods.
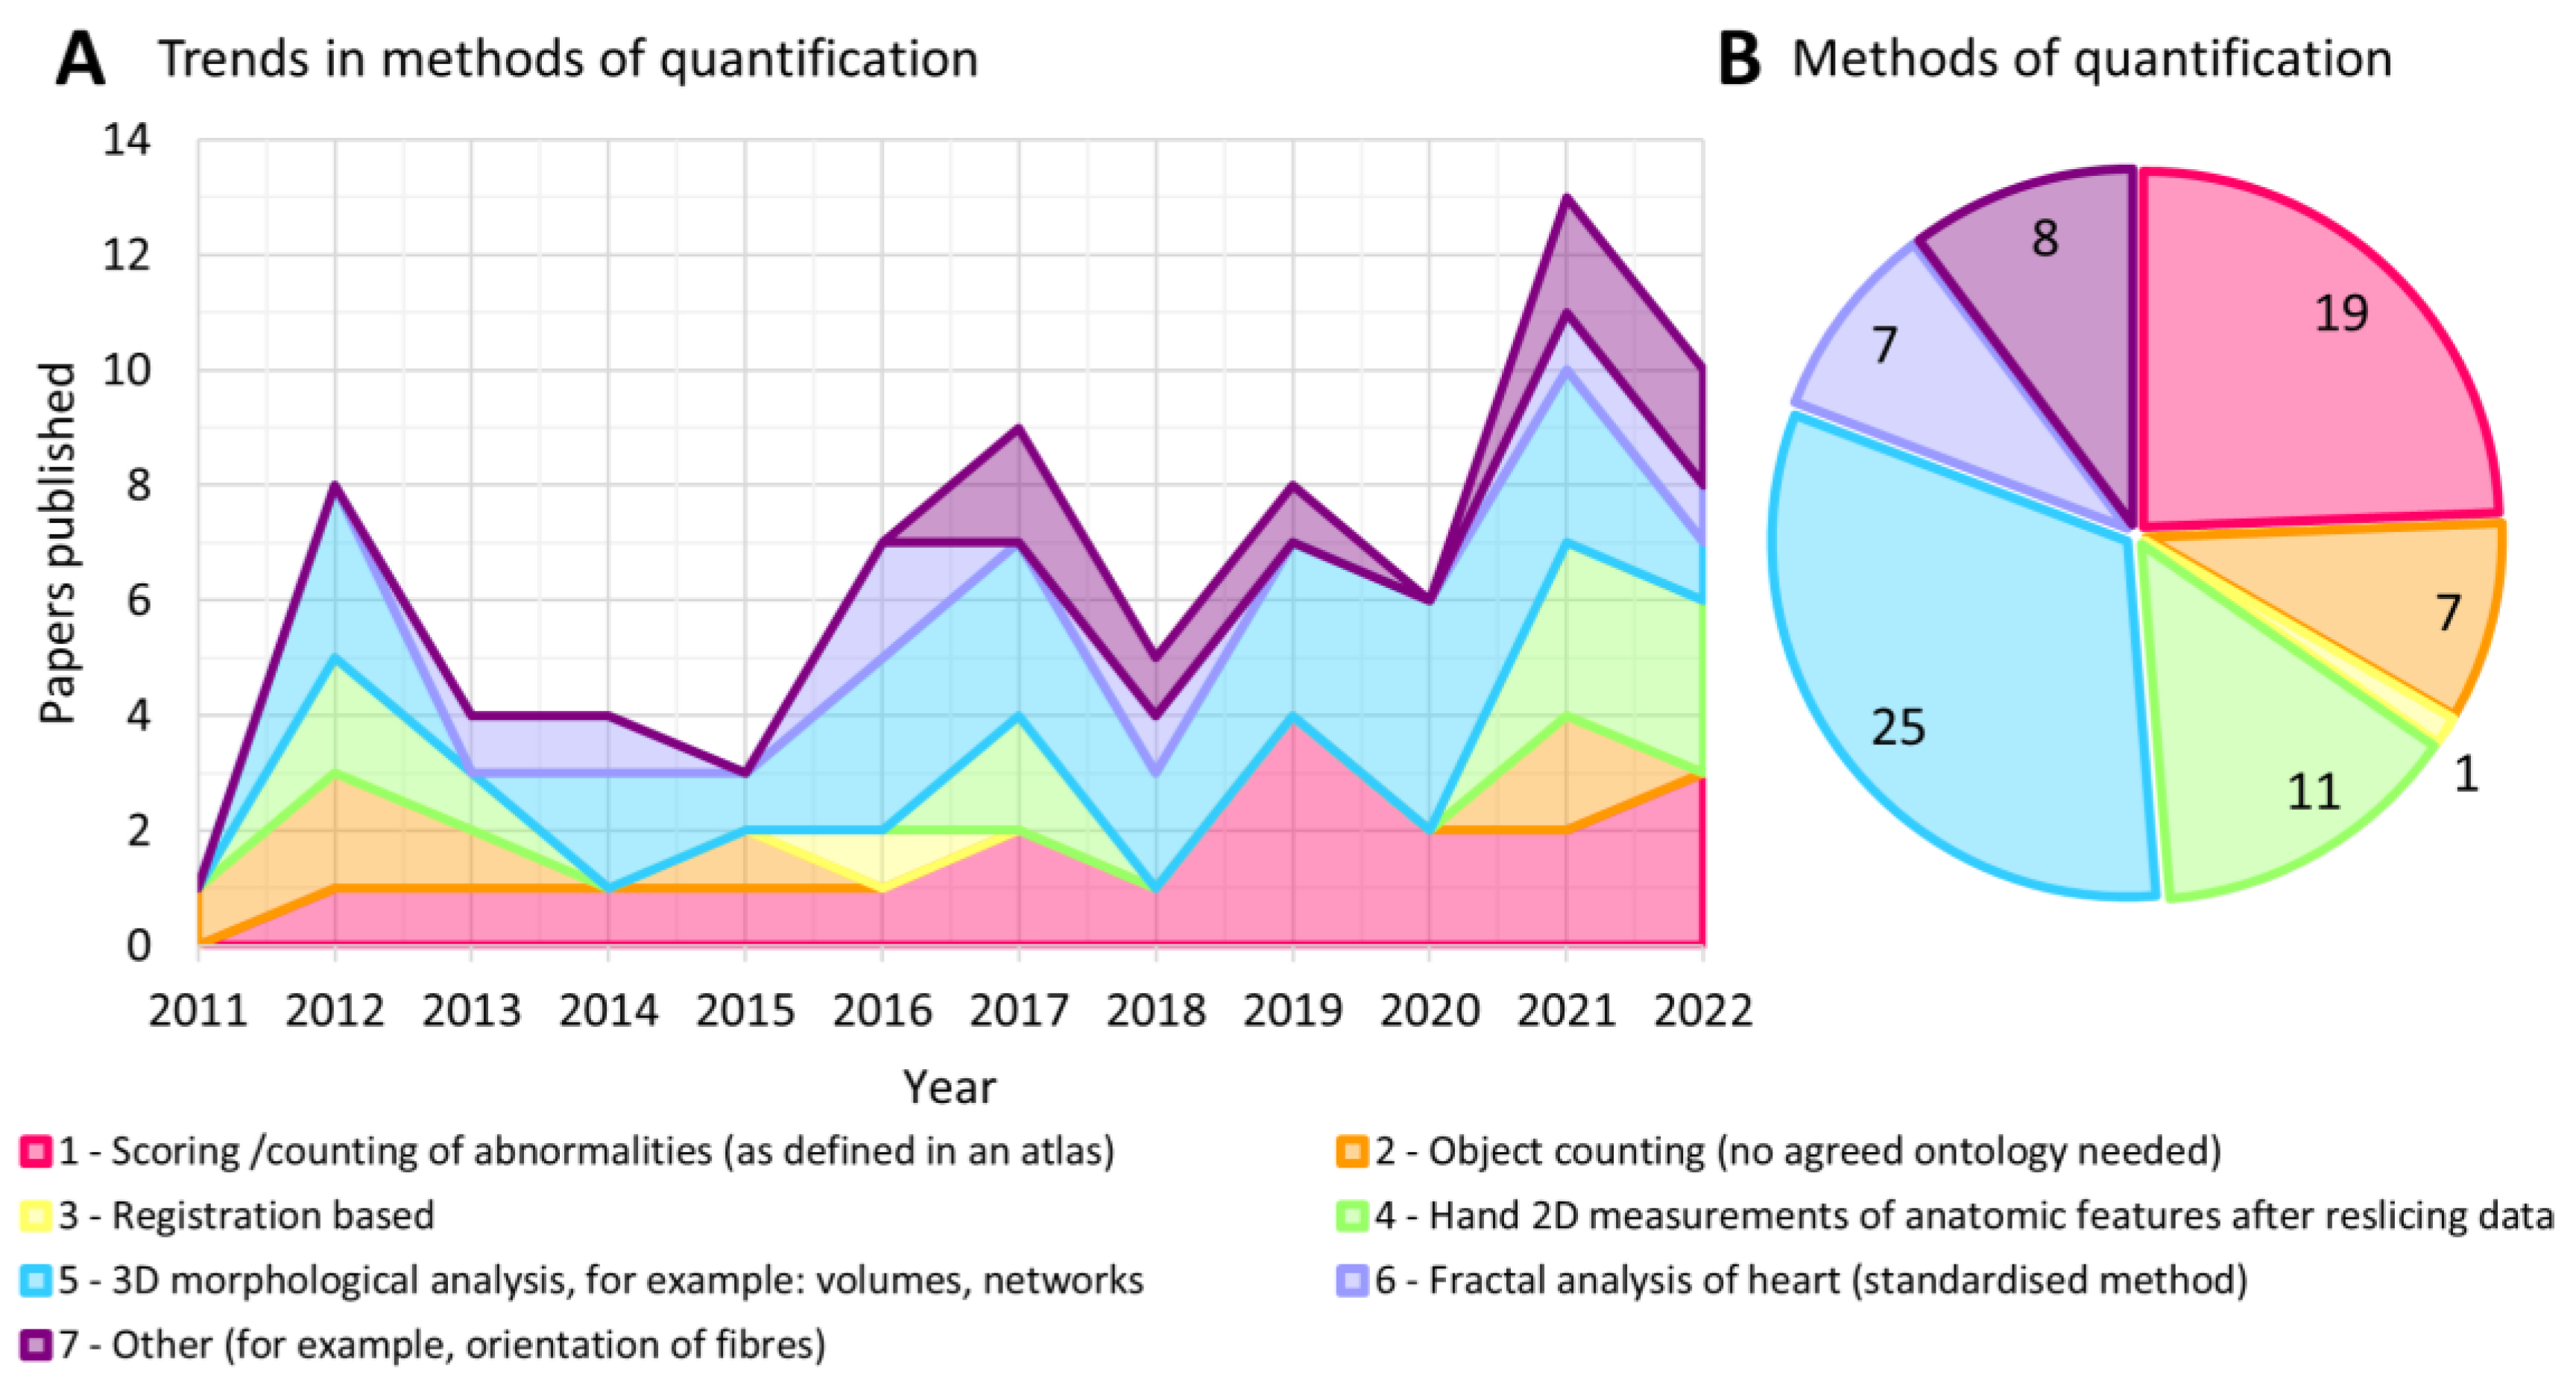
Figure 4.
(a) Software used for image analysis varied depending on the type of image annotation being performed. Amira was the most popular software for segmentation while OsiriX was more popular for object detection. ImageJ/Fiji was the most commonly used open source software. (b) The relative frequency of different annotation methods is shown in a bar chart, subdivided by annotation type (segmentation or object detection). Manual annotation was most common in both cases.
Disclaimer/Publisher’s Note: The statements, opinions and data contained in all publications are solely those of the individual author(s) and contributor(s) and not of MDPI and/or the editor(s). MDPI and/or the editor(s) disclaim responsibility for any injury to people or property resulting from any ideas, methods, instructions or products referred to in the content. |
© 2023 by the authors. Licensee MDPI, Basel, Switzerland. This article is an open access article distributed under the terms and conditions of the Creative Commons Attribution (CC BY) license (http://creativecommons.org/licenses/by/4.0/).
Copyright: This open access article is published under a Creative Commons CC BY 4.0 license, which permit the free download, distribution, and reuse, provided that the author and preprint are cited in any reuse.


