
Submitted:
24 January 2023
Posted:
25 January 2023
You are already at the latest version
Abstract
Mycobacterium leprae is the etiological agent of leprosy. Macrophages (Mφs) are key players involved in the pathogenesis of leprosy. In this study, immunohistochemical analysis was performed to examine the phenotype of Mφ subpopulations, namely M1, M2, and M4, in the skin lesions of patients diagnosed with Leprosy. Based on the database of treatment-naïve patients treated between 2015 and 2019 at the Department of Dermatology of the University of the State of Pará, Belém, routine clinical screening samples were identified. We performed simultaneous multiple immunostaining using monoclonal antibodies specific for inducible nitric oxide synthase (iNOS), IL-6, IL-10, IL-13, TNF-α, TGF-β, FGFb, CD163, CD68, arginase-1, MRP8, and MMP7. Our results demonstrated a statistically significant difference for the M1 phenotype among the Virchowian (VV) (4.5 ± 1.3, p < 0.0001), Borderline (1.6 ± 0.4, p < 0.0001), and tuberculoid (TT) (12.5 ± 1.8, p < 0.0001) clinical forms of leprosy. Additionally, the M2 phenotype showed a statistically significant difference among the VV (12.5 ± 2.3, p < 0.0001), Borderline (1.3 ± 0.2, p < 0.0001), and TT (3.2 ± 0.7, p < 0.0001) forms. For the M4 phenotype, a statistically significant difference was observed in the VV (9.8 ± 1.7, p < 0.0001), Borderline (1.2 ± 0.2, p < 0.0001), and TT (2.6 ± 0.7, p < 0.0001) forms. A significant correlation was observed between the VV M1 and M4 (r = 0.8712; p = 0.0000) and between the VV M2×TT M1 (r = 0.834; p = 0.0002) phenotypes. The M1 Mφs constituted the predominant Mφ subpopulation in the TT and Borderline forms of leprosy, whereas the M2 Mφs showed increased immunoexpression and M4 was the predominant Mφ phenotype in VV leprosy. These results confirm the relationship of the Mφ profile with chronic pathological processes of the inflammatory response in leprosy.
Keywords:
Leprosy
; macrophages
; immunohistochemistry
; immunology
1. Introduction
Leprosy is an infectious disease with low morbidity owing to the population's resistance to Mycobacterium leprae [1]. It has been demonstrated that during an inflammatory response, bone marrow-derived monocytes differentiate into macrophages (Mφs) to regulate innate and adaptive immunity, as well as maintain homeostasis in response to the development of inflammatory episodes during the course of the disease [2]. However, the immunological functions of Mφs are highly dependent on specific signals from antigen-specific immune cells and the microenvironment in which they reside [3].
Mφs are capable of undergoing phenotypic modification and expressing receptors and co-stimulatory molecules such as cytokines that induce the development of appropriate immunological responses [4]. Studies on Mφ polarization have demonstrated the relationship between M1 Mφs (MφM1) and MφM2 in Leprosy [5,6,7].
Classical activation of Mφs occurs via IFN-γ stimulation, which generates MφM1 with high pathogen-killing potential and upregulates the secretion of pro-inflammatory cytokines such as IL-6, IL-12, inducible nitric oxide synthase (iNOS), and TNF-α. The expressed molecules or factors are Janus kinase 1 (JAK1), JAK2, signal transducer and transcription activator 1 (STAT1), and STAT2 [4]. In the absence of IL-12, the phenotypic profile of Mφ deviates from that of the MφM2 [4].
MφM2 play a key role in the resolution of inflammation, promoting the removal of debris, and enabling an increase in the contractility of the smooth muscle, thereby contributing to the expulsion of pathogens [8]. Activation of MφM2 occurs when they are exposed to a microenvironment with IL-4 and IL-13 stimulation. MφM2 secrete IL-10, TGF-β, arginase-1 [4], and prostaglandin E2 and express JAK1, JAK2, JAK3, and STAT6 [4].
MφM1 and MφM2 mainly differ with respect to their receptors, effector functions, and cytokine production. Upon induction by lipopolysaccharides (LPSs) or IFN-γ, activated MφM1 of the Th1 lineage express high level of iNOS, which metabolizes arginine to nitric oxide and citrulline. In contrast, MφM2 of the Th2 lineage are characterized by their expression of arginase, which hydrolyzes arginine to ornithine and polyamines. Although M1/M2 polarization leads to opposing outcomes of inflammatory reactions, the balance between cytotoxicity (MφM1) and immunosuppression (MφM2) is vital for the homeostasis of the immune system [4]. A growing body of evidence suggests that a new Mφ subpopulation known as M4 is associated with the development of pro-inflammatory responses, oxidative stress, and tissue repair in the polar forms of leprosy [4,10].
The advancement of knowledge on immunology in recent years has contributed to a deeper understanding on the mechanisms involved in the pathogenesis of leprosy.
2. Materials and Methods
2.1. Patients and skin lesion samples
This was a cross-sectional study, in which we analyzed 42 skin lesion samples obtained from patients who were treated at the Dermatology Service of the State University of Pará between 2015 and 2019. All patients were treatment-naïve and diagnosed with Borderline (n = 14), TT (n = 14), or VV (n = 14) leprosy, according to the Madrid classification. Statistical analysis was performed using the BioStat 5.0 program. In univariate analysis, frequencies and measures of central tendency and dispersion were obtained, together with ANOVA. A threshold significance level of 5% (p ≤ 0.05) was adopted for all tests.
2.2. Immunostaining for Mφ characterization and Statistical Analysis
A simultaneous multiple immunostaining technique was employed to characterize MφM1, MφM2, and MφM4 using monoclonal antibodies specific for iNOS, IL-6, IL-10, IL-13, TGF-β, FGFb, TNF-α, CD68, CD163, arginase-1, Metalloproteinase 7 (MMP7), and MRP8, following the protocol of Quaresma et al. [11]. By examining the lesion area using a 400× zoom in microscope Zeiss Axio Imager Z1lens, immunomarkers were quantitatively analyzed by selecting five random fields. Each field was subdivided into regions of 0.0625 mm2 within an area of 10 × 10 mm2 delimited by the microscope lens. Only samples showing cells immunostained for at least two markers were considered positive. The data were stored in electronic spreadsheets using the EXCEL 2007 program and analyzed using the BioStat 5.0 and GraphPad Prism 9 program. In the univariate analysis, frequencies, measures of central tendency and dispersion were obtained and, for investigation of the hypotheses the one-way ANOVA and Tukey tests were applied. All tests were performed considering a significance level of 5% (p<0.05).
2.3. Ethical aspects
The study was approved by the Research Ethics Committee of the Federal University of Pará, under the approval number 2.338.865.
3. Results
The pattern of immunostaining for the macrophage subpopulations studied was characterized by the identification of brownish areas deposited in the cytoplasm or cell nucleus on the immunostained slides in a blue background stained with hematoxylin (Figure 1).
Quantitative analysis of the Mφ subpopulations (M1, M2, and M4) was performed based on three clinical forms of leprosy, namely VV, Borderline and TT. A statistically significant difference was observed between the three groups, as shown in Table 1.
The mean activity of MφM1 showed a statistically significant difference between VV (4.5 ± 1.3, p < 0.0001), Borderline (1.6 ± 0.4, p < 0.0001), and TT (12.5 ± 1.8, p < 0.0001) leprosy. Based on the MφM2 profile, a statistically significant difference was observed between VV (12.5 ± 2.3, p < 0.0001), Borderline (1.3 ± 0.2, p < 0.0001), and TT (3.2 ± 0.7, p < 0.0001) leprosy. Based on the MφM4 profile, a statistically significant difference was observed between VV (9.8 ± 1.7, p < 0.0001), Borderline (1.2 ± 0.2, p < 0.0001), and TT (2.6 ± 0.7, p < 0.0001) leprosy.
To improve characterization of Mφ levels in the three clinical forms, intra-lesion group as well as between lesion comparisons were performed. In the intra-lesion group comparison, a greater number of cells were observed in the M2 profile in VV (p = 0.0001) and in the M1 profile in Borderline (p = 0.0001) and TT (p = 0.0001) leprosy.
In addition, for the comparison of Mφ levels between lesions, statistical significance was observed for MφM1 in the TT form (p = 0.0001) as well as MφM2 and MφM4 in the VV form (p = 0.0001 for both).
Intergroup comparison revealed a greater cell dispersion of MφM1 in the TT form (Figure 2). Among the groups, both MφM2 and MφM4 showed greater dispersion in the VV clinical form group.
Intragroup comparison revealed an enhanced dispersion of MφM2 and MφM4 in the VV group (Figure 3). Additionally, MφM1 were predominant in the TT group, whereas there was no evidence of Mφ polarization in Borderline.

Table 2.
Linear correlation between M1, M2, and M4 macrophage phenotypes and the three clinical forms of leprosy. Our findings indicated many strong correlations between the study variables. A strong, highly significant positive linear correlation was observed between VV M1×VV M4 (r = 0.8712; p = 0.0000) and between VV M2×TT M1 (r = 0.834; p = 0.0002) (Figure 4 and Figure 5).
 |
Moderate linear correlations were observed for the VV M1×M1 TT (r = 0.6915; p = 0.0061; Figure 5), VV M4×TT M1 (r = 0.6961; p = 0.0057; Figure 6), VV M1×VV M2 (r = 0.6641; p = 0.0096; Figure 7), VV M2×M2 Borderline (r = -0.6513; p = 0.0116; Figure 8), TT M1×M2 Borderline (r = 0.6304; p = 0.0156; Figure 9), and VV M2×VV M4 (r = 0.5941; p = 0.0250; Figure 10) forms.
Other correlations between Mφ phenotypes and clinical forms of leprosy were moderate and weak (without statistical significance).
4. Discussion
Elucidation of the complex interaction between the tubercle bacillus and host remains a challenge for scientists, as it depends on the characteristics of virulence, evasion, and phenotype of the pathogen as well as factors related to the host's immune response mechanisms [10,11,12,13].
Our findings revealed that patients diagnosed with TT were positive for the MφM1 phenotype (p < 0.0001) compared to those with other clinical forms of the disease.
MφM1 are known to possess high microbicidal potential and secrete pro-inflammatory cytokines 4. In the early stages of bacterial infection, Mφ are classically polarized to the M1 phenotype which upregulates the expression of classic inflammatory phase markers, namely iNOS, IL-6, and TNF-α [10,14].
Elevated expression of stress response markers was observed in the M1 phenotype of TT lesions [15]. Real-time PCR assay has been employed to elucidate that the expression of CD38, Gpr18, and Fpr2 markers is exclusive to the M1 phenotype, and these markers are essential for cell activation and oxidative stress response mechanism [16,17].
During the pathogenesis of TT leprosy, IL-12 acts synergistically with IL-18 to increase the production of IFN-γ and ICAM3 via Th1 stimulation [18]. In leishmaniasis, which is also a spectral disease, IL-12 is essential for the development of an effective Th1 type of immune response [19]. The synergy between IL-1α and IL-12 serves to promote Th1 differentiation and prevent disease progression in BALB/c mice susceptible to L. major [20,21]. Sustained secretion of IL-12 is vital for the maintenance of the Th1 response associated with protection or disease progression in human leishmaniasis [22,23,24].
Immunohistochemical characterization of Mφs in the leprosy lesions remains an important pathological evidence of cell activation, oxidative stress response, Mφ polarization, and development of the pro-inflammatory response in leprosy [17,25]. Likewise, this evidence of tissue-protective response has already been demonstrated in a wide range of immunopathological studies on M. leprae, Helicobacter pylori, M. tuberculosis, Salmonella typhi, and Chlamydia trachomatis [25,26,27].
Studies have shown that these pathogenic microorganisms employ several evasion mechanisms to suppress pro-inflammatory response and activate MφM2 in the host cells [26,28].
Our findings further showed that the M2 phenotype was significantly different in the VV clinical form of leprosy (p < 0.0001), indicating a strong anti-inflammatory response triggered by this subpopulation of Mφs. It was suggested that the high bacterial load in the cells not only enhances the chronicity of the VV form but also increases the presence of MφM2.
Previous studies on H. pylori revealed that patients with a higher bacterial load showed an increased population of MφM2 and that H. pylori survives within the megasomes [29,30].
In a study on chronic gastritis without preneoplastic lesions, the presence of MφM2 was correlated with bacterial density, and during the chronic phase, H. pylori infection persisted in the host [30]. This course of persistent H. pylori infection results in a large influx of Mφs, suggesting the inefficiency of the immune response [31,32,33]. VV leprosy is characterized by an increase in anti-inflammatory cytokine levels, inhibition of Mφ activation, and the secretion of inflammatory mediators, which collectively enhance the survival of the bacillus via its immunosuppressive function [4,34,35]. Additionally, studies have shown that increased level of kynurenine metabolites induces the differentiation of regulatory T cells (Treg) and the secretion of cytokines that enhance the anti-inflammatory profile of Mφs in the Virchowian pole [36,37].
Autophagic proteins are known to promote the formation of phagolysosomes and the consequent degradation of apoptotic cells, thereby releasing anti-inflammatory mediators and polarization of MφM2 [38]. During the symptomatic infectious phase of leprosy, an accumulation of pathogen-infected apoptotic cells occurs [39,40], eliciting an inflammatory microenvironment [39].
Studies have revealed strong evidence indicating that mannose-binding lectin (MBL) can facilitate the ingestion and spread of intracellular pathogens via opsonization [41,42]. Infection by M. leprae can lead to the development of the most widespread form of the leprosy, known as lepromatous [43].
In leishmaniasis, oligosaccharides such as mannose and galactose are integrated into lipophosphoglycan structures and play a significant role in the survival of parasites within phagolysosomes by participating in the oxidative responses of Mφs [45].
Our findings showed a positive correlation between the M2 phenotype of the VV form and the M1 phenotype of TT form (r = 0.834, p = 0.0001), indicating the behavior of IDO in the Virchowian pole, whereby the presence of CD68 in this pole could be associated with the migration of activated Mφs to the infected host cells [46].
This finding may provide insights into the various clinical aspects of neural damage and the management of leprosy via multidrug treatment strategy [47]. Clinical manifestation of leprosy reactions may occur in the TT and VV forms of the disease [48].
Mononeuritis multiplex is the most common presentation of TT leprosy [48]. Segmental demyelination is a predominant clinical evidence in Virchowian lesions, whereas Wallerian degeneration is frequently observed in tuberculoid lesions. Therefore, the complex interaction between bacilli and host immunological factors determines the activation of pro- or anti-inflammatory responses [48,49,50,51].
In the efferocytosis of apoptotic cells infected with Streptococcus pneumoniae, a mixed profile of simultaneously activated MφM1 and MφM2 was observed, whereas the efferocytosis of apoptotic cells infected with Escherichia coli induced the activation of the M1 phenotype [52].
Both necrosis and apoptosis have been shown to be important mechanisms of cell injury related to mycobacteria, including M. leprae and M. tuberculosis [53,54]. Pyroptosis may serve as additional cell death mechanism during the course of leprosy, responding to tissue injury, inhibiting Mφ differentiation, and inducing its death [55].
In the presence of mycobacteria, MφM1 undergo phenotypic changes to resemble MφM2, which exhibit increased expression of CD163 and SRA-I and enhanced phagocytic capacity. Therefore, in patients with paucibacillary leprosy, efferocytosis contributes to the persistence of the bacillus, increasing the population of MφM2 and sustaining the infection [56].
Several studies have characterized MφM2 as immune cells associated with anti-inflammatory response and tissue repair, whereas MφM4 are associated with activation of pro-inflammatory response, oxidative stress responses, and tissue repair [4,10].
Results of our study revealed a significant increase in the M4 subpopulation in VV leprosy (p < 0.0001). These data confirm the similarity between MφM4 that affect treatment response in leprosy and the immunosuppressive behavior of the host [10,57,58].
The phenotypic similarity of Mφs was validated in a study on Mφ phenotype modulation using CXCL4 (M4) and M-CSF (M2), whereby similar mRNA expression levels, leukocyte counts, and myeloid marker protein levels were observed. Transcriptome analysis was performed to confirm the strong correlation between phenotypes of Mφs (r = 0.934 p < 0.0001) [59].
Furthermore, we found an association between MφM1 and MφM4 (r = 0.871, p = 0.0001) in the VV form, indicating that in the absence of the CD163 receptor, the MφM4 exhibit a cytokine secretion profile similar to that of the MφM1. In a study on Mφ polarization associated with atheromatous intraplaque hemorrhages, hemoglobin-induced Mφ polarization led to increased expression of IL-10, high level of the hemoglobin receptor inhibitor CD163, and low expression of HLA-DR [60].
Low CD163 expression has also been reported in other studies [61], and despite being the hallmark characteristic of M2 phenotype, it was observed that the chemokine CXCL4 induces an irreversible regulatory program of CD163 in MφM4 [62].
In the context of leprosy, this reduction in the costimulatory molecule levels enhances the formation of skin lesions [12,32]. This fact is evidenced in the clinical manifestations of the VV form, as the immune evasion of the bacillus enhances its proliferation and lesion formation [63,64].
Our findings reiterated that the M2 and M4 phenotypes are associated with the chronicity of the infection response and the ability of the immune cells to eliminate M. leprae. Additionally, these phenotypes could suppress oxidative stress-induced lipid degeneration, which is evidenced in the appearance of foamy Mφs with vacuoles filled with bacilli [65,66,67].
The increased expression of the M4 phenotype in unstable lesions suggests a strong correlation between the prevalence of MφM4 in human atherosclerotic plaques and their destabilization [68]. During a chronic condition such as atherosclerotic plaque, the M4 phenotype modulates the apoptosis of vascular smooth muscle cells, which contributes to plaque rupture [68]. These immune cells facilitate the formation of foamy Mφs via the accumulation of LDL, which is subsequently metabolized, causing harmful oxidative reactions, phagocytosis, and elimination of pathogens [62,69].
MMP7 is a well-defined marker of MφM4 [10]. MMPs can cleave growth factors to release active molecules [70], suppress immune responses after infection [71,72], and inactivate chemokine and inflammatory mediator secretion [73,74], thereby potentially affecting the host immune response to infection and cancer [75].
Our findings are in agreement with those of other studies, with regard to functional aspects, phenotypic heterogeneity, and tissue immune response of Mφs in infectious diseases [10], as well as the M2 and M4 [11,12,13,76] phenotypes.
In this study, a strong correlation was observed between the clinical manifestations observed in the patients with the Mφ phenotypes for the pro- and anti-inflammatory phases. Therefore, we inferred that the phenotype of Mφs is determined by the surface markers present on them (MφM1: iNOS, IL-6, and TNF-α; MφM2: IL-10, CD163, and IL-13; and MφM4: CD68, MMP7, and MRP8).
The presence of specific biomarkers for Mφ activation in leprosy indicates the dynamic and transient nature of this immune cell type. Regulatory Mφs upregulate expression of several biologically important proteins, including MMP and DC-STAMP, with the latter being expressed in stimulated Mφs and implicated in cancer cell survival [78].
The increased expression of DC-STAMP following the stimulation via the presence of FcγR crosslinking is associated with increased phagocytosis and reduced antigen presentation and cytokine production [79,80], thereby promoting an anti-inflammatory environment similar to that in VV leprosy [75].
Simultaneous immunostaining of skin samples from patients diagnosed with the Borderline form of leprosy showed a predominant M1 phenotype (p < 0.0001) when compared to other clinical forms of the disease.
Analysis on NLRP1 and NLPR3 inflammasomes showed significant correlations between caspase-1 and IL-1β levels in Borderline leprosy, compared to the VV and TT forms of leprosy. The host–pathogen interaction determines the course of the adaptive immune response in leprosy [55].
Genes responsible for the formation and maintenance of granulomas and the activation and differentiation of helper T cells have been shown to bridge the gap between immune regulation and adaptive immunity. Small changes in these factors can alter the risk of developing leprosy or its severity [81].
Studies have identified genes that are differentially expressed after M. leprae stimulation, regardless of the Mφ polarization condition. Additionally, upon M. leprae stimulation, Mφ polarization upregulates expression of numerous interferon-stimulated genes [82].
Activated MφM1 genes showed marked differential expression of genes involved in IFN type I regulation, Mφ activation, pathogen DNA recognition, and recruitment of effector cells to the inflammatory site in the presence of M. leprae genomic DNA [82]. Type I IFNs are associated with disseminated and progressive lepromatous lesions [83]. A recent study reported that different strains of M. tuberculosis elicit different NF-κB and IRF responses in human Mφs [84]. Therefore, further study on the modulation of Mφ phenotypic identity in the presence of diverse M. leprae strains is vital for the knowledge on the immunopathogenesis of the disease.
5. Conclusions
Leprosy is considered a neglected disease that represents a serious public health problem in developing countries. In this study, three phenotypes of Mφs, namely M1, M2, and M4, were characterized based on their immunoexpression of iNOS, IL6, IL-10, IL-13, TGF-β, FGFb, TNF-α, CD68, CD63, arginase-1, MMP7, and MRP8. Our key findings on leprosy are summarized as follows.
First, MφM1 predominated in the clinical forms of Borderline (p = 0.0001) and TT (p = 0.0001). MφM1 played a pro-inflammatory role, evidenced by the immunoexpression of the TNF-α, IL-6, and iNOS markers. Based on the immunoexpression pattern of MφM1 in the three clinical forms of leprosy, our data showed predominance of MφM1 in the TT form (p < 0.0001). Statistically significant differences were observed between the means of the clinical forms VV, Borderline, and TT with the subpopulation of MφM1 (p < 0.0001).
Second, MφM2 were the predominant Mφs in the VV clinical form (p = 0.0001) and characterized by their immunoexpression pattern with the markers IL-10, IL-13, TGF-β, FGFb, CD163, and arginase-1. The immunoexpression pattern of the M2 phenotype was significantly different in the VV clinical form (p = 0.0001). There were statistically significant differences between the means of the clinical forms (VV, Borderline, and TT) and the subpopulation of MφM2 (p = 0.0001).
Third, MφM4 predominated the Mφ subpopulations in VV leprosy (p = 0.0001), indicating the association between MφM4 and chronic pathological processes in leprosy. The pro-inflammatory function of MφM4 was indicated in their positive immunoexpression pattern for TNF-α, IL-6, CD68, MMP7, and MRP8. The immunoexpression pattern of the M4 phenotype was significantly correlated to the VV form of leprosy (p = 0.0001). ANOVA revealed statistically significant differences between the means of the three clinical forms (VV, Borderline and TT) and the subpopulation of MφM4 (p = 0.0001).
Fourth, our data also revealed a highly significant positive linear correlation between VV M1×VV M4 (r = 0.8712; p = 0.0000), as well as between VV M2×TT M1 (r = 0.834; p = 0.0002).
Supplementary Materials
Normal negative controls of liver samples with molecular and immunohistochemical tests for the main hepatotropic viruses, such as hepatitis A, B, C and D viruses and with preserved histological morphology, Figure S1: Negative controls.
Author Contributions
Designed the study, T.C.Q., LA.V., J.R.d.S., T.L.S.A. J.S.; performed lab tests,T.C.Q., J.R.d.S.; furnished reagents, H.T.F., J.R.S.; drafted the manuscript, T.C.Q., J.R.d.S. T.L.S.A., M.I.S.D. and J.A.S.Q. All authors have read and agreed to the published version of the manuscript.
Funding
National Council for Scientific and Technological Development (CNPq)/Brazil - 308600/2022-3 (JASQ).
Institutional Review Board Statement
The study was conducted in accordance with the Declaration of Helsinki, and approved by the Research Ethics Committee of the Federal Univerty of Pará, under the approval number 2.338.865.
Informed Consent Statement
Informed consent was obtained from all subjects involved in the study.
Data Availability Statement
The database used and/or analysed during the current study is not publicly accessible but can be available, upon reasonable request, from the corresponding authors.
Acknowledgments
The authors are grateful to PAPQ program (UFPA).
Conflicts of Interest
The authors declare no conflict of interest.
References
- Lastória JC, Abreu MAMM. (2014). Etiopathogenic aspects – Part 1. Brazilian Annals of Dermatology. 89 (2): 205–218. [CrossRef]
- Woods JA, Lu Q, Cedddia M. (2000). Exercise-induced modulation of macrophage function. Immunology and Cell Biology. 78: 545-553. [CrossRef]
- Kedzierska KE, Crowe SM. (2014). The role of Monocytes and Macrophages in the Pathogenesis of HIV-1 infection. Current Medicinal Chemistry. 9: 1893-1903. [CrossRef]
- Quaresma JAS. (2019). Organization of the Skin Immune System and Compartmentalized Immune Responses in Infectious Diseases. Clin Microbiol Rev. 32: e00034-18. [CrossRef]
- Mège JL, Mehraj V, Capo C. (2011). Macrophage polarization and bacterial infections. Curr Opin Infect Dis. 24: 230–234. . [CrossRef]
- Huang J, Brumell JH. (2014). Bacteria–autophagy interplay: a battle for survival. Nature Reviews Microbiology. 12 (2): 101–114. [CrossRef]
- Liehl P, Zuzarte-Luis, V.; Mota MM. (2015). Unveiling the pathogen behind the vacuole. Nature Reviews Microbiology. 13 (9): 589–598. [CrossRef]
- Nathan, C. (2014). Secretory products of macrophages: twenty-five years on. The Journal of Clinical Investigation. 10: 1-30. [CrossRef]
- Solinas G, Germano G, Montovani A. (2009). Tumor-associated macrophages (TAM) as major player of cancer-related inflammation. Journal of Leukocyte biology. 86: 1065-1073. [CrossRef]
- De Sousa JR, Da Costa Vasconcelos PF, Quaresma JAS. (2019). Functional aspects, phenotypic heterogeneity, and tissue immune response of macrophages in infectious diseases. Infect Drug Resist. 12: 2589-2611. [CrossRef]
- Quaresma JAS, Lima LW, Fuzii HT, Libonati RM, Pagliari C, Duarte MI. (2010). Immunohistochemical evaluation of macrophage activity and its relationship with apoptotic cell death in the polar forms of leprosy. Microb Pathog. Oct;49(4):135-40. [CrossRef]
- De Sousa JR, De Sousa RP, Aarão TL, Dias LB JR, Carneiro FR, Fuzii HT, Quaresma JAS. (2016). In situ expression of M2 macrophage subpopulation in leprosy skin lesions. Acta Trop. May; 157:108-14. [CrossRef]
- De Sousa JR, Sotto MN, Quaresma JAS. (2017). Leprosy As a Complex Infection: Breakdown of the Th1 and Th2 Immune Paradigm in the Immunopathogenesis of the Disease. Front Immunol. Nov 28; 8:1635. [CrossRef]
- Murray PJ, Allen JE, Biswas SK, Fisher EA, Gilroy DW, et al. (2014). Macrophage Activation and Polarization: Nomenclature and Experimental Guidelines. Immunity. 41: 14-20. [CrossRef]
- Hirai KE, De Sousa JR, Silva LM., Junior LBD, Furlaneto IP, et al. (2018). Endoplasmic Reticulum Stress Markers and Their Possible Implications in leprosy's Pathogenesis. Dis Markers. 16: 7067961. [CrossRef]
- Jablonski KA, Amici SA, Webb LM, Ruiz-Rosado JDED, Popovich PG, et al. (2015). Novel Markers to Delineate Murine M1 and M2 Macrophages. PLoS One. 23;10 (12): e0145342. [CrossRef]
- Biagioli M, Carino A, Cipriani S, Francisci D, Marchianò S, et al. (2017). The Bile Acid Receptor GPBAR1 Regulates the M1/M2 Phenotype of Intestinal Macrophages and Activation of GPBAR1 Rescues Mice from Murine Colitis. J Immunol. 15:199 (2): 718-733. [CrossRef]
- Santos DO, Miranda A, Suffys P, Rodrigues CR, Bourguignon SC, et al. (2007). Current Understanding of the Role of Dendritic Cells and Their Co-Stimulatory Molecules in Generating Efficient T Cell Responses in Lepromatous leprosy. Current Immunology Reviews. 3 (1): 77–85. [CrossRef]
- Okwor I, Uzonna JE. (2016). Pathways leading to interleukin-12 production and protective immunity in cutaneous leishmaniasis. Cell Immunol. 309: 32–36. [CrossRef]
- Von Stebut E, Belkaid Y, Jakob T, Sacks DL, Udey MC. (1988). Uptake of Leishmania major amastigotes results in activation and interleukin 12 release from murine skin-derived dendritic cells: implications for the initiation of anti-Leishmania immunity. J Exp Med. 188 (8): 1547–1552. [CrossRef]
- Von Stebut E, Ehrchen JM, Belkaid Y, Kostka SL, Molle K, et al. (2003). Interleukin 1alpha promotes Th1 differentiation and inhibits disease progression in Leishmania major-susceptible BALB/c mice. J Exp Med. 198 (2): 191–199. [CrossRef]
- Park AY, Hondowicz BD, Scott P. (2000). IL-12 is required to maintain a Th1 response during Leishmania major infection. J Immunol. 165 (2): 896–902. [CrossRef]
- Stobie L, Gurunathan S, Prussin C, Sacks DL, Glaichenhaus N, et al. (2000). The role of antigen and IL-12 in sustaining Th1 memory cells in vivo: IL-12 is required to maintain memory/effector Th1 cells sufficient to mediate protection to an infectious parasite challenge. Proc Natl Acad Sei USA. 97 (15): 8427–8432. [CrossRef]
- Park AY, Hondowicz B, Kopf M, Scott P. (2002). The role of IL-12 in maintaining resistance to Leishmania major. J Immunol. 168 (11): 5771–5777. [CrossRef]
- Novoselov VV, Sazonova MA, Ivanova EA, Orekhov AN. (2015). Study of the activated macrophage transcriptome. Exp Mol Pathol. 99: 575–580. [CrossRef]
- Sica A, Erreni M, Allavena P, Porta C. (2015). Macrophage polarization in pathology. Cell Mol Life Sci. 72: 4111–4126. [CrossRef]
- Tomioka H, Tatano Y, Maw WW, Sano C, Kanehiro Y, et al. (2012). Characteristics of suppressor macrophages induced by mycobacterial and protozoal infections in relation to alternatively activated M2 macrophages. Clin Dev Immunol. 2012: 1–19. [CrossRef]
- Ren Y, Khan FA, Pandupuspitasari NS, Zhang S. (2017). Immune evasion strategies of pathogens in macrophages: the potential for limiting pathogen transmission. Curr Issues Mol Biol. 21:21–40. [CrossRef]
- Borlace GN, Jones HF, Keep SJ, Butler RN, Brooks DA. (2011). Helicobacter pylori phagosome maturation in primary human macrophages. Gut Pathog. 3: 3–14. [CrossRef]
- Teixeira, SM. (2021). Evaluation of macrophage polarization in patients infected with Helicobacter pylori and in relation to host susceptibility. Thesis (Doctorate in Health Sciences) - São Luís, Federal University of Maranhão, 2021. 171p. Available online: https://tedebc.ufma.br/jspui/bitstream/tede/3187/2/SELMA-MALUF.pdf.
- Asim M, Chaturvedi R, Hoge S, Lewis ND, Singh K, et al. (2010). Helicobacter pylori induces ERK-dependent formation of a phospho-c-Fos c-Jun activator protein-1 complex that causes apoptosis in macrophages. J Biol Chem. 285:20343–20357. [CrossRef]
- Algood HMS, Cover TL. (2006). Helicobacter pylori persistence: An overview of interactions between H. pylori and host immune defenses. Clinical Microbiology Reviews, 19 (4): 597–613. [CrossRef]
- Matsumoto Y, Blanchard TG, Drakes ML, Basu M, Redline RW, et al. (2005). Eradication of Helicobacter pylori and resolution of gastritis in the gastric mucosa of IL-10-deficient mice. Helicobacter. 10 (5):407-15. [CrossRef]
- Quaresma JAS, Almeida FA, Aarão TLS, Miranda Soares LPMA, Nunes IMM, et al. (2012). Transforming growth factor β and apoptosis in leprosy skin lesions: possible relationship with the control of the tissue immune response in the Mycobacterium leprae infection. Microbes and Infection. 14 (9): 696–701. [CrossRef]
- Aarão TLS, Esteves NR, Esteves N, Soares LP, Pinto DDAS, et al. (2014). Relationship between growth factors and its implication in the pathogenesis of leprosy. Microbial Pathogenesis. 77: 66–72. [CrossRef]
- Moura DF, Mattos KA, Amadeu TP, Andrade PR, Sales JS, et al. (2012). CD163 favors Mycobacterium leprae survival and persistence by promoting anti-inflammatory pathways in lepromatous macrophages. European Journal of Immunology. 42 (11): 2925–2936. [CrossRef]
- Bobosha K, Wilson L, Van Meijgaarden KE, Bekele Y, Zewdie M, et al. (2014). T-Cell Regulation in Lepromatous Leprosy. PLoS Neglected Tropical Diseases. 8 (4): 2773. [CrossRef]
- Cunha LD, Yang M, Carter R, Guy C, Harris L, et al. (2018). LC3-Associated Phagocytosis in Myeloid Cells Promotes Tumor Immune Tolerance. Cell. 4;175(2):429-441.e16. [CrossRef]
- Torchinsky MB, Garaude J, Martin AP, Blander JM. (2009). Innate immune recognition of infected apoptotic cells directs T(H)17 cell differentiation. Nature. 5;458 (7234):78-82, 2009. [CrossRef]
- Dejani NN, Orlando AB, Niño VE, Penteado LA, Verdana FF, et al. (2018). A.I. Intestinal host defense outcome is dictated by PGE2 production during efferocytosis of infected cells. PNAS. 115 (36): E8469–E8478. [CrossRef]
- Ambrosio AR. (2005). Leishmania (Viannia) braziliensis: interaction of mannose-binding lectin with surface glycoconjugates and complement activation. An antibody-independent defence mechanism. Parasite Immunol. 27: 333-340. [CrossRef]
- De Miranda Santos IKF, Costa CHN, Krieger H, Feitosa MF, Zurakowski D, et al. (2001). Mannan-binding lectin enhances susceptibility to visceral leishmaniasis. Infect. Immun, 69: 5212-5215. [CrossRef]
- Carmo RF, Neves JRL, Oliveira PRS, Vasconcelos LRS, Souza CDF. (2021). The role of Mannose-binding lectin in leprosy: A systematic review. Infection, Genetics and Evolution. 93. [CrossRef]
- Forestier CL, Gao Q, Boons GJ. (2014). Leishmania lipophosphogly can: how to establish structure-activity relationships for this highly complex and multifunctional glycoconjugate? Front Cell Infect Microbiol. 4: 193. [CrossRef]
- Brandonisio O, Panaro MA, Marzio R, Marangi A, Faliero SM, et al. (1994). Impairment of the human fhagocyte oxidative responses cause by Leishmania lipophosphoglycan (LPG): in vitro studies. FEMS Immunol Med Microbiol. 8 (1): 57–62. [CrossRef]
- Sales JS, Lara FA, Amadeu TP, Fulco TO, Nery JAC, et al. (2011). The role of indoleamine 2, 3-dioxygenase in lepromatous leprosy immunosuppression. Clinical & Experimental Immunology. 165 (2): 251–263. Available online: https://www.arca.fiocruz.br/bitstream/icict/44255/2/mylena_pereira_ioc_mest_2020.pdf.
- Mendonça VM, Costa RD, Melo GEBA, Antunes CM, Teixeira AL. (2008). Leprosy immunology. Review article. An. Bras. Dermatol. 83 (4). [CrossRef]
- Khadilkar SV, Patil SB, Shetty VP. (2021). Neuropathies of leprosy. J Neurol Sci. 15;420: 117288. [CrossRef]
- Save MP, Shetty VP, Shetty KT, Antia NH. (2004). Alterations in neurofilament protein(s) in human leprous nerves: morphology, immunohistochemistry and Western immunoblot correlative study. Neurophatology and Applied Neurobiolog. 30 (6): 635-650. [CrossRef]
- Shetty VP, Antia NH, Jacobs JM. (1988). The pathology of early leprous neuropathy. Journal of the Neurological Sciences. 88 (1–3): 115-131. [CrossRef]
- Jacobs JM, Shetty VP, Antia NH. (1987). Teased fibre studies in leprous neuropathy. Journal of the Neurological Sciences. 79 (3): 301-313. [CrossRef]
- Salina ACG. (2020). Activation of M1/M2 macrophages by epherocytosis of infected apoptotic cells. Thesis (Doctorate in Science) – Ribeirão Preto, University of São Paulo, 2020.155p. https://www.teses.usp.br/teses/disponiveis/17/17147/tde-25082020-090635/publico/ANACAROLINAGUERTASALINAco.pdf.
- Quaresma JAS, Lima LW, Fuzii, HT, Libonati RMF, Pagliari C, et al. (2010). Immunohistochemical evaluation of macrophage activity and its relationship with apoptotic cell death in the polar forms of leprosy. Microbial Pathogenesis. 49 (4): 135–140. [CrossRef]
- Moraco AH, Kornfeld H. (2014). Cell death and autophagy in tuberculosis. Seminars in Immunology. 26: 497-511. [CrossRef]
- Siva LM, De Sousa JR, Hirai KE, Dias LBJR, Furlaneto IP, et al. (201). The Resist. 12 (11):.2231-2240. [CrossRef]
- Fulco TO, Andrade PR, Barbosa MGM, Pinto TG, Ferreira PF, et al. (2014). Effect of apoptotic cell recognition on macrophage polarization and mycobacterial persistence. Infection and Immunity, 82: (9) 3968–78. [CrossRef]
- Nikiforov NG, Kornienko VY, Karagodin VP, Orekhov AN. (2015). Macrophage activation in atherosclerosis. Message 1: Activation of macrophages normally and in atherosclerotic lesions. Patol Fiziol Eksp (3):128-31 Russian. [PubMed]
- Luo F, Sun X, Qu Z, Zhang X. (2016). Salmonella typhimurium-induced M1 macrophage polarization is dependent on the bacterial O antigen. World J Microbiol Biotechnol. 32: 1–7. [CrossRef]
- Gleissner CA. (2012). Macrophage phenotype modulation by CXCL4 in atherosclerosis. Front Physiol. 3 (1). [CrossRef]
- Boyle JJ, Johns M, Lo J, Chiodini A, Ambrose N, et al. (2011). Heme Induces Heme Oxygenase 1 via Nrf2 Role in the Homeostatic Macrophage Response to Intraplaque Hemorrhage. Arteriosclerosis, Thrombosis, and Vascular Biology. 31: 2685–2691. [CrossRef]
- Colin S, Chinetti-Gbaguidi G, Staels B. (2014). Macrophage phenotypes in atherosclerosis. ImmunologyReviews, 262: 1600-065X (Electronic): 153–166. [CrossRef]
- Gleissner CA, Shaked I, Little KM, Ley K. (2010). CXC chemokine ligand 4 induces a unique transcriptome in monocyte-derived macrophages. J Immunol. 84: 4810–4818. [CrossRef]
- Reibel F, Cambau E, Aubry A. (2015). Update on the epidemiology, diagnosis, and treatment of leprosy. Med Mal Infect. 45 (9): 383-93. [CrossRef]
- Fonseca ABL, Simon MV, Cazzaniga RA, Moura TR, Almeida RP, et al. (2017). The influence of innate and adaptative immune responses on the differential clinical outcomes of leprosy. Infectious Diseases of Poverty. 6 (1): 5. [CrossRef]
- Elamin AA, Stehr M, Singh M. (2012). Lipid Droplets and Mycobacterium leprae Infection. Journal of Pathogens. 2012: 1-10. [CrossRef]
- Kaur G, Kaur J. (2017). Multifaceted role of lipids in Mycobacterium leprae. Future Microbiol. 12: 315-335. [CrossRef]
- Mattos KA, Lara FA, Oliveira VG, Rodrigues LS, D'avila H, et al. (2011). Modulation of lipid droplets by Mycobacterium leprae in Schwann cells: a putative mechanism for host lipid acquisition and bacterial survival in phagosomes. Cell Microbiol. 13 (2): 259–273. [CrossRef]
- Erbel C, Tyka M, Helmes CM, Akhavanpoor M, Rupp G, et al. (2015). CXCL4-induced plaque macrophages can be specifically identified by co-expression of MMP7+S100A8+ in vitro and in vivo. Innate Immun. 21: 255–265. [CrossRef]
- Rojas J, Salazar J, Martínez MS, Palmar J, Bautista J, et al. (2015). Macrophage Heterogeneity and Plasticity: Impact of Macrophage Biomarkers on Atherosclerosis. Scientifica (Cairo). 2015: 851252. [CrossRef]
- Brizzi MF, Tarone G, Defilippi P. (2012). Extracellular matrix, integrins, and growth factors as tailors of the stem cell niche. Curr. Opin. Cell Biol..24: 645–651. [CrossRef]
- Mcmahan RS, Birkland TP, Smigiel KS, Vandivort TC, Rohani MG, et al. (2016). Stromelysin-2 (MMP10) Moderates Inflammation by Controlling Macrophage Activation. J Immunol. 1;197 (3): 899-909. [CrossRef]
- Koller FL, Dozier EA, Nam KT, Swee M, Birkland TP, et al. (2012). Lack of MMP10 exacerbates experimental colitis and promotes development of inflammation-associated colonic dysplasia. Lab Invest. 92 (12): 1749-59. [CrossRef]
- Van Den Steen PE, Husson SJ, Proost P, Van-Damme J, Opdenakker G. (2003). Carboxyterminal cleavage of the chemokines MIG and IP-10 by gelatinase B and neutrophil collagenase. Biochem Biophys Res Commun. 24;310 (3): 889-96. [CrossRef]
- Manicone AM, Mcguire JK. (2008). Matrix metalloproteinases as modulators of inflammation. Semin. Cell Dev. Biol. 19: 34–41. [CrossRef]
- Dalby E, Christensen SM, Wang JY, Hamidzadeh K, Chandrasekaran P, et al.(2020). Immune Complex- Driven Generation of Human Macrophages with Anti-Inflammatory and Growth-Promoting Activity Journal of immunology. 205 (1): 102-112. [CrossRef]
- Sousa JR, Dias F, Neto L, Sotto MN, Quaresma, JAS. (2018). Immunohistochemical characterization of the M4 macrophage population in leprosy skin lesions. BMC Infect Dis. 18: 576. [CrossRef]
- Chiu YH, Ritchlin CT. (2016). DC-STAMP: a key regulator in osteoclast differentiation. J. Cell. Physiol. 231: 2402–2407. [CrossRef]
- Zeng XX, Chu TJ, Yuan JY, Zhang W, Du YM, et al. (2015). Transmembrane 7 superfamily member 4 regulates cell cycle progression in breast cancer cells. Eur. Rev. Med. Pharmacol. Sci. 19: 4353–4361. [PubMed]
- Sawatani Y, Miyamoto T, Nagai S, Maruya M, Imai J, et al. (2008). The role of DC-STAMP in maintenance of immune tolerance through regulation of dendritic cell function. Int. Immunol. 20: 1259–1268. [CrossRef]
- Sanecka A, Ansems M, Prosser AC, Danielski K, Warner K, et al. (2011). DC-STAMP knock-down deregulates cytokine production and T-cell stimulatory capacity of LPS-matured dendritic cells. BMC Immunol. 12: 57. [CrossRef]
- Cardoso CC, Pereira AC, De Sales Marques C, Moraes MO. (2011). Leprosy susceptibility: genetic variations regulate innate and adaptive immunity, and disease outcome. Future Microbiol. May;6(5):533-49. [CrossRef]
- Marin A, Huss CV, Corbett J, Kim S, Mohl J, et al. (2021). Human macrophage polarization in the response to Mycobacterium leprae genomic DNA. Current Research in Microbial Sciences. 2: 10001. [CrossRef]
- Teles RM, Graeber TG, Kruitzik SR, Montoya D, Schenk M, et al. (2013). Type I interferon suppresses type II interferon-triggered human anti-mycobacterial responses. Sciense. 3 (339): 1448–1454. [CrossRef]
- Cervantes JL, Oak E, Garcia J, Liu H, Lorenzini PA, et al. (2019). Vitamin D modulates human macrophage response to Mycobacterium tuberculosis DNA. Tuberculosis (Edinb). May116S:S131-S137. [CrossRef]
Figure 1.
Immunostaining pattern of M1 (A), M2 (B), and M4 (C) macrophage subpopulations in leprosy lesion samples. (A) The M1 subpopulation characterized by the brownish labeling of iNOS in the cytoplasm of macrophages in the granuloma. (B) M2 macrophages expressing arginase-1 in the cytoplasm of these cells. (C) Double labeling of M4 macrophages for CD68 and MRP8, a hallmark of M4 macrophage subpopulations. Magnification: (A) and (B) 200x, (400x).
Figure 2.
Boxplots of comparison between groups of M1, M2, and M4 macrophages.
Figure 3.
Boxplots for intragroup comparison of clinical forms VV, TT, and Borderline.
Figure 4.
and 5: Correlation analysis showing the strongest associations between the study variables.
Figure 4.
and 5: Correlation analysis showing the strongest associations between the study variables.
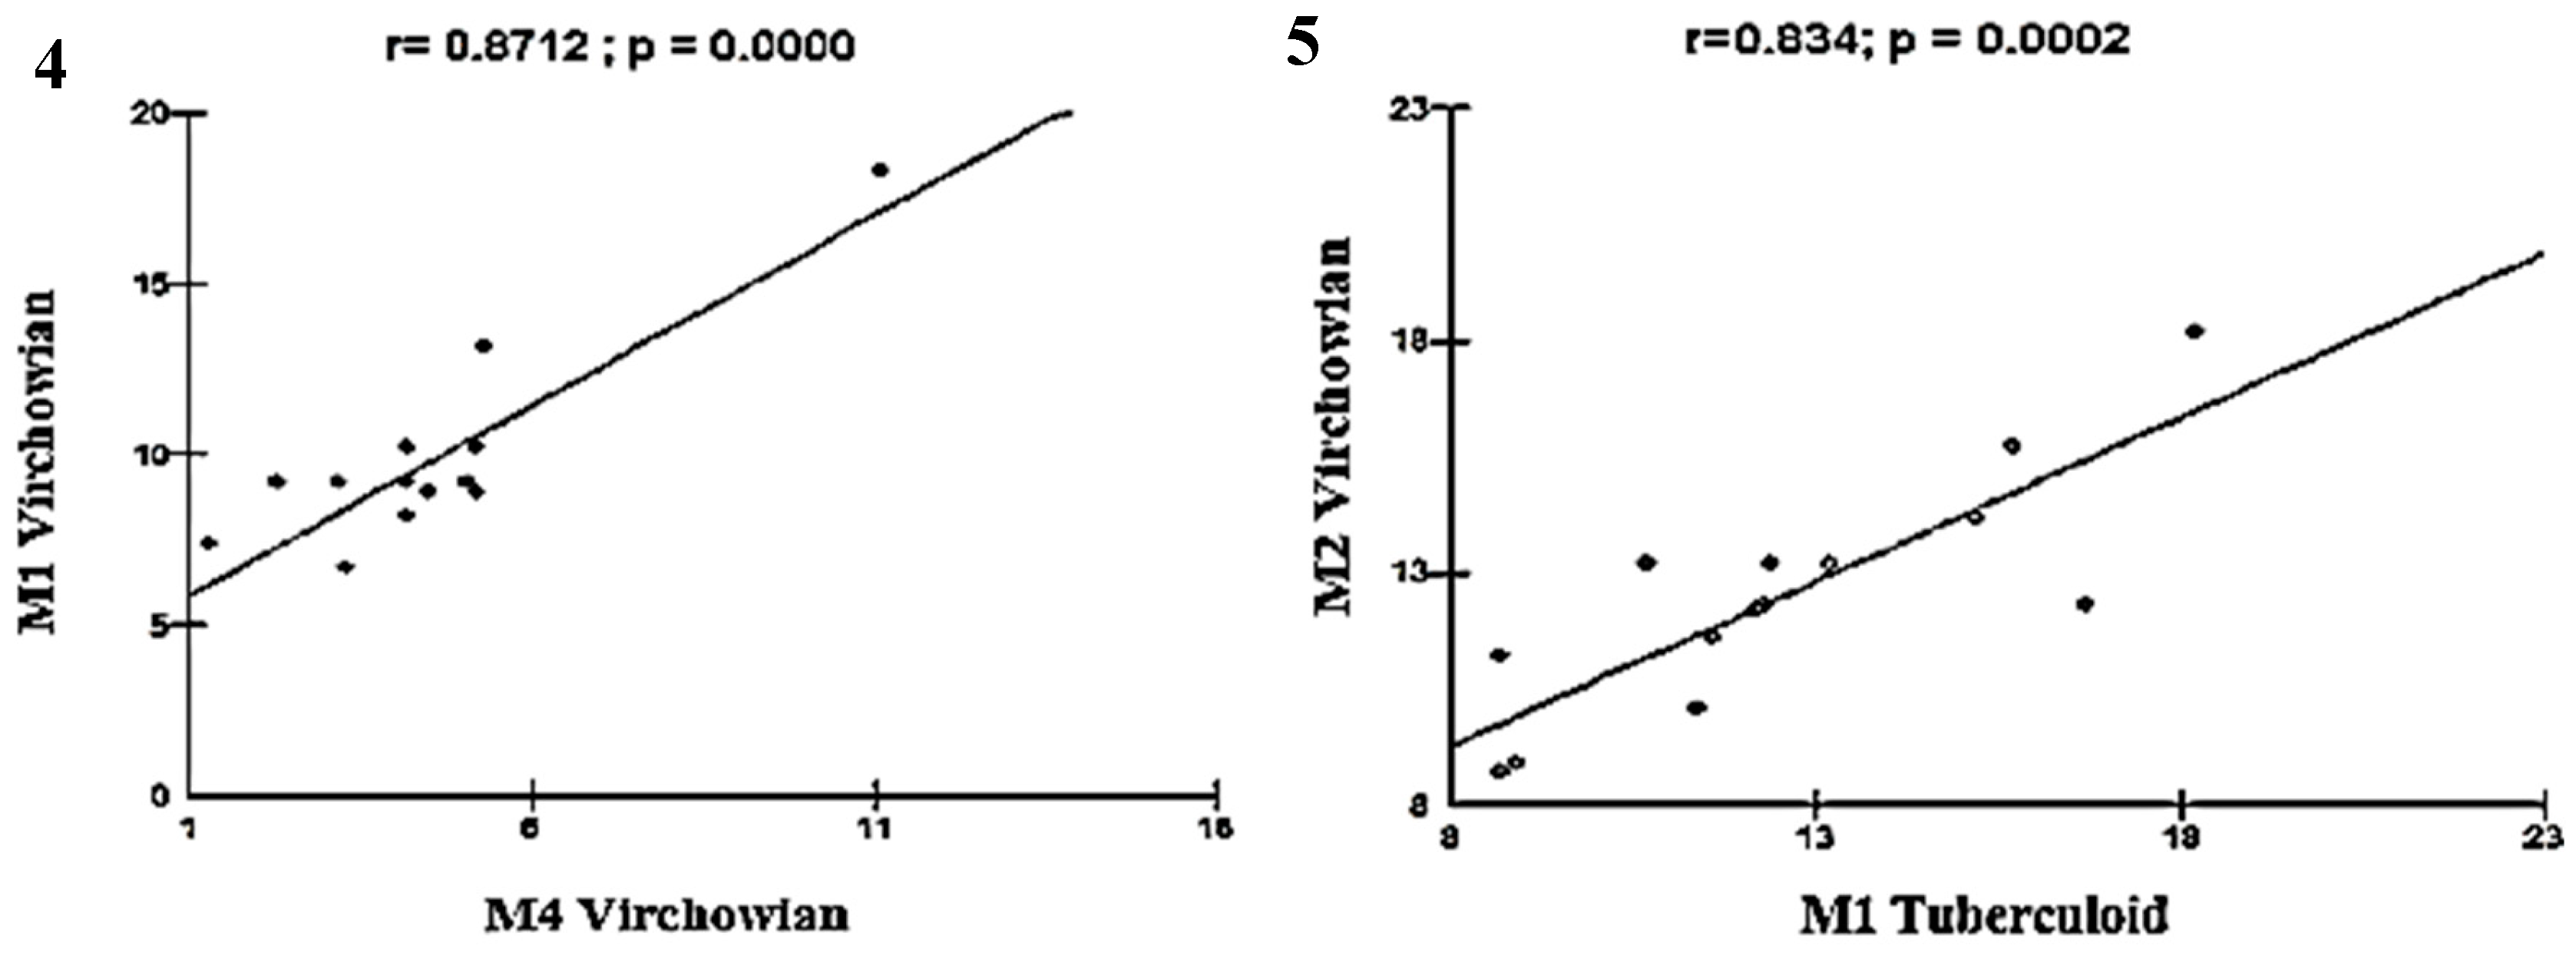
Figure 6.
and 7: Correlation analysis showing the moderate association between VV and TT.
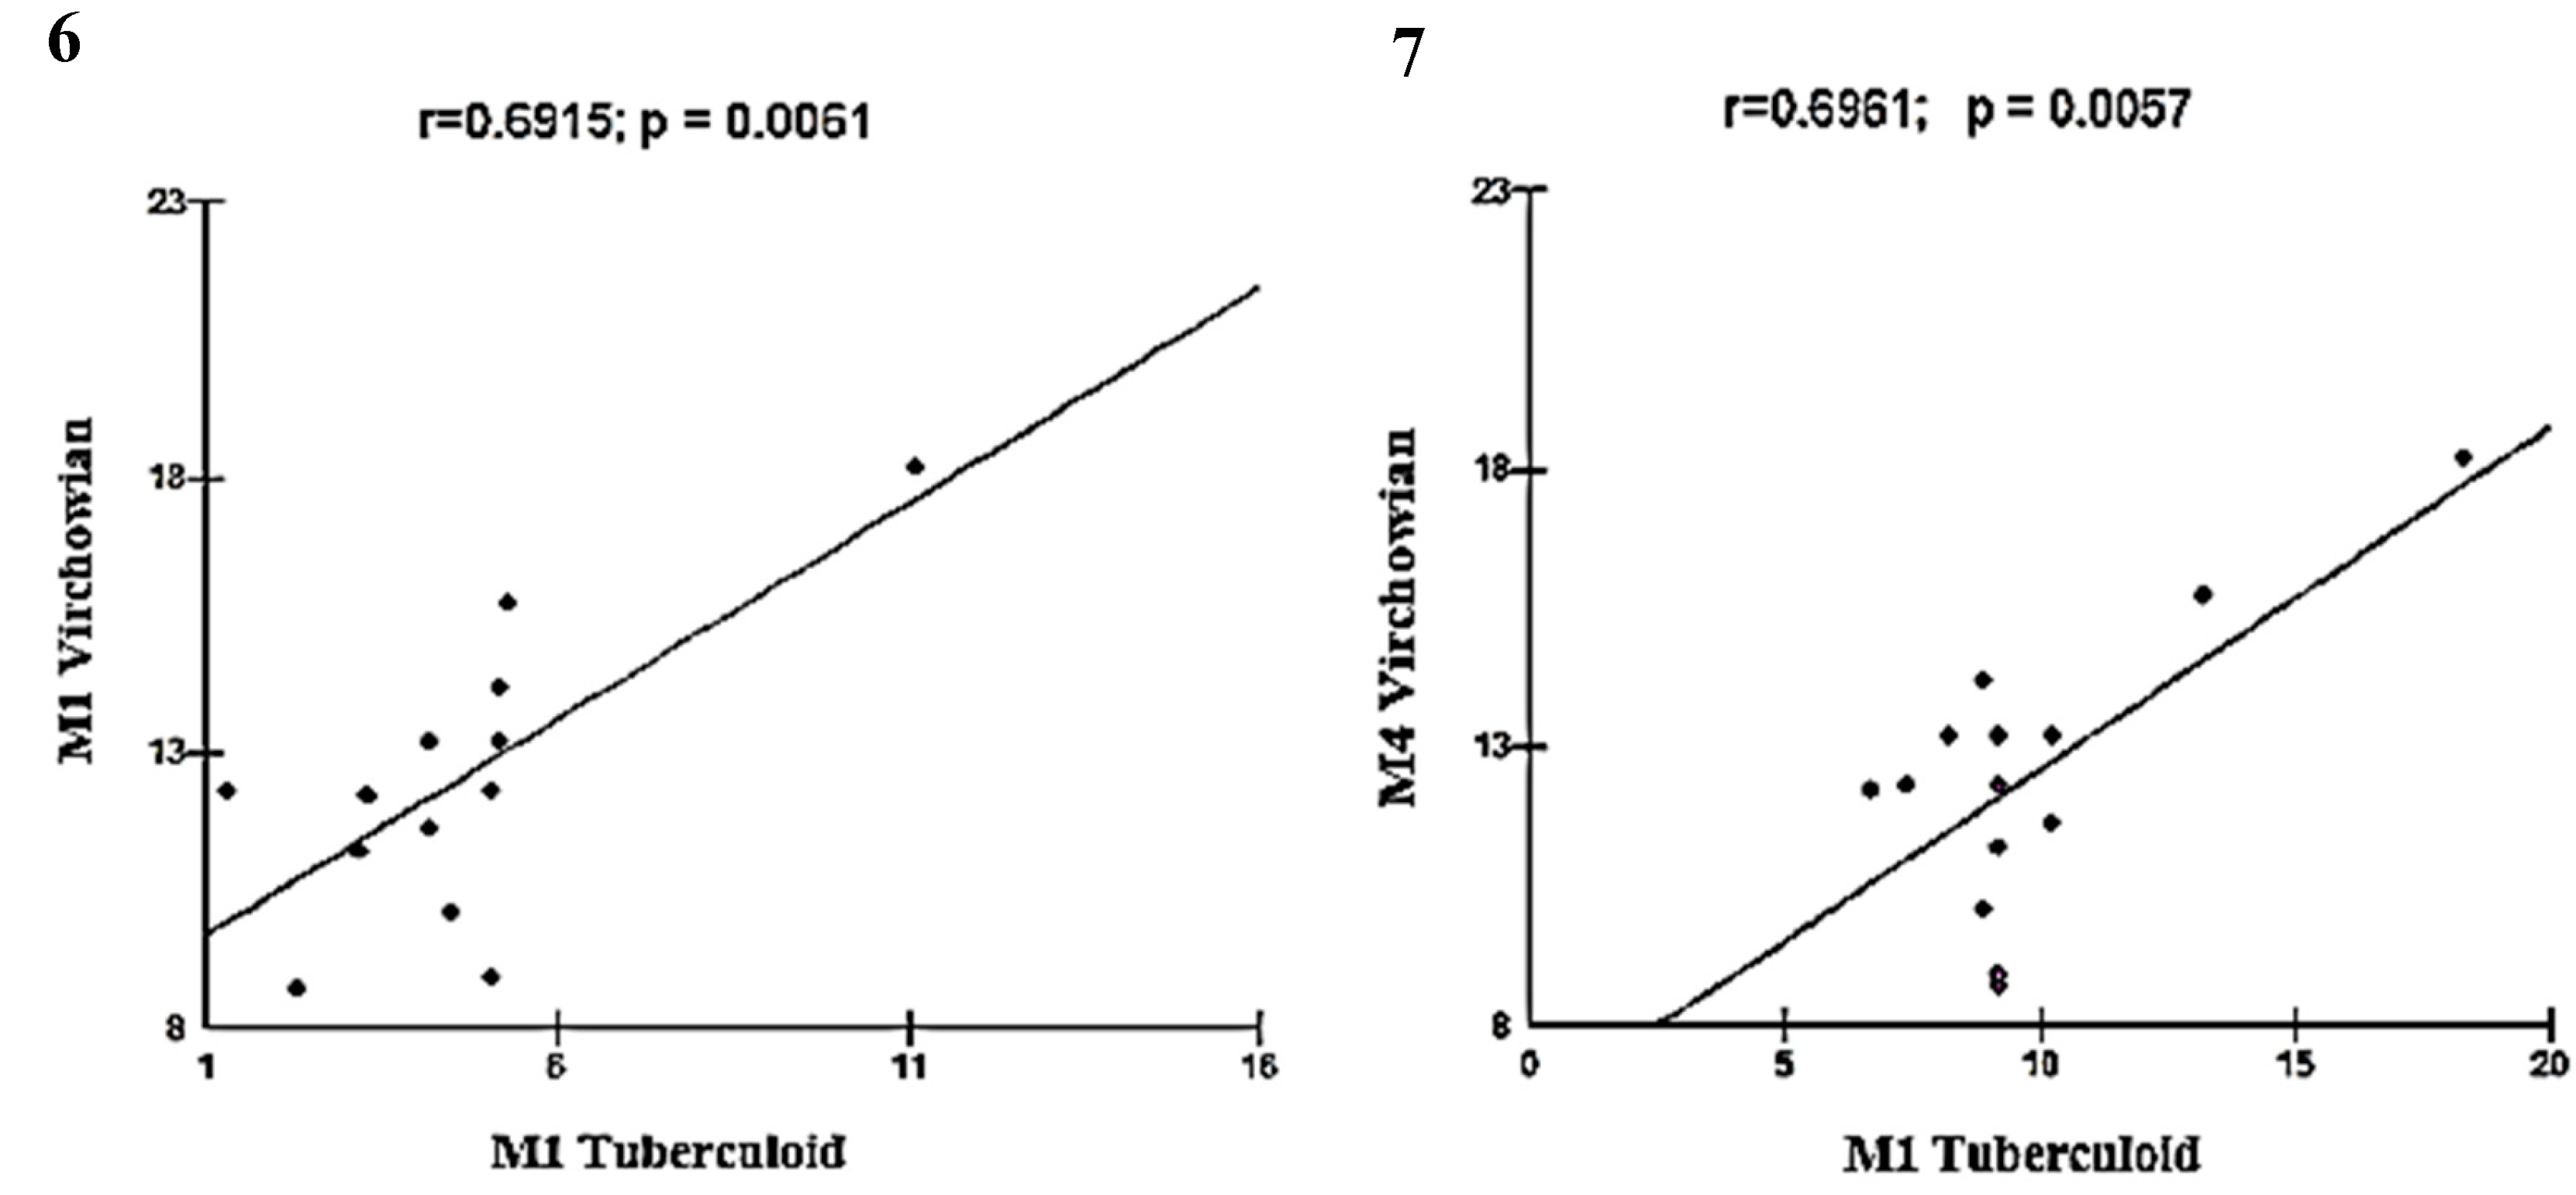
Figure 8.
and 9: Correlation analysis showing moderate association between VV and Borderline.
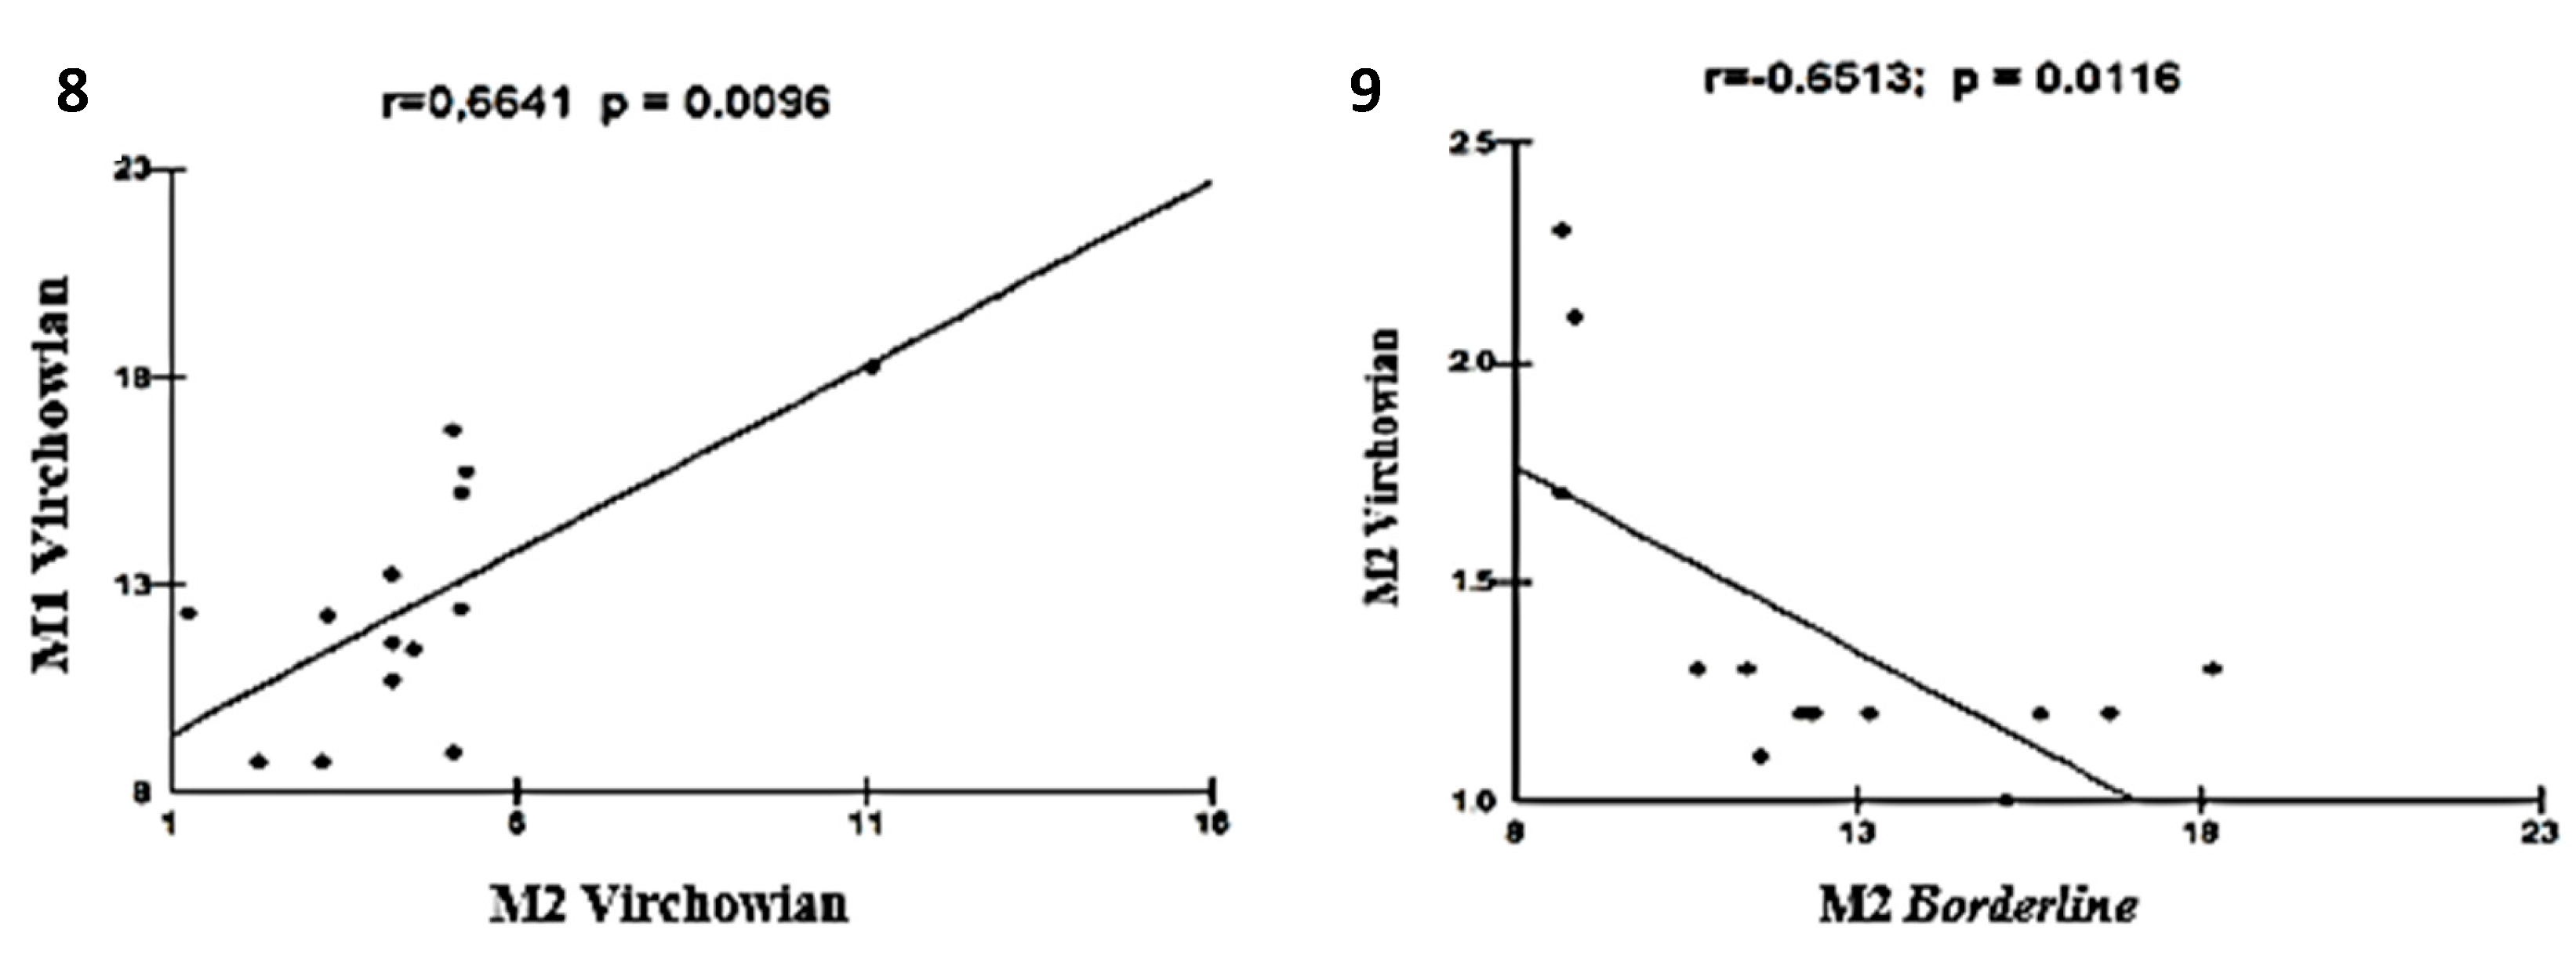
Figure 10.
and 11: Correlation analysis showing the moderate associations among Borderline, TT, and VV.
Figure 10.
and 11: Correlation analysis showing the moderate associations among Borderline, TT, and VV.
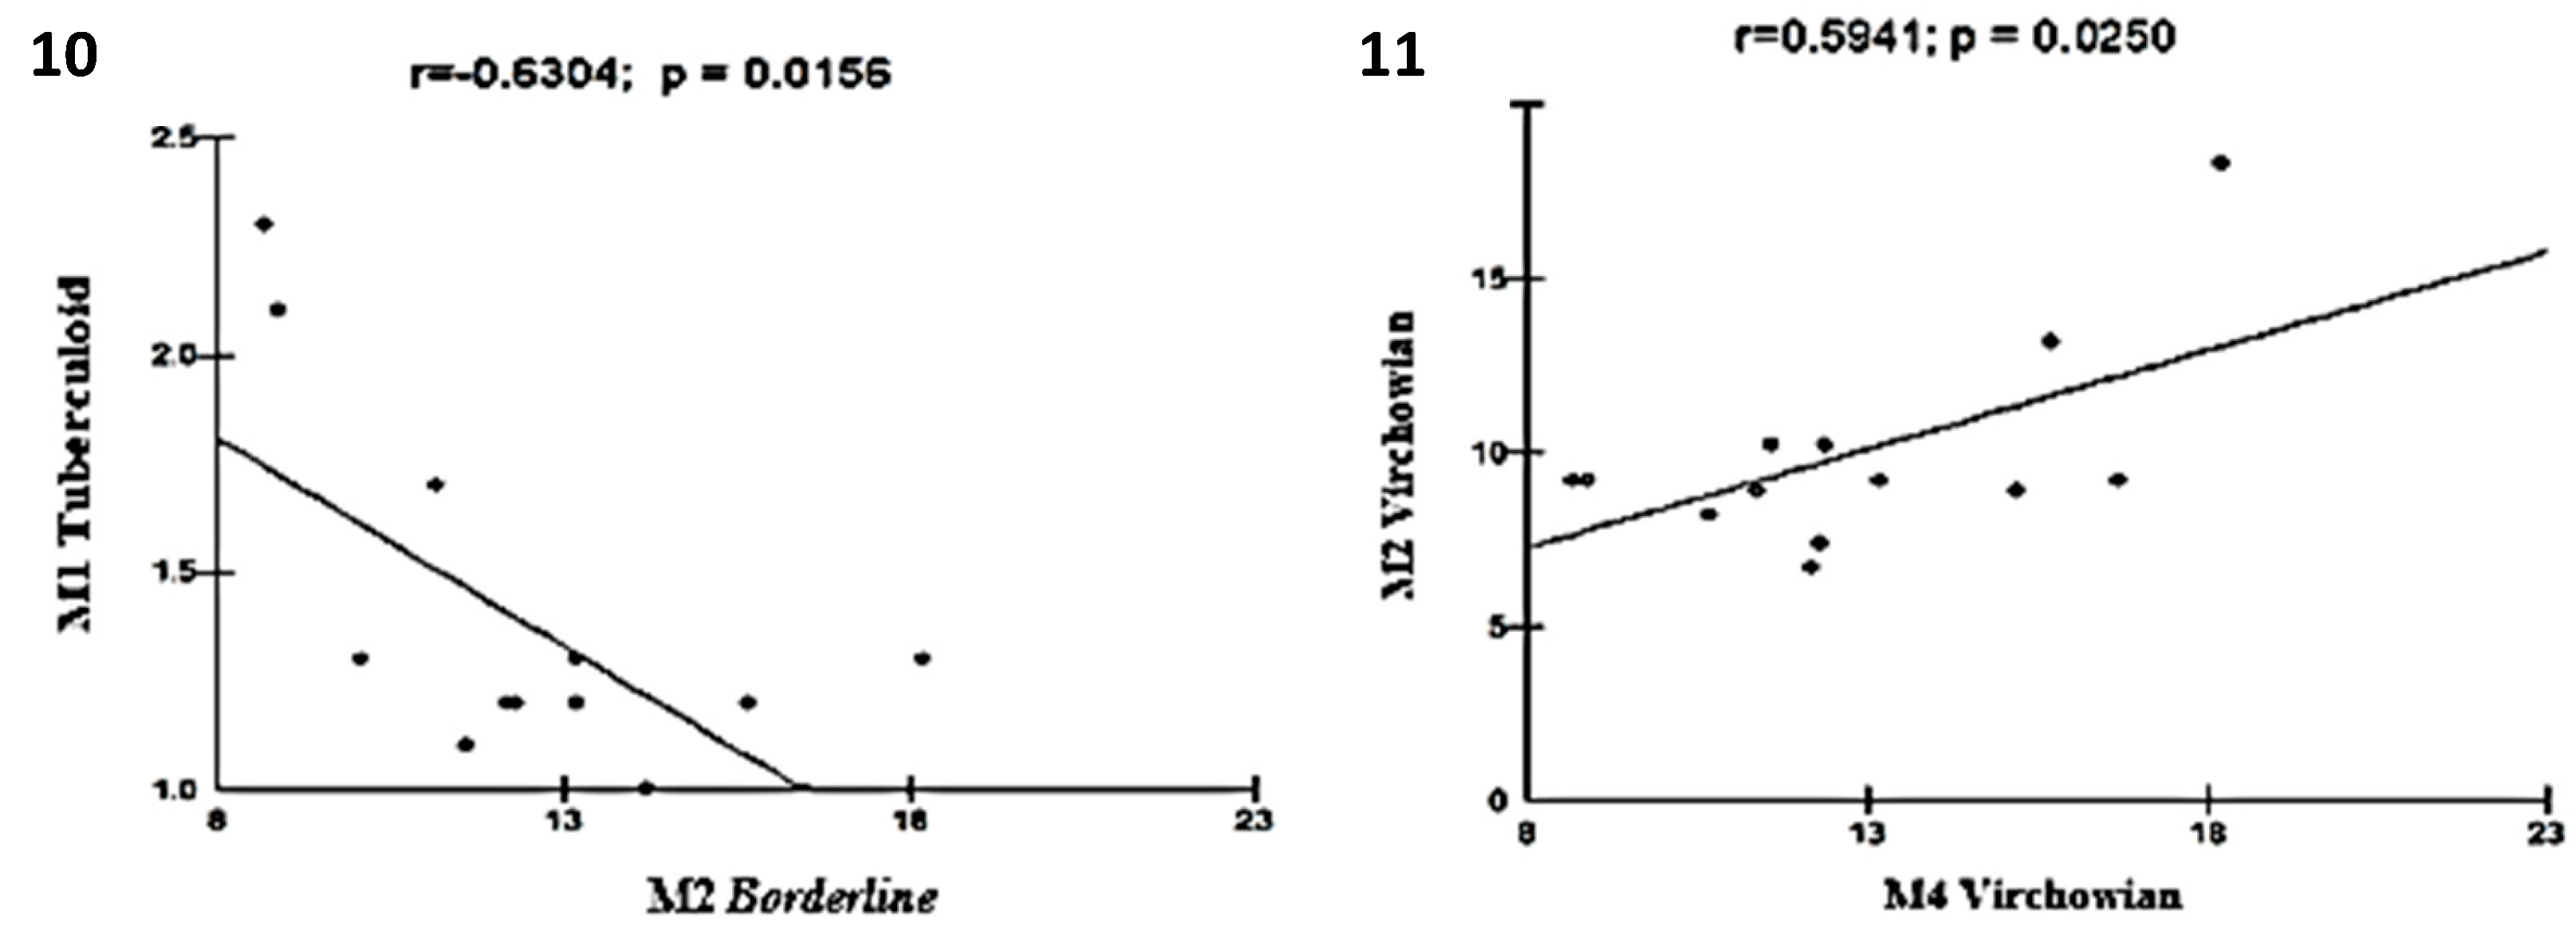
Table 1.
Quantitative analysis of macrophage profiles according to the clinical form of leprosy.
 |
Test: ANOVA, SD: standard deviation, 95% CI: 95% confidence interval. *One-way analysis of variance (p < 0.05)
Disclaimer/Publisher’s Note: The statements, opinions and data contained in all publications are solely those of the individual author(s) and contributor(s) and not of MDPI and/or the editor(s). MDPI and/or the editor(s) disclaim responsibility for any injury to people or property resulting from any ideas, methods, instructions or products referred to in the content. |
© 2023 by the authors. Licensee MDPI, Basel, Switzerland. This article is an open access article distributed under the terms and conditions of the Creative Commons Attribution (CC BY) license (http://creativecommons.org/licenses/by/4.0/).
Copyright: This open access article is published under a Creative Commons CC BY 4.0 license, which permit the free download, distribution, and reuse, provided that the author and preprint are cited in any reuse.


