Submitted:
12 January 2023
Posted:
16 January 2023
Read the latest preprint version here
Abstract
Following the central dogma of molecular biology, gene expression variability can aid in predicting and explaining the wide variety of protein products, functions, and, ultimately, variability in phenotypes. There is currently overlapping terminology used to describe the types of variability in gene expression profiles, and overlooking these nuances can misrepresent important biological information. Here, we describe transcriptional diversity as quantifying transcriptional changes as a measure of the variability in 1) the total expression of all genes or a gene across samples (transcriptome diversity) or 2) the isoform-specific expression of a given gene (isoform diversity). We first overview modulators and quantification of gene expression variability. Then, we discuss the role alternative splicing plays in driving transcript isoform expression variability and how isoform diversity can be quantified. Additionally, we overview computational resources for calculating transcriptome and isoform diversity for short- and long-read sequencing data. Finally, we discuss future applications of transcriptional diversity. This review provides a comprehensive overview of how gene expression variability arises, and how measuring it determines a more complete picture of heterogeneity across proteins, cells, tissues, organisms, and species
Keywords:
Gene expression
; transcriptome diversity
; isoform diversity
; transcriptional diversity
; transcrip-tional variation
; transcript diversity
1. Introduction
Following the central dogma of molecular biology, gene expression variability can aid in predicting and explaining the wide variety of protein products, functions, and, ultimately, variability in phenotypes. Over the past few decades, transcriptomic expression profiles have been assayed in many ways, with the two most common approaches being microarray-based and sequencing-based [1]. More recently, microarrays have been surpassed by Next-Generation Sequencing (NGS), also known as second-generation or short-read sequencing [2,3]. To assay gene expression with NGS technology (also known as RNA sequencing, RNA-Seq), RNA is first reverse-transcribed into cDNA, fragmented, and then constructed into an NGS library that is then read by the sequencer and then computationally mapped to the transcriptome for quantification [3]. The ability to barcode cells in combination with low-input protocols has also enabled single-cell RNA-Seq (scRNA-Seq) to measure the transcriptomic profiles of individual cells [4]. Most recently, third-generation or long-read sequencing popularized by Pacific Biosciences [5] (PacBio) and Oxford Nanopore Technologies [6] (ONT) has allowed the sequencing of contiguous reads of up to 2.3 million bases, considerably longer than the longest human messenger RNA (mRNA) transcripts [7]. These long reads are enabled by single-molecule real-time (SMRT) and ionic nanopore technology innovations by PacBio and ONT, respectively. In addition, long-read RNA-Seq (lrRNA-Seq) is capable of directly sequencing RNA and detecting its modifications, which was previously not possible with short-read technologies that require reverse transcription into cDNA [8]. Additionally, more technologies are being developed for the rapidly growing field of long-read sequencing at the single-cell level [9,10,11].
As both these and newer technologies continue to evolve with the goal of measuring transcriptomic profiles more precisely, the need to quantify and interpret those profiles continues to grow [9,10,11]. Dating back to microarray experiments, differential expression (DE) is the most common analysis of gene expression variability, and it is frequently used in both bulk RNA-Seq and scRNA-Seq. Generally, a basic DE analysis determines whether individual genes are up- or down-regulated (i.e., more highly or lowly expressed, respectively) between conditions, for example, across tissues [12,13] or disease states [14,15]. Popular R packages for differential gene expression include DESeq2 [16], EdgeR [17], and limma [18]. DE analysis is typically done at the gene level, collapsing all counts from a sequencing library that map to a single gene unit even though many genes undergo alternative splicing (AS) to produce several different mRNA molecules or isoforms. Alternatively, DE can also be examined at the isoform level by comparing reads mapped to each specific transcript as independent entities with the aforementioned [16,17,18] or other DE packages. Additional caveats of DE are that this analysis alone may miss biological complexity and information, that DE genes are often not causal (i.e., are disease-induced [19]), or that the function of causal genes changes but mRNA expression levels remain unchanged [20], and that interpretation must also account for biases associated with the expression level or abundance of reads for a particular gene [20]. Not all measured variability in gene expression profiles reflects changes in the conditions being studied because a portion may be due to technical variability (i.e., artifacts of sample processing and sequencing preparation). These caveats are also important considerations when performing DE analysis in scRNA-Seq [21].
An additional consideration for analyzing transcriptomic profiles is the need to quantify the complexity of biological systems because nothing in biology acts in isolation. To illustrate, a perturbed gene will likely have perturbed interactions with other genes and proteins in that biological system, which in turn may also contribute to phenotypic variability. There are different ways to assess these coordinated patterns of gene expression, such as grouping genes together by pathway or function in pathway analyses (e.g., KEGG [22] and GO [23]) to determine which pathways are up- or down-regulated between conditions. While this analytical approach considers genes in aggregate by function and interactions, it does not include all of their known or predicted interactions and genes can be part of multiple pathways, which confounds the analysis. Representing gene expression profiles as biological networks presents an alternative or complementary approach to differential gene expression analysis, and such networks have been shown to be dysregulated in disease [24]. For example, weighted gene co-expression network analysis (WGCNA) [25] examines which genes have coordinated co-expression. Combined with differential expression, WGCNA analysis can reveal differential co-expression associated with a disease state [26], like systemic lupus erythematosus (SLE) severity [27]. These network biology approaches, including gene regulatory networks (GRNs) and protein-protein interaction (PPI) networks, allow a researcher to incorporate additional information like the known targets of transcription factors or protein-protein interactions, respectively, to combine multiple information types and improve in silico predicted interactions within a condition [28].
However, the above approaches fail to describe how expression diversity changes between conditions. Transcriptional diversity quantifies transcriptomic changes as a measure of the variability in 1) the total expression of all genes or a gene across samples (transcriptome diversity) or 2) the isoform-specific expression of a given gene (isoform diversity) (Figure 1). For example, such approaches have identified unique disease-related genes across 16 human disease data sets compared to differential expression alone [29]. Here we review the causes and measurement of transcriptional diversity across samples, genes, and isoforms. We first overview modulators of gene expression variability and describe its quantification across genes. Then, we discuss the role AS plays in gene expression variability and how isoform diversity can be quantified. Additionally, we provide resources for calculating transcriptomic diversity for short- and long-read sequencing data. Finally, we discuss future applications for transcriptional diversity.
2. Transcriptome Diversity in Gene Expression Profiles
2.1. Biological Processes that Lead to Transcriptome Diversity
As gene expression analyses have become a critical tool for furthering phenotypic, mechanistic, and evolutionary interpretation, it is vital to understand the forces guiding gene expression variability [30]. Previous studies noted that genetic and environmental factors are the two main drivers of biological variability in gene expression [31]. However, additional intrinsic factors like cell cycle [32], circadian rhythm [33], and aging [34,35] (which are also influenced by genetic and environmental factors) also contribute to gene expression variability.
Promoters (DNA sequences where a protein binds and initiates transcription of a gene), enhancers (DNA sequences that bind proteins to alter transcription of a gene), and transcription factors (proteins that bind DNA sequences to control the rate of transcription of a gene) are key genetic features contributing to gene expression variability [36,37]. Though they each have a specific role, in combination they drive the overall gene expression variability observed across species, tissues, and cell types [36,37]. Known for their critical role in gene transcription, promoters have also been linked to gene regulation. The heavily studied RNA polymerase II core promoter directly regulates gene expression [38,39], and natural variations in promoter regions are linked directly to both gene expression and phenotype variability [40]. For example, a genome-wide association study (GWAS) recently identified the relationship between the promoter of the gene GSE5 to grain size variability of rice, where promoter deletions in specific rice varieties led to wider grains [40]. However, genes can also have multiple promoters, and coordinated usage of these various promoters, or alternative promoter usage, can drive transcriptional variability, for example, producing different transcripts of the brain-derived neurotrophic factor (BDNF) gene [41]. Promoters have also been used to control gene expression through technologies like CRISPR/Cas9 to further improve traits or understand the functionality of specific genes [42]. Likewise, the development and use of synthetic promoter libraries, which work by mutating regions (spacer sequences) near promoter consensus sequences to affect promoter strength, have exemplified the promoter’s role in driving gene expression variability [43,44].
Unlike promoters, enhancers are not necessary for transcription to occur but can increase the transcription of a gene, making it another key gene-expression regulatory element. By regulating transcription levels distally, enhancers also influence gene expression variability within specific cell types, tissues, and even species [45,46]. Similar to promoters, alteration in an enhancer region can lead to phenotype changes by impacting gene expression [47]. Naturally occurring variation among enhancers has been associated with diseases like Alzheimer’s disease and cardiomyopathy [37,48], further underscoring how enhancers can impact gene expression and disease phenotypes. Transcription factors are essential regulatory proteins that drive gene expression by interacting with DNA sequences like promoters and enhancers to control transcriptional processes [49,50]. For example, the transcription factors Sp1 and Sp3 control the expression of the IL-10 gene, which is vital in regulating immune responses [51]. Studies like the Encyclopedia of DNA Elements (ENCODE) project, which integrated over 450 experiments of 119 transcription factors, have demonstrated that transcription factors have dynamic regulatory networks that lead to measurable variability in homeostatic gene expression [52].
Additionally, epigenetic processes including DNA methylation, histone modifications, and other environmental or stress responses, can also drive gene expression variability. DNA methylation, notably mammalian m5C (methyl groups at the 5’ cytosine of a C-G dinucleotide) [53], regulates gene expression in multiple ways [54], including through transcription factor binding, the functionality of enhancers, insulator elements, and promoters, and by altering chromatin conformation [55]. Various studies have noted correlations between gene expression and DNA methylation, further supporting its role as a possible driver for gene expression variability [54,56]. Post-translational histone modifications (e.g., acetylation, methylation, phosphorylation, or ubiquitination) are also known to be correlated with gene expression [57,58,59] and can even be used to predict gene expression [58]. Environmental and stress-related effects, like hypoxia, can also impact the variability of gene expression. Many organismal studies have observed the impact of stress on producing a biological response and subsequent regulation of various genes to alleviate environmental damages (e.g., in oxidative stress) [60,61,62]. This environmental and stress response is an integral driver of the gene expression variability seen in agricultural, homeostatic, and disease-associated transcriptomic profiles. Finally, while not the focus of this review, additional biological processes contribute to the variability of gene products, such as post-transcriptional RNA modifications like m6A methylation [63] and other post-translational protein modifications like phosphorylation and acetylation.
2.2. Methods for Quantifying Transcriptome Diversity
Researchers have applied different approaches to empirically calculate gene expression variability for both bulk and single-cell transcriptome profiles, including standard deviation [64], coefficient of variation (CV) [29], variance [65], and others [66]. While the gene expression terms variation and diversity both describe changes in gene expression across samples, variation is more frequently associated with measures of dispersion (e.g., CV, variance), and diversity is more commonly associated with these probability-based measures, particularly Shannon or information entropy (Figure 2A). In fact, the application of CV and variance to gene expression profiling analysis is sometimes known as expression variance (EV) [66]. Originally described by Alemu et al., EV showed tissue-specific variation across gene expression profiles [67] and was later used to show expression variation associated with aging and methylation [68].
Standard deviation describes the dispersion of the data in relation to its mean. For example, standard deviation has been used to determine correlations between gene expression variation and tumor differentiation among individuals with prostate cancer [64]. Building on standard deviation, CV considers the standard deviation of the gene expression sample divided by its mean, and thus is a standardized measure [29]. Therefore CV can be used to compare across conditions or datasets to identify disease-associated genes that are not identified by DE alone [29]. Additionally, other studies have applied both technical CV and biological CV (BCV) to describe RNA-Seq gene expression variation associated with technical or biological variables, respectively, as well as [17] normalized CV to examine gene expression variation, for example, across neurological diseases [65]. Recent studies have also used CV to understand how gene expression variability among therapeutic targets determines drug effectiveness and safety, thus improving therapeutic development methodologies [69]. Another empirical measurement of gene expression is variance. In the Mar et al. study, variance measures the significance of the mean difference between groups by using a t-test or ANOVA [65], but the term has also been used synonymously with gene expression variability [65,68,70,71]. For example, Bachtiary et al. applied variance (here defined as standard deviation squared) to measure the variation of expression between and within cervical cancer patient samples [72].
Though CV, variance, and standard deviation are some of the most common methods for empirically calculating variation, there are a few less commonly used ways for describing variation across gene expression. The range of gene expression observed is one of the simplest measures of variability. Though generally not used in its simplest form (i.e., maximum value minus minimum value), a modified version of range has been used. For example, dynamic range, the log10 ratio between the maximum and minimum normalized gene expression counts, has been used to compare the expression of orthologous genes between humans and mice to determine genes constrained throughout early vertebrate evolution [73] as well as to describe gene expression variation patterns across organs and tissues [74]. Additionally, researchers have developed a metric based on a ratio of the percentage of reads covering a proportion of the genome to quantify gene expression variation [75]. When a large percentage of reads covers a smaller number of total genes in the genome, it indicates lower variability in that condition than when the percentage of reads spans over a larger set of genes in another condition. However, these metrics are biased towards longer genes if gene size is not properly accounted for during analysis.
In 1948, Shannon defined entropy as the probability of uncertainty of an outcome or the amount of choice in the outcome based on how much information [76]. The basis of Information Theory, Shannon entropy, is the log of the event probability so that an event with full certainty or a probability of one would have no surprise. Over the years, Shannon entropy has been applied to numerous biological processes, including gene expression [77]. When using Shannon entropy in this context, gene expression measurements for a specific gene are the information used to measure uncertainty, or as we describe it, diversity [78]. Previous studies have employed Shannon entropy to study diversity in drug targets [79], tissue-specificity [80], species-specificity [78], and even intraspecies genomic DNA information [81]. When used to compare gene expression in RNA-Seq data, differential Shannon entropy, compared to differential CV and DE, identified genes overlapping with CV-identified genes but also included unique disease-associated genes [29], underlining that Shannon entropy can identify biological signals that CV and DE do not. Shannon entropy has also been used in combination with WGCNA analyses by calculating entropy from the betweenness of networks [82]. Additionally, studies using adaptations of Shannon entropy, such as Tsallis entropy (also known as HCDT entropy), have divided transcriptome diversity into two categories: alpha and beta diversity [83], where alpha diversity represents diversity of a single profile, and beta diversity represents diversity between samples within a group. Example analytical packages that apply entropy in the context of gene expression diversity are described in Table 1.
Altogether, the aforementioned gene expression studies demonstrate not only the importance of further understanding the drivers of this gene expression diversity but also the importance of developing new and comprehensive ways to quantify this diversity through various methodologies. Quantifying transcriptome diversity is a salient part of ascertaining how biological processes lead to phenotypic manifestations, including in a disease context. Therefore, it is imperative to examine other sources of diversity, such as variability in mRNA transcripts due to AS.
3. Isoform Diversity in Gene Expression Profiles
3.1. Biological Processes that Lead to Isoform Diversity
Before the start of the human genome project, the human genome was expected to have approximately 100,000 genes [87] based on the approximated number of protein products. However, after completing the project, the human genome actually had between 20,000 and 25,000 genes, much less than projected [88]. While humans may not have more genes than all other organisms, their splicing patterns are more specific and complex [89]. Compared to other eukaryotic organisms, humans have the highest relative splicing abundance, and this abundance steadily decreases for species with a larger evolutionary divergence from humans [89]. Because 94% of human genes undergo AS [90], most genes have a variety of transcript isoforms that, in many cases, result in proteins with unique functions, therefore increasing protein diversity. There are between six and eight types of AS events depending on the classification used, and their abundance varies by species, with exon skipping being the most common in animals and intron retention more common in plants and fungi [91]. In addition to RNA splicing, differences in transcript usage in organisms can also be driven by promoter usage (as discussed above) or 3′ end usage [92]. In this section, we will focus on the variability driven by RNA splicing.
RNA splicing occurs as part of the process to produce mature mRNA from pre-RNA and was first described in 1977 [93]. RNA splicing happens in virtually all multi-exonic genes through either constitutive splicing (splicing out an intron that is always excluded from a final transcript) or AS (variably splicing out alternative exons and/or introns resulting in diverse mRNA sequences). Exons that are always incorporated in the final or mature transcript are described as constitutive exons, while alternatively-spliced exons are those that vary in usage from transcript to transcript [94]. This AS process is performed by the spliceosome, which contains approximately 170 proteins [95], including many RNA-protein complexes called small nuclear ribonucleoproteins (snRNPs), and recognizes splice sites to facilitate the transesterification reactions that lead to intron removal (further reviewed in [96,97,98]). A key property of AS is its high specialization to a given biological condition. For example, AS is species-specific [89], and as organisms gain more evolutionarily complexity, their AS patterns become more similar to humans. AS is also sex-specific and can lead to sex-specific traits. For example, in fruit flies (Drosophila), the sex splicing gene doublesex (dsx) controls sexual differentiation [99] and is regulated by AS. In addition to more extensive sex-specific splicing in fruit flies [100,101,102], sex-specific splicing has also been shown in fish [103], birds [104], non-human primates [105], and humans [106,107]. Moreover, AS is critical in developmental changes, particularly as coordinated AS changes help define tissue identity [98]. In fact, AS has been shown to be tissue-specific [108], driven at least in part by tissue-specific splicing factors [109]. These tissue-specific splicing factors govern complex splicing regulatory networks [110] that can influence protein interaction networks and thereby increase the functional diversity of proteins [111]. Further, AS is also highly cell-type specific [112], and the recent increase in single-cell studies has highlighted an increasing number of cases of AS that are cell-type and even cell-subtype specific [113]. This has been particularly well-documented in the brain during neuronal differentiation [114] (e.g., the cerebral cortex [112]) and in immune cells [115].
Changes in AS are also associated with many diseases [116,117]. Currently, an estimated 15% of human disease-causing point mutations result in an AS defect [118], and many diseases and disorders are associated with disrupted splicing patterns, like spinal muscular atrophy, cancer, and autism spectrum disorder (ASD) [119,120]. Because of all of these known changes in AS across numerous biological conditions, some pathogenic and others benign, it is critical for genomic researchers to quantify changes in AS using RNA sequencing.
3.2. Methods for Quantifying Isoform Diversity
Measuring alternatively-spliced transcript expression diversity requires first identifying and then quantifying transcripts from RNA-Seq data. One way to quantify alternatively spliced transcripts from gene expression data relies on identifying reads that cover splice junctions, genomic locus where two exons have been spliced together [121]. This process varies depending on the transcript quantification tool, as some tools only count if an exon is included at all (i.e., if any reads map to that exon), while others search for junctions to determine if an exon is actually spliced in, because reads mapping to a free exon (i.e., not including a junction) cannot resolve where in the transcript that exon has been spliced. A major limitation is that there must be sufficient read depth to detect all splice junctions from short-read data [122]. In some cases, junctions are specific to unique transcripts, so a read mapping to a unique junction could indicate that that transcript is being expressed without having any continuous reads capturing the entire transcript. One of these splice-junction-based methods is Splice Expression Variation Analysis (SEVA) [123], which compares the variability of the multivariate distribution of splice junction expression profiles between conditions. On the other hand, because short reads with few junctions usually do not match a unique transcript, probabilistic methods can be used to estimate exon inclusion [124] (also known as percent spliced in, PSI) [125], greatly reducing the precision of transcript quantification.
Differential transcript (or isoform) expression (DTE) is a data analysis method similar to differential gene expression as it identifies up- or down-expression of specific transcripts in one condition versus another. However, differential transcript usage (DTU), sometimes referred to as differential isoform usage, isoform switching, or differential splicing [126], can determine differential proportions of transcript expression within a gene across conditions [127]. Soneson et al. describe three methods for DTU: assembly-based, type of AS-based, and differential exon usage [127]. Due to limitations with short reads not covering entire transcripts that overlap, differential exon usage (DEU) can also be used in a similar way to measure shifts in functional unit expression (i.e., bins) across conditions, usually comparing PSI values [127]. Table 2 includes analysis packages comparing transcript expression across conditions and used for DTU, DEU (PSI), or other analyses.
However, short-read sequencing technology often fails to adequately resolve transcripts because the typical mRNA is over 1kb, whereas most short-read RNA-Seq data is only 100-200 bases in length [3], i.e., only long enough to cover an exon or less. The advent of long-read technologies has created an opportunity to capture more detailed gene expression profiles, especially for resolving transcript expression, but also for accurate sequencing and subsequent mapping of repetitive, hard-to-map, and/or duplicated gene regions [128]. Additionally, as lrRNA-Seq approaches can sequence full-length novel transcript isoforms, they are continuing to identify novel transcripts, including those that are lowly expressed [129]. While most of the short-read tools for transcript quantification can be used on long-read data, there are transcript quantification tools that are specialized for long-read sequencing data, like FLAIR [130] and BAMBU [131], which include steps for correcting misalignments that can result from less accurate reads. Applying variance and entropy-based diversity quantification approaches in combination with these lrRNA-Seq technologies, therefore captures transcriptomic changes across biological conditions and phenotypes.
Additionally, isoform diversity can be described by enumerating the total number of isoforms [132,133]. In contrast to only counting the number of transcripts, the distribution of isoform expression for a gene, such as in DTU, can also be considered. Similarly to the gene expression level, variance and Shannon entropy can be used to describe transcript isoform diversity (Figure 2) [134]. One way to measure isoform diversity is the Fano factor, or the squared variance over the mean [135], which describes the distribution of alternatively spliced transcripts while adjusting for the mean expression of that gene. Another method is by Shannon entropy, where a gene with many isoforms could be less diverse than a gene with few isoforms if the latter has a more even distribution of expression and perhaps equal usage of those gene products. Figure 2B provides an example of isoform diversity quantified with Shannon entropy.
The first instance of using Shannon entropy to describe diversity in three types of alternative transcription (AS, polyadenylation, and transcription initiation) using targeted microarray expression data was by Ritchie et al. in 2008 [134]. Ritchie et al.'s rationale was that Shannon entropy could capture aberrant transcription seen in cancer and was therefore used to compare patient cancerous tissue transcriptomic profiles with non-cancerous tissue transcriptomic profiles. The authors found that out of the three types of transcription studied, only AS had increased diversity in cancer tissues. They concluded that these changes in entropy are unlikely to reflect changes in gene function because they found it unlikely that, in a cancer context, shifts in isoform expression are functional or controlled. This general approach to measuring entropy has also been used to compare transcript diversity across conditions in the brain [128] and epithelial cells [136].
Several software approaches have been developed for quantifying isoform diversity with Shannon entropy, including Cuffdiff (from Cufflinks) [137,138,139], Whippet [140], and SplicingFactory [141]. Cuffdiff uses Jensen-Shannon divergence, which, like Shannon entropy, relies on probability to compare the distribution of transcript expression across conditions [139]. Whippet [140] applies Shannon entropy to define the entropy of individual AS events instead of at the gene level, meaning that each alternatively spliced exon is given a value based on PSI. SplicingFactory [141] is unique because it also includes multiple other methods for assaying diversity across isoforms of the same gene, like the Gini Index (originally developed for describing wealth inequalities) and the Simpson Index (originally developed to measure ecological diversity). The aforementioned Tsallis entropy could also potentially be used in an isoform context to describe biological variability since it has been shown to provide more information than Shannon entropy or Simpson Index alone by including a parameter (q) that can be manipulated to adjust the weight of highly-expressed genes [83], though it has not yet been applied to study alternatively-spliced isoform distributions.
To summarize, AS contributes to the gene expression diversity observed by increasing the number of products that can be produced by a single gene. Quantifying the isoform diversity of a given gene will not only identify which isoforms are highly expressed but how isoform expression shifts between conditions.
4. Conclusions
In conclusion, applying transcriptomic diversity when analyzing gene expression profiles is an integral analysis step to capturing biological information in tandem with the differential expression of individual genes. Critically, omitting isoform diversity from gene expression analysis can miss biological information since phenotypic diversity is partially driven by AS [91]. Quantifying transcriptional changes as a measure of the variability in 1) the total expression of all genes or a gene across samples (transcriptome diversity) or 2) the isoform-specific expression of a given gene (isoform diversity) are separate but complementary analyses. For example, transcriptome diversity can be quantified at the gene profile level across tissue samples in a population in order to identify the diversity and specificity of gene expression in tissue types [77]. Alternatively, if a research question relies on studying isoform usage and how specific transcript expression may be in a particular context, isoform diversity should be quantified. Combining both applications of diversity to better understand high-dimensional gene expression data can provide insight into the transcriptional differences between contexts and reveal gene expression differences that traditional DE analyses cannot like novel therapeutic targets [29].
This review provides an overview of the drivers of gene expression variability and diversity and describes how it has been quantified across all genes and at the isoform level. Additionally, we summarize resources for calculating diversity and variability. Applying additional variation and diversity measurements in transcriptomic analysis has the potential to capture additional gene expression profile changes between conditions and, in the future, could be adapted to additional gene expression profile analysis, such as spatial transcriptomic data. Clinically, these analyses may also elucidate new therapeutic targets for hard-to-treat disorders, further underscoring the importance of transcriptome diversity.
Acknowledgments
We thank Tabea Soelter for her thoughtful feedback on this manuscript. All figures were created using BioRender.com.
References
- Mantione, K.J.; Kream, R.M.; Kuzelova, H.; et al. Comparing bioinformatic gene expression profiling methods: microarray and RNA-Seq. Med. Sci. Monit. Basic Res. 2014, 20, 138–142. [Google Scholar] [CrossRef] [PubMed]
- Niedringhaus, T.P.; Milanova, D.; Kerby, M.B.; et al. Landscape of next-generation sequencing technologies. Anal. Chem. 2011, 83, 4327–4341. [Google Scholar] [CrossRef] [PubMed]
- Stark, R.; Grzelak, M.; Hadfield, J. RNA sequencing: the teenage years. Nat. Rev. Genet. 2019, 20, 631–656. [Google Scholar] [CrossRef] [PubMed]
- Haque, A.; Engel, J.; Teichmann, S.A.; et al. A practical guide to single-cell RNA-sequencing for biomedical research and clinical applications. Genome Med. 2017, 9, 75. [Google Scholar] [CrossRef] [PubMed]
- Wenger, A.M.; Peluso, P.; Rowell, W.J.; et al. Accurate circular consensus long-read sequencing improves variant detection and assembly of a human genome. Nat. Biotechnol. 2019, 37, 1155–1162. [Google Scholar] [CrossRef] [PubMed]
- Branton, D.; Deamer, D.W.; Marziali, A.; et al. The potential and challenges of nanopore sequencing. Nat. Biotechnol. 2008, 26, 1146–1153. [Google Scholar] [CrossRef] [PubMed]
- Amarasinghe, S.L.; Su, S.; Dong, X.; et al. Opportunities and challenges in long-read sequencing data analysis. Genome Biol. 2020, 21, 30. [Google Scholar] [CrossRef] [PubMed]
- Parker, M.T.; Knop, K.; Sherwood, A.V.; et al. Nanopore direct RNA sequencing maps the complexity of Arabidopsis mRNA processing and m6A modification. Elife 2020, 9. [Google Scholar] [CrossRef]
- Tian, L.; Jabbari, J.S.; Thijssen, R.; et al. Comprehensive characterization of single-cell full-length isoforms in human and mouse with long-read sequencing. Genome Biol. 2021, 22, 1–24. [Google Scholar] [CrossRef]
- Singh, M.; Al-Eryani, G.; Carswell, S.; et al. High-throughput targeted long-read single cell sequencing reveals the clonal and transcriptional landscape of lymphocytes. Nat. Commun. 2019, 10, 3120. [Google Scholar] [CrossRef]
- Hardwick, S.A.; Hu, W.; Joglekar, A.; et al. Single-nuclei isoform RNA sequencing unlocks barcoded exon connectivity in frozen brain tissue. Nat. Biotechnol. 2022, 1–11. [Google Scholar] [CrossRef] [PubMed]
- GTEx Consortium. The Genotype-Tissue Expression (GTEx) project. Nat. Genet. 2013, 45, 580–585. [Google Scholar] [CrossRef] [PubMed]
- Melé, M.; Ferreira, P.G.; Reverter, F.; et al. Human genomics. The human transcriptome across tissues and individuals. Science 2015, 348, 660–665. [Google Scholar] [CrossRef] [PubMed]
- Manczak, M.; Park, B.S.; Jung, Y.; et al. Differential expression of oxidative phosphorylation genes in patients with Alzheimer’s disease: implications for early mitochondrial dysfunction and oxidative damage. Neuromolecular Med. 2004, 5, 147–162. [Google Scholar] [CrossRef] [PubMed]
- Brown J 3rd, Theisler, C.; Silberman, S.; et al. Differential expression of cholesterol hydroxylases in Alzheimer’s disease. J. Biol. Chem. 2004, 279, 34674–34681. [CrossRef] [PubMed]
- Love, M.I.; Huber, W.; Anders, S. Moderated estimation of fold change and dispersion for RNA-seq data with DESeq2. Genome Biol. 2014, 15, 550. [Google Scholar] [CrossRef]
- McCarthy, D.J.; Chen, Y.; Smyth, G.K. Differential expression analysis of multifactor RNA-Seq experiments with respect to biological variation. Nucleic Acids Res. 2012, 40, 4288–4297. [Google Scholar] [CrossRef] [PubMed]
- Ritchie, M.E.; Phipson, B.; Wu, D.; et al. limma powers differential expression analyses for RNA-sequencing and microarray studies. Nucleic Acids Res. 2015, 43, e47. [Google Scholar] [CrossRef] [PubMed]
- Porcu, E.; Sadler, M.C.; Lepik, K.; et al. Differentially expressed genes reflect disease-induced rather than disease-causing changes in the transcriptome. Nat. Commun. 2021, 12, 5647. [Google Scholar] [CrossRef]
- Hudson, N.J.; Dalrymple, B.P.; Reverter, A. Beyond differential expression: the quest for causal mutations and effector molecules. BMC Genomics 2012, 13, 356. [Google Scholar] [CrossRef]
- Squair, J.W.; Gautier, M.; Kathe, C.; et al. Confronting false discoveries in single-cell differential expression. Nat. Commun. 2021, 12, 5692. [Google Scholar] [CrossRef] [PubMed]
- Kanehisa, M.; Sato, Y.; Kawashima, M.; et al. KEGG as a reference resource for gene and protein annotation. Nucleic Acids Res. 2016, 44, D457–62. [Google Scholar] [CrossRef] [PubMed]
- Gene Ontology Consortium. The Gene Ontology resource: enriching a GOld mine. Nucleic Acids Res. 2021, 49, D325–D334. [CrossRef] [PubMed]
- de la Fuente, A. From ‘differential expression’ to ‘differential networking’ – identification of dysfunctional regulatory networks in diseases. Trends Genet. 2010, 26, 326–333. [Google Scholar] [CrossRef] [PubMed]
- Langfelder, P.; Horvath, S. WGCNA: an R package for weighted correlation network analysis. BMC Bioinformatics 2008, 9, 559. [Google Scholar] [CrossRef] [PubMed]
- van Dam, S.; Võsa, U.; van der Graaf, A.; et al. Gene co-expression analysis for functional classification and gene-disease predictions. Brief. Bioinform. 2018, 19, 575–592. [Google Scholar] [CrossRef] [PubMed]
- Panwar, B.; Schmiedel, B.J.; Liang, S.; et al. Multi-cell type gene coexpression network analysis reveals coordinated interferon response and cross-cell type correlations in systemic lupus erythematosus. Genome Res. 2021, 31, 659–676. [Google Scholar] [CrossRef] [PubMed]
- Glass, K.; Huttenhower, C.; Quackenbush, J.; et al. Passing messages between biological networks to refine predicted interactions. PLoS One 2013, 8, e64832. [Google Scholar] [CrossRef]
- Wang, K.; Phillips, C.A.; Rogers, G.L.; et al. Differential Shannon entropy and differential coefficient of variation: alternatives and augmentations to differential expression in the search for disease-related genes. Int. J. Comput. Biol. Drug Des. 2014, 7, 183–194. [Google Scholar] [CrossRef]
- Storey, J.D.; Madeoy, J.; Strout, J.L.; et al. Gene-expression variation within and among human populations. Am. J. Hum. Genet. 2007, 80, 502–509. [Google Scholar] [CrossRef]
- Leek, J.T.; Storey, J.D. Capturing heterogeneity in gene expression studies by surrogate variable analysis. PLoS Genet. 2007, 3, 1724–1735. [Google Scholar] [CrossRef] [PubMed]
- Whitfield, M.L.; Sherlock, G.; Saldanha, A.J.; et al. Identification of genes periodically expressed in the human cell cycle and their expression in tumors. Mol. Biol. Cell 2002, 13, 1977–2000. [Google Scholar] [CrossRef]
- Zhang, R.; Lahens, N.F.; Ballance, H.I.; et al. A circadian gene expression atlas in mammals: implications for biology and medicine. Proc. Natl. Acad. Sci. U. S. A. 2014, 111, 16219–16224. [Google Scholar] [CrossRef] [PubMed]
- Viñuela, A.; Snoek, L.B.; Riksen, J.A.G.; et al. Genome-wide gene expression regulation as a function of genotype and age in C. elegans. Genome Res. 2010, 20, 929–937. [Google Scholar] [CrossRef] [PubMed]
- Viñuela, A.; Brown, A.A.; Buil, A.; et al. Age-dependent changes in mean and variance of gene expression across tissues in a twin cohort. Hum. Mol. Genet. 2018, 27, 732–741. [Google Scholar] [CrossRef] [PubMed]
- Schoenfelder, S.; Fraser, P. Long-range enhancer-promoter contacts in gene expression control. Nat. Rev. Genet. 2019, 20, 437–455. [Google Scholar] [CrossRef]
- Nott, A.; Holtman, I.R.; Coufal, N.G.; et al. Brain cell type-specific enhancer-promoter interactome maps and disease-risk association. Science 2019, 366, 1134–1139. [Google Scholar] [CrossRef]
- Butler, J.E.F.; Kadonaga, J.T. The RNA polymerase II core promoter: a key component in the regulation of gene expression. Genes Dev. 2002, 16, 2583–2592. [Google Scholar] [CrossRef]
- Danino, Y.M.; Even, D.; Ideses, D.; et al. The core promoter: At the heart of gene expression. Biochim. Biophys. Acta 2015, 1849, 1116–1131. [Google Scholar] [CrossRef]
- Duan, P.; Xu, J.; Zeng, D.; et al. Natural Variation in the Promoter of GSE5 Contributes to Grain Size Diversity in Rice. Mol. Plant 2017, 10, 685–694. [Google Scholar] [CrossRef]
- Ayoubi, T.A.; Van De Ven, W.J. Regulation of gene expression by alternative promoters. FASEB J. 1996, 10, 453–460. [Google Scholar] [CrossRef] [PubMed]
- Liu, L.; Gallagher, J.; Arevalo, E.D.; et al. Enhancing grain-yield-related traits by CRISPR–Cas9 promoter editing of maize CLE genes. Nature Plants 2021, 7, 287–294. [Google Scholar] [CrossRef] [PubMed]
- Hammer, K.; Mijakovic, I.; Jensen, P.R. Synthetic promoter libraries--tuning of gene expression. Trends Biotechnol. 2006, 24, 53–55. [Google Scholar] [CrossRef] [PubMed]
- Bell, P.J.; Davies, I.W.; Attfield, P.V. Facilitating functional analysis of the Saccharomyces cerevisiae genome using an EGFP-based promoter library and flow cytometry. Yeast 1999, 15, 1747–1759. [Google Scholar] [CrossRef]
- Ong, C.-T.; Corces, V.G. Enhancer function: new insights into the regulation of tissue-specific gene expression. Nat. Rev. Genet. 2011, 12, 283–293. [Google Scholar] [CrossRef] [PubMed]
- Banerji, J.; Rusconi, S.; Schaffner, W. Expression of a beta-globin gene is enhanced by remote SV40 DNA sequences. Cell 1981, 27, 299–308. [Google Scholar] [CrossRef] [PubMed]
- Gallagher, M.D.; Chen-Plotkin, A.S. The Post-GWAS Era: From Association to Function. Am. J. Hum. Genet. 2018, 102, 717–730. [Google Scholar] [CrossRef] [PubMed]
- Gacita, A.M.; Fullenkamp, D.E.; Ohiri, J.; et al. Genetic Variation in Enhancers Modifies Cardiomyopathy Gene Expression and Progression. Circulation 2021, 143, 1302–1316. [Google Scholar] [CrossRef]
- Lambert, S.A.; Jolma, A.; Campitelli, L.F.; et al. The Human Transcription Factors. Cell 2018, 172, 650–665. [Google Scholar] [CrossRef]
- Papavassiliou, A.G. Molecular medicine. Transcription factors. N. Engl. J. Med. 1995, 332, 45–47. [Google Scholar] [CrossRef]
- Tone, M.; Powell, M.J.; Tone, Y.; et al. IL-10 gene expression is controlled by the transcription factors Sp1 and Sp3. J. Immunol. 2000, 165, 286–291. [Google Scholar] [CrossRef] [PubMed]
- ENCODE Project Consortium. An integrated encyclopedia of DNA elements in the human genome. Nature 2012, 489, 57–74. [CrossRef] [PubMed]
- Moore, L.D.; Le, T.; Fan, G. DNA methylation and its basic function. Neuropsychopharmacology 2013, 38, 23–38. [Google Scholar] [CrossRef]
- Jones, M.J.; Goodman, S.J.; Kobor, M.S. DNA methylation and healthy human aging. Aging Cell 2015, 14, 924–932. [Google Scholar] [CrossRef] [PubMed]
- Jones, P.A. Functions of DNA methylation: islands, start sites, gene bodies and beyond. Nat. Rev. Genet. 2012, 13, 484–492. [Google Scholar] [CrossRef] [PubMed]
- van Eijk, K.R.; de Jong, S.; Boks, M.P.M.; et al. Genetic analysis of DNA methylation and gene expression levels in whole blood of healthy human subjects. BMC Genomics 2012, 13, 636. [Google Scholar] [CrossRef] [PubMed]
- Karlić, R.; Chung, H.-R.; Lasserre, J.; et al. Histone modification levels are predictive for gene expression. Proc. Natl. Acad. Sci. U. S. A. 2010, 107, 2926–2931. [Google Scholar] [CrossRef] [PubMed]
- Cheng, C.; Yan. K.-K.; Yip, K.Y.; et al. A statistical framework for modeling gene expression using chromatin features and application to modENCODE datasets. Genome Biol. 2011, 12, R15.
- Araki, Y.; Wang, Z.; Zang, C.; et al. Genome-wide analysis of histone methylation reveals chromatin state-based regulation of gene transcription and function of memory CD8+ T cells. Immunity 2009, 30, 912–925. [Google Scholar] [CrossRef]
- Feidantsis, K.; Giantsis, I.A.; Vratsistas, A.; et al. Correlation between intermediary metabolism, Hsp gene expression, and oxidative stress-related proteins in long-term thermal-stressed Mytilus galloprovincialis. Am. J. Physiol. Regul. Integr. Comp. Physiol. 2020, 319, R264–R281. [Google Scholar] [CrossRef]
- Hasthanasombut, Paisarnwipatpong. Expression of OsBADH1 gene in Indica rice (Oryza sativa L.) in correlation with salt, plasmolysis, temperature and light stresses. Plant Omics.
- Zhang, T.Y.; Labonté, B.; Wen, X.L.; et al. Epigenetic mechanisms for the early environmental regulation of hippocampal glucocorticoid receptor gene expression in rodents and humans. Neuropsychopharmacology 2013, 38, 111–123. [Google Scholar] [CrossRef] [PubMed]
- Yang, Y.; Hsu, P.J.; Chen, Y.-S.; et al. Dynamic transcriptomic m6A decoration: writers, erasers, readers and functions in RNA metabolism. Cell Res. 2018, 28, 616–624. [Google Scholar] [CrossRef] [PubMed]
- Singh, D.; Febbo, P.G.; Ross, K.; et al. Gene expression correlates of clinical prostate cancer behavior. Cancer Cell 2002, 1, 203–209. [Google Scholar] [CrossRef] [PubMed]
- Mar, J.C.; Matigian, N.A.; Mackay-Sim, A.; et al. Variance of gene expression identifies altered network constraints in neurological disease. PLoS Genet. 2011, 7, e1002207. [Google Scholar] [CrossRef]
- Komurov, K.; Ram, P.T. Patterns of human gene expression variance show strong associations with signaling network hierarchy. BMC Syst. Biol. 2010, 4, 154. [Google Scholar] [CrossRef] [PubMed]
- Alemu, E.Y.; Carl JW Jr, Corrada Bravo, H.; et al. Determinants of expression variability. Nucleic Acids Res. 2014, 42, 3503–3514.
- Bashkeel, N.; Perkins, T.J.; Kærn, M.; et al. Human gene expression variability and its dependence on methylation and aging. BMC Genomics 2019, 20, 941. [Google Scholar] [CrossRef]
- Simonovsky, E.; Schuster, R.; Yeger-Lotem, E. Large-scale analysis of human gene expression variability associates highly variable drug targets with lower drug effectiveness and safety. Bioinformatics 2019, 35, 3028–3037. [Google Scholar] [CrossRef]
- Igolkina, A.A.; Armoskus, C.; Newman, J.R.B.; et al. Analysis of Gene Expression Variance in Schizophrenia Using Structural Equation Modeling. Front. Mol. Neurosci. 2018, 11, 192. [Google Scholar] [CrossRef]
- Sturm, G.; List, M.; Zhang, J.D. Tissue heterogeneity is prevalent in gene expression studies. NAR Genom Bioinform 2021, 3, lqab077. [Google Scholar] [CrossRef] [PubMed]
- Bachtiary, B.; Boutros, P.C.; Pintilie, M.; et al. Gene expression profiling in cervical cancer: an exploration of intratumor heterogeneity. Clin. Cancer Res. 2006, 12, 5632–5640. [Google Scholar] [CrossRef] [PubMed]
- Pervouchine, D.D.; Djebali, S.; Breschi, A.; et al. Enhanced transcriptome maps from multiple mouse tissues reveal evolutionary constraint in gene expression. Nat. Commun. 2015, 6, 5903. [Google Scholar] [CrossRef]
- Breschi, A.; Djebali, S.; Gillis, J.; et al. Gene-specific patterns of expression variation across organs and species. Genome Biol. 2016, 17, 151. [Google Scholar] [CrossRef]
- Chen, Y.; Davidson, N.M.; Wan, Y.K.; et al. A systematic benchmark of Nanopore long read RNA sequencing for transcript level analysis in human cell lines. bioRxiv 2021; 2021.04.21.440736.
- Shannon, C.E. A Mathematical Theory of Communication. Bell System Technical Journal 1948, 27, 379–423. [Google Scholar] [CrossRef]
- Martínez, O.; Reyes-Valdés, M.H. Defining diversity, specialization, and gene specificity in transcriptomes through information theory. Proc. Natl. Acad. Sci. U. S. A. 2008, 105, 9709–9714. [Google Scholar] [CrossRef] [PubMed]
- Ameri, A.J.; Lewis, Z.A. Shannon entropy as a metric for conditional gene expression in Neurospora crassa. G3 2021, 11. [Google Scholar]
- Fuhrman, S.; Cunningham, M.J.; Wen, X.; et al. The application of shannon entropy in the identification of putative drug targets. Biosystems. 2000, 55, 5–14. [Google Scholar] [CrossRef] [PubMed]
- Schug, J.; Schuller, W.-P.; Kappen, C.; et al. Promoter features related to tissue specificity as measured by Shannon entropy. Genome Biol. 2005, 6, R33. [Google Scholar] [CrossRef]
- Machado T, J. A. Shannon Entropy Analysis of the Genome Code. Math. Probl. Eng. 2012, 2012.
- Monaco, A.; Amoroso, N.; Bellantuono, L.; et al. Shannon entropy approach reveals relevant genes in Alzheimer’s disease. PLoS One 2019, 14, e0226190. [Google Scholar] [CrossRef] [PubMed]
- Dérian, N.; Pham, H.-P.; Nehar-Belaid, D.; et al. The Tsallis generalized entropy enhances the interpretation of transcriptomics datasets. PLoS One 2022, 17, e0266618. [Google Scholar] [CrossRef]
- Kim, M.C.; Gate, R.; Lee, D.S.; et al. memento: Generalized differential expression analysis of single-cell RNA-seq with method of moments estimation and efficient resampling. bioRxiv 2022; 2022.11.09.515836.
- Zhang, J.D.; Hatje, K.; Sturm, G.; et al. Correction to: Detect tissue heterogeneity in gene expression data with BioQC. BMC Genomics 2018, 19, 558. [Google Scholar] [CrossRef] [PubMed]
- Wang, K.; Phillips, C.A.; Saxton, A.M.; et al. EntropyExplorer: an R package for computing and comparing differential Shannon entropy, differential coefficient of variation and differential expression. BMC Res. Notes 2015, 8, 832. [Google Scholar] [CrossRef] [PubMed]
- Salzberg, S.L. Open questions: How many genes do we have? BMC Biol. 2018, 16, 94. [Google Scholar] [CrossRef] [PubMed]
- International Human Genome Sequencing Consortium. Finishing the euchromatic sequence of the human genome. Nature 2004, 431, 931–945. [CrossRef] [PubMed]
- Barbosa-Morais, N.L.; Irimia, M.; Pan, Q.; et al. The evolutionary landscape of alternative splicing in vertebrate species. Science 2012, 338, 1587–1593. [Google Scholar] [CrossRef] [PubMed]
- Wang, E.T.; Sandberg, R.; Luo, S.; et al. Alternative isoform regulation in human tissue transcriptomes. Nature 2008, 456, 470–476. [Google Scholar] [CrossRef]
- Wright, C.J.; Smith, C.W.J.; Jiggins, C.D. Alternative splicing as a source of phenotypic diversity. Nat. Rev. Genet. 2022. [CrossRef]
- Alasoo, K.; Rodrigues, J.; Danesh, J.; et al. Genetic effects on promoter usage are highly context-specific and contribute to complex traits. Elife 2019, 8. [Google Scholar] [CrossRef]
- Berget, S.M.; Moore, C.; Sharp, P.A. Spliced segments at the 5′ terminus of adenovirus 2 late mRNA*. Proceedings of the National Academy of Sciences 1977, 74, 3171–3175. [Google Scholar] [CrossRef] [PubMed]
- Patrick, E.; Buckley, M.; Yang, Y.H. Estimation of data-specific constitutive exons with RNA-Seq data. BMC Bioinformatics 2013, 14, 31. [Google Scholar] [CrossRef] [PubMed]
- Wahl, M.C.; Will, C.L.; Lührmann, R. The spliceosome: design principles of a dynamic RNP machine. Cell 2009, 136, 701–718. [Google Scholar] [CrossRef] [PubMed]
- Graveley, B.R. Alternative splicing: increasing diversity in the proteomic world. Trends Genet. 2001, 17, 100–107. [Google Scholar] [CrossRef] [PubMed]
- Smith, C.W.; Valcárcel, J. Alternative pre-mRNA splicing: the logic of combinatorial control. Trends Biochem. Sci. 2000, 25, 381–388. [Google Scholar] [CrossRef] [PubMed]
- Baralle, F.E.; Giudice, J. Alternative splicing as a regulator of development and tissue identity. Nat. Rev. Mol. Cell Biol. 2017, 18, 437–451. [Google Scholar] [CrossRef] [PubMed]
- Burtis, K.C.; Baker, B.S. Drosophila doublesex gene controls somatic sexual differentiation by producing alternatively spliced mRNAs encoding related sex-specific polypeptides. Cell 1989, 56, 997–1010. [Google Scholar] [CrossRef] [PubMed]
- McIntyre, L.M.; Bono, L.M.; Genissel, A.; et al. Sex-specific expression of alternative transcripts in Drosophila. Genome Biol. 2006, 7, R79. [Google Scholar] [CrossRef] [PubMed]
- Brown, J.B.; Boley, N.; Eisman, R.; et al. Diversity and dynamics of the Drosophila transcriptome. Nature 2014, 512, 393–399. [Google Scholar] [CrossRef]
- Gibilisco, L.; Zhou, Q.; Mahajan, S.; et al. Alternative Splicing within and between Drosophila Species, Sexes, Tissues, and Developmental Stages. PLoS Genet. 2016, 12, e1006464. [Google Scholar] [CrossRef]
- Naftaly, A.S.; Pau, S.; White, M.A. Long-read RNA sequencing reveals widespread sex-specific alternative splicing in threespine stickleback fish. Genome Res. 2021, 31, 1486–1497. [Google Scholar] [CrossRef] [PubMed]
- Rogers, T.F.; Palmer, D.H.; Wright, A.E. Sex-Specific Selection Drives the Evolution of Alternative Splicing in Birds. Mol. Biol. Evol. 2021, 38, 519–530. [Google Scholar] [CrossRef]
- Blekhman, R.; Marioni, J.C.; Zumbo, P.; et al. Sex-specific and lineage-specific alternative splicing in primates. Genome Res. 2010, 20, 180–189. [Google Scholar] [CrossRef]
- Trabzuni, D.; Ramasamy, A.; Imran, S.; et al. Widespread sex differences in gene expression and splicing in the adult human brain. Nat. Commun. 2013, 4, 2771. [Google Scholar] [CrossRef]
- Karlebach, G.; Veiga, D.F.T.; Mays, A.D.; et al. The impact of biological sex on alternative splicing. bioRxiv 2020; 490904.
- Xu, Q.; Modrek, B.; Lee, C. Genome-wide detection of tissue-specific alternative splicing in the human transcriptome. Nucleic Acids Res. 2002, 30, 3754–3766. [Google Scholar] [CrossRef] [PubMed]
- Grosso, A.R.; Gomes, A.Q.; Barbosa-Morais, N.L.; et al. Tissue-specific splicing factor gene expression signatures. Nucleic Acids Res. 2008, 36, 4823–4832. [Google Scholar] [CrossRef] [PubMed]
- Zhang, C.; Zhang, Z.; Castle, J.; et al. Defining the regulatory network of the tissue-specific splicing factors Fox-1 and Fox-2. Genes Dev. 2008, 22, 2550–2563. [Google Scholar] [CrossRef] [PubMed]
- Buljan, M.; Chalancon, G.; Eustermann, S.; et al. Tissue-specific splicing of disordered segments that embed binding motifs rewires protein interaction networks. Mol. Cell 2012, 46, 871–883. [Google Scholar] [CrossRef]
- Zhang, X.; Chen, M.H.; Wu, X.; et al. Cell-Type-Specific Alternative Splicing Governs Cell Fate in the Developing Cerebral Cortex. Cell 2016, 166, 1147–1162e15. [Google Scholar] [CrossRef]
- Ling, J.P.; Wilks, C.; Charles, R.; et al. ASCOT identifies key regulators of neuronal subtype-specific splicing. Nat. Commun. 2020, 11, 137. [Google Scholar] [CrossRef]
- Song, Y.; Botvinnik, O.B.; Lovci, M.T.; et al. Single-Cell Alternative Splicing Analysis with Expedition Reveals Splicing Dynamics during Neuron Differentiation. Mol. Cell 2017, 67, 148–161.e5. [Google Scholar] [CrossRef] [PubMed]
- Shalek, A.K.; Satija, R.; Adiconis, X.; et al. Single-cell transcriptomics reveals bimodality in expression and splicing in immune cells. Nature 2013, 498, 236–240. [Google Scholar] [CrossRef] [PubMed]
- Kim, H.K.; Pham, M.H.C.; Ko, K.S.; et al. Alternative splicing isoforms in health and disease. Pflugers Arch. 2018, 470, 995–1016. [Google Scholar] [CrossRef] [PubMed]
- Scotti, M.M.; Swanson, M.S. RNA mis-splicing in disease. Nat. Rev. Genet. 2016, 17, 19–32. [Google Scholar] [CrossRef]
- Krawczak, M.; Reiss, J.; Cooper, D.N. The mutational spectrum of single base-pair substitutions in mRNA splice junctions of human genes: causes and consequences. Hum. Genet. 1992, 90, 41–54. [Google Scholar] [CrossRef] [PubMed]
- Xiong, H.Y.; Alipanahi, B.; Lee, L.J.; et al. RNA splicing. The human splicing code reveals new insights into the genetic determinants of disease. Science 2015, 347, 1254806. [CrossRef] [PubMed]
- Voineagu, I.; Wang, X.; Johnston, P.; et al. Transcriptomic analysis of autistic brain reveals convergent molecular pathology. Nature 2011, 474, 380–384. [Google Scholar] [CrossRef] [PubMed]
- Pan, Q.; Shai, O.; Lee, L.J.; et al. Deep surveying of alternative splicing complexity in the human transcriptome by high-throughput sequencing. Nat. Genet. 2008, 40, 1413–1415. [Google Scholar] [CrossRef] [PubMed]
- Steijger, T.; Abril, J.F.; Engström, P.G.; et al. Assessment of transcript reconstruction methods for RNA-seq. Nat. Methods 2013, 10, 1177–1184. [Google Scholar] [CrossRef]
- Afsari, B.; Guo, T.; Considine, M.; et al. Splice Expression Variation Analysis (SEVA) for inter-tumor heterogeneity of gene isoform usage in cancer. Bioinformatics 2018, 34, 1859–1867. [Google Scholar] [CrossRef]
- Wu, J.; Akerman, M.; Sun, S.; et al. SpliceTrap: a method to quantify alternative splicing under single cellular conditions. Bioinformatics 2011, 27, 3010–3016. [Google Scholar] [CrossRef]
- Venables, J.P.; Klinck, R.; Bramard, A.; et al. Identification of alternative splicing markers for breast cancer. Cancer Res. 2008, 68, 9525–9531. [Google Scholar] [CrossRef] [PubMed]
- Merino, G.A.; Conesa, A.; Fernández, E.A. A benchmarking of workflows for detecting differential splicing and differential expression at isoform level in human RNA-seq studies. Brief. Bioinform. 2019, 20, 471–481. [Google Scholar] [CrossRef] [PubMed]
- Soneson, C.; Matthes, K.L.; Nowicka, M.; et al. Isoform prefiltering improves performance of count-based methods for analysis of differential transcript usage. Genome Biol. 2016, 17, 12. [Google Scholar] [CrossRef] [PubMed]
- Dougherty, M.L.; Underwood, J.G.; Nelson, B.J.; et al. Transcriptional fates of human-specific segmental duplications in brain. Genome Res. 2018, 28, 1566–1576. [Google Scholar] [CrossRef] [PubMed]
- Sharon, D.; Tilgner, H.; Grubert, F.; et al. A single-molecule long-read survey of the human transcriptome. Nat. Biotechnol. 2013, 31, 1009–1014. [Google Scholar] [CrossRef] [PubMed]
- Tang, A.D.; Soulette, C.M.; van Baren, M.J.; et al. Full-length transcript characterization of SF3B1 mutation in chronic lymphocytic leukemia reveals downregulation of retained introns. Nat. Commun. 2020, 11, 1438. [Google Scholar] [CrossRef] [PubMed]
- Chen, Y.; Sim, A.; Wan, Y.; Goeke, J. bambu: Reference-guided isoform reconstruction and quantification for long read RNA-Seq data. 2022.
- Leung, S.K.; Jeffries, A.R.; Castanho, I.; et al. Full-length transcript sequencing of human and mouse cerebral cortex identifies widespread isoform diversity and alternative splicing. Cell Rep. 2021, 37, 110022. [Google Scholar] [CrossRef] [PubMed]
- Palmer, C.R.; Liu, C.S.; Romanow, W.J.; et al. Altered cell and RNA isoform diversity in aging Down syndrome brains. Proc. Natl. Acad. Sci. U. S. A. 2021, 118. [Google Scholar] [CrossRef]
- Ritchie, W.; Granjeaud, S.; Puthier, D.; et al. Entropy measures quantify global splicing disorders in cancer. PLoS Comput. Biol. 2008, 4, e1000011. [Google Scholar] [CrossRef]
- Oguchi, Y.; Ozaki, Y.; Abdelmoez, M.N.; et al. NanoSINC-seq dissects the isoform diversity in subcellular compartments of single cells. Sci Adv 2021, 7. [Google Scholar] [CrossRef] [PubMed]
- Padonou, F.; Gonzalez, V.; Provin, N.; et al. Aire-dependent transcripts escape Raver2-induced splice-event inclusion in the thymic epithelium. EMBO Rep. 2022, 23, e53576. [Google Scholar] [CrossRef]
- Roberts, A.; Trapnell, C.; Donaghey, J.; et al. Improving RNA-Seq expression estimates by correcting for fragment bias. Genome Biol. 2011, 12, R22. [Google Scholar] [CrossRef] [PubMed]
- Trapnell, C.; Roberts, A.; Goff, L.; et al. Differential gene and transcript expression analysis of RNA-seq experiments with TopHat and Cufflinks. Nat. Protoc. 2012, 7, 562–578. [Google Scholar] [CrossRef]
- Trapnell, C.; Williams, B.A.; Pertea, G.; et al. Transcript assembly and quantification by RNA-Seq reveals unannotated transcripts and isoform switching during cell differentiation. Nat. Biotechnol. 2010, 28, 511–515. [Google Scholar] [CrossRef] [PubMed]
- Sterne-Weiler, T.; Weatheritt, R.J.; Best, A.J.; et al. Efficient and Accurate Quantitative Profiling of Alternative Splicing Patterns of Any Complexity on a Laptop. Mol. Cell 2018, 72, 187–200.e6. [Google Scholar] [CrossRef]
- Dankó, B.; Szikora, P.; Pór, T.; et al. SplicingFactory-splicing diversity analysis for transcriptome data. Bioinformatics 2021. [CrossRef] [PubMed]
- Olivieri, J.E.; Dehghannasiri, R.; Salzman, J. The SpliZ generalizes ‘percent spliced in’ to reveal regulated splicing at single-cell resolution. Nat. Methods 2022, 19, 307–310. [Google Scholar] [CrossRef]
- Tekath, T.; Dugas, M. Differential transcript usage analysis of bulk and single-cell RNA-seq data with DTUrtle. Bioinformatics 2021. [CrossRef] [PubMed]
- Gleeson, J.; Leger, A.; Prawer, Y.D.J.; et al. Accurate expression quantification from nanopore direct RNA sequencing with NanoCount. Nucleic Acids Res. 2022, 50, e19. [Google Scholar] [CrossRef]
- Joglekar, A.; Prjibelski, A.; Mahfouz, A.; et al. A spatially resolved brain region- and cell type-specific isoform atlas of the postnatal mouse brain. Nat. Commun. 2021, 12, 463. [Google Scholar] [CrossRef] [PubMed]
- Tiberi, S.; Robinson, M.D. BANDITS: Bayesian differential splicing accounting for sample-to-sample variability and mapping uncertainty. Genome Biol. 2020, 21, 69. [Google Scholar] [CrossRef] [PubMed]
- Patrick, R.; Humphreys, D.T.; Janbandhu, V.; et al. Sierra: discovery of differential transcript usage from polyA-captured single-cell RNA-seq data. Genome Biol. 2020, 21, 167. [Google Scholar] [CrossRef]
- Froussios, K.; Mourão, K.; Simpson, G.; et al. Relative Abundance of Transcripts ( RATs): Identifying differential isoform abundance from RNA-seq. F1000Res. 2019, 8, 213. [Google Scholar] [CrossRef] [PubMed]
- Trincado, J.L.; Entizne, J.C.; Hysenaj, G.; et al. SUPPA2: fast, accurate, and uncertainty-aware differential splicing analysis across multiple conditions. Genome Biol. 2018, 19, 40. [Google Scholar] [CrossRef] [PubMed]
- Li, Y.I.; Knowles, D.A.; Humphrey, J.; et al. Annotation-free quantification of RNA splicing using LeafCutter. Nat. Genet. 2018, 50, 151–158. [Google Scholar] [CrossRef] [PubMed]
- Vitting-Seerup, K.; Sandelin, A. The Landscape of Isoform Switches in Human Cancers. Mol. Cancer Res. 2017, 15, 1206–1220. [Google Scholar] [CrossRef] [PubMed]
- Qiu, X.; Hill, A.; Packer, J.; et al. Single-cell mRNA quantification and differential analysis with Census. Nat. Methods 2017, 14, 309–315. [Google Scholar] [CrossRef] [PubMed]
- Huang, Y.; Sanguinetti, G. BRIE: transcriptome-wide splicing quantification in single cells. Genome Biol. 2017, 18, 123. [Google Scholar] [CrossRef]
- Nowicka, M.; Robinson, M.D. DRIMSeq: a Dirichlet-multinomial framework for multivariate count outcomes in genomics. F1000Res. 2016, 5, 1356. [Google Scholar] [CrossRef]
- Vaquero-Garcia, J.; Barrera, A.; Gazzara, M.R.; et al. A new view of transcriptome complexity and regulation through the lens of local splicing variations. Elife 2016, 5, e11752. [Google Scholar] [CrossRef] [PubMed]
- Goldstein, L.D.; Cao, Y.; Pau, G.; et al. Prediction and Quantification of Splice Events from RNA-Seq Data. PLoS One 2016, 11, e0156132. [Google Scholar] [CrossRef] [PubMed]
- Welch, J.D.; Hu, Y.; Prins, J.F. Robust detection of alternative splicing in a population of single cells. Nucleic Acids Res. 2016, 44, e73. [Google Scholar] [CrossRef] [PubMed]
- Irimia, M.; Weatheritt, R.J.; Ellis, J.D.; et al. A highly conserved program of neuronal microexons is misregulated in autistic brains. Cell 2014, 159, 1511–1523. [Google Scholar] [CrossRef] [PubMed]
- Shen, S.; Park, J.W.; Lu, Z.-X.; et al. rMATS: robust and flexible detection of differential alternative splicing from replicate RNA-Seq data. Proc. Natl. Acad. Sci. U. S. A. 2014, 111, E5593–601. [Google Scholar] [CrossRef] [PubMed]
- Trapnell, C.; Hendrickson, D.G.; Sauvageau, M.; et al. Differential analysis of gene regulation at transcript resolution with RNA-seq. Nat. Biotechnol. 2013, 31, 46–53. [Google Scholar] [CrossRef] [PubMed]
- Aschoff, M.; Hotz-Wagenblatt, A.; Glatting, K.-H.; et al. SplicingCompass: differential splicing detection using RNA-seq data. Bioinformatics 2013, 29, 1141–1148. [Google Scholar] [CrossRef] [PubMed]
- Anders, S.; Reyes, A.; Huber, W. Detecting differential usage of exons from RNA-seq data. Genome Res. 2012, 22, 2008–2017. [Google Scholar] [CrossRef]
- Katz, Y.; Wang, E.T.; Airoldi, E.M.; et al. Analysis and design of RNA sequencing experiments for identifying isoform regulation. Nat. Methods 2010, 7, 1009–1015. [Google Scholar] [CrossRef]
Figure 1.
Types of diversity from gene expression profiles. Transcriptome diversity occurs at the gene level and can be measured across samples in a population or as the diversity of expression across genes within a condition. Isoform diversity can be measured as the number of isoforms or the distribution of isoform expression.
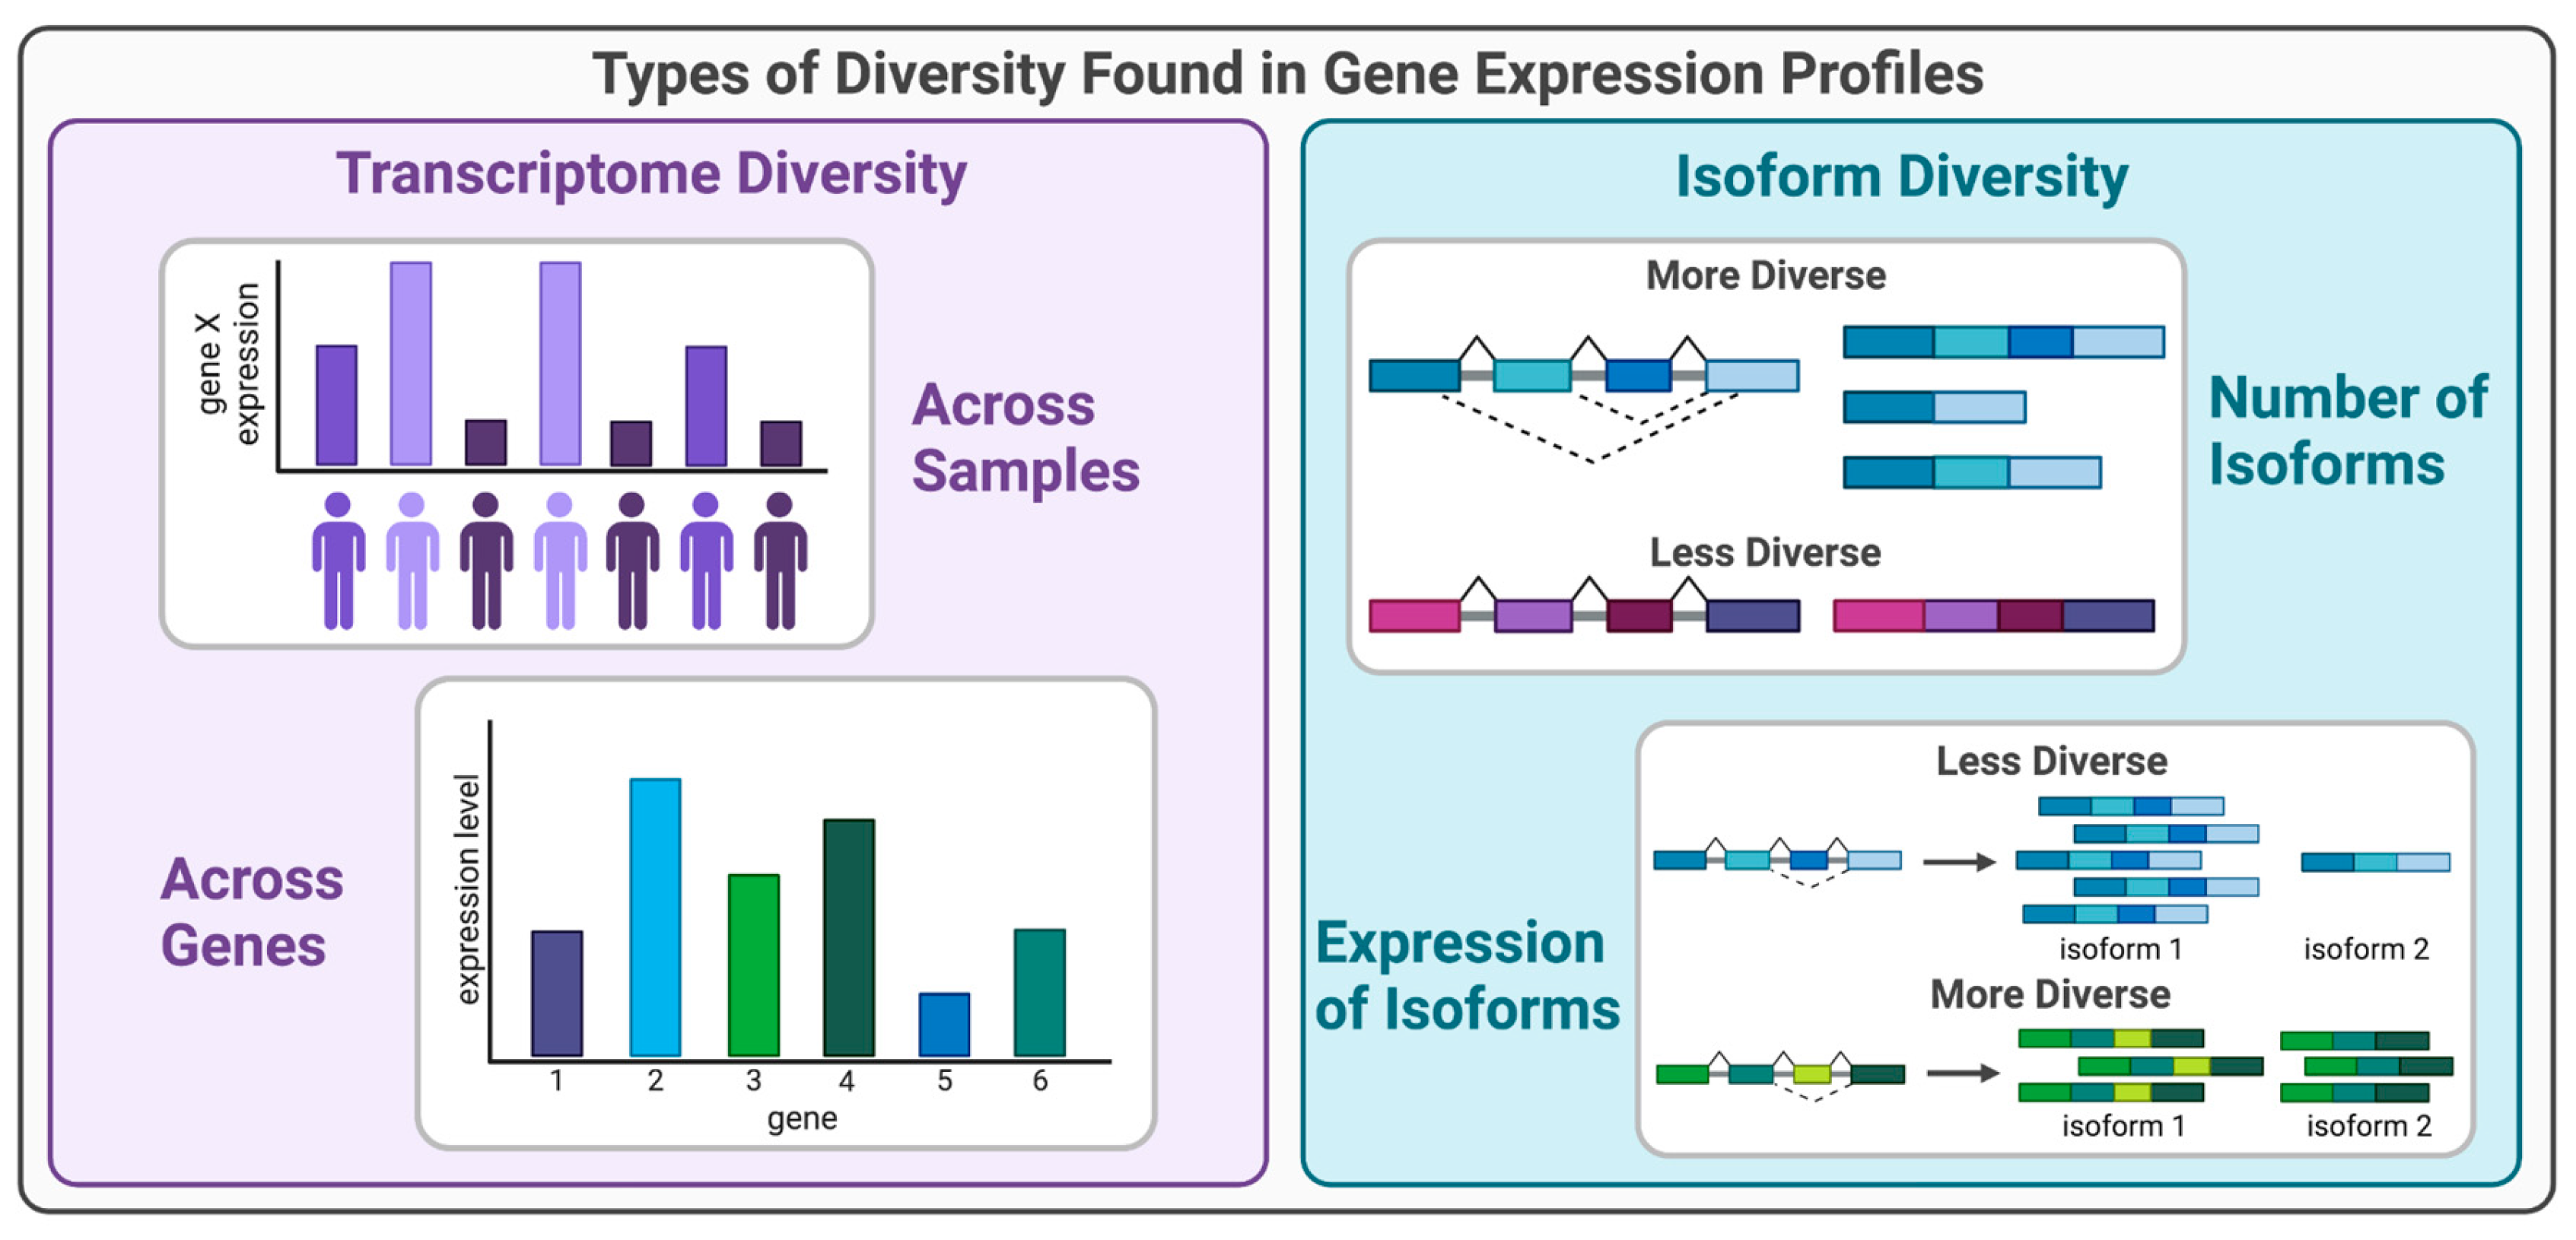
Figure 2.
Shannon entropy can be used to describe transcriptional diversity. 2A) A toy example showing the principle of Shannon entropy when describing transcriptome diversity. When there is a uniform distribution of gene expression values, the Shannon entropy is higher than when gene expression is concentrated on a smaller number of genes. 2B) A toy example of the principle of Shannon entropy when used to describe diversity in isoform expression. Even when there are varying numbers of isoforms, the entropy or diversity is highest when the distribution is most uniform or flat.
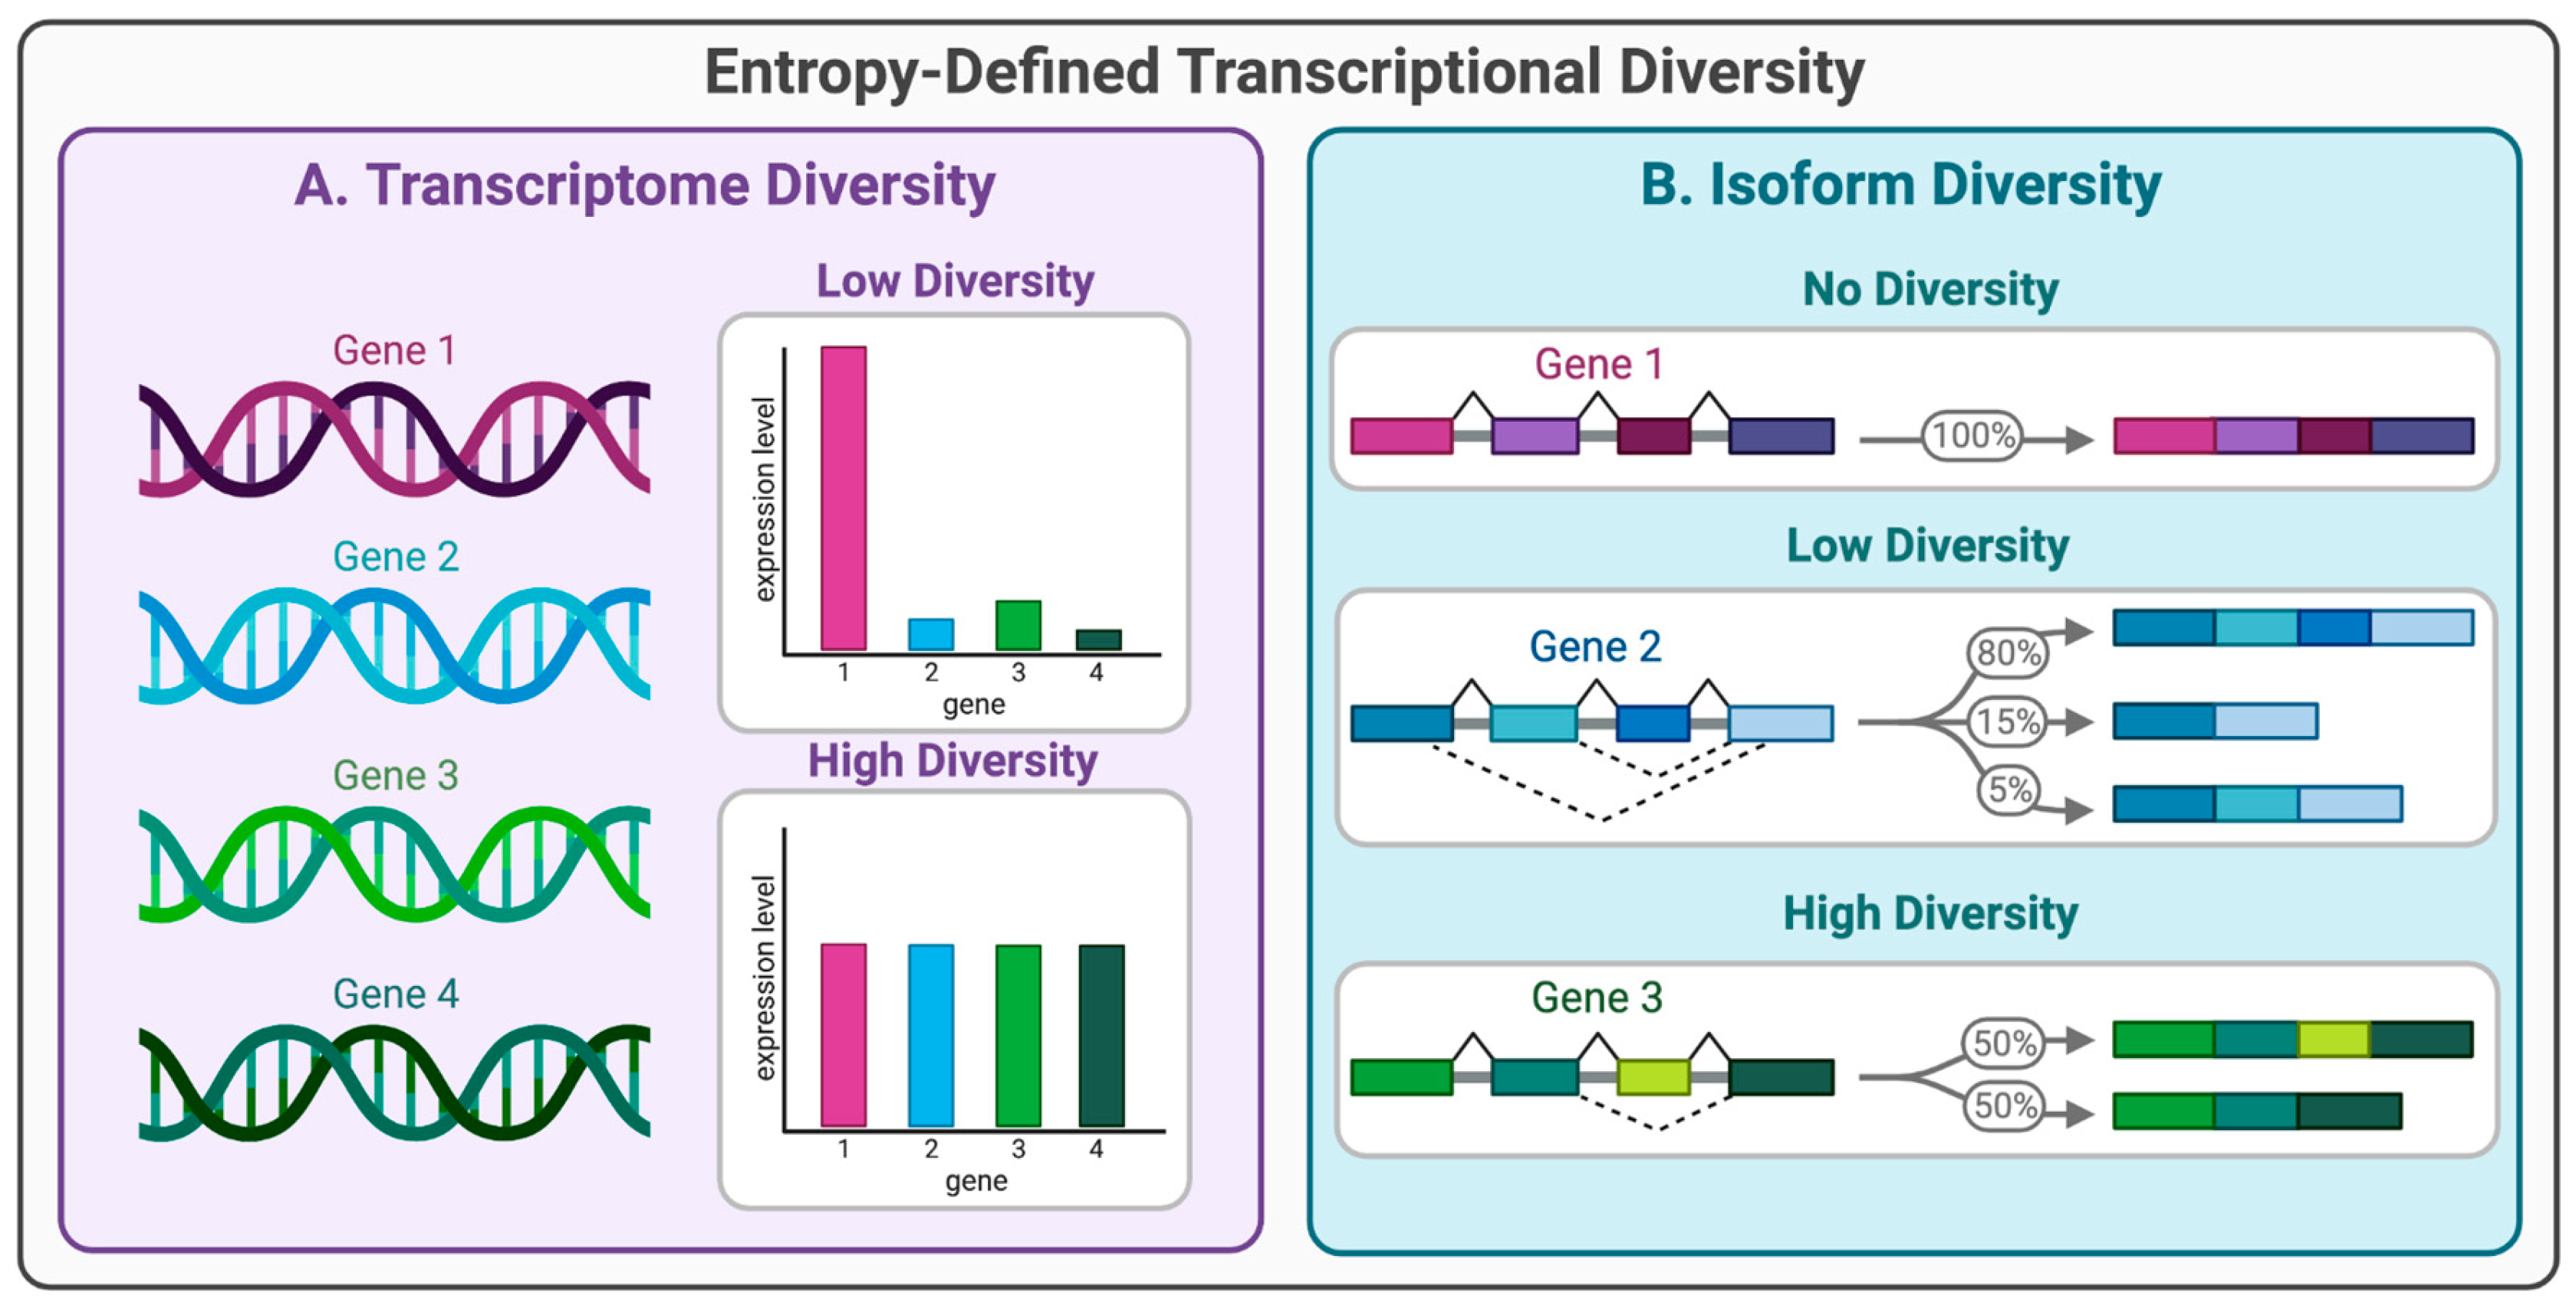

Table 1.
Software Packages that Detect Transcriptome Diversity. This table includes the name of the software package, year published, gene expression data it can be used with, and the transcriptional diversity metric. Entries are sorted from most to least recent.
Table 1.
Software Packages that Detect Transcriptome Diversity. This table includes the name of the software package, year published, gene expression data it can be used with, and the transcriptional diversity metric. Entries are sorted from most to least recent.
| Name of Package | Year | Bulk or Single Cell | Transcriptional Diversity Metrics |
|---|---|---|---|
| memento [84] | 2022 | Single cell | Variability |
| BioQC [85] | 2017 | Bulk | Shannon Entropy |
| EntropyExplorer [86] | 2015 | Bulk | Differential Shannon Entropy |
Table 2.
Software packages that detect diversity and variability in exon and isoform usage. This table includes the name of the software package, the year published, the type of data it can be used with, and the analysis type. Note: As terminology used by authors to describe a particular method vary, the analysis type listed in the table is standardized according to defined terminology in this review. Entries are sorted from most to least recent. DEU - differential exon usage, PSI - percent spliced in, DTU - differential transcript usage.
| Package Name | Year | Bulk or Single Cell | Differential Analysis Type: Exon/Transcript or Other |
|---|---|---|---|
| SpliZ [142] | 2022 | Single cell | DEU (PSI) |
| DTUrtle [143] | 2021 | Both | DTU |
| NanoCount [144] | 2021 | Bulk | DTU |
| SplicingFactory [141] | 2021 | Bulk | Other - Diversity |
| scisorseqr [145] | 2021 | Single cell | DTU (modified) |
| ASCOT [113] | 2020 | Single cell | DEU (PSI) |
| BANDITS [146] | 2020 | Bulk | DTU |
| Sierra [147] | 2020 | Single cell | DTU |
| RATs [148] | 2019 | Bulk | DTU |
| SUPPA2 [149] | 2018 | Bulk | DEU (PSI) |
| LeafCutter [150] | 2018 | Bulk | Other - Intron Excision |
| Whippet [140] | 2018 | Bulk | DTU |
| SEVA [123] | 2018 | Bulk | Other - Variability |
| IsoformSwitchAnalyzeR [151] | 2017 | Bulk | DTU |
| Census/Monocle [152] | 2017 | Single cell | DEU (PSI) |
| BRIE [153] | 2017 | Single cell | DEU (PSI) |
| DRIM-Seq [154] | 2016 | Bulk | DTU |
| JunctionSeq | 2016 | Bulk | DEU (PSI) |
| MAJIQ [155] | 2016 | Bulk | DEU (PSI) |
| SGSeq [156] | 2016 | Bulk | DEU (PSI) |
| SingleSplice [157] | 2016 | Single cell | DTU |
| Limma (diffSplice) [18] | 2015 | Bulk | DEU (PSI) |
| VAST-TOOLS [158] | 2014 | Bulk | DTU |
| rMATS [159] | 2014 | Bulk | DEU (PSI) |
| CuffDiff2 [160] | 2013 | Bulk | DEU (PSI) |
| SplicingCompass [161] | 2013 | Bulk | DTU |
| DEXSeq [162] | 2012 | Bulk | DEU (PSI) |
| SpliceTrap [124] | 2011 | Bulk | DEU (PSI) |
| MISO [163] | 2010 | Bulk | DEU (PSI) |
Disclaimer/Publisher’s Note: The statements, opinions and data contained in all publications are solely those of the individual author(s) and contributor(s) and not of MDPI and/or the editor(s). MDPI and/or the editor(s) disclaim responsibility for any injury to people or property resulting from any ideas, methods, instructions or products referred to in the content. |
© 2023 by the authors. Licensee MDPI, Basel, Switzerland. This article is an open access article distributed under the terms and conditions of the Creative Commons Attribution (CC BY) license (http://creativecommons.org/licenses/by/4.0/).
Copyright: This open access article is published under a Creative Commons CC BY 4.0 license, which permit the free download, distribution, and reuse, provided that the author and preprint are cited in any reuse.


