
Submitted:
08 January 2023
Posted:
10 January 2023
You are already at the latest version
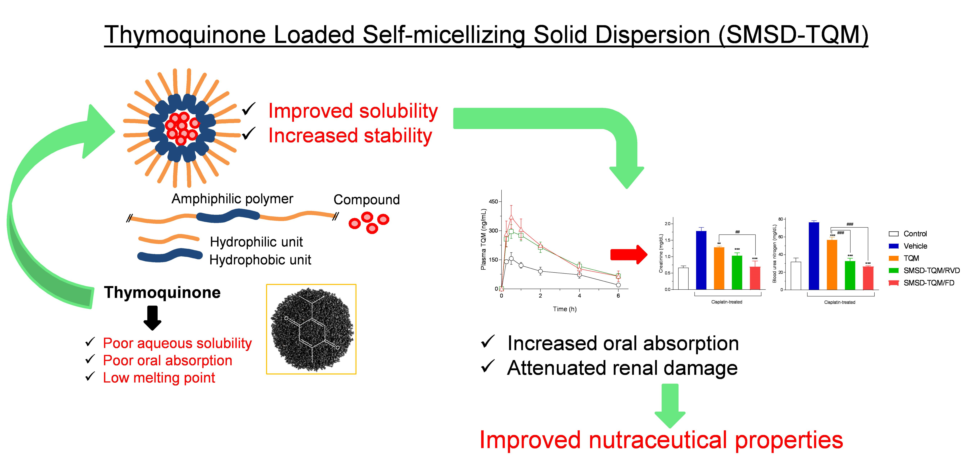
Abstract
The present study was designed to develop a self-micellizing solid dispersion (SMSD) containing Thymoquinone (TQM), a phytonutrient obtained from Nigella sativa seeds, aiming to improve its biopharmaceutical and nephroprotective functions. The apparent solubility of TQM in polymer solutions was used to choose an appropriate amphiphilic polymer that could be used to make an SMSD system. Based on the apparent solubility, Soluplus® was chosen as an appropriate carrier, and mixing with TQM, SMSD-TQM with different loadings of TQM (5–15%) was made by solvent evaporation and freeze-drying techniques, respectively, and the formulations were optimized. The optimized SMSD-TQM was evaluated in terms of particle size distribution, morphology, release characteristics, pharmacokinetic behavior, and nephroprotective effects in a rat model of acute kidney injury. SMSD-TQM significantly improved the dissolution characteristics (97.8%) of TQM in water within 60 min. Oral administration of SMSD-TQM in rats exhibited a 4.9-fold higher systemic exposure than crystalline TQM. In a cisplatin-induced (6 mg/kg, i.p.) acute kidney-damaged rat model, oral SMSD-TQM (10 mg/kg) improved the nephroprotective effects of TQM based on the results of kidney biomarkers and histological abnormalities. These findings suggest that SMSD-TQM might be efficacious in enhancing the nephroprotective effect of TQM by overcoming biopharmaceutical limitations.
Keywords:
biopharmaceutical
; nephroprotective
; oral absorption
; self-micellizing solid dispersion
; thymoquinone.
1. Introduction
Noncommunicable diseases, in particular, hypertension and kidney disease, remain significant contributors to global morbidity and mortality [1]. Chronic kidney disease (CKD) is a paramount public health concern, with an overall prevalence in Bangladeshi people of 22.48%, which is higher than the global prevalence of CKD [2]. Thymoquinone (TQM) is one of the most pharmacologically active constituents obtained from Black Cumin seeds (Nigella sativa), which is widely used in traditional medicine as a holistic treatment option [3]. TQM possesses anticancer, antischistosomal, antifungal, antibacterial, anticonvulsant, hepatoprotective, and neuroprotective activities [4]. In addition, the drug exerts its nephroprotective effects through anti-inflammatory and antioxidant activities [5]. The LD50 of TQM in rats was reported to be 794.3 mg/kg after oral administration, reflecting TQM's safety in clinical practices [6]. However, poor aqueous solubility and the consequent inferior oral bioavailability of the drug limit its clinical effect [7]. Solubility of TQM in water was reported to be <1.0 mg/mL at room temperature; therefore, high doses are required in clinical application as a nutraceutical agent [8]. Improvement of the dissolution behavior of TQM can enhance oral bioavailability, which, in turn, may increase the therapeutic efficiency of TQM. Only a small number of studies have been reported that employ liposomes, suspensions, solutions, micelle nanoparticles, chitosan nano-vesicles, and chitosan nanoparticles to enhance the therapeutic potential of TQM by increasing the solubility and bioavailability of TQM. However, compared to the solid state, the TQM in these liquid-based formulations was more prone to degradation [9]. Additionally, there is little information about the physical stability of TQM-loaded amorphous solid dispersions (ASDs) in the literature. It was claimed that ASD formulations were not thermodynamically stable, which resulted in recrystallization during storage and poor dissolving capabilities [10]. These findings led us to develop a TQM formulation to ensure better dissolution and oral bioavailability.
The solubility of a poorly water-soluble drug can be enhanced by employing various formulation strategies such as a surfactant, pH modification, nano-suspension technology, hydrotrophy, solid dispersion, and salt formation. However, among these techniques, Solid dispersion (SD) technology is widely used to increase the water solubility, dissolution rate, and bioavailability of drugs with poor water solubility [11]. SD involves the molecular dispersion of one or more APIs in an inert hydrophilic carrier, which helps improve the drug's solubility [12]. Drugs in solid dispersions can either be crystalline or amorphous in solid form. When a drug is amorphous, it can be incorporated into a solid dispersion as particles or molecularly spread over the carrier [13,14]. However, when the drug is crystalline, it is incorporated as particles only where it can form mixed crystals with the carrier [15].
Self-micellizing solid dispersion (SMSD), a recent promising formulation strategy, has attracted considerable attention since it can increase the bioavailability of drugs while reducing the inconsistency of oral absorption under various patho-physiological situations [16]. By using an amphiphilic block co-polymer, SMSD technology is a solid dispersion system that can achieve high dissolution characteristics of poorly water soluble drugs [17,18,19]. In brief, SMSD's usually consist of an amphiphilic carrier and the drug mixed in a suitable solvent. Then the solvent from the mixture will be removed by a solvent evaporation approach [20]. Then the dried powder undergoes micellization when it comes in contact with the gastric fluid. An amphiphilic polymer consists of a hydrophobic unit and a hydrophilic unit; the self–micelleization by the polymer occurs with encapsulation of a lipophilic drug through hydrophobic interaction when introduced in dissolution media [21]. Therefore, SMSD system might be beneficial to improve the biopharmaceutical properties of TQM and enhance the nephroprotective effects even at a lower dose. However, little is known about the feasibility of SMSD system incorporating TQM in ameliorating the nephroprotective properties.
The present study aims to develop a self-micellizing solid dispersion (SMSD) formulation of TQM (SMSD-TQM) employing an amphiphilic polymer with the objective of enhanced biopharmaceutical and improved nephroprotective function. The developed formulations were examined for the physicochemical properties, particle size distribution, morphology, crystallinity, and dissolution behavior. Pharmacokinetics of TQM was also evaluated in rats after oral administration of TQM and SMSD-TQM. Finally, the nephroprotective effects of TQM samples were investigated in cisplatin-induced acute kidney injury rat models.
2. Materials and Methods
2.1. Materials
TQM (purity: 98.6%) was purchased from Sigma-Aldrich (USA). BASF, Dhaka, Bangladesh kindly donated Soluplus®, Kolliphor® P188, and Kolliphor® P407. All other chemicals and reagents were purchased commercially.
2.2. Standard Curve Preparation and TQM Content Analysis
By dissolving 10 mg of TQM with 10 mL methanol in a volumetric flask to achieve a final concentration of 1 mg/mL, a 10 mL stock solution of TQM was created. The Beer-Lambert equation is followed by TQM in the concentration range of 8 to 30 µg/mL, and TQM provides a suitable absorbance value at 257 nm [22]. Therefore, the stock solutions were then diluted sequentially at various concentrations prior to use and the corresponding absorbance was determined at 257 nm using a UV-vis spectrophotometer (UV-1800, Shimadzu Corporation, Japan). Using the equation derived from the standard curve, the amount of TQM was determined. The linearity, accuracy, and precision of the assay methods and recovery studies were validated. The limits of detection and quantification were 3.2 µg/mL and 9.8 µg/mL, respectively.
2.3. Phase Solubility Study
To select an appropriate carrier, the apparent solubility of TQM in polymer solutions was assessed in triplicate using a proven method established by Higuchi and Connors. [23].
An excess of TQM (about 1 gm) was added to the aqueous solutions of Soluplus®, Kolliphor® P188, and Kolliphor® P407 at a polymer concentration of 5–25 mg/mL. The tubes were then sealed and shaken for 48 hours at 75 rpm at 37°C in a thermostatically controlled water bath (WBS-C1, Wincom, China). The resulting suspension was centrifuged at 10,000×g for 10 min after 48 hours, and the supernatant was filtered. The resultant supernatants were then filtered, and the approach stated in the preceding section was used to determine the TQM content.
The stability constant (Ks) and complexation efficiency (C.E.) were calculated using the equations below;
Where, So is the equilibrium aqueous solubility of TQM, and the slope is attained by plotting TQM concentration versus different polymer concentrations.
2.4. Preparation of SMSD-TQM
The SMSD-TQM was prepared via a solvent evaporation process. In the selection step of the polymer ratio, crystalline TQM and a chosen polymer were dissolved in methanol based on their apparent solubility and complexation behavior. The solution was then dried using a rotary vacuum-dryer (RVD) (Heidolph Rota-Vap, Germany). The freeze-drying (FD) procedure was also used in the preparation of SMSD-TQM to compare the impact of drying on the physicochemical behavior of the approach. Accurately weighed crystalline TQM (10% w/w) and polymer were dissolved in 1, 4-dioxane and then frozen at -80°C. The frozen samples were subsequently lyophilized using an Eyela FD-1000 freeze dryer for 24 h at a pressure of 15 Pa. (Tokyo Rikakikai, Tokyo, Japan).
2.5. Dissolution Study
To provide insight into the enhanced release of TQM over time, the in vitro dissolution test on TQM samples was carried out under the stirrer beaker method with a small volume to maintain semi-sink conditions. The dissolution investigation was conducted in 50 mL of distilled water at 37±0.5°C with continuous stirring of 50 rpm by a magnetic stirrer for 60 min. Each powder sample (ca. 250 mg of TQM) was weighed in 50 mL of distilled water, and the final concentration of TQM in the dissolution vessel was 2.5 mg/mL, corresponding to ca. 5-times higher concentration than the equilibrium solubility of TQM (500 μg/mL) in water [24]. At regular intervals, samples (1 mL) were withdrawn and centrifuged at 10,000×g for 5 min before being filtered through a 0.45 µm membrane filter and having the supernatant diluted with 50% methanol. The sampled dissolution medium was not replenished. At 257 nm, the amount of TQM in the media was measured spectrophotometrically.
2.6. Surface Morphology
The scanning electron microscopy (SEM) method was used to study the surface morphology of TQM samples (JEOL JSM-7600F, Tokyo, Japan) [25]. Double-sided carbon tape was used to secure the samples to an aluminum sample holder before a magnetron sputtering apparatus was used to cover the samples with platinum.
2.7. X-ray Powder Diffraction (XRPD)
Using a Mini Flex II (Rigaku, Tokyo, Japan), XRPD patterns of TQM samples were captured using Cu Kα radiation produced at 40 mA and 35 kV. Samples were scanned at a speed of 4°/min and a step size of 0.2° over a range of 2 angles from 10° to 35° [26].
2.8. Differential Scanning Calorimetry (DSC)
A Simultaneous Thermal Analyzer (NETZSCH STA 449F5TA Instruments, USA) was used to measure the thermal behavior of TQM samples [27]. The samples (3 mg) were heated at a rate of 5°C/min while purging the sample with nitrogen gas (50 mL/min). Indium was the calibration standard (8–10 mg, 99.999% pure, onset at 156.6°C).
2.9. Dynamic Light Scattering (DLS)
A Zetasizer was used to evaluate the average particle size and Zeta potential of SMSD-TQM samples suspended in water using the DLS method (MALVERN, Worcestershire, UK) [28]. All measurements were made at 25°C, and a measurement angle of 90°, and the mean diameter was estimated using photon correlation from light scattering.
2.10. Transmission Electron Microscopy (TEM)
10 mg TQM equivalent SMSD-TQM was dissolved in 1 mL of distilled water for the TEM experiment, and an aliquot (5 µL) was spread out on a 200-mesh copper grid covered with carbon. The sample was left to stand for 60 seconds before any extra solution was blotted away. The samples were then visualized under a high-resolution transmission electron microscope (F200X Talos, Thermo Fisher, Waltham, MA, USA) operating at 200 kV [29].
2.11. Fourier Transform Infrared Spectroscopy (FT-IR)
The compatibility and potential interactions between the SMSD-TQM components were evaluated using FT-IR analysis [30]. The samples were individually placed on the sample platform of the instrument (Shimadzu, IR Spirit, Japan), and IR spectra were acquired using LC Solution software in the wavenumber range of 4000–600 cm-1. For each sample, the baseline was normalized and corrected during the analysis.
2.12. Storage Stability Study
For the storage stability study, about 10 mg of each TQM sample was put into a 10 mL amber glass bottle. The samples were kept in a stability chamber for four weeks at 40°C or 40°C/75±0.5% relative humidity (RH) and two weeks at 60°C (SRH–15VEVJ2, Nagano Science Co. Ltd., Osaka, Japan). The humidity was kept under control by sealing the glass vials so that they were only exposed to the outside world at accelerated temperatures (40°C and 60°C).
2.13. Animals
Male Wister rats weighing 220±24 g (8–9 weeks old) was chosen in all animal experiments. The rats were randomly divided into three groups (each group comprises 4–6 rats). They were kept in a laboratory with free food and water access. The Faculty of Biological Sciences at the University of Dhaka's institutional Animal Care and Ethical Committee approved the study's procedures (approval number 111).
2.14. Pharmacokinetic Studies
Before administering TQM samples, experimental rats were fasted for the previous night while still being given free access to water. According to some previous reports, TQM with a dose 5−10 mg/kg exerts better clinical effects; therefore, we have selected this dose in this study [31,32]. The dose for crystalline TQM was made with a 0.25% suspension of carboxy methyl cellulose (CMC). With distilled water, SMSD-TQM dispersion was made. To determine the oral bioavailability of TQM samples, TQM was dissolved in DMSO (10 mg/mL) and delivered intravenously to rats at a 1 mg/kg dose. 300 µL of heparinized blood samples were collected from the unanesthetized tail veins of each rat at the specified time intervals of 0.25, 0.5, 1, 2, 4, and 6 h. The blood samples were then centrifuged at 10,000×g for 10 min, and 400 µL of acetonitrile and an internal standard (diclofenac at a fixed concentration of 10 µg/mL) were added. The mixture was then kept in an ice bath for one minute before being vortexed for one minute again kept on ice bath for an additional time. The samples were then centrifuged for 5 minutes at 3,000× g.
The filtrate was then analyzed by an internal standard method using a Shimadzu HPLC system composed of a SCL-20Avp system controller, an LC-20AD vp solvent delivery pump, a DGU-14A degasser, a CTO-20A vp column oven, and an SPD-20A Prominence UV-vis detector. Binary gradient mobile phase made up of Milli-Q (A) and methanol (B) delivered at a flow rate of 1.0 mL/min was used in a Phenomenex, reversed-phase C18, 150 mm×4.6 mm, 5 µm column maintained at 35°C. The mobile phase's gradient condition was as follows: 85% B for the first 20 minutes; 85-95% B for the next 5 minutes; 95-85% B for the next 5 minutes; and 85% B for the last 5 minutes. Pharmacokinetic parameters of each rat was then calculated employing non-compartmental analysis using PK solver (an add-on program in Microsoft excel) [33]. In addition, we have calculated the BA, including absolute and relative, as per the following formulas;
2.15. Nephroprotective Effect of TQM Samples
2.15.1. Rat Model of Nephropathy
As previously reported, the nephroprotective potential of TQM in rats was assessed using an animal model of nephropathy induced by cisplatin [34]. A rat model of nephropathy was prepared by intraperitoneal administration of cisplatin (6 mg/kg) dissolved in saline, and as a control experiment, saline was injected. TQM samples (10 mg/kg) were dissolved in 1 mL of distilled water and administered orally to rats at 24 h before to 72 h after cisplatin treatment repeating every 24 h. Following the oral administration of TQM samples, blood was drawn at 76 h and plasma was then obtained by centrifuging the blood at 10,000×g for 10 minutes to obtain several biomarkers of nephropathy. Until analysis, plasma samples were stored frozen at -80°C.
2.15.2. Nephrotoxic Biomarkers
2.15.2.1. Blood Urea Nitrogen (BUN)
BUN level was measured as reported previously [35]. Briefly, solution 1 containing 2 IU/mL GLDH, 0.27 mg/mL NADPH・4Na and 1.5 mg/mL α-KG (160 µL) and solution 2 containing 9 IU/mL urease and 1.5 mg/mL α-KG (40 µL) was added to the plasma sample (2.7 µL), followed by incubation in the 96-well microplate at room temperature for 10 min. After the incubation, measure the absorbance of the sample at 340 nm with the blank solution as the control using SAFIRE (TECHAN, Männedorf, Swizerland).
2.15.2.2. Creatinine
Plasma creatinine level was measured as reported previously [36]. The plasma sample (50 µL) was incubated with a deproteinizing solution comprising sodium tungstate and phosphoric acid (300 µL) for 10 minutes before being centrifuged at 2,500×g for 10 minutes. The supernatant (100 µL) was collected for mixing with 22 mmol/L picric acid (50 µL) and 0.75 mol/L sodium hydroxide solution (50 µL), followed by incubating in the 96-well microplate at 30°C for 20 min. After finishing the reaction, measure the absorbance of the sample at 520 nm with the blank solution as the control using SAFIRE TECAN.
2.15.3. Preparation of Tissue Homogenates and Evaluation of Oxidative Stress Markers
Rats were euthanized to death using ketamine (300 mg/kg b.w.) at the end of the experiment after blood samples had been collected from the animals [37]. The rats' kidneys were removed and kept for later examination. 1 g of kidney tissue was homogenized in 10 mL of phosphate buffer (pH 7.4), and the kidney samples were then centrifuged at 8000 rpm for 15 min at 4 °C. For pending analysis, the supernatant was kept in a freezer at -20°C.
Nitric oxide (NO) levels and advanced oxidative protein products (AOPP) levels were identified as indicators of oxidative stress [38,39]. By comparing NO to the corresponding blank solutions, we evaluated NO (absorbance measured at 540 nm). From a standard curve, the NO concentration was estimated as nmol/g of tissue. To calculate the amounts of AOPP, we used 5 µL of the sample, 95 µL of PBS, 50 µL of acetic acid, and 2 minutes of incubation. At 340 nm, the measurement was taken. The blank reading was measured using PBS (100 µL), 50 µL acetic acid, and potassium iodide. Finally, using the chloramine-T linear chart at 340 nm (with chloramine-T concentrations ranging from 0 to 100 nmol/mL), we computed the AOPP levels [37].
2.15.4. Study of Antioxidant Activities
Both reduced glutathione (GSH) and superoxide dismutase (SOD) are powerful antioxidant enzymes. To determine the SOD activity in kidney tissue homogenates, we used the proven techniques [37,40]. After a short interval, we filled the 96-well plates with 90 µL PBS, 10 mL tissue supernatants, and 100 µL epinephrine. To calculate differences, we measured optical density (OD) at 480 nm during various periods. A blank solution lacking of the enzyme but including all other components. To determine the GSH levels, we mixed 10 µL of tissue homogenate with 90 µL of PBS and 100 µL of DTNB. We then measured the absorbance at 412 nm as soon as a yellow color appeared [37,41].
2.15.5. Histopathology Procedure
The tissue blocks were dehydrated in ascending concentrations of ethyl alcohol after being fixed in 10% formalin overnight. After that, tissues were given a xylene treatment, paraffin-embedded, and sectioned at a thickness of 5 µ. Sections on slides were deparaffinized with xylene before tissues were rehydrated in alcohol at varying concentrations, from high to low. Later, hematoxylin and Sirius Red were used to stain tissue sections. Finally, stained slides were washed in xylene, mounted, and viewed using an Olympus DP12 light microscope (Japan) at 20X magnification.
2.16. Data analysis
The mean and standard deviation (S.D.) or standard error (S. E.) represent all data. The graphs were created with Graphpad Prism 8.0. (GraphPad Software, LaJolla, CA). With pairwise comparisons utilizing Fisher's least significant difference method, a one-way analysis of variance was employed for statistical comparisons. In each study, a p-value of 0.05 or less was considered significant.
3. Result and Discussion
3.1. Selection of a suitable Polymer for SMSD System
The apparent solubility of TQM in water was tested in several concentrations of pre-dissolved polymers such as Soluplus®, Kolliphor® P188, and Kolliphor® P407 ranging from 5 to 25 mg/mL in the present study for the selection of suitable polymers in the SMSD system for TQM. Because of their commercial availability and biocompatibility, Soluplus®, Kolliphor® P188, and Kolliphor® P407 are commonly utilized as pharmaceutical excipients with amphiphilic characteristics to increase the solubility of poorly water-soluble medicines [42,43,44]. Poorly water-soluble drugs can become more soluble through encapsulation owing to interactions between lipophilic units of amphiphilic polymers and poorly water-soluble drugs. These interactions can lead to the development of polymeric micelles with a hydrophobic core and a hydrophilic shell [45]. As shown in Figure 1, a rise in the aqueous solubility of TQM was detected when the polymer concentration increased. There was a linear association (AL-type) between increased TQM solubility and increasing polymer concentration in all studied polymers. The improvement of TQM solubility by Soluplus® and Kolliphor® P407 were statistically significant (p<0.01) compared to Kolliphor® P188. Soluplus® and Kolliphor® P407; at a concentration of 25 mg/mL, improved the aqueous solubility of TQM by 4.2 and 5.6-fold, respectively, whereas Kolliphor® P188, at the same concentration, improved it by 2.8 times. The higher dispersibility and miscibility of TQM dispersed in the polymers resulted in increased apparent solubility of TQM with amphiphilic block copolymers [46,47]. Moreover, the stability constants (Ks) were determined using a linear regression analysis of the phase solubility diagram produced and the data are presented in Table 1.
The Ks is significantly higher for Soluplus® compared to Kolliphor® P407 and Kolliphor® P188; justifying the positive effect towards solubility enhancement of TQM. These findings suggested that TQM could interact better with Soluplus®; and become entrapped in the micelle's hydrophobic core, thereby improving the solubility. The non-ionic polymer Soluplus® (polyvinyl caprolactam, polyvinyl acetate, polyethylene glycol) has been used extensively in developing solubilized formulations of poorly soluble drugs. There have been numerous reports on Soluplus®-based formulations prepared with a wide range of pharmaceutical technologies, including solid dispersion[48,49,50,51] and nanosuspensions [52], resulting in improved dissolution behavior and the oral bioavailability of drugs. Therefore, based on the apparent solubility and kinetic data, Soluplus® was chosen as the carrier for the development of SMSD-TQM to improve the physicochemical behavior of TQM.
3.2. Optimization of TQM Loading Amounts through Dissolution Studies
The solubilization efficiency of the target drug may be affected by the Drug loading of the SMSD formulation, perhaps because of the effectiveness of encapsulating the drug in micelle-like structures [17]. This research aimed to determine the optimal loading for SMSD-TQM, therefore, several loadings (from 5% to 15%) were prepared using solvent evaporation by RVD and then carried through dissolution experiments in water for 60 minutes. According to the results of the dissolution tests, after 60 minutes of mixing, crystalline TQM showed only 45% drug dissolution (Table 2). To the contrary, compared to crystalline TQM and other formulations with more significant loading amounts, SMSD-TQM with a drug loading of 10% (SMSD-TQM/10) showed a significant improvement in the dissolution behavior of TQM. The SMSD-TQM/10 formulation had the highest amount of TQM dissolved in the dissolution medium, followed by the SMSD-TQM/5 formulation, and finally, the SMSD-TQM/15 formulation. Also, the initial dissolution rates in SMSD-TQM/5, SMSD-TQM/10, and SMSD-TQM/15 were determined to be 1.12, 1.06, and 0.77 h-1. TQM's (high) affinity for the hydrophobic moiety of Soluplus®, as well as the effect of polymer concentrations, are thought to be significant contributors to the projected dissolution behavior difference [53]. A larger Soluplus® to TQM ratio may also improve TQM encapsulation inside the micelles, leading to enhanced dispersibility in water and a subsequent acceleration of TQM solubilization. As an outcome of these findings, a 10% drug loading was selected as the preliminary step for the SMSD-TQM formulation, and its physicochemical and pharmacokinetic properties were investigated.
3.3. Physicochemical Characterizations
Because of the higher energy state, amorphous forms can have higher solubility and dissolution rates than crystalline states. As a result, determining crystallinity is critical for determining product quality. XRPD and DSC studies were used to assess the crystalline state of SMSD-TQM (Figure 2). The XRPD pattern of crystalline TQM revealed several sharp peaks indicating the crystalline structure of TQM (Figure 2A). SMSD-TQM/RVD and SMSD-TQM/FD; on the other hand, exhibited the peaks detected as in crystalline TQM were minimal in the diffractogram, indicating that TQM was in an amorphous condition. In DSC analysis, although crystalline TQM had a particular endothermic peak around 47°C corresponds to the melting point of TQM (Figure 2B); hence the endothermic peak in SMSD-TQM/RVD and SMSD-TQM/FD at the melting point of crystalline TQM was lost in DSC analysis.
According to PLM images, crystalline TQM has a rough block-like structure (Figure 3A-I), SMSD-TQM/RVD has small birefringence (Figure 3A-II), and SMSD-TQM/FD has loss of polarization, which could be indicative of inner TQM in the form of an amorphous state as evidenced by negligible birefringence (Figure 3A-III). Polarization in PLM observations can indicate a crystalline material [54]; hence the lack of polarization in SMSD-TQM could indicate an amorphous condition of TQM in SMSD. The high free energy in the amorphous state may trap the drug molecule in SMSD and inhibit drug precipitation or recrystallization in the supersaturated form, which would be beneficial to improving the dissolving behavior of lipophilic drugs [55]. According to PLM, XRPD, and DSC investigations, the amorphization of DMP during the preparation procedure led to superior dissolving behavior.
The surface morphology of the TQM samples was assessed using SEM observations (Figure 3). The morphology of crystalline TQM was typical plate-shaped particles and predominantly dispersed (Figure 3B-I). On the other hand, SMSD-TQM/RVD and SMSD-TQM/FD appeared in irregular particles (Figure 3B-II and 3B-III). Compared to the crystalline TQM, in SMSD-TQM, TQM was well-integrated into the polymer, implying that it was well-absorbed. In comparison to crystalline TQM, SEM micrographs clearly show that after the freeze-drying process, the surface area of pharmacological components increased significantly (Figure 3B-III). According to the Noyes-Whitney equation, the increased surface area obtained by the micronization of particles is a significant factor in improving the dissolving rate.
On the other hand, the size distribution of polymeric micelles is thought to be one of the most critical elements in improving a drug's biopharmaceutical characteristics [46]. DLS analysis was used to examine the micellization capabilities of SMSD-TQM in this work. DLS examination of water-dispersed SMSD-TQM samples (Figure 4) revealed the creation of uniformly nano-sized particles with a mean particle size of 68 nm for SMSD-TQM/FD with a PDI of 0.125 (Figure 4, red line); and 145 nm with a PDI of 0.392 for SMSD-TQM/RVD (Figure 4, green line), respectively. Furthermore, due to their high drug solubility and increased dispersibility and diffusivity in the mucus layer by the hydrophilic chain on the surface of polymeric micelles, their size of 150 nm would aid rapid drug absorption after oral administration [56].
Therefore, the absence of crystalline TQM throughout the SMSD-TQM preparation process was confirmed by SEM pictures and DLS data. These benefits may contribute to TQM's better dissolution behavior.
Even though amorphization has the potential to improve the way a drug dissolves, the main concern is that amorphous formulations have stability issues, which limits their use in commercial formulations. In a solid dispersion formulation, an amorphous drug shown a higher tendency to degrade than it did in a crystalline condition, according to research from our group [55,57]. Under accelerated conditions, a storage stability was carried out at 40°C or 40°C/75% RH for 4 weeks, and at 60°C for 2 weeks, to test the physicochemical stability of SMSD-TQM and investigate the possibility of changes in physicochemical parameters. According to HPLC analysis, the drug contents changed negligible after storage under all conditions, and no samples showed any significant peaks caused by TQM's degradants (data not shown). Even after being stored at 40°C for 4 weeks and 60°C for 2 weeks, the surface color and shape of SMSD-TQM won't affect significantly. In contrast, the appearance of SMSD-TQM drastically changed after 4 weeks of storage at 40°C/75% RH, probably as a result of the hygroscopic nature of Soluplus® (data not shown), highlighting the requirement for moisture protection during storage. These results suggest that SMSD prepared with Soluplus® would bring better amorphization by preventing or delaying crystal formation [58], which would lead to better dissolution and better oral absorption.
3.4. Dissolution Behavior of the Optimized Formulation in Comparing the Effect of Drying in the Preparation of SMSD-TQM
Since solubility is a vital issue with crystalline TQM in therapeutic applications, in vitro dissolution tests were performed to determine whether the rate and total amount of drug release from various formulations were improved and to predict the drug release profile inside the physiological environment as well [59]. Dissolution investigations on TQM samples were conducted in water to see if different drying processes improved the dissolution behavior of SMSD-TQM, as shown in Figure 5. As a control experiment, the physical mixture of TQM and Soluplus®, exhibited poor dissolution in water as found in 60 minutes was 56.4% dissolved amount of TQM with a dissolution rate constant of 0.9, indicating crystalline TQM possessed a limited dissolution characteristic. In contrast, the dissolution behaviors of TQM in SMSD-TQM/RVD and SMSD-TQM/FD were significantly improved with complete dissolution of TQM observed within 60 min with a dissolution rate constant of 1.06 and 1.46, respectively. No traces of precipitation or agglomeration of dissolved substances was observed. The findings were in corroboration with previous studies, which showed that increasing the surface area of the particles and decreasing diffusion layer thickness as a result of pulverization can enhance the dissolution rate proportionally [60]. Due to the uniform distribution of the active components in an amphiphilic carrier, the SMSD method can increase the wettability and dispersibility of poorly water-soluble drugs [11]. During the manufacturing process, TQM and the carrier polymers were entirely dissolved in the organic solvent, which may have resulted in the dissemination of TQM at a molecular level inside the SMSD system, leading to the fast dissolution and dispersion of TQM molecules in the dissolution media. Based on these findings, it can be suggested that the dissolution time and amount of SMSD-TQM were improved compared to the crystalline TQM, which may attribute to an increased TQM oral absorption.
3.5. Drug Polymer Interactions
Theoretically, amorphous molecules are molecularly disseminated in the matrix carrier in an SD formulation, and the interaction between these molecules can lead to improved drug amorphization [61]. The molecular state of crystalline TQM and processed SMSD-TQM was assessed using FT-IR analysis (Figure 6). The distinctive strong stretching band of the carbonyl group was observed at wavenumber 1652.38 cm-1 while at 2967.13 cm-1 C-H stretching of the aliphatic groups is represented by a strong band. The stretching in the vinylic C-H in the C=C-H groups was attributed to the weaker band seen at a higher wavenumber (3254.68 cm-1). At 1612.32 cm-1, the C=C stretching produced a unique, moderately strong band. The strong carboxylic stretching band in TQM in this frequency range depicts the C=C stretching. Furthermore, the C=C stretching, which lacks methyl and isopropyl substituents, is predicted to have a lower intensity than the carboxylic band. In contrast, Soluplus® showed peaks at 3458.9 cm−1 (O–H stretching), 2924.21 cm−1 (aromatic C–H stretching), 1732.49 cm−1, 1632.35 cm−1 (C=O stretching), and 1440.64 cm−1 (C–O–C stretching) (Figure 6A–III).
The absence of a distinctive peak in the IR spectra of the SMSD-TQM/RVD and SMSD-TQM/FD indicates negligible interaction. It is a clear indication that the maximum amount of TQM was encapsulated in the core of SMSD-TQM although a little amount of TQM may be present on the surface of the nanoparticles. TQM-amount was insignificant to be detected in the comparison of SMSD-TQM, which supports the absence of any significant chemical interactions between TQM and Soluplus® during the preparation. Theoretically, interactions between lipophilic drugs and carriers in solid dispersions promote dissolution by preventing precipitation or re-crystallization [61,62].
3.6. Pharmacokinetic Assessment
The potential improvement in absorption of TQM through SMSD formulation strategy was demonstrated by pharmacokinetic studies carried out in rats after oral administration of crystalline TQM (10 mg/kg, suspended in 0.25 % CMC suspension) and SMSD-TQM (5 mg-TQM/kg, dispersed in water) (Figure 7). Values of the relevant pharmacokinetic parameters including Cmax, Tmax, t1/2, AUC0-∞, and oral BA are listed in Table 3. Oral administration of crystalline TQM exhibited poor systemic absorption with a Cmax value 165.5±23.3 ng/mL, and AUC0-6 488.1 ± 89.7 ng*h/mL. In contrast, the pharmacokinetic behavior of SMSD-TQM/RVD and SMSD-TQM/FD were better than that of crystalline TQM as shown by a rapid elevation of Cmax value of 298.2 ± 32.6 and 425.1 ± 11.2 ng/mL respectively with AUC0-6 of 1,002.5 ± 122.3 and 1,049.3 ± 44.44 ng*h/mL, respectively.
Based on the AUC0-∞ value of intravenously administered TQM (1 mg/kg), absolute bioavailabilities of crystalline TQM, SMSD-TQM/RVD, and SMSD-TQM/FD were calculated to be 2.8%, 12.5%, and 13.7%, respectively. Thus, compared to crystalline TQM, approximately 4.5 and 4.9-fold enhancement in systemic exposure were achieved with SMSD-TQM/RVD, and SMSD-TQM/FD, respectively, which could be in agreement with dissolution characteristics. It was hypothesized that the apparent absorption rate of TQM in the orally-dosed SMSD-TQM group was faster with a shorter Tmax, possibly due to the rapid dissolution of TQM via the SMSD approach. Since TQM has high membrane permeability [63], the improved dissolution and sufficiently high supersaturation of TQM could contribute to the quick absorption that can prevent the precipitation or degradation of TQM in the GI tract. However, further investigation into the absorption mechanism of micellar TQM is required before a plausible hypothesis can be proposed [64].
TQM is categorized and identified as exhibiting poor aqueous solubility. For this type of compound, absorption is limited by its dissolution rate, and a slight increase in dissolution rate may lead to a marked improvement in absorption characteristics [65]. The dissolution behavior and biopharmaceutical characteristics of poorly water-soluble compounds may be improved by exploiting the micellizing property of amphiphilic polymers in SMSD formulation [55,66]. A higher ratio of soluplus® may help to stabilize TQM under gastrointestinal circumstances by encapsulating it within the micelles of soluplus®, which may have contributed to the enhanced oral absorption of TQM in the current study [20,67]. Soluplus®, as seen in the dissolution tests, demonstrated better solubilization capacity to accomplish quick dissolution and maintain supersaturation that can inhibit recrystallization, potentially leading to a large enhancement of oral bioavailability by the spring and parachute effect [19,68].
3.7. Nephroprotective Effect of TQM Samples in Cisplatin-treated Rats
The increased oral absorption in SMSD-TQM prompted our evaluation of TQM's nephroprotective effect. In a rat model of nephropathy induced by cisplatin, the nephroprotective impact of TQM samples was assessed using BUN and creatinine levels as biomarkers of the disease. The BUN and creatinine levels of the vehicle group increased significantly by cisplatin treatment, which resulted in nephropathy (Figure 8). Oral doses of SMSD-TQM significantly reduced the elevated levels of BUN and creatinine values when compared to that of the vehicle group. The suppression rates of these elevations were estimated to be approximately 42% and 56% for creatinine and 57.3% and 63.2% for BUN for SMSD-TQM/RVD and SMSD-TQM/FD, respectively (Figure 8). While crystalline TQM likewise prevented an increase in BUN and creatinine levels by around 26% and 28%, respectively, SMSD-TQM tended to do so more so than crystalline TQM (Figure 8). In addition, the oxidative stress was also measured by determining the NO and AOPP levels in the kidney homogenates. This study demonstrated that intraperitoneal administration of cisplatin significantly increased NO and AOPP levels in the experimental rats which were discernibly lowered by the oral gavage of the drugs (TQM and SMSD-TQM) (Figure 8). Since GSH and SOD are the natural cellular antioxidants, we wanted to measure the levels of GSH and SOD to determine the capacity of the drugs to improve kidney impairment in rat models. After cisplatin administration, the levels of both GSH and SOD were profoundly decreased in the rats (Figure 8) and significantly improved by the oral gavage of TQM and SMSD-TQM in the disease model rats. In our study, we found better effects of SMSD-TQM/FD for the improvement of antioxidant enzymes in the experimental animals (Figure 8).
The anticancer drug cisplatin is frequently employed as an inducer for creating a rat model of nephropathy [34]. Exposure to cisplatin leads to rapid and acute renal impairment by various mechanisms. Due to the organic cation transporter, cisplatin is preferentially taken up by the proximal tubule in the kidney, activates apoptosis through the production of ROS and causes inflammation, calcium overload, and phospholipase activation, resulting in mitochondrial malfunction and DNA damage [69,70]. TQM possesses beneficial antioxidant and anti-apoptotic effects, can function against nephropathy and hence likely to provide a nephroprotective impact [5]. [1,71].
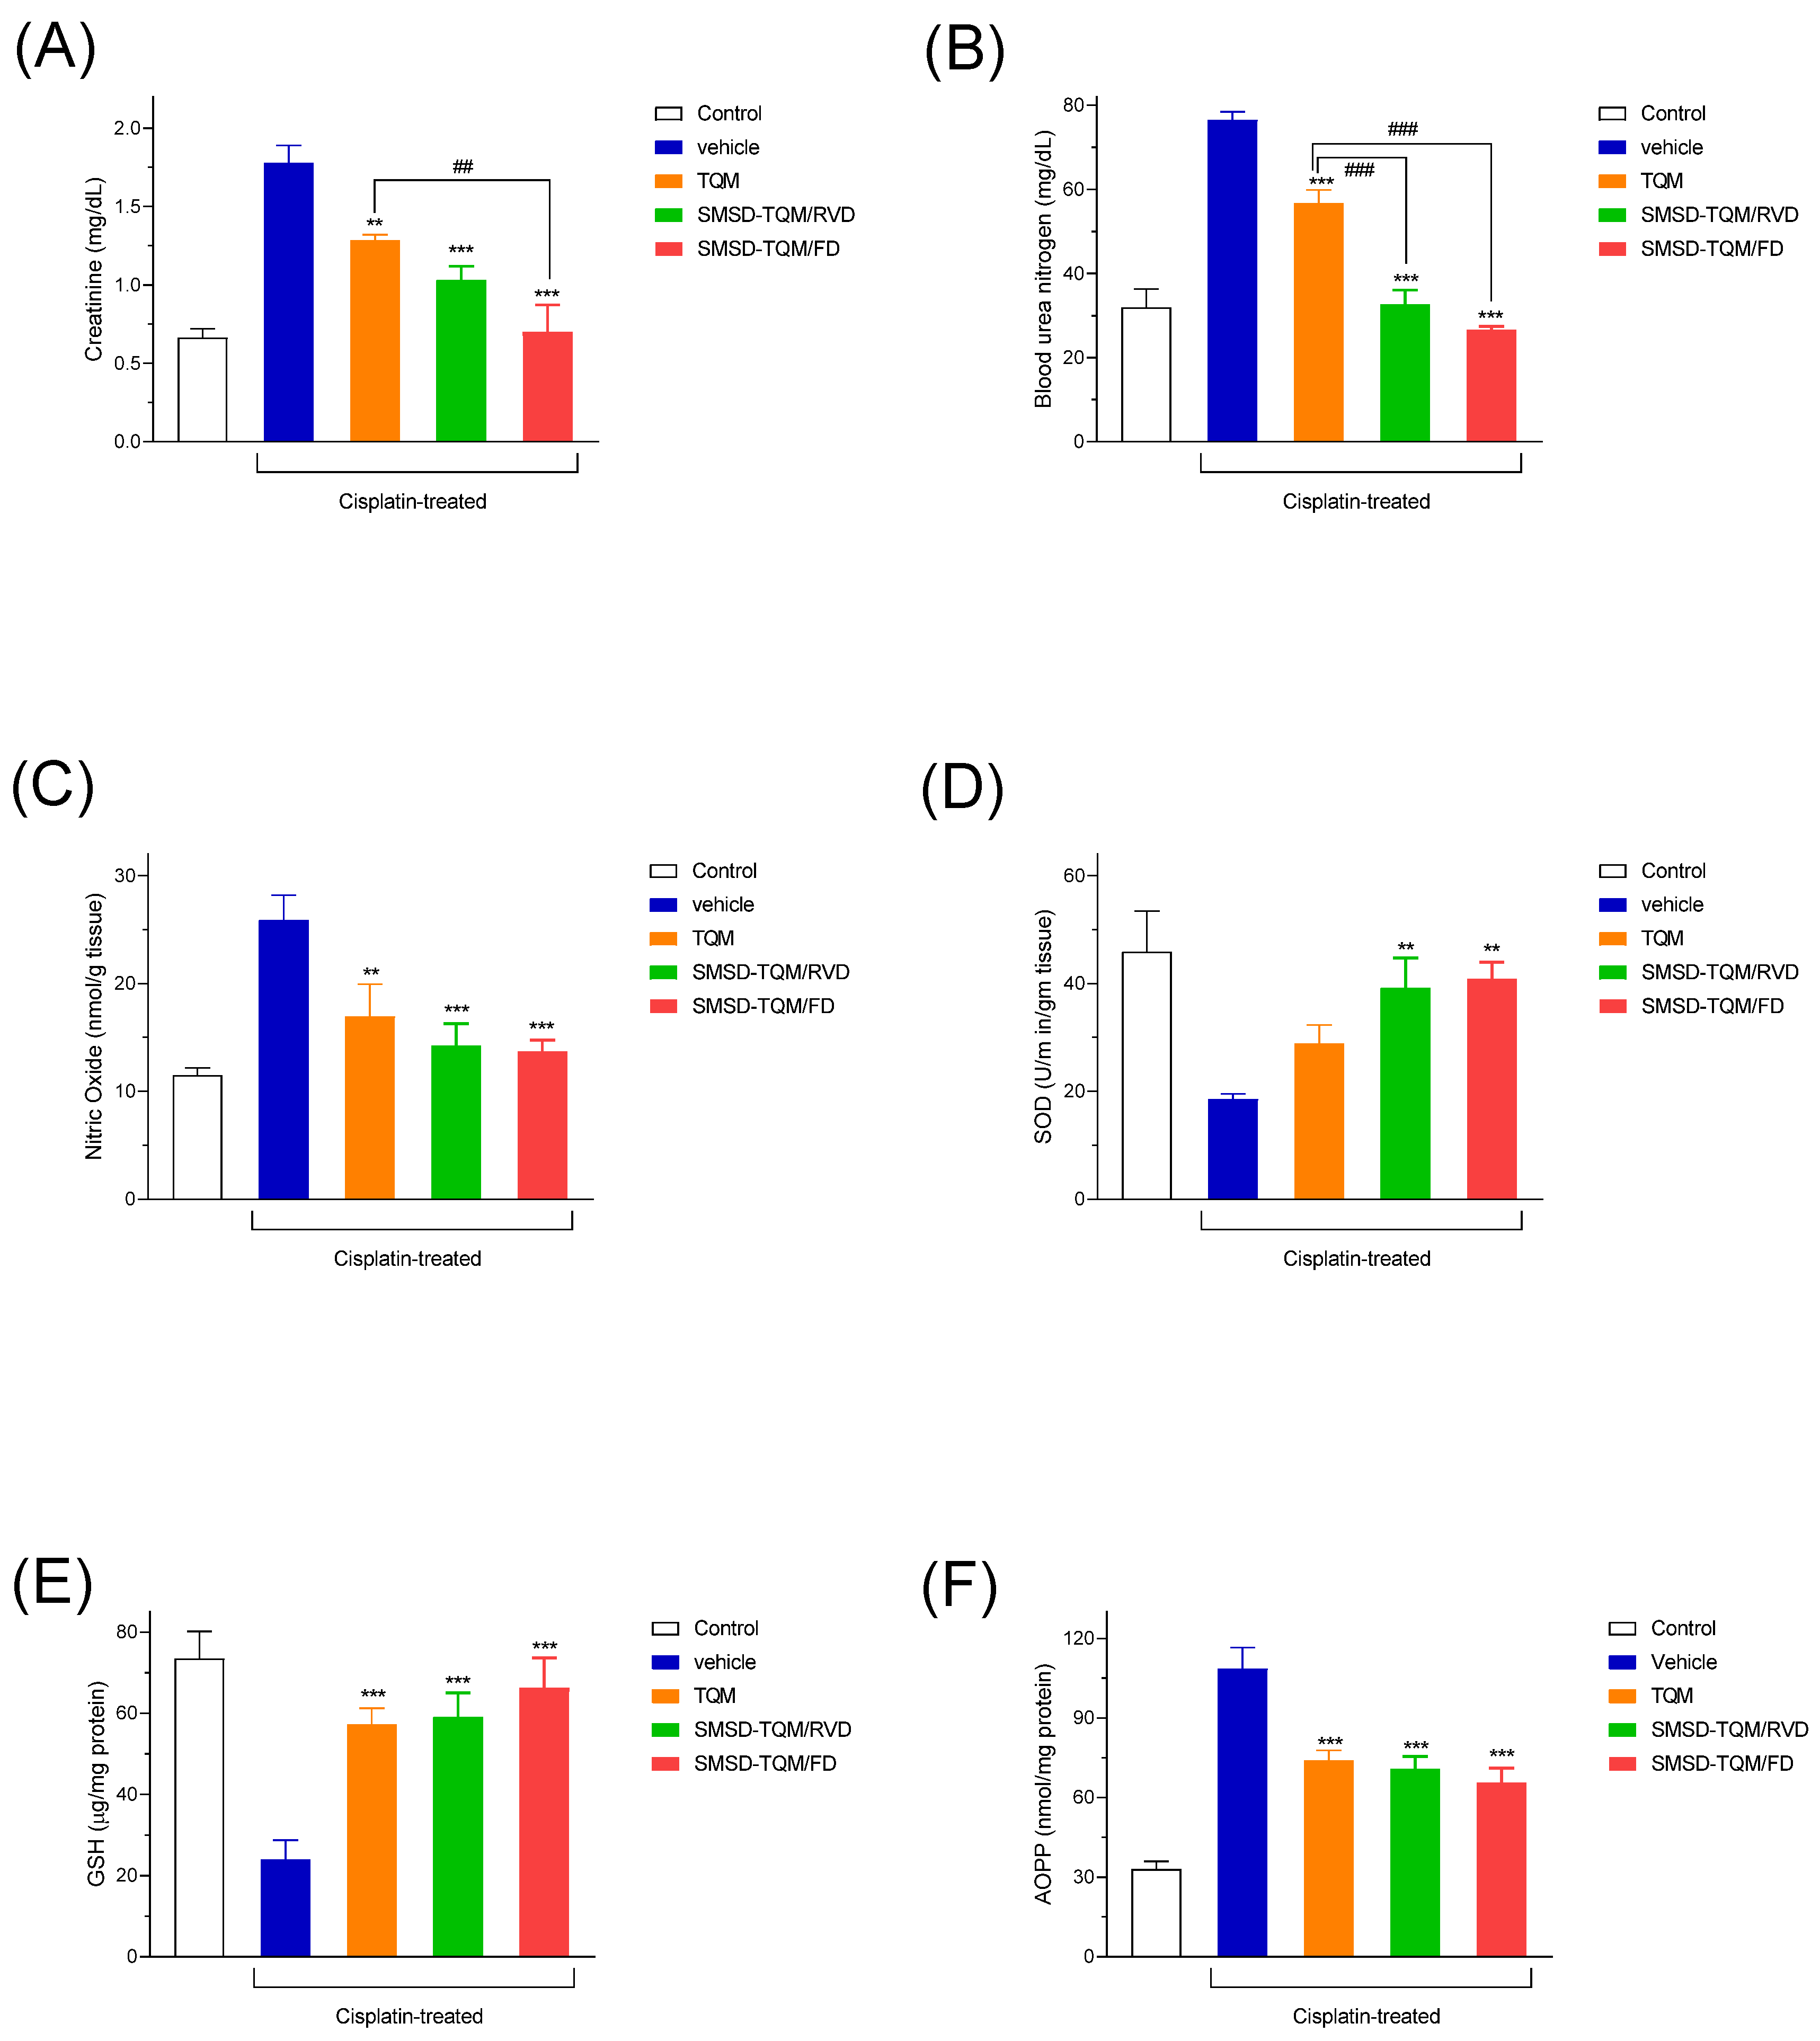
Figure 8.
Nephrotoxic potential in a rat model of nephropathy induced by cisplatin (6 mg/kg, ip). (A) Plasma creatinine, (B) BUN, (C) NO, (D) SOD, (E) GSH, and (F) AOPP levels in rats with orally dosed crystalline TQM and SMSD-TQM (10 mg/kg, 4 days). **, P<0.01; ***, P<0.001 with respect to cisplatin-treated rats; ##, P<0.01; ###, P<0.001, TQM vs. SMSD-TQM. Data represents mean ± S.E. of 4−6 experiments.
3.8. Histopathological Assessment
To further confirm the improved nephroprotective effects of SMSD-TQM, histological examination of the kidneys exposed to cisplatin caused profound degeneration and lesions in the tubular structure (small arrows) and infiltration of inflammatory cells (large arrows) in the diseased rats (Figure 9B) while compared to control rats (Figure 9A). After the treatment with TQM tubular lesion improved (yellow arrow) intensely (Figure 9C) compared to diseased rats means cisplatin-induced rats (Figure 9B). Further, oral administration of TQM formulations (SMSD-TQM/RVD, and SMSD-TQM/FD) even showed better improvement in the morphological structure of kidney tissues and tubular lesion denoted by red arrow (Figure 9D & Figure 9E), and almost no inflammatory cell infiltration. Our histological data provided better therapeutic efficacy of SMSD-based TQM formulations (SMSD-TQM/RVD, and SMSD-TQM/FD) when compared to TQM only.
4. Conclusions
To improve the physicochemical and biopharmaceutical properties, a TQM-loaded SMSD formulation was developed. The optimized SMSD-TQM formulation significantly accelerated dissolution behavior micellization. The pharmacokinetic result reveals that TQM is well absorbed orally. Because of its ability to reduce oxidative stress, SMSD-TQM has been shown in this study to have more antifibrotic effects than crystalline TQM. Thus, the TQM-loaded SMSD formulation may be a viable carrier for delivering TQM for enhanced oral bioavailability and nutraceutical properties.
Acknowledgements
This work was partly supported by a research grant from the University of Dhaka (Centennial Research Grant/Reg./Admin-3/47868, 2020-2021). The authors also wish to thank the authority of the Semiconductor Research Center, the University of Dhaka, for their kindness in permitting the particle size analysis of the samples. The authors also thank the University of Dhaka for supporting the Open Access Publication charges.
Conflict of Interests
The authors confirm that they have no known financial or interpersonal conflicts that would have appeared to have impacted the study findings of this research.
References
- Dera, A. A.; Rajagopalan, P.; Alfhili, M. A.; Ahmed, I.; Chandramoorthy, H. C. Thymoquinone attenuates oxidative stress of kidney mitochondria and exerts nephroprotective effects in oxonic acid-induced hyperuricemia rats. BioFactors 2020, 46, 292–300. [Google Scholar] [CrossRef] [PubMed]
- Banik, S.; Ghosh, A. Prevalence of chronic kidney disease in Bangladesh: a systematic review and meta-analysis. Int. Urol. Nephrol. 2021, 53, 713–718. [Google Scholar] [CrossRef] [PubMed]
- Goyal, S. N.; Prajapati, C. P.; Gore, P. R.; Patil, C. R.; Mahajan, U. B.; Sharma, C.; Talla, S. P.; Ojha, S. K. Therapeutic potential and pharmaceutical development of thymoquinone: A multitargeted molecule of natural origin. Front. Pharmacol. 2017, 8, 1–19. [Google Scholar] [CrossRef] [PubMed]
- Shaterzadeh-Yazdi, H.; Noorbakhsh, M.-F.; Samarghandian, S.; Farkhondeh, T. An Overview on Renoprotective Effects of Thymoquinone. Kidney Dis. 2018, 4, 74–82. [Google Scholar] [CrossRef] [PubMed]
- Farooqui, Z.; Shahid, F.; Khan, A. A.; Khan, F. Oral administration of Nigella sativa oil and thymoquinone attenuates long term cisplatin treatment induced toxicity and oxidative damage in rat kidney. Biomed. Pharmacother. 2017, 96, 912–923. [Google Scholar] [CrossRef] [PubMed]
- Al-Ali, A.; Alkhawajah, A. A.; Randhawa, M. A.; Shaikh, N. A. Oral and intraperitoneal LD50 of thymoquinone, an active principle of Nigella sativa, in mice and rats. J. Ayub Med. Coll. Abbottabad 2008, 20, 25–27. [Google Scholar]
- Elmowafy, M.; Samy, A.; Raslan, M. A.; Salama, A.; Said, R. A.; Abdelaziz, A. E.; El-Eraky, W.; El Awdan, S.; Viitala, T. Enhancement of Bioavailability and Pharmacodynamic Effects of Thymoquinone Via Nanostructured Lipid Carrier (NLC) Formulation. AAPS PharmSciTech 2016, 17, 663–672. [Google Scholar] [CrossRef] [PubMed]
- Fahmy, H. M.; Khardrawy, Y. A.; Abd-El Daim, T. M.; Elfeky, A. S.; Abd Rabo, A. A.; Mustafa, A. B.; Mostafa, I. T. Thymoquinone-encapsulated chitosan nanoparticles coated with polysorbate 80 as a novel treatment agent in a reserpine-induced depression animal model. Physiol. Behav. 2020, 222, 112934. [Google Scholar] [CrossRef]
- Shire, S. J. Formulation of proteins and monoclonal antibodies (mAbs). In Monoclonal Antibodies; 2015; pp. 93–120 ISBN 9780081002964.
- Yoshioka, M.; Hancock, B. C.; Zografi, G. Crystallization of Indomethacin from the Amorphous State below and above Its Glass Transition Temperature. J. Pharm. Sci. 1994, 83, 1700–1705. [Google Scholar] [CrossRef]
- Sareen, S.; Joseph, L.; Mathew, G. Improvement in solubility of poor water-soluble drugs by solid dispersion. Int. J. Pharm. Investig. 2012, 2, 12. [Google Scholar] [CrossRef]
- Alam, M. A.; Ali, R.; Al-Jenoobi, F. I.; Al-Mohizea, A. M. Solid dispersions: a strategy for poorly aqueous soluble drugs and technology updates. Expert Opin. Drug Deliv. 2012, 9, 1419–1440. [Google Scholar] [CrossRef]
- Benzoate, E. Application of Solid Dispersion Technique to. 2019, 1–18.
- Rodriguez-Aller, M.; Guillarme, D.; Veuthey, J. L.; Gurny, R. Strategies for formulating and delivering poorly water-soluble drugs. J. Drug Deliv. Sci. Technol. 2015, 30, 342–351. [Google Scholar] [CrossRef]
- Chavan, R. B.; Thipparaboina, R.; Kumar, D.; Shastri, N. R. Co amorphous systems: A product development perspective. Int. J. Pharm. 2016, 515, 403–415. [Google Scholar] [CrossRef]
- Onoue, S.; Yamada, S.; Chan, H. K. Nanodrugs: Pharmacokinetics and safety. Int. J. Nanomedicine 2014, 9, 1025–1037. [Google Scholar] [CrossRef] [PubMed]
- Onoue, S.; Suzuki, H.; Kojo, Y.; Matsunaga, S.; Sato, H. Self-micellizing solid dispersion of cyclosporine A with improved dissolution and oral bioavailability. Eur. J. Pharm. Sci. 2014, 62, 16–22. [Google Scholar] [CrossRef]
- Suzuki, H.; Kojo, Y.; Yakushiji, K.; Yuminoki, K.; Hashimoto, N.; Onoue, S. Strategic application of self-micellizing solid dispersion technology to respirable powder formulation of tranilast for improved therapeutic potential. Int. J. Pharm. 2016, 499, 255–262. [Google Scholar] [CrossRef] [PubMed]
- Halder, S.; Suzuki, H.; Seto, Y.; Sato, H.; Onoue, S. Megestrol acetate-loaded self-micellizing solid dispersion system for improved oral absorption and reduced food effect. J. Drug Deliv. Sci. Technol. 2019, 49, 586–593. [Google Scholar] [CrossRef]
- Shi, N. Q.; Zhang, Y.; Li, Y.; Lai, H. W.; Xiao, X.; Feng, B.; Qi, X. R. Self-micellizing solid dispersions enhance the properties and therapeutic potential of fenofibrate: Advantages, profiles and mechanisms. Int. J. Pharm. 2017, 528, 563–577. [Google Scholar] [CrossRef] [PubMed]
- Avsar, S. Y.; Kyropoulou, M.; Leone, S. Di; Schoenenberger, C. A.; Meier, W. P.; Palivan, C. G. Biomolecules turn self-assembling amphiphilic block co-polymer platforms into biomimetic interfaces. Front. Chem. 2019, 7, 1–29. [Google Scholar] [CrossRef]
- Noor, N. S.; Kaus, N. H. M.; Szewczuk, M. R.; Hamid, S. B. S. Formulation, characterization and cytotoxicity effects of novel thymoquinone-plga-pf68 nanoparticles. Int. J. Mol. Sci. 2021, 22. [Google Scholar] [CrossRef]
- Higuchi, T.; Connors, K. A. Phase Solubility Studies. Adv. Anal. Chem. Instrum. 1965, 4, 117–212. [Google Scholar]
- Bergonzi, M. C.; Vasarri, M.; Marroncini, G.; Barletta, E.; Degl’Innocenti, D. Thymoquinone-loaded soluplus®-solutol® HS15 mixed micelles: Preparation, in vitro characterization, and effect on the SH-SY5Y cell migration. Molecules 2020, 25, 1–17. [Google Scholar] [CrossRef] [PubMed]
- Amidon, G. E.; Secreast, P. J.; Mudie, D. Chapter 8 - Particle, Powder, and Compact Characterization. In Developing Solid Oral Dosage Forms; Qiu, Y., Chen, Y., Zhang, G. G. Z., Liu, L., Porter, W. R., Eds.; Academic Press: San Diego, 2009; pp. 163–186. ISBN 978-0-444-53242-8. [Google Scholar]
- Vogt, F. G.; Williams, G. R. Advanced Approaches to Effective Solid-State Analysis: X-Ray Diffraction, Vibrational Spectroscopy and Solid-State NMR. ChemInform 2011, 42. [Google Scholar] [CrossRef]
- Amarachi, A. Differential Scanning Calorimetry: A Review. Int. J. Appl. Biol. Pharm. Technol. 2020, 1, 1–7. [Google Scholar]
- Bhattacharjee, S. DLS and zeta potential – What they are and what they are not ? J. Control. Release 2016, 235, 337–351. [Google Scholar] [CrossRef] [PubMed]
- Malatesta, M. Transmission Electron Microscopy as a Powerful Tool to Investigate the Interaction of Nanoparticles with Subcellular Structures. Int. J. Mol. Sci. 2021, 22. [Google Scholar] [CrossRef] [PubMed]
- Song, Y.; Cong, Y.; Wang, B.; Zhang, N. Applications of Fourier transform infrared spectroscopy to pharmaceutical preparations. Expert Opin. Drug Deliv. 2020, 17, 551–571. [Google Scholar] [CrossRef] [PubMed]
- Ahmad, A.; Khan, R. M. A.; Alkharfy, K. M.; Raish, M.; Al-Jenoobi, F. I.; Al-Mohizea, A. M. Effects of thymoquinone on the pharmacokinetics and pharmacodynamics of glibenclamide in a rat model. Nat. Prod. Commun. 2015, 10, 1395–1398. [Google Scholar] [CrossRef] [PubMed]
- Hosseinzadeh, H.; Parvardeh, S.; Asl, M. N.; Sadeghnia, H. R.; Ziaee, T. Effect of thymoquinone and Nigella sativa seeds oil on lipid peroxidation level during global cerebral ischemia-reperfusion injury in rat hippocampus. Phytomedicine 2007, 14, 621–627. [Google Scholar] [CrossRef]
- Zhang, Y.; Huo, M.; Zhou, J.; Xie, S. PKSolver: An add-in program for pharmacokinetic and pharmacodynamic data analysis in Microsoft Excel. Comput. Methods Programs Biomed. 2010, 99, 306–314. [Google Scholar] [CrossRef]
- Choie, D. D.; Longnecker, D. S.; del Campo, A. A. Acute and chronic cisplatin nephropathy in rats. Lab. Invest. 1981, 44, 397–402. [Google Scholar] [PubMed]
- Sampson, E. J.; Baird, M. A. Chemical inhibition used in a kinetic urease/glutamate dehydrogenase method for urea in serum. Clin. Chem. 1979, 25, 1721–1729. [Google Scholar] [CrossRef] [PubMed]
- Nihei, T.; Sato, H.; Onoue, S. Biopharmaceutical characterization of a novel sustained-release formulation of allopurinol with reduced nephrotoxicity. Biopharm. Drug Dispos. 2021, 42, 78–84. [Google Scholar] [CrossRef] [PubMed]
- Shill, M. C.; Bepari, A. K.; Khan, M.; Tasneem, Z.; Ahmed, T.; Hasan, M. A.; Alam, M. J.; Hossain, M.; Rahman, M. A.; Sharker, S. M.; Shahriar, M.; Rahman, G. M. S.; Reza, H. M. Therapeutic potentials of colocasia affinis leaf extract for the alleviation of streptozotocin-induced diabetes and diabetic complications: In vivo and in silico-based studies. J. Inflamm. Res. 2021, 14, 443–459. [Google Scholar] [CrossRef] [PubMed]
- Tracey, W. R.; Tse, J.; Carter, G. Lipopolysaccharide-induced changes in plasma nitrite and nitrate concentrations in rats and mice: pharmacological evaluation of nitric oxide synthase inhibitors. J. Pharmacol. Exp. Ther. 1995, 272, 1011–1015. [Google Scholar] [PubMed]
- Witko-Sarsat, V.; Friedlander, M.; Capeillère-Blandin, C.; Nguyen-Khoa, T.; Nguyen, A. T.; Zingraff, J.; Jungers, P.; Descamps-Latscha, B. Advanced oxidation protein products as a novel marker of oxidative stress in uremia. Kidney Int. 1996, 49, 1304–1313. [Google Scholar] [CrossRef] [PubMed]
- Misra, H. P.; Fridovich, I. The Role of Superoxide Anion in the Autoxidation of Epinephrine and a Simple Assay for Superoxide Dismutase. J. Biol. Chem. 1972, 247, 3170–3175. [Google Scholar] [CrossRef] [PubMed]
- Jollow, D. J.; Mitchell, J. R.; Zampaglione, N.; Gillette, J. R. Bromobenzene-Induced Liver Necrosis. Protective Role of Glutathione and Evidence for 3,4-Bromobenzene Oxide as the Hepatotoxic Metabolite. Pharmacology 1974, 11, 151–169. [Google Scholar] [CrossRef]
- Vasconcelos, T.; Marques, S.; Sarmento, B. The biopharmaceutical classification system of excipients. Ther. Deliv. 2017, 8, 65–78. [Google Scholar] [CrossRef]
- Ilie, A.-R.; Griffin, B. T.; Vertzoni, M.; Kuentz, M.; Kolakovic, R.; Prudic-Paus, A.; Malash, A.; Bohets, H.; Herman, J.; Holm, R. Exploring precipitation inhibitors to improve in vivo absorption of cinnarizine from supersaturated lipid-based drug delivery systems. Eur. J. Pharm. Sci. 2021, 159, 105691. [Google Scholar] [CrossRef]
- Gangarde, Y. M.; T. K., S.; Panigrahi, N. R.; Mishra, R. K.; Saraogi, I. Amphiphilic Small-Molecule Assemblies to Enhance the Solubility and Stability of Hydrophobic Drugs. ACS Omega 2020, 5, 28375–28381. [Google Scholar] [CrossRef] [PubMed]
- Onoue, S.; Kojo, Y.; Suzuki, H.; Yuminoki, K.; Kou, K.; Kawabata, Y.; Yamauchi, Y.; Hashimoto, N.; Yamada, S. Development of novel solid dispersion of tranilast using amphiphilic block copolymer for improved oral bioavailability. Int. J. Pharm. 2013, 452, 220–226. [Google Scholar] [CrossRef] [PubMed]
- Ghezzi, M.; Pescina, S.; Padula, C.; Santi, P.; Del Favero, E.; Cantù, L.; Nicoli, S. Polymeric micelles in drug delivery: An insight of the techniques for their characterization and assessment in biorelevant conditions. J. Control. Release 2021, 332, 312–336. [Google Scholar] [CrossRef] [PubMed]
- Pereira, J. M.; Mejia-Ariza, R.; Ilevbare, G. A.; McGettigan, H. E.; Sriranganathan, N.; Taylor, L. S.; Davis, R. M.; Edgar, K. J. Interplay of Degradation, Dissolution and Stabilization of Clarithromycin and Its Amorphous Solid Dispersions. Mol. Pharm. 2013, 10, 4640–4653. [Google Scholar] [CrossRef] [PubMed]
- Ha, E.; Baek, I.; Cho, W.; Hwang, S.; Kim, M. Preparation and evaluation of solid dispersion of atorvastatin calcium with Soluplus® by spray drying technique. Chem. Pharm. Bull. (Tokyo). 2014, 62, 545–51. [Google Scholar] [CrossRef] [PubMed]
- Lee, J. Y.; Kang, W. S.; Piao, J.; Yoon, I. S.; Kim, D. D.; Cho, H. J. Soluplus®/TPGSGS-based solid dispersions prepared by hot-melt extrusion equipped with twin-screw systems for enhancing oral bioavailability of valsartan. Drug Des. Devel. Ther. 2015, 9, 2745–2756. [Google Scholar] [CrossRef] [PubMed]
- Lin, Q.; Fu, Y.; Li, J.; Qu, M.; Deng, L.; Gong, T.; Zhang, Z. A (polyvinyl caprolactam-polyvinyl acetate-polyethylene glycol graft copolymer)-dispersed sustained-release tablet for imperialine to simultaneously prolong the drug release and improve the oral bioavailability. Eur. J. Pharm. Sci. 2015, 79, 44–52. [Google Scholar] [CrossRef] [PubMed]
- Xia, D.; Yu, H.; Tao, J.; Zeng, J.; Zhu, Q.; Zhu, C.; Gan, Y. Supersaturated polymeric micelles for oral cyclosporine A delivery: The role of Soluplus-sodium dodecyl sulfate complex. Colloids Surfaces B Biointerfaces 2016, 141, 301–310. [Google Scholar] [CrossRef]
- Zhang, K.; Yu, H.; Luo, Q.; Yang, S.; Lin, X.; Zhang, Y.; Tian, B.; Tang, X. Increased dissolution and oral absorption of itraconazole/Soluplus extrudate compared with itraconazole nanosuspension. Eur. J. Pharm. Biopharm. 2013, 85, 1285–1292. [Google Scholar] [CrossRef]
- Batrakova, E. V; Kabanov, A. V Pluronic block copolymers: Evolution of drug delivery concept from inert nanocarriers to biological response modifiers. J. Control. Release 2008, 130, 98–106. [Google Scholar] [CrossRef]
- Li, C.; Zhu, Y. Quantitative polarized light microscopy using spectral multiplexing interferometry. Opt. Lett. 2015, 40, 2622–2625. [Google Scholar] [CrossRef] [PubMed]
- Onoue, S.; Suzuki, H.; Kojo, Y.; Matsunaga, S.; Sato, H.; Mizumoto, T.; Yuminoki, K.; Hashimoto, N.; Yamada, S. Self-micellizing solid dispersion of cyclosporine A with improved dissolution and oral bioavailability. Eur. J. Pharm. Sci. 2014, 62, 16–22. [Google Scholar] [CrossRef]
- Ki, B.; Soo, J.; Kang, S.; Young, S.; Hong, S. Development of self-microemulsifying drug delivery systems (SMEDDS) for oral bioavailability enhancement of simvastatin in beagle dogs. 2004, 274, 65–73. [Google Scholar] [CrossRef]
- Onoue, S.; Nakamura, T.; Uchida, A.; Ogawa, K.; Yuminoki, K.; Hashimoto, N.; Hiza, A.; Tsukaguchi, Y.; Asakawa, T.; Kan, T.; Yamada, S. Physicochemical and biopharmaceutical characterization of amorphous solid dispersion of nobiletin, a citrus polymethoxylated flavone, with improved hepatoprotective effects. Eur. J. Pharm. Sci. 2013, 49, 453–460. [Google Scholar] [CrossRef] [PubMed]
- Serajuddln, A. T. M. Solid dispersion of poorly water-soluble drugs: Early promises, subsequent problems, and recent breakthroughs. J. Pharm. Sci. 1999, 88, 1058–1066. [Google Scholar] [CrossRef]
- Bai, G.; Wang, Y.; Armenante, P. M. Velocity profiles and shear strain rate variability in the USP Dissolution Testing Apparatus 2 at different impeller agitation speeds. Int. J. Pharm. 2011, 403, 1–14. [Google Scholar] [CrossRef]
- Dokoumetzidis, A.; Macheras, P. A century of dissolution research: From Noyes and Whitney to the Biopharmaceutics Classification System. Int. J. Pharm. 2006, 321, 1–11. [Google Scholar] [CrossRef]
- Onoue, S.; Kojo, Y.; Aoki, Y.; Kawabata, Y.; Yamauchi, Y.; Yamada, S. Physicochemical and pharmacokinetic characterization of amorphous solid dispersion of tranilast with enhanced solubility in gastric fluid and improved oral bioavailability. Drug Metab. Pharmacokinet. 2012, 27, 379–87. [Google Scholar] [CrossRef] [PubMed]
- Pandey, M. M.; Jaipal, A.; Charde, S. Y.; Goel, P.; Kumar, L. Dissolution enhancement of felodipine by amorphous nanodispersions using an amphiphilic polymer: insight into the role of drug–polymer interactions on drug dissolution. Pharm. Dev. Technol. 2016, 21, 463–474. [Google Scholar] [CrossRef]
- Shariare, M. H.; Khan, M. A.; Al-Masum, A.; Khan, J. H.; Uddin, J.; Kazi, M. Development of Stable Liposomal Drug Delivery System of Thymoquinone and Its In Vitro Anticancer Studies Using Breast Cancer and Cervical Cancer Cell Lines. Molecules 2022, 27. [Google Scholar] [CrossRef]
- Morgen, M.; Bloom, C.; Beyerinck, R.; Bello, A.; Song, W.; Wilkinson, K.; Steenwyk, R.; Shamblin, S. Polymeric Nanoparticles for Increased Oral Bioavailability and Rapid Absorption Using Celecoxib as a Model of a Low-Solubility, High-Permeability Drug. Pharm. Res. 2012, 29, 427–440. [Google Scholar] [CrossRef]
- Kohli, K.; Chopra, S.; Dhar, D.; Arora, S.; Khar, R. K. Self-emulsifying drug delivery systems: An approach to enhance oral bioavailability. Drug Discov. Today 2010, 15, 958–965. [Google Scholar] [CrossRef] [PubMed]
- Kawabata, Y.; Wada, K.; Nakatani, M.; Yamada, S.; Onoue, S. Formulation design for poorly water-soluble drugs based on biopharmaceutics classification system: Basic approaches and practical applications. Int. J. Pharm. 2011, 420, 1–10. [Google Scholar] [CrossRef] [PubMed]
- Kojo, Y.; Matsunaga, S.; Suzuki, H.; Sato, H.; Seto, Y.; Onoue, S. Improved oral absorption profile of itraconazole in hypochlorhydria by self-micellizing solid dispersion approach. Eur. J. Pharm. Sci. 2017, 97, 55–61. [Google Scholar] [CrossRef] [PubMed]
- Banik, S.; Sato, H.; Onoue, S. Self-micellizing solid dispersion of atorvastatin with improved physicochemical stability and oral absorption. J. Drug Deliv. Sci. Technol. 2022, 68, 103065. [Google Scholar] [CrossRef]
- Marullo, R.; Werner, E.; Degtyareva, N.; Moore, B.; Altavilla, G.; Ramalingam, S. S.; Doetsch, P. W. Cisplatin induces a mitochondrial-ROS response that contributes to cytotoxicity depending on mitochondrial redox status and bioenergetic functions. PLoS One 2013, 8, e81162. [Google Scholar] [CrossRef] [PubMed]
- Soni, H.; Kaminski, D.; Gangaraju, R.; Adebiyi, A. Cisplatin-induced oxidative stress stimulates renal Fas ligand shedding. Ren. Fail. 2018, 40, 314–322. [Google Scholar] [CrossRef]
- Lutfi, M. F.; Abdel-Moneim, A. M. H.; Alsharidah, A. S.; Mobark, M. A.; Abdellatif, A. A. H.; Saleem, I. Y.; Rugaie, O. Al; Mohany, K. M.; Alsharidah, M. Thymoquinone lowers blood glucose and reduces oxidative stress in a rat model of diabetes. Molecules 2021, 26, 1–13. [Google Scholar] [CrossRef]
Figure 1.
Apparent solubility of TQM in the aqueous solution of Soluplus®, Kolliphor® P188 and, Kolliphor® P407 at various concentrations (5–25 mg/mL). Data presented as mean ± S.D. (n = 3).
Figure 1.
Apparent solubility of TQM in the aqueous solution of Soluplus®, Kolliphor® P188 and, Kolliphor® P407 at various concentrations (5–25 mg/mL). Data presented as mean ± S.D. (n = 3).
Figure 2.
Crystallinity assessment of TQM samples using (A) XRPD and (B) DSC. (I) Crystalline TQM, (II) SMSD-TQM/RVD, and (III) SMSD-TQM/FD.
Figure 2.
Crystallinity assessment of TQM samples using (A) XRPD and (B) DSC. (I) Crystalline TQM, (II) SMSD-TQM/RVD, and (III) SMSD-TQM/FD.
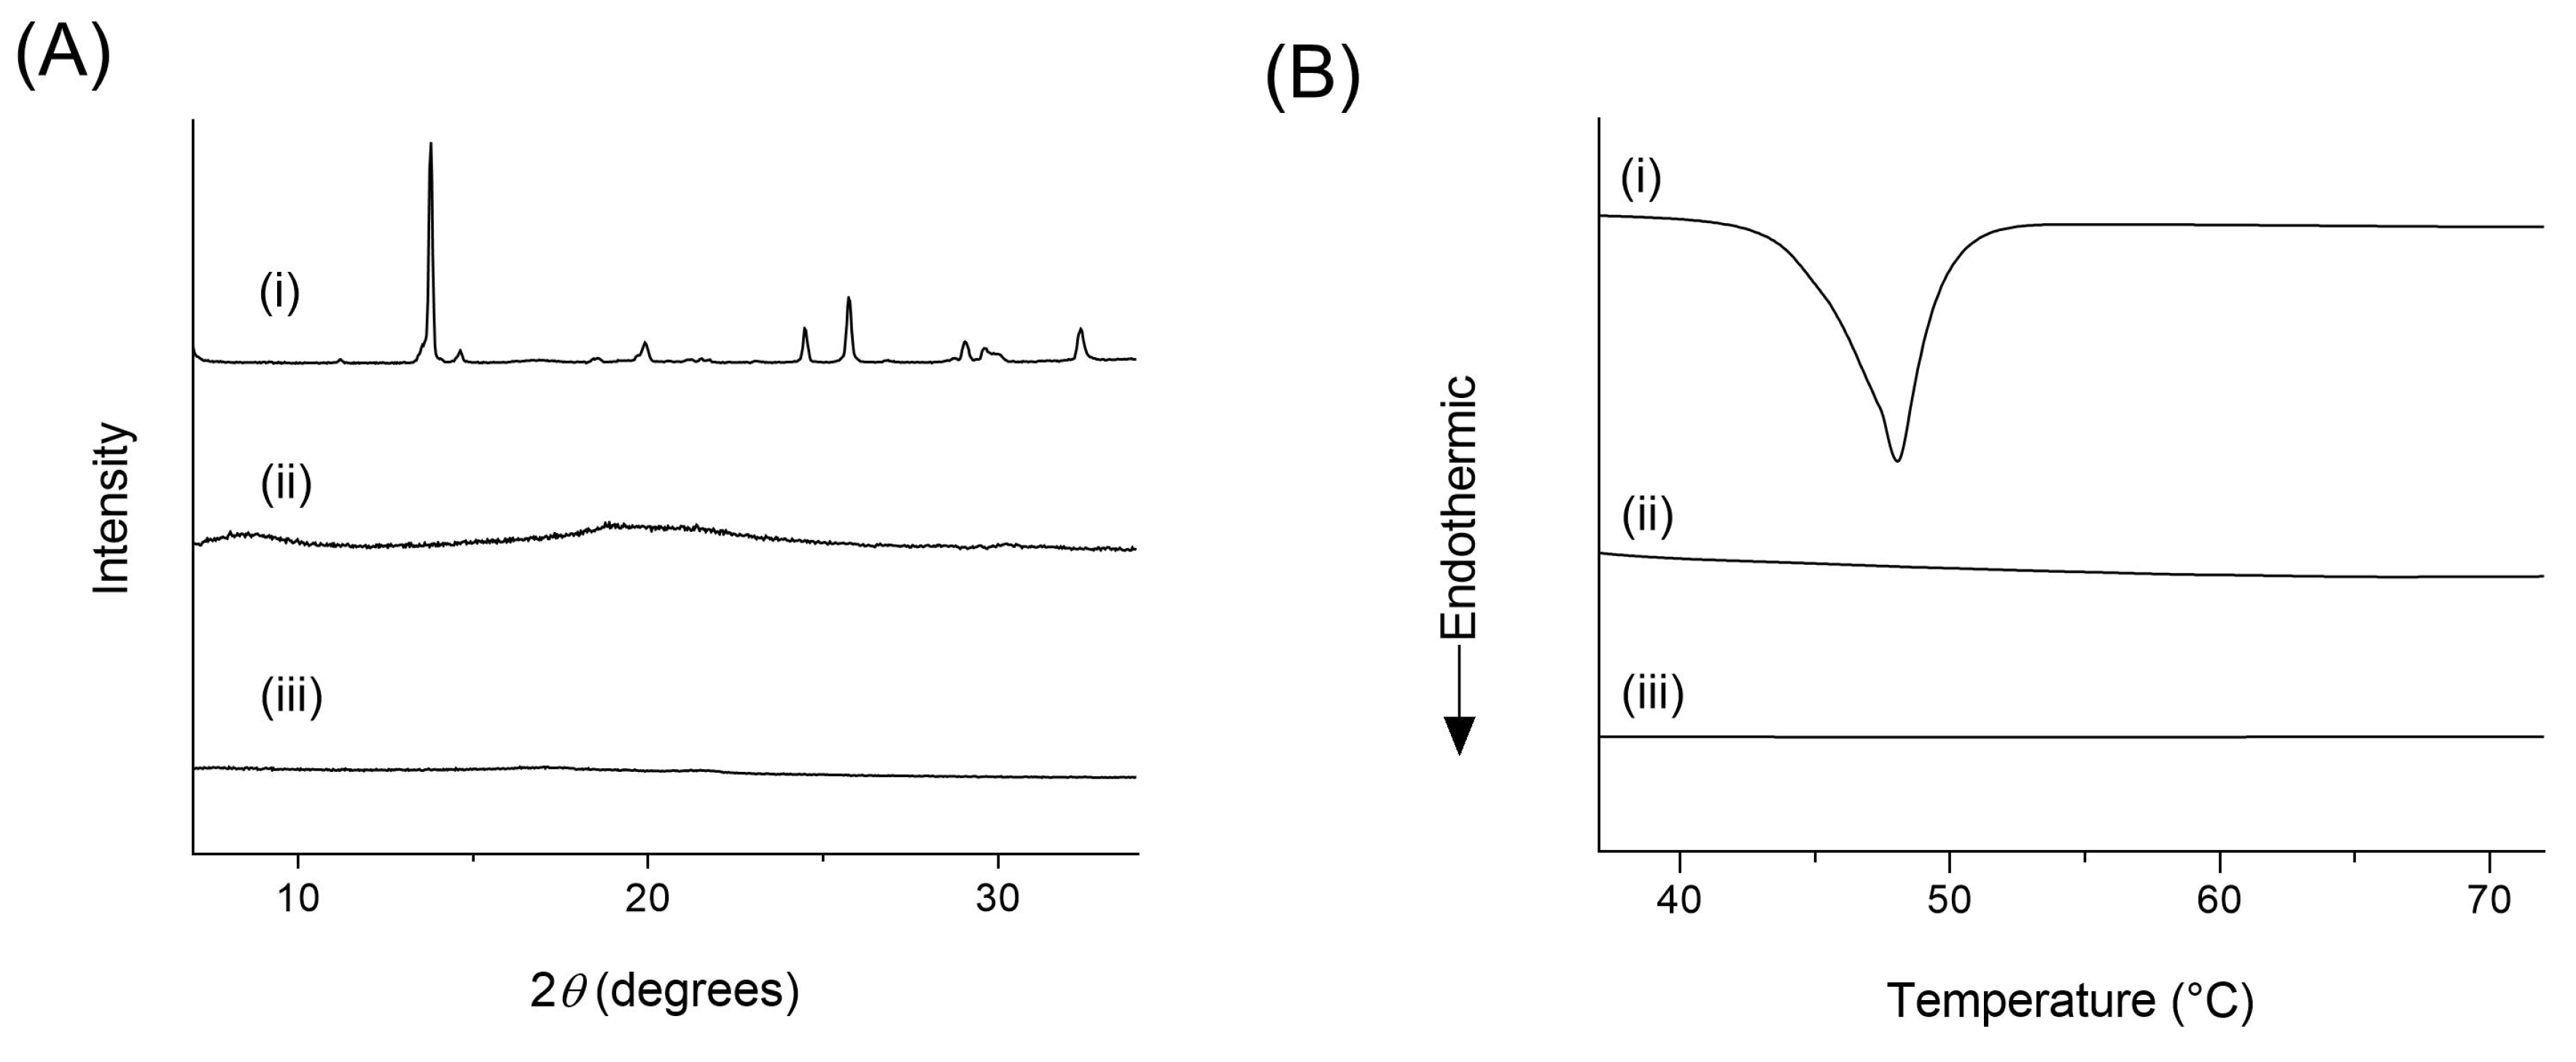
Figure 3.
Microscopic images observed by polarized light microscope (A) and scanning electron microscope (B). (I) Crystalline TQM, (II) SMSD-TQM/RVD, and (III) SMSD-TQM/FD. Each black and white bar represents 100 μm and 50 μm, respectively.
Figure 3.
Microscopic images observed by polarized light microscope (A) and scanning electron microscope (B). (I) Crystalline TQM, (II) SMSD-TQM/RVD, and (III) SMSD-TQM/FD. Each black and white bar represents 100 μm and 50 μm, respectively.
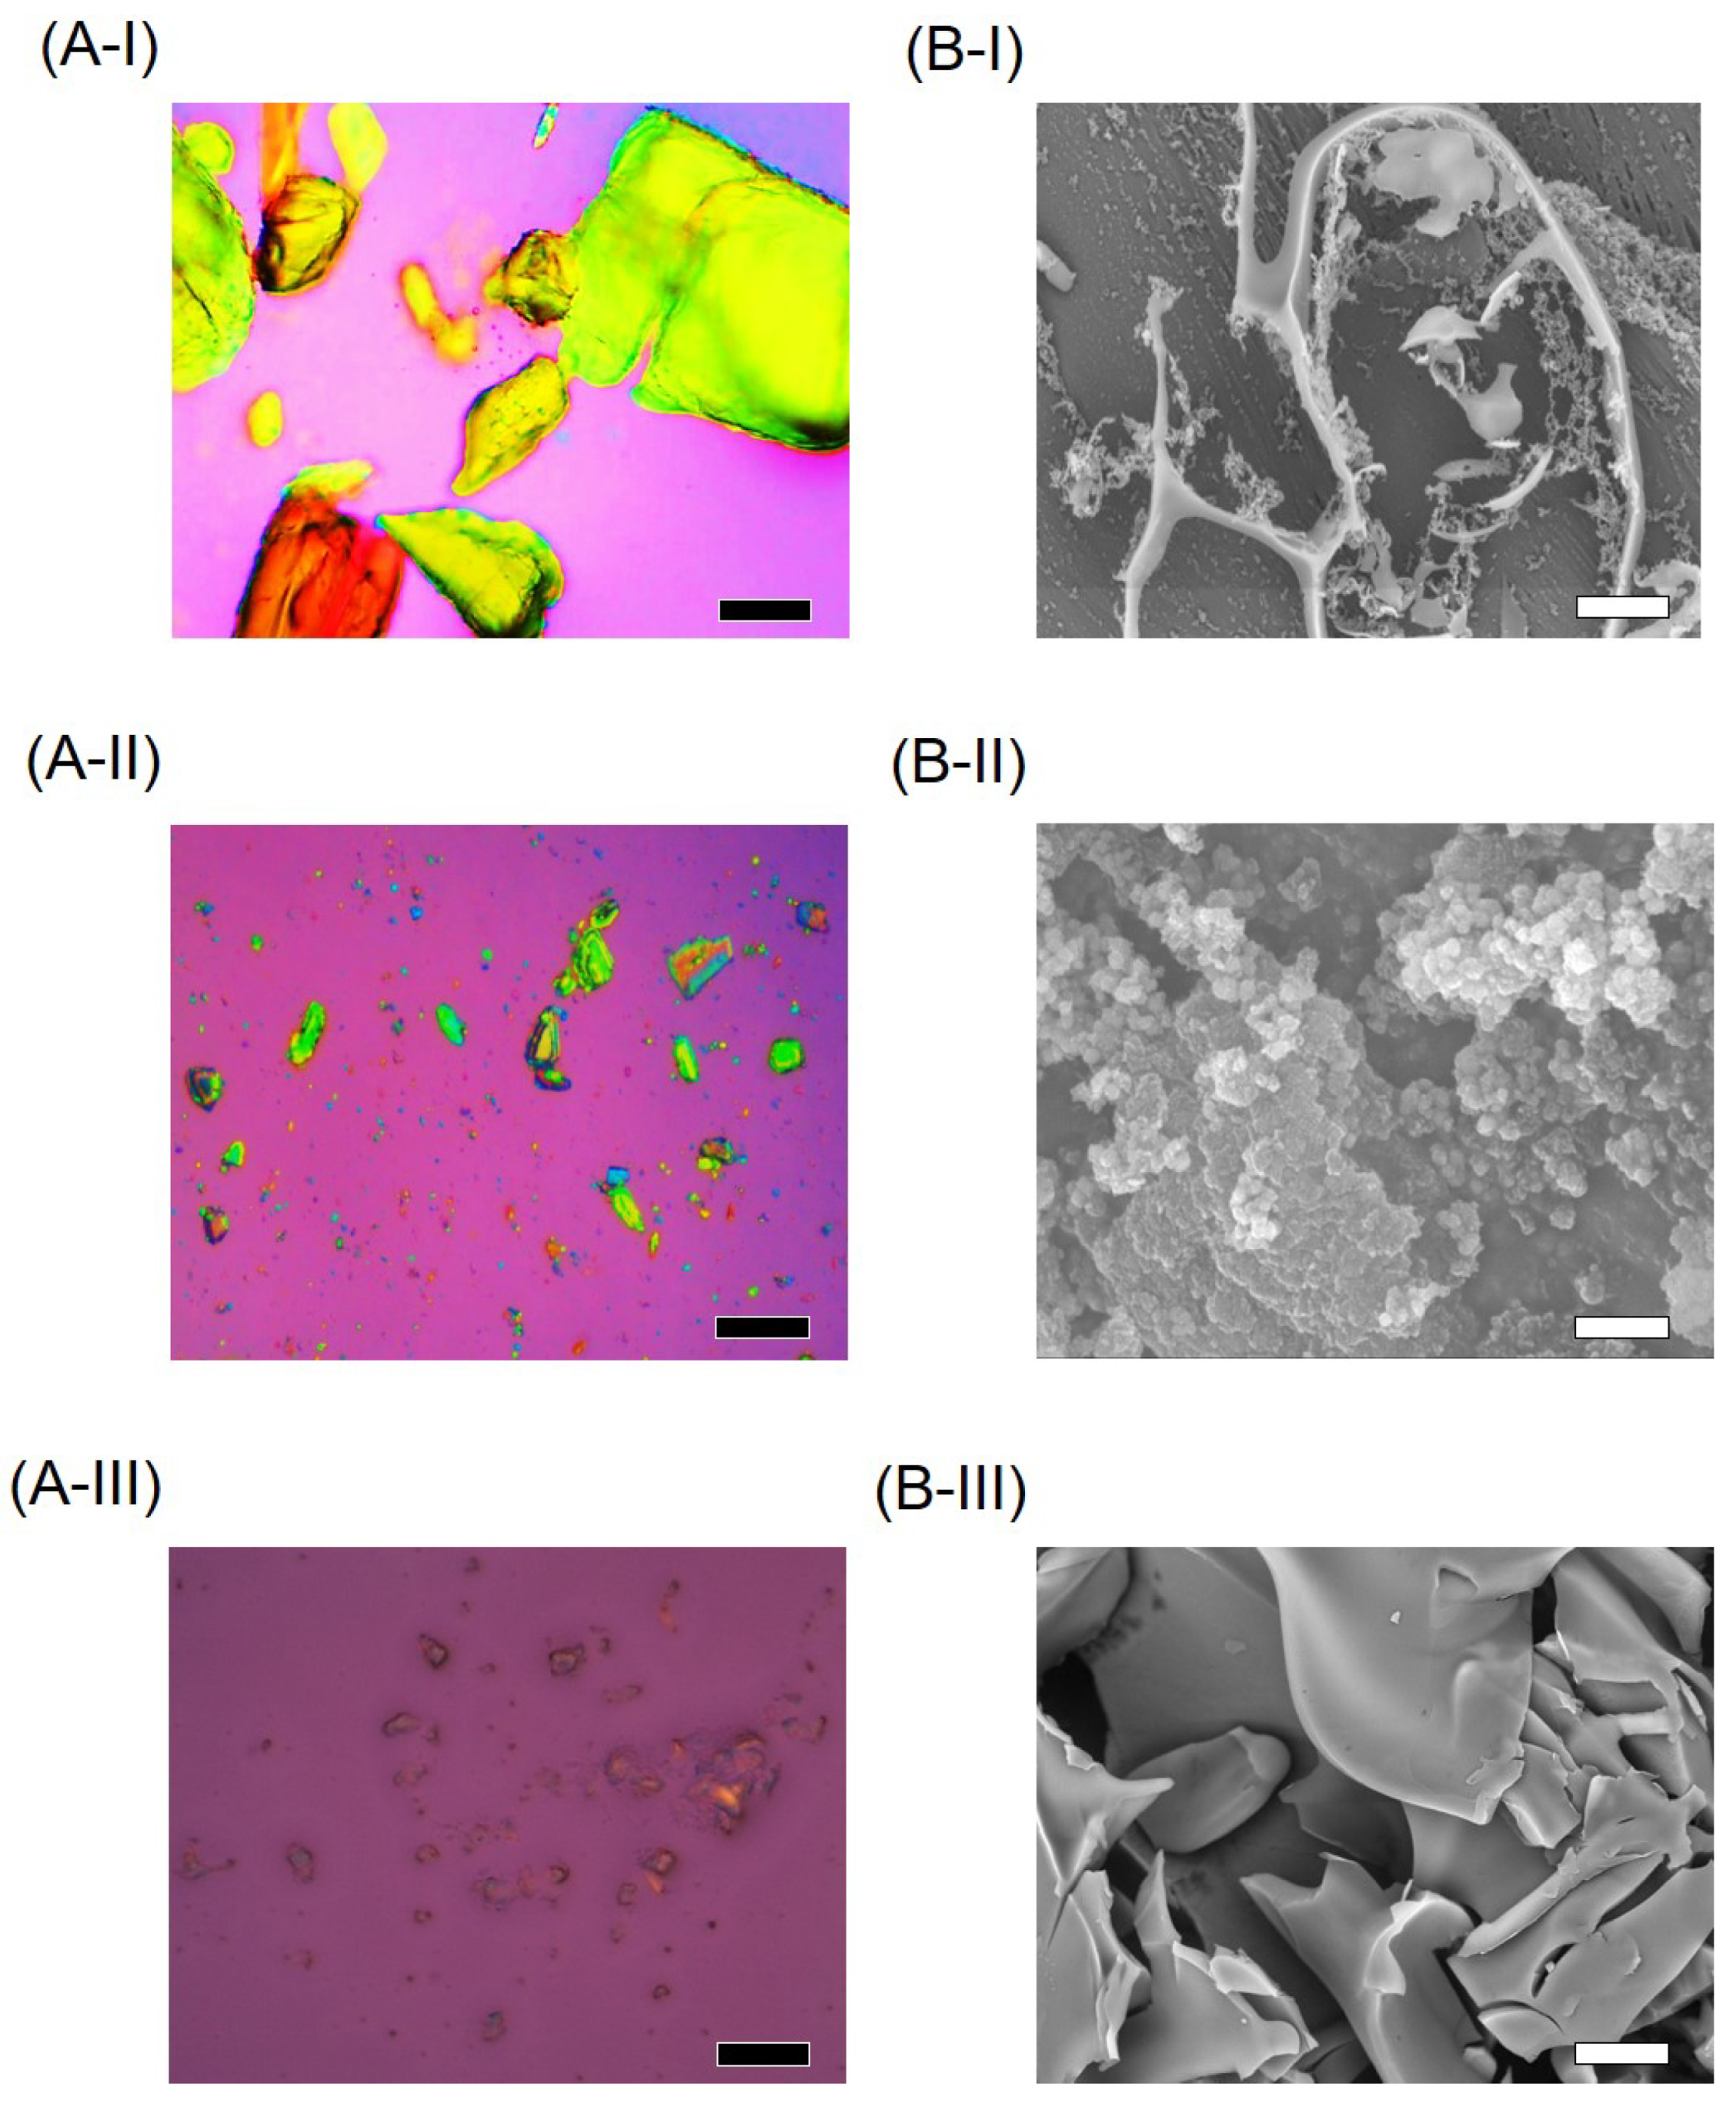
Figure 4.
Micelle forming potency of TQM samples dispersed in water. (A) Micelle size distribution of SMSD-TQM spread in distilled water as determined by DLS analysis: the red line represents the particle size distribution of SMSD-TQM/FD; and the green line represents the particle size distribution of SMSD-TQM/RVD. (B) TEM image of SMSD-TQM dispersed in distilled water. Bar represents 500 nm.
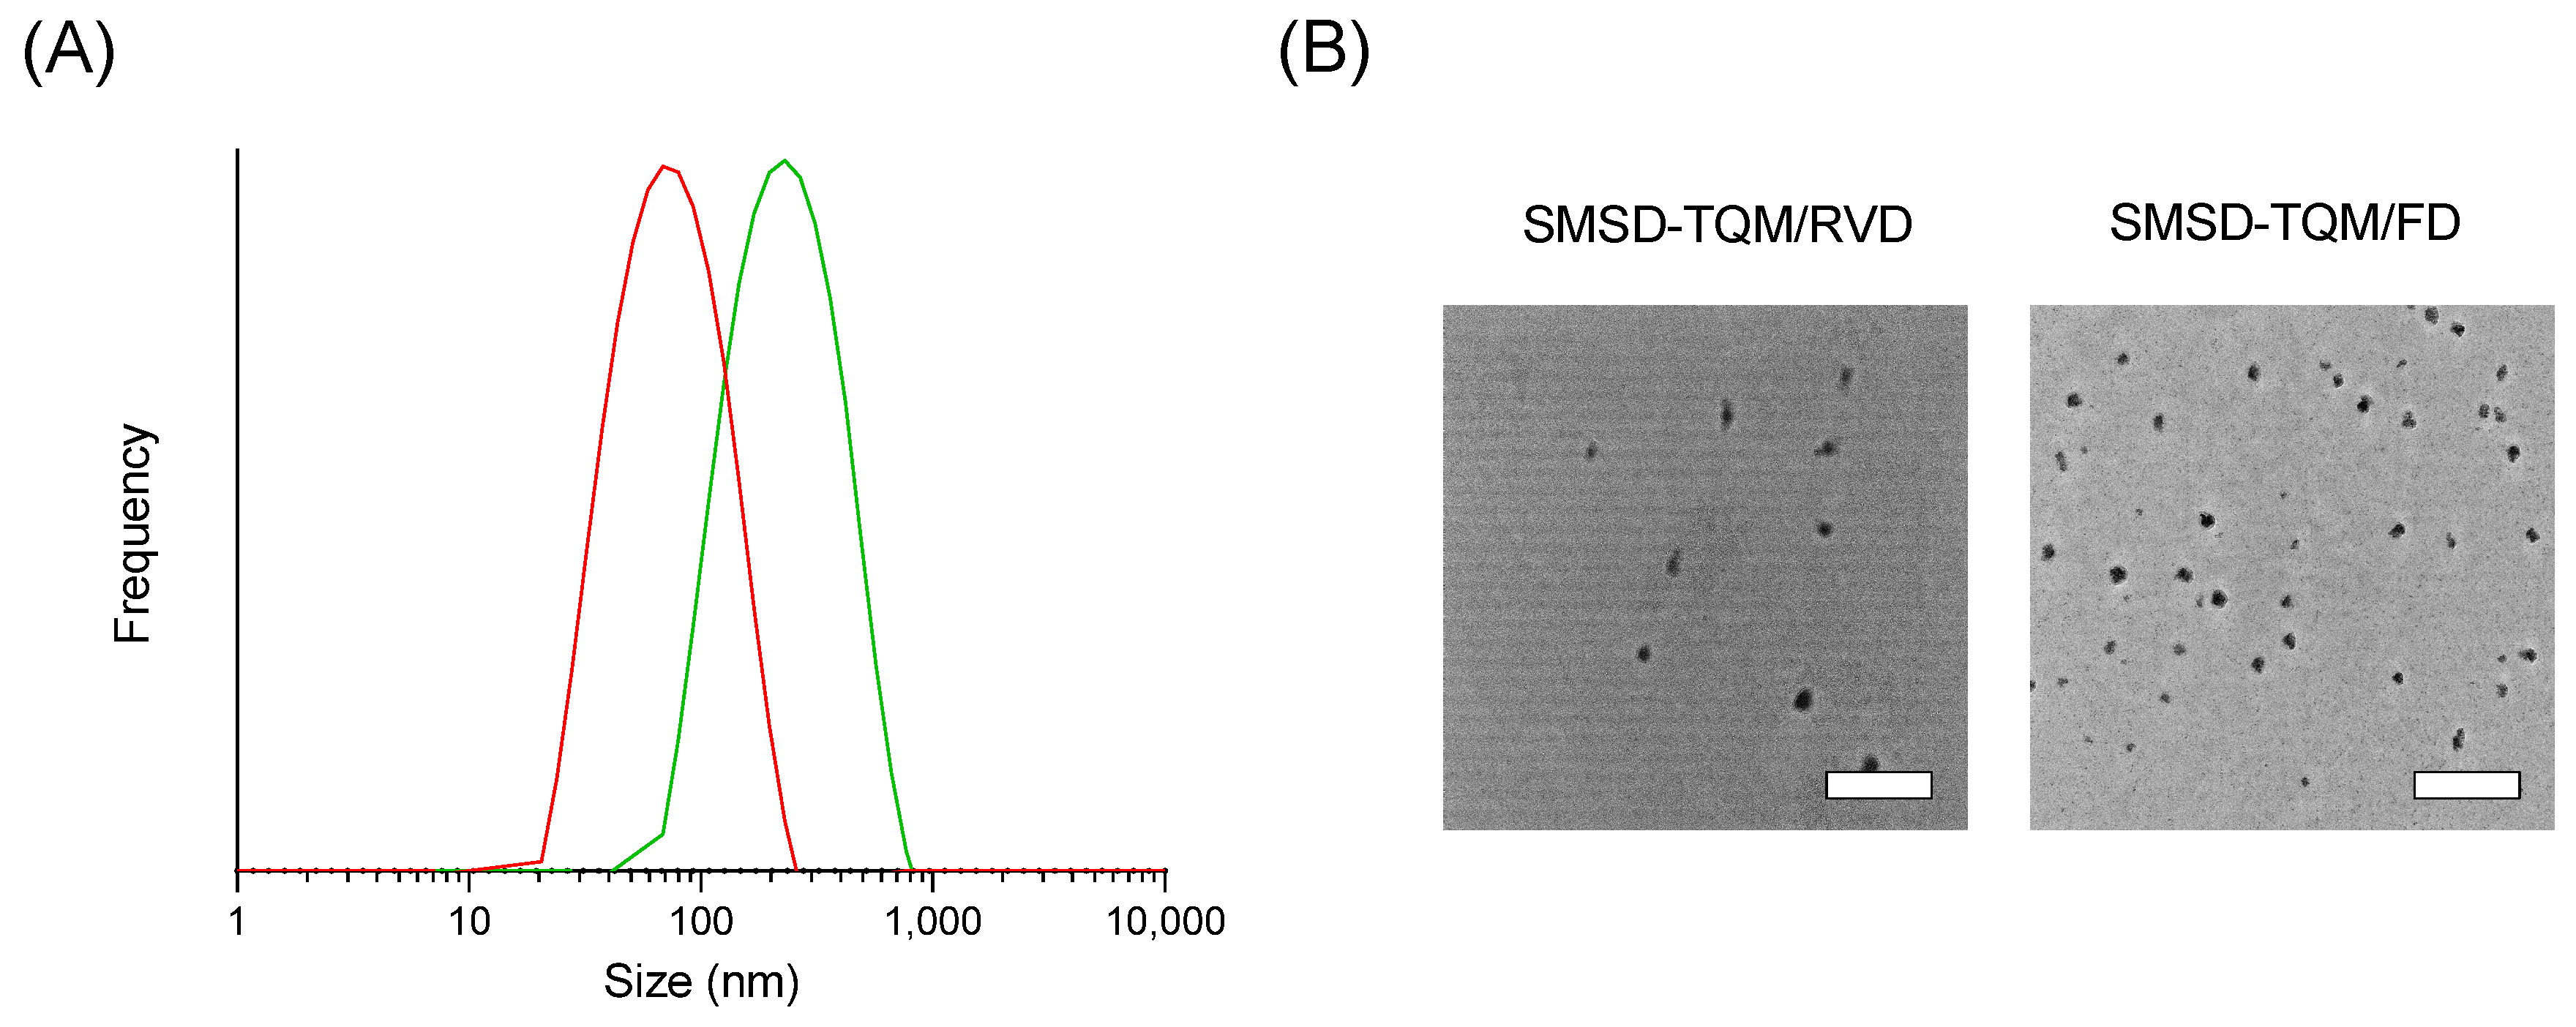
Figure 5.
Dissolution tests of TQM samples in water. ○, crystalline TQM; △, SMSD-TQM/RVD; ▽, PM of TQM and Soluplus®, and ◇, SMSD-TQM/FD. Data represent the mean ± S.D. of 3 experiments.
Figure 5.
Dissolution tests of TQM samples in water. ○, crystalline TQM; △, SMSD-TQM/RVD; ▽, PM of TQM and Soluplus®, and ◇, SMSD-TQM/FD. Data represent the mean ± S.D. of 3 experiments.
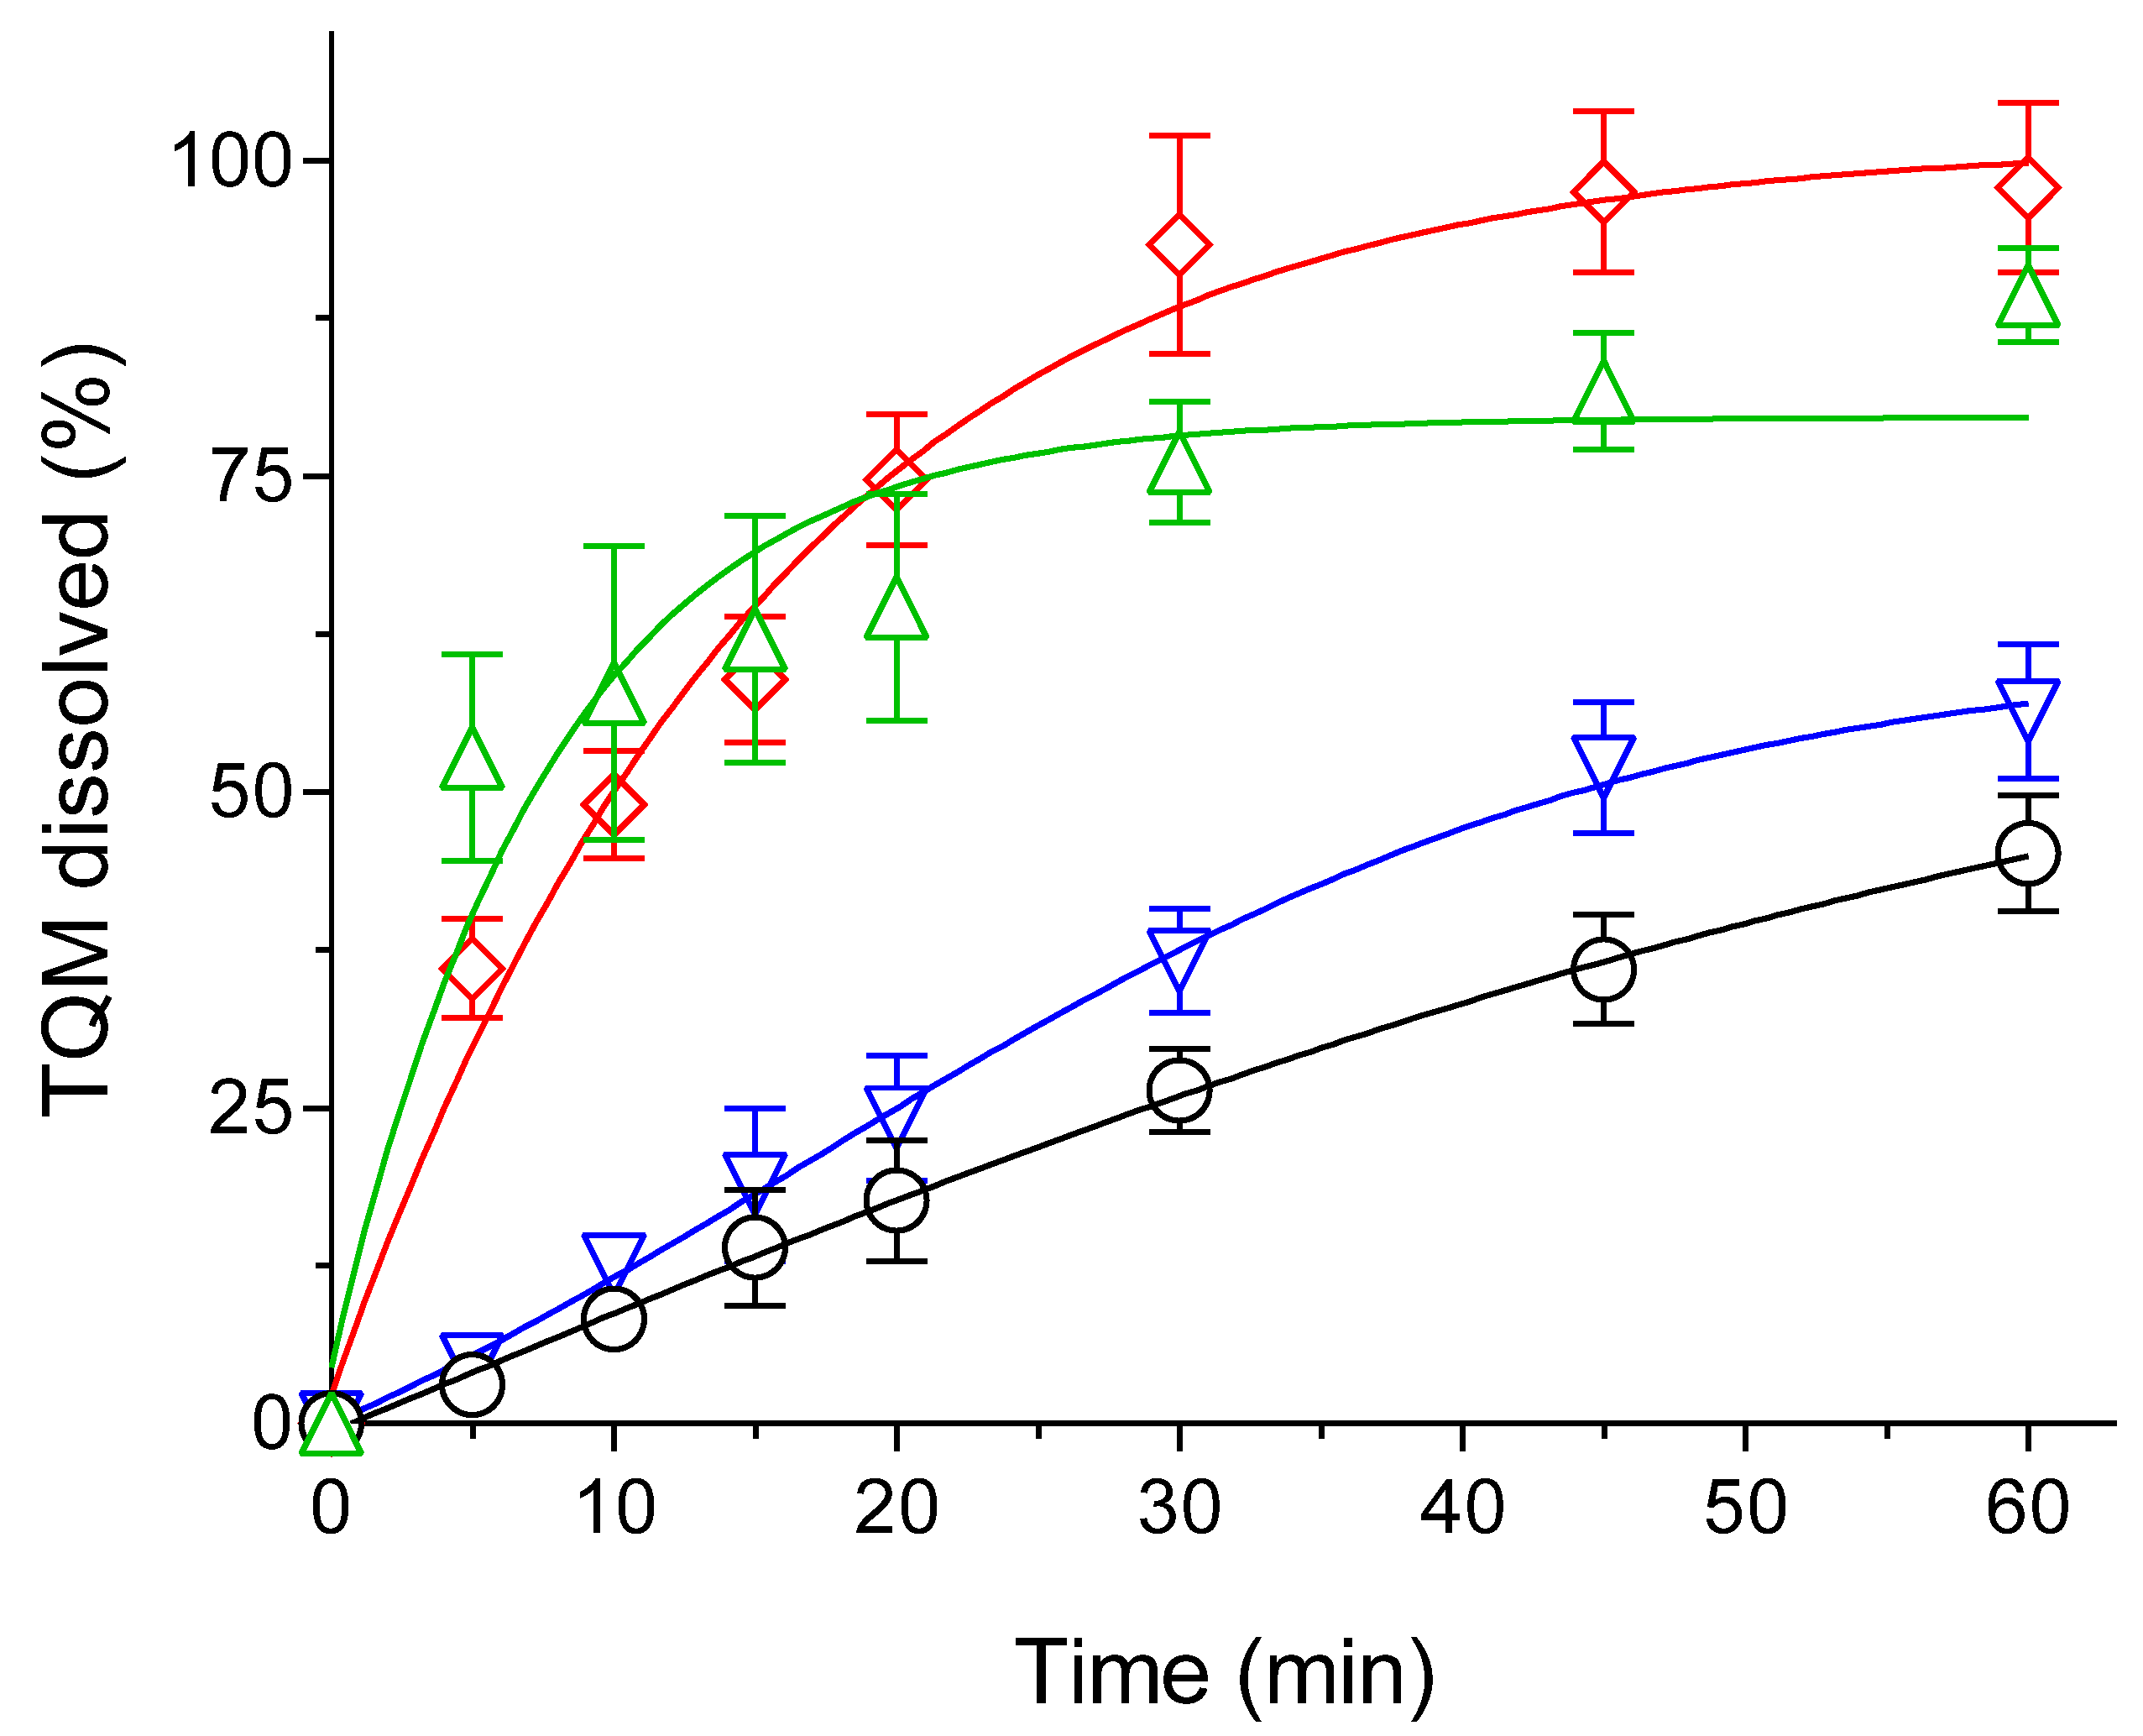
Figure 6.
Drug-polymer interaction studies of TQM samples using FT-IR. Baseline-corrected and normalized IR data of TQM samples in the spectral wavenumber region from (A) 4,000–600 cm−1 and (B) 1,800–1,300 cm−1. (I) SMSD-TQM/FD, (II) SMSD-TQM/RVD (III) Soluplus®, and (IV) Crystalline TQM.
Figure 6.
Drug-polymer interaction studies of TQM samples using FT-IR. Baseline-corrected and normalized IR data of TQM samples in the spectral wavenumber region from (A) 4,000–600 cm−1 and (B) 1,800–1,300 cm−1. (I) SMSD-TQM/FD, (II) SMSD-TQM/RVD (III) Soluplus®, and (IV) Crystalline TQM.
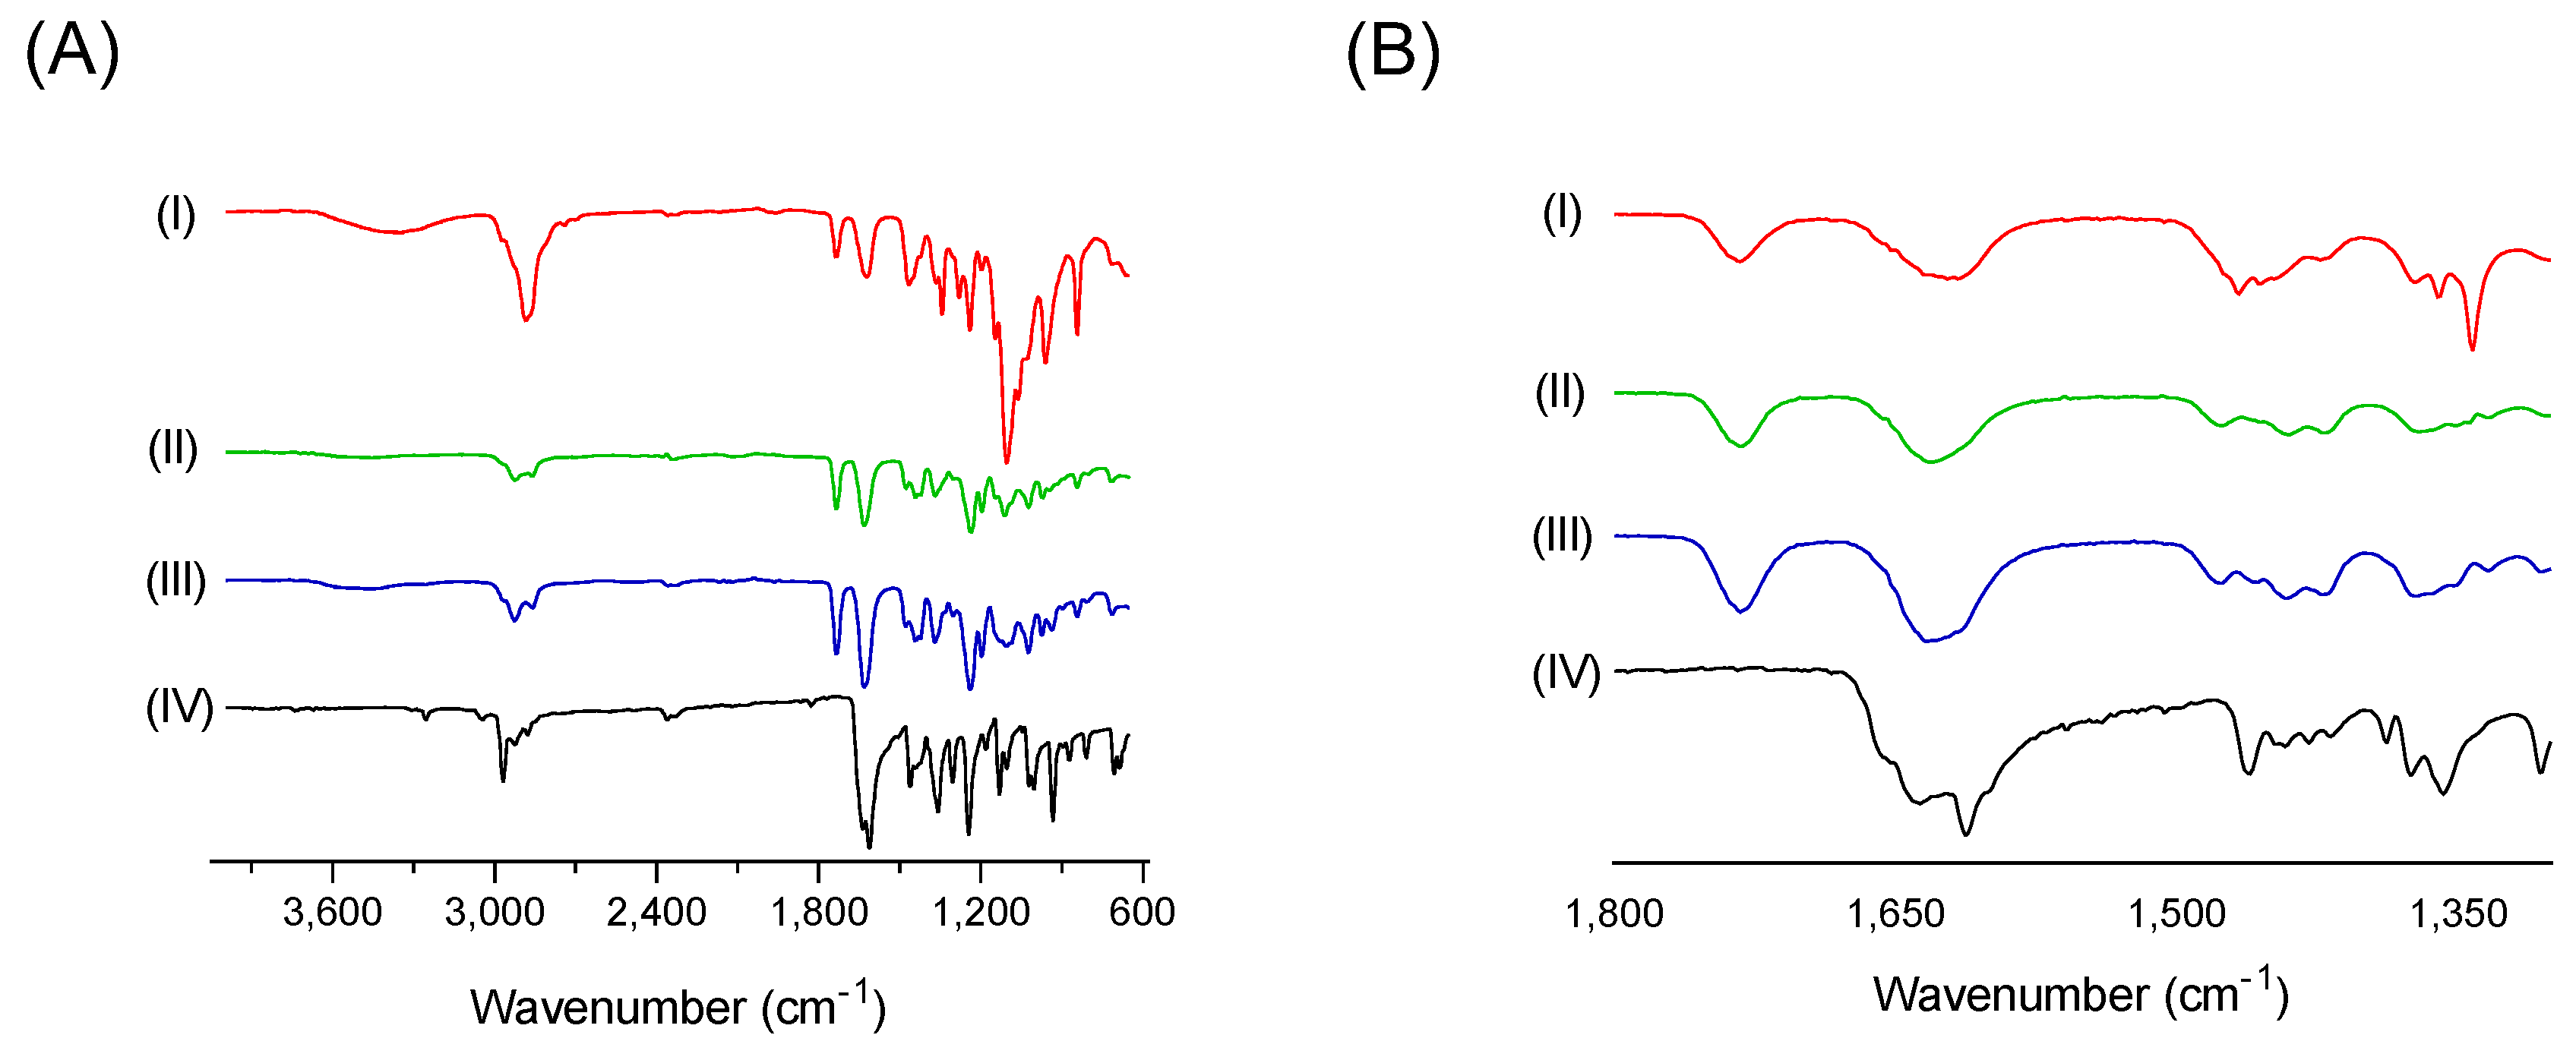
Figure 7.
Plasma concentration-time profile of TQM after oral administration of TQM samples in rats. ○, crystalline TQM (10 mg/kg, p.o.), □, SMSD-TQM/RVD (5 mg-TQM/kg, p.o.), and △, SMSD-TQM/FD (5 mg-TQM/kg, p.o.). Data represents mean ± S.E. of 4−6 experiments.
Figure 7.
Plasma concentration-time profile of TQM after oral administration of TQM samples in rats. ○, crystalline TQM (10 mg/kg, p.o.), □, SMSD-TQM/RVD (5 mg-TQM/kg, p.o.), and △, SMSD-TQM/FD (5 mg-TQM/kg, p.o.). Data represents mean ± S.E. of 4−6 experiments.
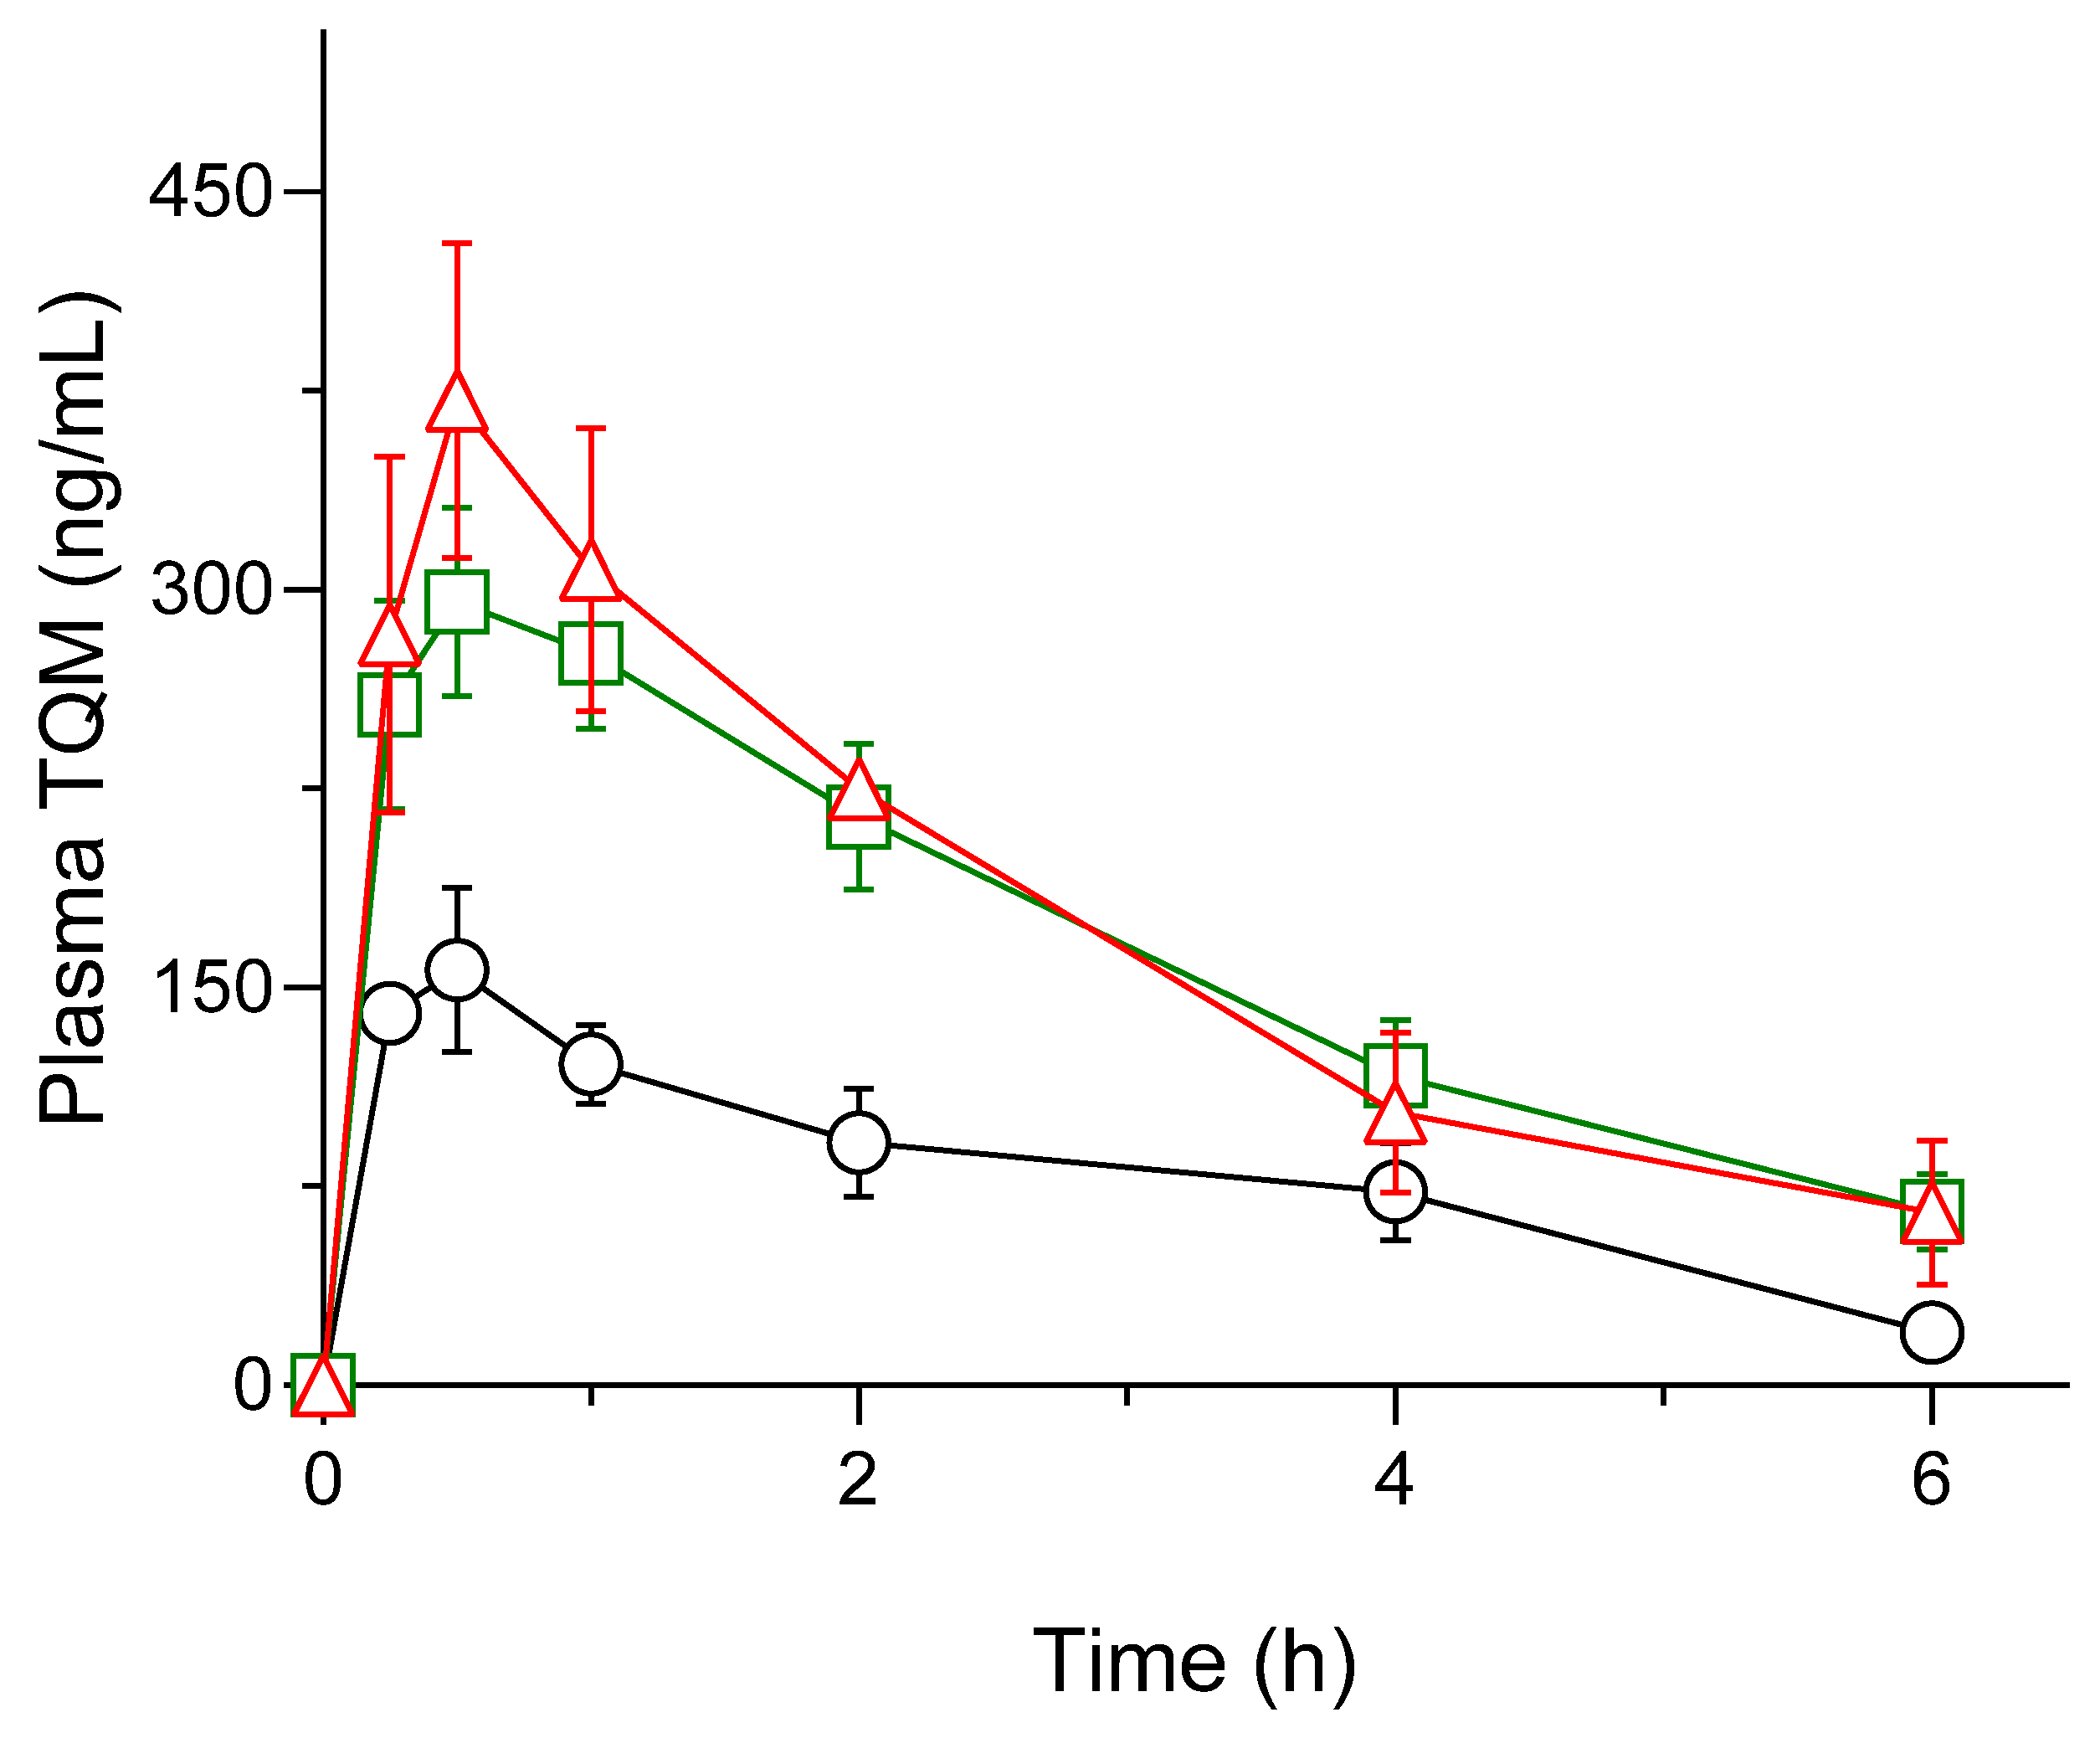
Figure 9.
Histological features of liver sections after cisplatin challenge with or without oral administration of crystalline TQM (10 mg/kg, p.o.) or SMSD-TQM (10 mg-TQM/kg, p.o.). (A) Rats treated with saline, (B) cisplatin-treated rats, (C) cisplatin-treated rats with crystalline TQM, (D) cisplatin-treated rats with SMSD-TQM/RVD and (E) cisplatin-treated rats with SMSD-TQM/FD. Each bar represents 50 µm. Large black arrow and small black arrow indicate the infiltration of inflammatory cells and degeneration and lesions in the tubular structure, respectively. Yellow arrow indicates the improvement of tubular lesion by the treatment of TQM, and the red arrow showed better improvement in the morphological structure of kidney tissues and tubular lesion after oral administration of SMSD-TQM compared to TQM.
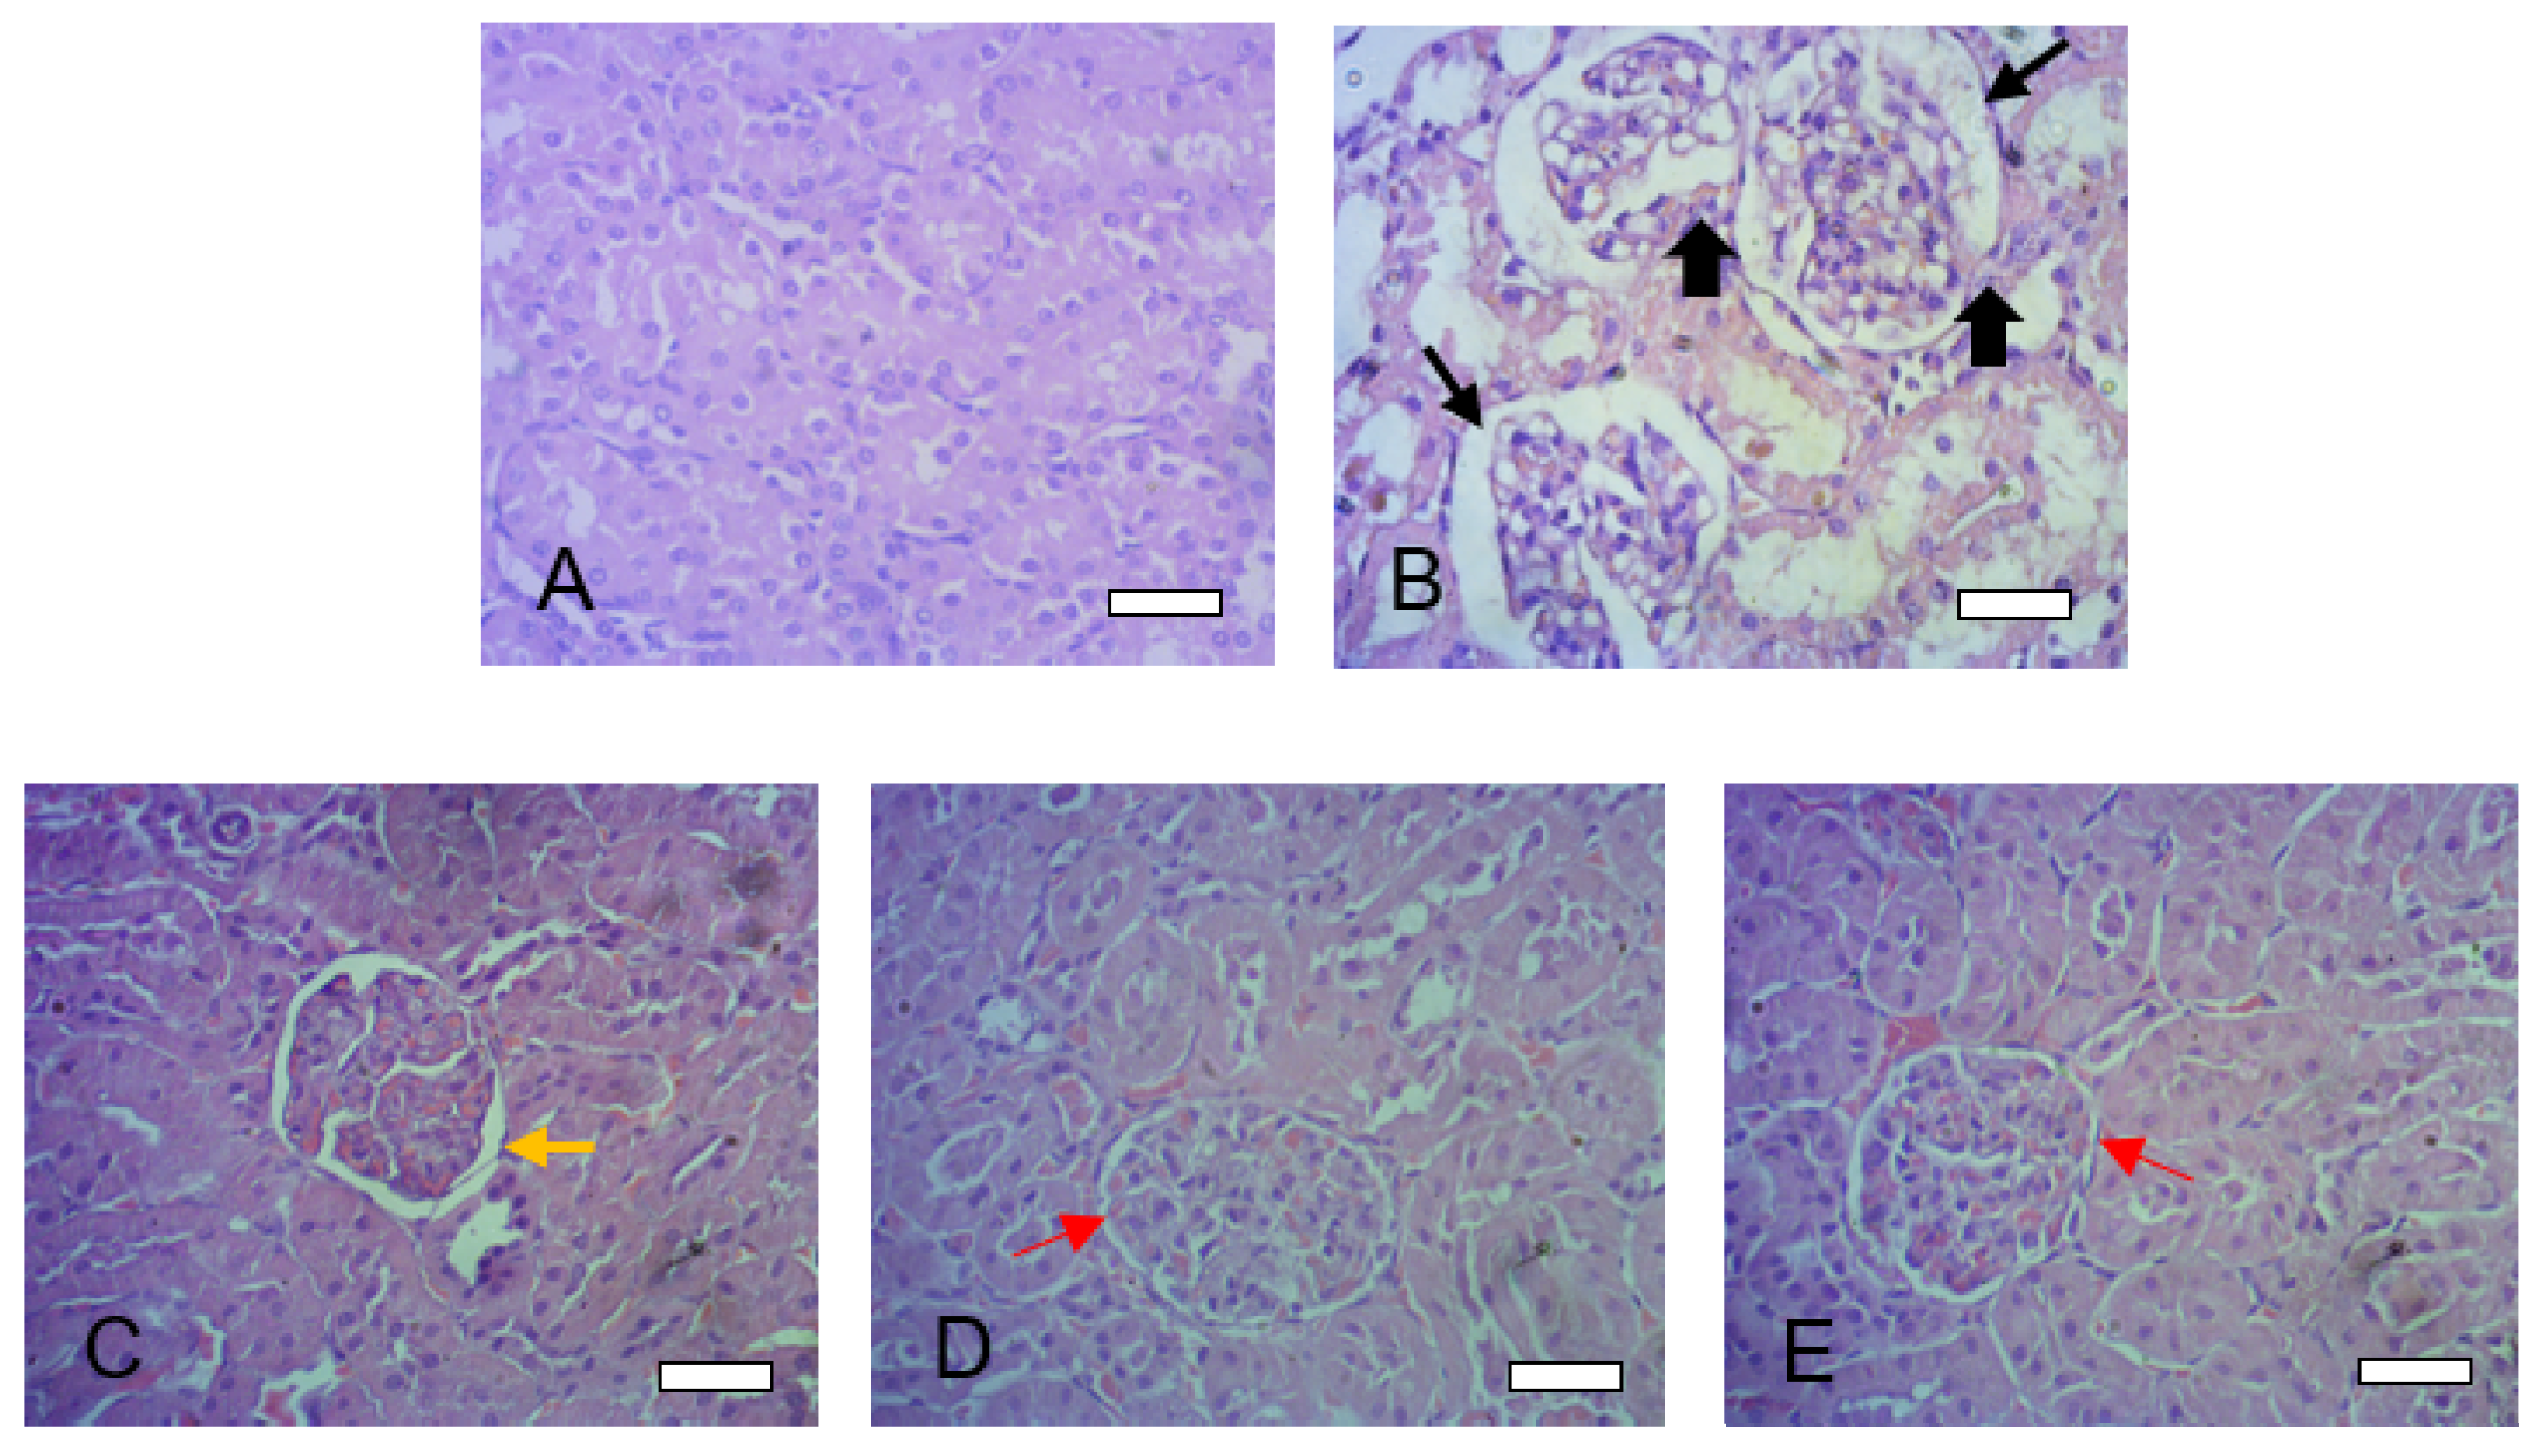

Table 1.
Apparent solubility data of binary complexes of TQM with different polymers.
| Complex/Parameter | S0 (g/mol) | Slope | R2 | Ks (M-1) | C.E. |
| TQM-Soluplus® | 0.001428 | 0.0099 | 0.9831 | 1161.5 | 0.010 |
| TQM-Kolliphor® P188 | 0.0037 | 0.9735 | 427.1 | 0.004 | |
| TQM- Kolliphor® P407 | 0.01 | 0.8441 | 1149.4 | 0.010 |
S0, solubility of TQM in water; Ks, stability constant; C.E., complexation efficiency.
Table 2.
Dissolution properties of TQM samples.
| Composition of SMSD-TQM (w/w %) |
Initial dissolution rate (hr-1) |
% dissolved at 60 min | ||
| TQM | Soluplus® | |||
| Crystalline TQM | 100 | - | 0.767 ± 0.03 | 45.2 ± 4.6 |
| SMSD-TQM/5 | 5 | 95 | 1.128 ± 0.10 | 73.9 ± 6.2 |
| SMSD-TQM/10 | 10 | 90 | 1.062 ± 0.21 | 89.3 ± 6.6 |
| SMSD-TQM/15 | 15 | 85 | 0.770 ± 0.14 | 66.7 ± 12.6 |
TQM, crystalline thymoquinone; SMSD-TQM, self-micellizing solid dispersion of thymoquinone.a Initial dissolution rate in water. b Dissolved amount of TQM in water solution at 60 min. Data presented as mean ± S.D. (n = 3).
Table 3.
Pharmacokinetic parameters of TQM samples following oral administration to rats.
| Parameters | Crystalline TQM (10 mg/kg; p.o.) |
SMSD-TQM/RVD (5 mg-TQM/kg; p.o.) |
SMSD-TQM/FD (5 mg-TQM/kg; p.o.) |
| Cmax (ng/mL) | 165.5 ± 23.3 | 298.2 ± 32.6 | 425.1 ± 11.2** |
|
Dose normalized Cmax (ng/mL) |
16.55 ± 2.33 | 59.64 ± 6.52 | 85.02 ± 2.23 |
| Tmax (h) | 0.41 ± 0.08 | 0.67 ± 0.16 | 0.41 ± 0.08 |
| AUC0–6 (ng・h/mL) | 488.1 ± 89.7 | 1,002.5 ± 122.3 | 1,049.3 ± 44.44* |
| AUC0–∞ (ng・h/mL) | 554.6 ± 79.6 | 1,230.5 ± 184.3 | 1,349.9 ± 262.6* |
|
Dose normalized AUC0–∞ (ng・h/mL) |
55.46 ± 7.94 | 246.09 ± 36.87 | 269.98 ± 52.51 |
| MRT (h) | 2.25 ± 0.05 | 2.23 ± 0.03 | 2.08 ± 0.23 |
| Vd (L) | 0.061 ± 0.02 | 0.028 ± 0.002 | 0.025 ± 0.005 |
| t1/2 (h) | 2.3 ± 0.36 | 2.34 ± 0.16 | 2.38 ± 0.96 |
| Ke (h-1) | 0.31 ± 0.04 | 0.29 ± 0.02 | 0.37 ± 0.10 |
| Absolute BA (%) | 2.8 | 12.5 | 13.7 |
| Relative BA (%) | 100 | 443 | 487 |
Cmax; maximum concentration; Tmax; time to maximum concentration; AUC0–6: area under the curve of blood concentration vs. time from 0 h to 6 h; AUC0–∞; area under the curve of blood concentration vs. time from 0 h to infinity; MRT: mean residence time; t1/2: elimination half-life; and Ke: elimination rate constant. Data represents mean± S.E. of 4−6 experiments. * P<0.05, and ** P<0.001 with respect to orally-dosed crystalline TQM.
Disclaimer/Publisher’s Note: The statements, opinions and data contained in all publications are solely those of the individual author(s) and contributor(s) and not of MDPI and/or the editor(s). MDPI and/or the editor(s) disclaim responsibility for any injury to people or property resulting from any ideas, methods, instructions or products referred to in the content. |
© 2023 by the authors. Licensee MDPI, Basel, Switzerland. This article is an open access article distributed under the terms and conditions of the Creative Commons Attribution (CC BY) license (http://creativecommons.org/licenses/by/4.0/).
Copyright: This open access article is published under a Creative Commons CC BY 4.0 license, which permit the free download, distribution, and reuse, provided that the author and preprint are cited in any reuse.


