
Submitted:
29 December 2022
Posted:
04 January 2023
You are already at the latest version
Abstract
(1) Background: Motor neuron diseases (MNDs) are fatal neurodegenerative diseases. Biomarkers could help in defining patients’ prognosis and stratification. Beyond neurofilaments, chitinases are a promising family of possible biomarker, which correlate with neuroinflammatory status. We evaluated plasmatic levels of CHI3L1 in MNDs, MND mimics and healthy controls (HCs); (2) Methods: We used Sandwich ELISA to quantify CHI3L1 in plasma samples from 44 MNDs, 7 HSP, 9 MND mimics and 19 HCs. We collect also ALSFRSr scale, MRC scale, spirometry, mutational status, progression rate (PR), blood sampling, neuropsychological evaluation; (3) Results: Plasma levels of CHI3L1 resulted to be different among groups (p= 0.005). Particularly, MND mimics showed higher CHI3L1 levels compared to MNDs and HCs. CHI3LI levels did not differ among PMA, PLS and ALS and we do not find correlation among CHI3L1 levels and clinical scores, spirometry parameters, PR, and neuropsychological features. Of note, red blood cells count and haemoglobin correlated with CHI3L1 levels (respectively, p<0.001, r=0.63; p= 0.022, r=0.52); (4) Conclusions: CHI3L1 plasma levels resulted to be increased in the MND mimics cohort when compared to MNDs. The increase of CHI3L1 in neuroinflammatory processes could explain our findings. We confirmed that CHI3L1 plasma levels did not differentiate between ALS and HCs and nor correlate with neuropsychological impairment.
Keywords:
ALS
; HSP
; chitinases
; biomarker
; differential diagnosis
; early diagnosis
; cognitive impairment
; MND mimics
; red blood cells
; haemoglobin
1. Introduction
Motor neuron diseases (MNDs) are fatal neurodegenerative diseases mainly characterised by a progressive death of motor neurons. Their pathological mechanisms are complex and heterogeneous1. The most common form of MNDs is Amyotrophic Lateral Sclerosis (ALS) which is characterized by the progressive loss of upper and lower motor neurons causing weakness of bulbar, limb, trunk and respiratory muscles2. Around 10% of ALS cases are familial (fALS), whilst 90% are sporadic (sALS)3 and up to 50% of ALS have a cognitive and/or behavioural impairment1. Its aetiology and pathophysiology are still unknown and the prognosis for ALS is approximately three years from diagnosis. Other forms of MNDs include primary lateral sclerosis (PLS), which is characterised by an exclusive damage of upper motor neuron, and progressive muscular atrophy (PMA), a form marked out by primary lower motor neuron damage.
There is a strong need of prognostic and diagnostic biomarkers able to early differentiate ALS from ALS-mimics, to stratify patients and to predict disease outcome, in order to improve patients’ inclusion in clinical trials. Neurofilaments (NFs) are now becoming a widely accepted prognostic biomarker for ALS and other neurodegenerative diseases4,5.
More recently, chitinases, a family of hydrolytic enzyme, have been studied in cerebrospinal fluid (CSF) as possible liquid biomarkers. They include CHIT1, CHI3L1 and CHI3L26,7 and correlate with neuroinflammatory status. CHI3L1 is more expressed in activated astrocyte localised in the motor cortex of ALS patients6. In one study CSF levels of CHI3L1 have been correlated with cognitive impairment in ALS7.
In the present study, considering that lumbar puncture can be an invasive procedure, especially in patients with neuromuscular diseases, we evaluated plasmatic levels of CHI3L1 in MNDs, MND mimics and healthy controls (HCs).
2. Materials and Methods
2.1. Clinical Assessment
MND patients received their diagnosis following the Gold Coast criteria8 and the PLS criteria9. Disease severity was assessed using Amyotrophic Lateral Sclerosis revised Functional Rating Scale (ALSFRSr)10. We excluded patients with active cancer, infectious diseases, and ongoing immunosuppressive therapies.
All patients underwent blood sampling at diagnosis
Moreover, all MND patients underwent: a clinical evaluation (neurological examination, including the Medical Research Council scale [MRC]11 measurement, and ALSFRSr scale), an instrumental evaluation (electromyography, cerebral MRI with tractography and functional-MRI, spirometry), a neuropsychological evaluation12 (including MMSE, ECAS, TMT-A, TMT-B, RAVLT, ROCF, FAB, Digit Span, FRSBE), and a genetic test for the most common mutation (C9orf72, SOD1, TARDBP and FUS genes). Patients’ phenotypes have been classified as follows: classic ALS, bulbar ALS, flail arm, flail leg, prevalent upper motor neuron ALS13.
Progression rate (PR) was calculated as (48 - ALSFRSr at blood sampling)/ time interval in months between symptoms onset and blood sampling. Fast- and slow-progressor ALS were divided using median value of PR (0.54 points/month).
2.2. Laboratory Evaluation
We obtained from each patient and control 4 ml of fresh blood in EDTA tube. Blood samples were centrifuged at 20°C at 1500g for 15 minutes within 1 hour from collection and plasma obtained was stored at -80°C.
The samples were put at 4°C during the night before the Elisa test in order to thaw slowly; then they were left at room temperature for 1 hour and used to run the experiment.
We used the Human Chitinase-3-Like Protein 1 (CHI3L1) ELISA commercial Kit (Abbexa, UK), following manufacturer instructions.
Plates were read using a CLARIOstar Plus plate reader (BMG LABTECH, UK). Standard curves were fitted with 4-parameter logistic regression using MARS data analysis software (BMG LABTECH, UK).
Samples were diluted 1:40 in order to achieve a concentration within the linear range of standard curve measurements. Median intra-assay and inter-assay coefficients of variation were below 15% for all assays.
2.3. Statistical Analysis
Shapiro–Wilk test showed that data were not normally distributed.
Kruskal-Wallis test was used to compare each group. Bonferroni’ comparisons test was performed following Kruskal-Wallis test in case of significant differences. Receiver operating characteristic (ROC) curve were not performed due to the relatively small number of people included. Correlations between CHI3L1 levels and motor and cognitive symptoms and with laboratory and instrumental parameters were calculated by Spearman rank correlation rs. The level of significance for all statistical tests was set at 0.05.
We used program SPSS Statistic V26 (Chicago, IL, USA) to perform statistical calculations.
All patients signed a written informed consent. The study design was approved by the Ethical Committees of the Turin ALS Center (Comitato Etico Azienda Ospedaliero-Universitaria Città della Salute e della Scienza, Torino) (n° 0011613, 03/02/2020).
3. Results
We performed a cross sectional study in which we enrolled 19 HCs, 44 MNDs, 7 hereditary spastic paraplegia (HSP), and 9 MND mimics (including myelopathy, radiculopathy, axonal neuropathies, and post-poliomyelitis syndrome), seen at the ALS Center, Molinette Hospital between Jan 2019 and Aug 2022. Our 44 MNDs include 25 ALS, 12 ALS with cognitive impairment (ALS/FTD or ALSci, using Strong classification14), 5 PLS and 2 PMA.
Participant demographic and clinical characteristics are summarized in Table 1.
3.1. Plasmatic CHI3L1 in Differential Diagnosis
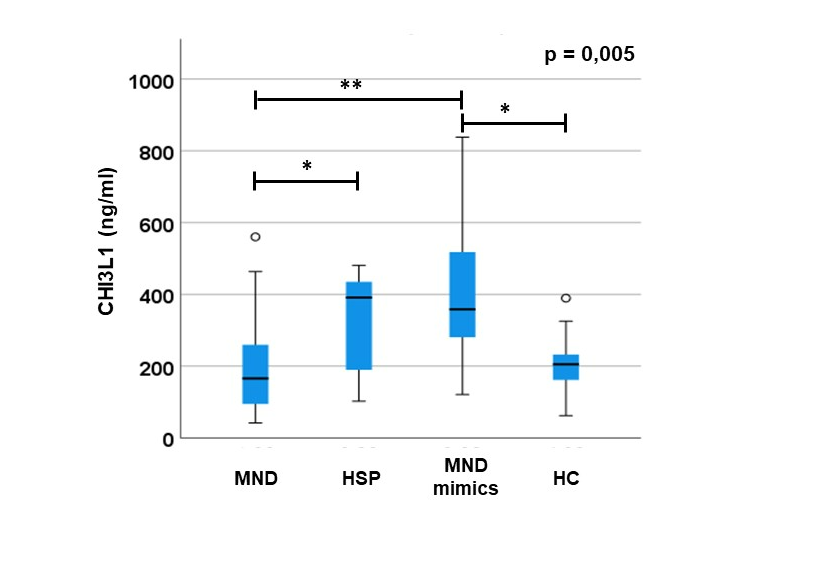
CHI3L1 plasma levels result to be different between groups (p= 0.005; Figure 1) Of note, Bonferroni’s correction shows that MND mimics have significantly higher levels of CHI3L1 compared to MNDs (p=0.002) and HCs (p=0.023) and that HSP have higher levels of CHI3L1 compared to MNDs (p=0.03). We found no difference between HSP and MNDs versus HCs (p>0.05). Differences are confirmed co-variating for age and sex (p= 0.004). A sub-group analysis of MND patients (divided in PLS, ALS, ALS+FTD and PMA, Figure 1) do not show any difference in CHI3L1 levels (p>0.05). No differences in CHI3L1 levels between genetic and non-genetic forms of ALS nor between fast- and slow-progressor ASL (p>0.05).
In MND mimics we highlighted an important elevation of CHI3L1 plasmatic levels compared to MND and HC (A). Moreover, we observed a light difference between MND and HSP group. We also tried to search for differences in levels of CHI3L1 between MND sub-groups (PLS, ALS/FTD, ALS and PMA) but we did not observe any significance (B).
Error bars indicate 95% of confidential intervals. * p<0.05; ** p<0.005.
3.2. Correlation of Plasmatic CHI3L1 with Motor and Cognitive Symptoms and with Laboratory and Instrumental Parameters
CHI3L1 do not correlate to ALSFRSr, MRC total score and sub-scores, Forced Vital Capacity (FVC), Forced Expiratory Volume in the 1st second (FEV1), PR of disease at the time of blood sampling, and blood examination, except for red blood cells (RBC) and for haemoglobin (respectively, p<0.001, r=0.63 and p=0.022, r=0.52, Figure 2). None of neuropsychological tests correlate to CHI3L1 plasma levels (p>0.05).
We did not observe any statistical correlation (p> 0,05) between CHI3L1 plasmatic levels and ALSFRSr scale (N) any neuropsychological test (A-I). The only correlation we identified is between CHI3L1 plasmatic levels and haemoglobin (L) and red blood cells (M).
ALSFRSr: ALS Functional Rating Scale Revised; Hb: haemoglobin; RBC: red blood cells; FRSBE: Frontal Systems Behavior Scale; RAVLT: Rey Auditory Verbal Learning test; ECAS: Edinburgh Cognitive and Behavioural ALS Screen; ROCF: Rey–Osterrieth complex figure; TMT-A: Trail-making test A; TMT-B: Trail-making test B; FAB: Frontal Assessment Battery; MMSE: Mini-Mental State Examination; Hb: haemoglobin; RBC: red blood cells; ALSFRSr: Revised Amyotrophic Lateral Sclerosis Functional Rating Scale; R: Pearson coefficient.
4. Discussion
CHI3L1 plasma levels resulted to be increased in the MND mimics evaluated (including acute myelopathy, radiculopathies and neuropathies), compared to MND and HCs. This data is consistent with the known increase of CHI3L1 in diseases in which there is a central role of inflammation, i.e. cancers or autoimmune/dysimmune diseases15,16. Therefore, the increase of CHI3L1 in the MND mimics group could be explained by the presence of an active peripheral inflammatory component.
Moreover, CHI3L1 levels are statistically significantly higher in HSP patients compared to MNDs, likely due to the high frequency of neuropathies in HSP, in which there is usually an inflammatory component.
Contrarily to other studies performed on CSF in which CHI3L1 was found to be able to differentiate MNDs from HC6,7, plasmatic levels of CHI3L1 do not permit to separate these two groups. This observation could be due to the low capability of CHI3L1 to pass through the blood brain barrier and to the plasmatic release of CHI3L1 from other tissues, that masks its increase from the central nervous system.
In the MNDs cohort, we also correlated CHI3L1 levels with several clinical, laboratory and neuropsychological parameters collected within one month from diagnosis, but we do not observe any association. In particular, in contrast with previous evidence in CSF7, plasmatic levels of CHI3L1 do not correlate with the score of executive and visuo-spatial neuropsychological tests. The only correlation was observed with haemoglobin and RBC; this is consistent with previous evidence, since CHI3L1 seem to be more concentrated in RBC17.
This study has some limitations. First, the cohorts are relatively small ì, in particular in the MND mimics group. Moreover, we have not included all types of MND mimics that should be considered in a future more exhaustive study (i.e., myasthenia gravis, syringomyelia, adult polyglucosan body disease, Kennedy’s disease, inclusion body myositis).
In order to validate our data and observe their variation all along the disease course, further longitudinal studies with a higher number of patients both in the MNDs and in the MND mimics group are needed. Finally, a comparison between plasmatic and CSF levels of CHI3L1 protein is mandatory in order to confirm that plasmatic levels of CHI3L1 does not reflect satisfactorily the CSF ones.
5. Conclusions
The measurement of plasmatic levels of CHI3L1 could be useful in the differential diagnosis between MNDs and MND mimics. This is an important issue since the early diagnosis of an MND is determinant in the early starting of a neuroprotective therapy and in clinical trials recruitment.
Further multicentre studies, including a huge number of patients, and testing together other fluid biomarkers, are needed to better explain the role of CHI3L1 in diagnosis and prognosis in MNDs and, also, in MND mimics.
Author Contributions
Conceptualization, Alessandro Bombaci; Data curation, Alessandro Bombaci; Formal analysis, Alessandro Bombaci and Giovanni De Marco; Investigation, Alessandro Bombaci; Methodology, Alessandro Bombaci; Resources, Alessandro Bombaci; Software, Alessandro Bombaci; Validation, Alessandro Bombaci and Umberto Manera; Visualization, Alessandro Bombaci; Writing – original draft, Alessandro Bombaci and Umberto Manera; Writing – review & editing, Alessandro Bombaci, Umberto Manera, Giovanni De Marco, Federico Casale, Paolina Salamone, Giuseppe Fuda, Giulia Marchese, Barbara Iazzolino, Laura Peotta, Cristina Moglia, Andrea Calvo and Adriano Chiò. All authors have read and agreed to the published version of the manuscript.
Funding
This research received no external funding.
Institutional Review Board Statement
The study was conducted in accordance with the Declaration of Helsinki, and approved by the Ethical Committees of the Turin ALS Center (Comitato Etico Azienda Ospedaliero-Universitaria Città della Salute e della Scienza, Torino) (n° 0011613, 03/02/2020).
Informed Consent Statement
Informed consent was obtained from all subjects involved in the study. Written informed consent has been obtained from the patient(s) to publish this paper”.
Data Availability Statement
The data presented in this study are available on request from the corresponding author.
Acknowledgments
We thank all the patients of our center that took part to this study.
Conflicts of Interest
The authors declare no conflict of interest.
References
- Hardiman O, Al-Chalabi A, Chio A, et al. Amyotrophic lateral sclerosis. Nature Reviews Disease Primers. 2017;3(1):17071. [CrossRef]
- Chiò A, Calvo A, Moglia C, Mazzini L, Mora G, PARALS study group P study. Phenotypic heterogeneity of amyotrophic lateral sclerosis: a population based study. Journal of neurology, neurosurgery, and psychiatry. 2011;82(7):740-746. [CrossRef]
- Renton AE, Chiò A, Traynor BJ. State of play in amyotrophic lateral sclerosis genetics. Nature Neuroscience. 2014;17(1):17-23. [CrossRef]
- Steinacker P, Feneberg E, Weishaupt J, et al. Neurofilaments in the diagnosis of motoneuron diseases: A prospective study on 455 patients. Journal of Neurology, Neurosurgery and Psychiatry. 2016;87(1):12-20. [CrossRef]
- Lombardi V, Bombaci A, Zampedri L, et al. Plasma pNfH levels differentiate SBMA from ALS. Journal of neurology, neurosurgery, and psychiatry. October 2019. 20 October. [CrossRef]
- Vu L, An J, Kovalik T, Gendron T, Petrucelli L, Bowser R. Cross-sectional and longitudinal measures of chitinase proteins in amyotrophic lateral sclerosis and expression of CHI3L1 in activated astrocytes. Journal of Neurology, Neurosurgery and Psychiatry. 2020;91(4):350-358. [CrossRef]
- Thompson AG, Gray E, Bampton A, Raciborska D, Talbot K, Turner MR. CSF chitinase proteins in amyotrophic lateral sclerosis. Journal of Neurology, Neurosurgery and Psychiatry. 2019;90(11):1215-1220. [CrossRef]
- Brooks BR, Miller RG, Swash M, Munsat TL, World Federation of Neurology Research Group on Motor Neuron Diseases. El Escorial revisited: revised criteria for the diagnosis of amyotrophic lateral sclerosis. Amyotrophic lateral sclerosis and other motor neuron disorders : official publication of the World Federation of Neurology, Research Group on Motor Neuron Diseases. 2000;1(5):293-299. http://www.ncbi.nlm.nih.gov/pubmed/11464847. Accessed February 7, 2019. [CrossRef]
- Turner MR, Barohn RJ, Corcia P, et al. Primary lateral sclerosis: consensus diagnostic criteria. Journal of neurology, neurosurgery, and psychiatry. 2020;91(4):373-377. [CrossRef]
- Cedarbaum JM, Stambler N, Malta E, et al. The ALSFRS-R: a revised ALS functional rating scale that incorporates assessments of respiratory function. BDNF ALS Study Group (Phase III). Journal of the neurological sciences. 1999;169(1-2):13-21. http://www.ncbi.nlm.nih.gov/pubmed/10540002. Accessed February 7, 2019. [CrossRef]
- Council MR. Aids to the Examination of the Peripheral Nervous System. London: HMSO; 1943.
- Iazzolino B, Pain D, Peotta L, et al. Validation of the revised classification of cognitive and behavioural impairment in ALS. Journal of Neurology, Neurosurgery and Psychiatry. 2019;90(7):734-739. [CrossRef]
- Chio A, Calvo A, Moglia C, Mazzini L, Mora G, PARALS study group. Phenotypic heterogeneity of amyotrophic lateral sclerosis: a population based study. Journal of Neurology, Neurosurgery & Psychiatry. 2011;82(7):740-746. [CrossRef]
- Strong MJ, Abrahams S, Goldstein LH, et al. Amyotrophic lateral sclerosis - frontotemporal spectrum disorder (ALS-FTSD): Revised diagnostic criteria. Amyotrophic Lateral Sclerosis and Frontotemporal Degeneration. 2017;18(3-4):153-174. [CrossRef]
- Kzhyshkowska J, Yin S, Liu T, Riabov V, Mitrofanova I. Role of chitinase-like proteins in cancer. Biological chemistry. 2016;397(3):231-247. [CrossRef]
- Reveille JD. Biomarkers for diagnosis, monitoring of progression, and treatment responses in ankylosing spondylitis and axial spondyloarthritis. Clinical rheumatology. 2015;34(6):1009-1018. [CrossRef]
- Cintin C, Johansen JS, Skov F, Price PA, Nielsen HJ. Accumulation of the neutrophil-derived protein YKL-40 during storage of various blood components. Inflammation research : official journal of the European Histamine Research Society . [et al]. 2001;50(2):107-111. [CrossRef]
Figure 1.
CHI3L1 plasmatic levels in MND, MND mimics, HSP and HC.
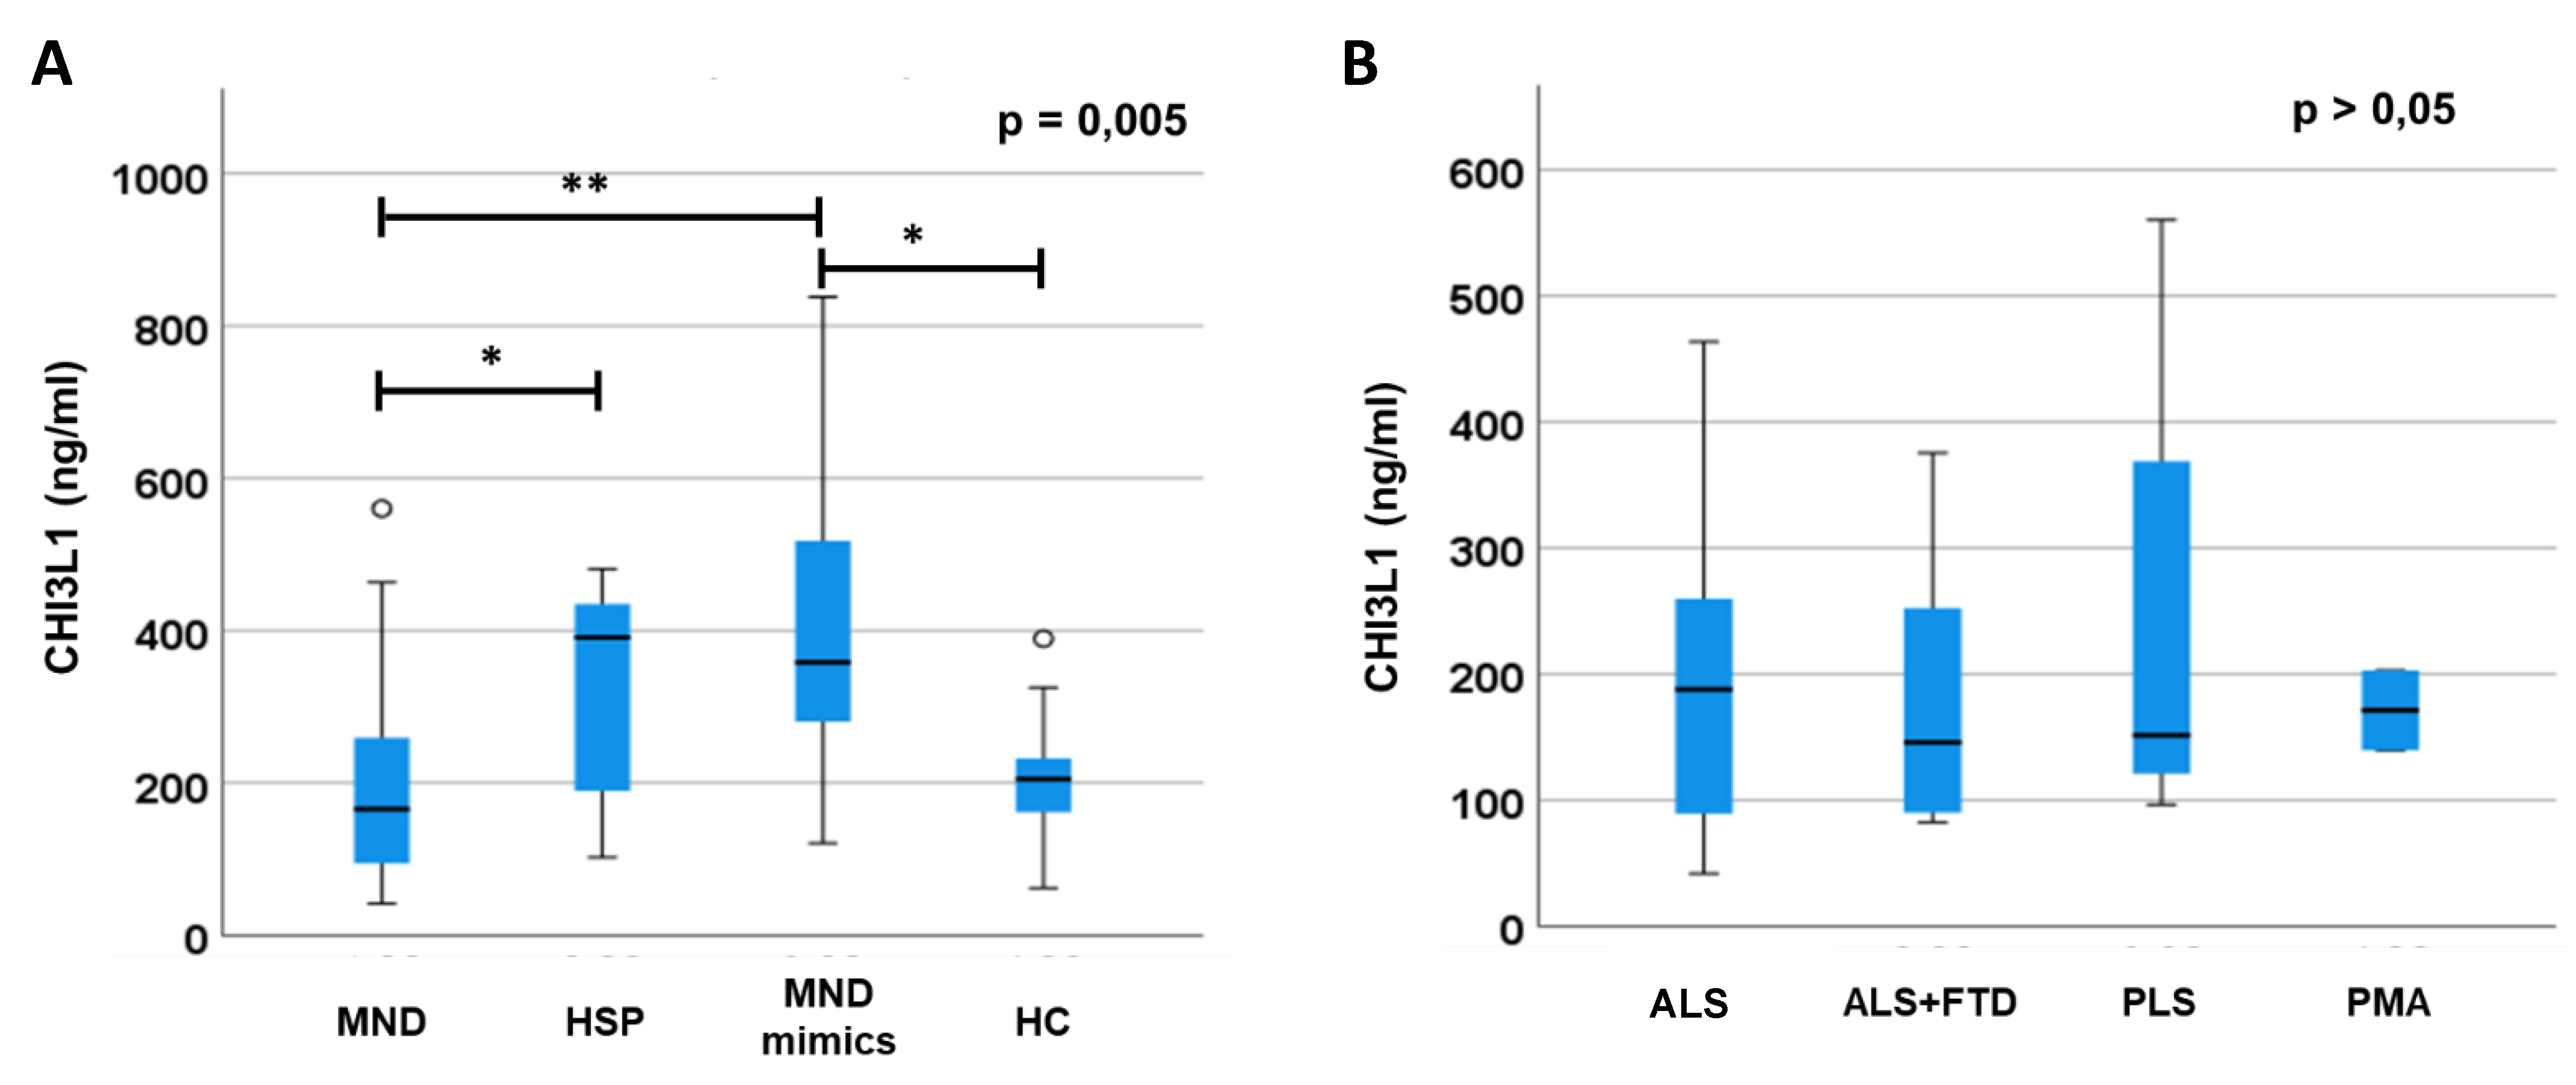
Figure 2.
Correlation between CHI3L1 plasmatic levels, clinical, neuropsychological, and laboratory data in MND patients.
Figure 2.
Correlation between CHI3L1 plasmatic levels, clinical, neuropsychological, and laboratory data in MND patients.
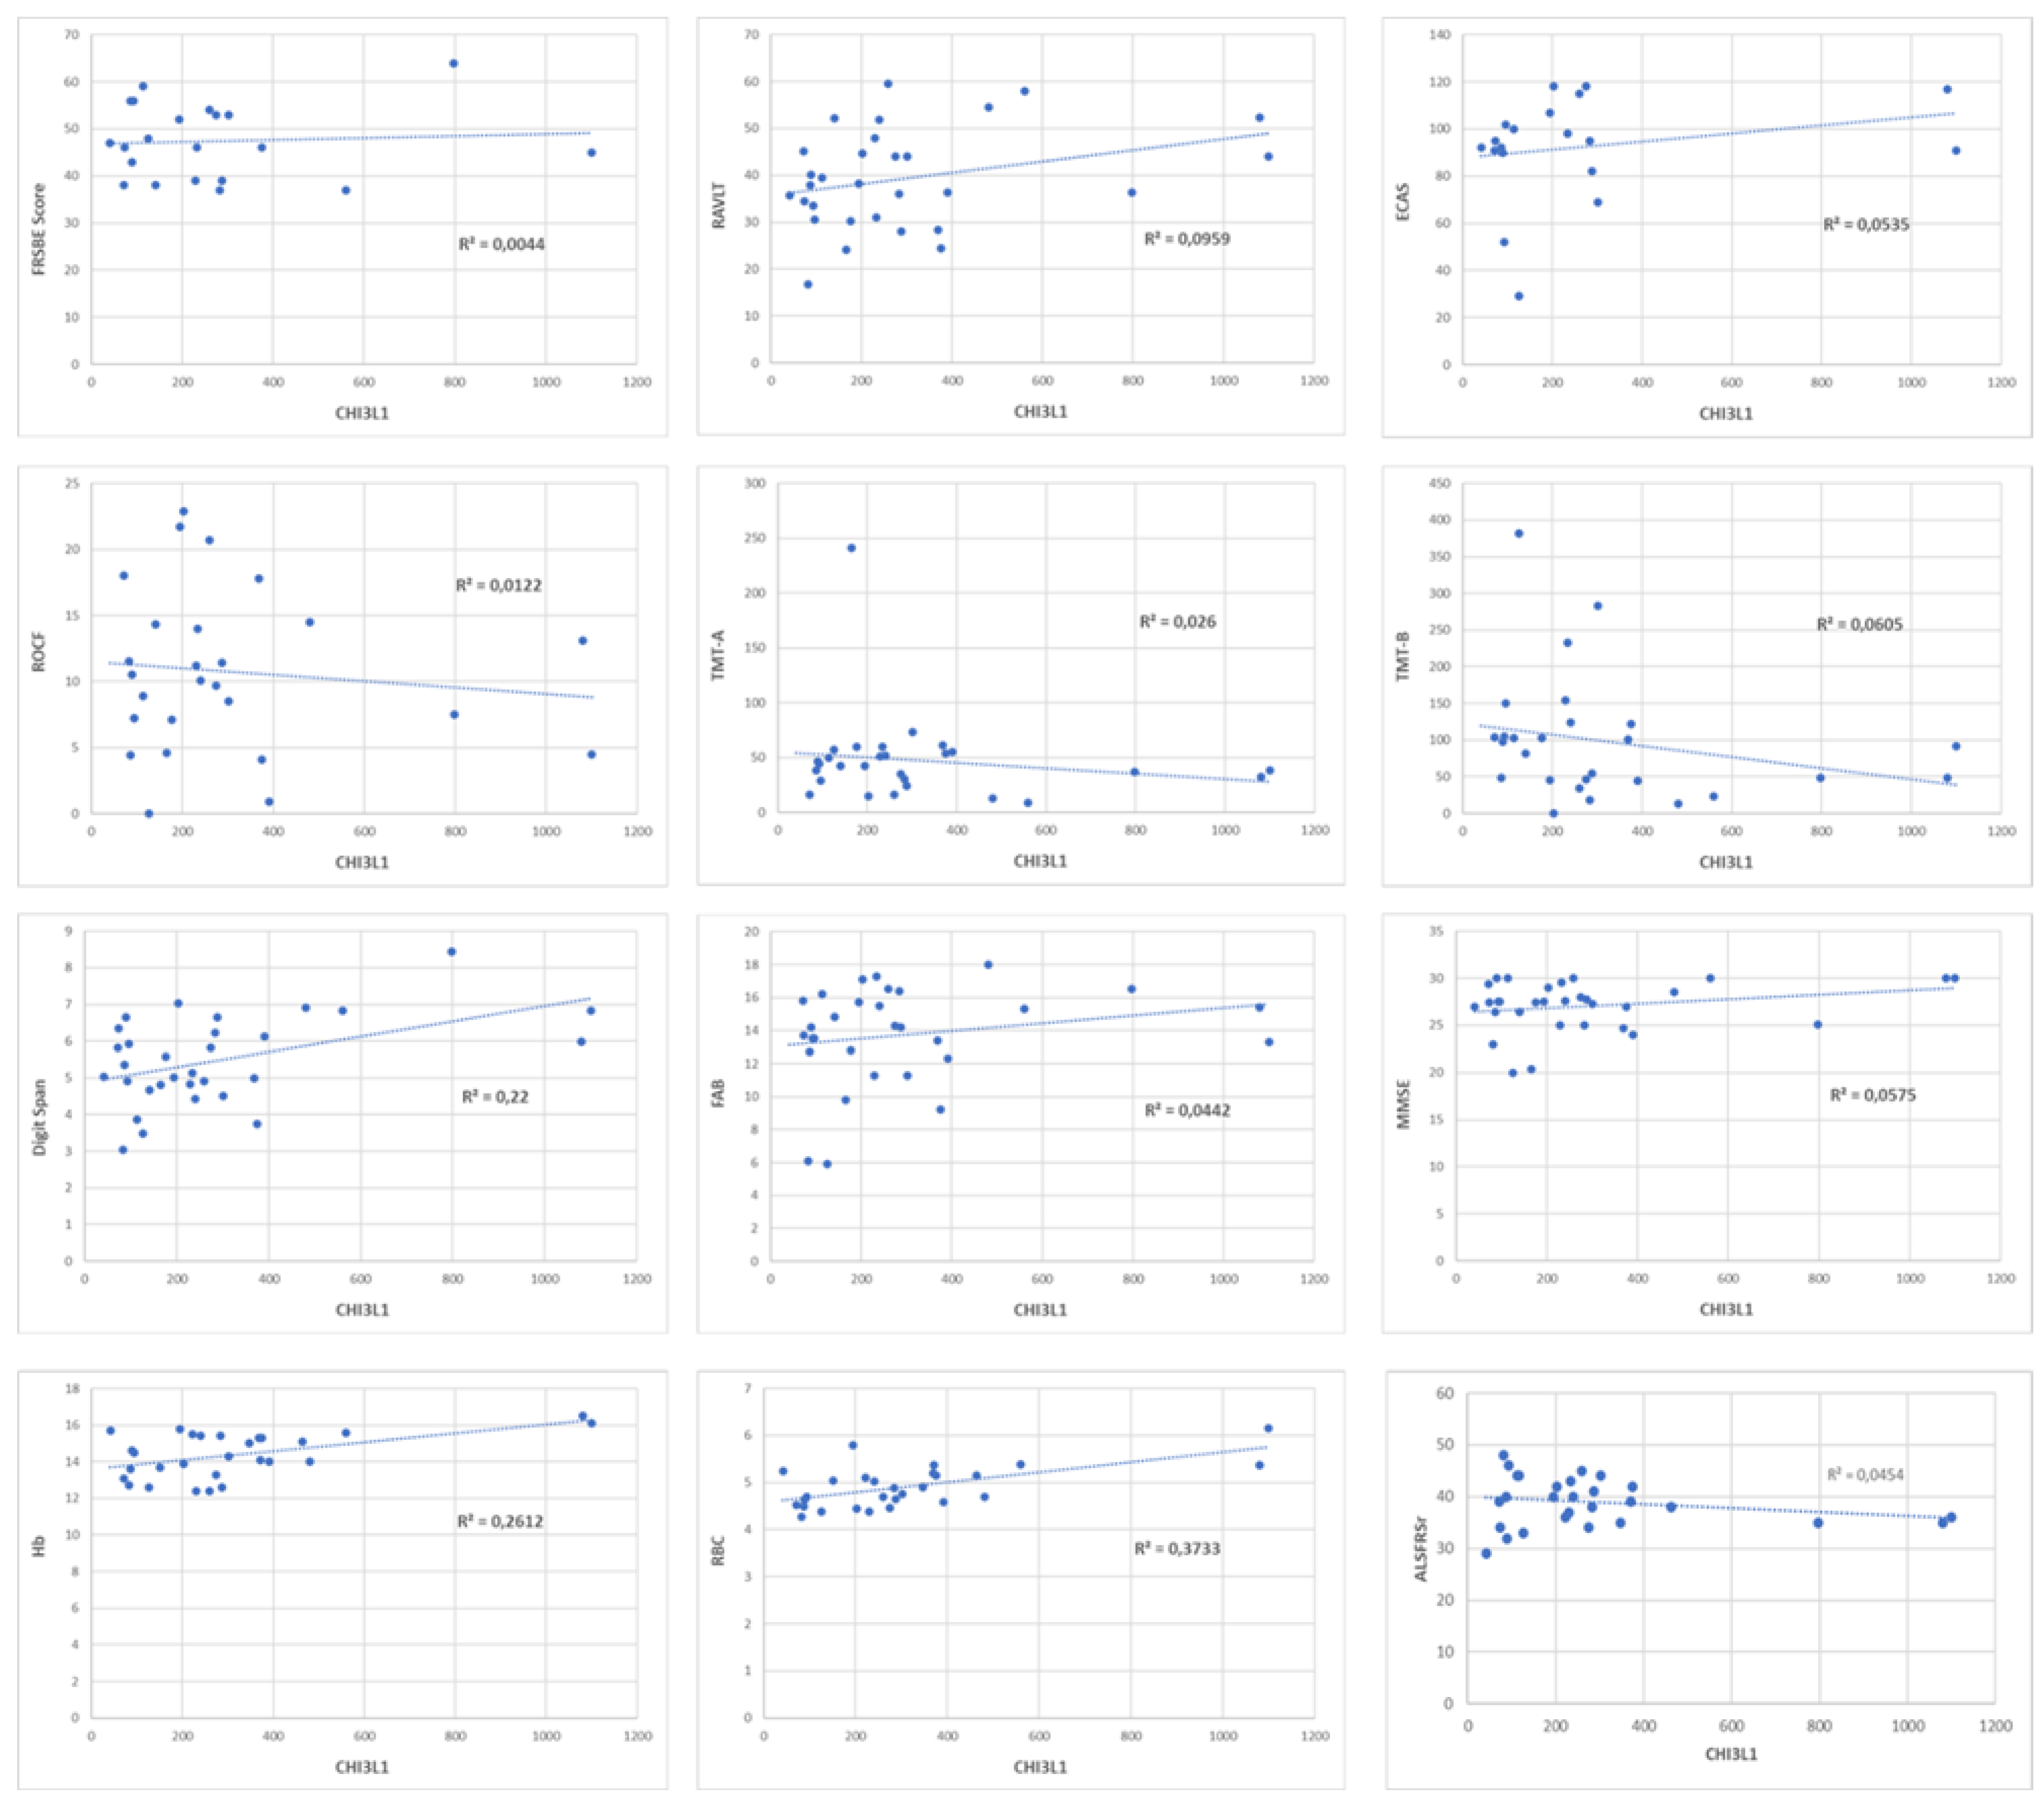

Table 1.
Participant demographic and clinical information at blood sampling.
| Patients group | n° | Sex M/F |
Age ± SD (y) |
Genetic mutation | ALSFRSr ± SD | FVC ± SD |
|---|---|---|---|---|---|---|
| MND | 44 | 20/24 | 63 ± 13 | 7/44 | 39,5 ± 4,8 | 98 ± 19 |
| MND mimics | 9 | 5/4 | 62 ± 15 | N/A | N/A | N/A |
| HSP | 7 | 5/2 | 64 ± 8 | 7/7 | N/A | N/A |
| HC | 19 | 10/9 | 60 ± 9 | N/A | N/A | N/A |
* N/A: not assessed.
Disclaimer/Publisher’s Note: The statements, opinions and data contained in all publications are solely those of the individual author(s) and contributor(s) and not of MDPI and/or the editor(s). MDPI and/or the editor(s) disclaim responsibility for any injury to people or property resulting from any ideas, methods, instructions or products referred to in the content. |
© 2023 by the authors. Licensee MDPI, Basel, Switzerland. This article is an open access article distributed under the terms and conditions of the Creative Commons Attribution (CC BY) license (http://creativecommons.org/licenses/by/4.0/).
Copyright: This open access article is published under a Creative Commons CC BY 4.0 license, which permit the free download, distribution, and reuse, provided that the author and preprint are cited in any reuse.


