
Submitted:
17 July 2023
Posted:
18 July 2023
You are already at the latest version
Abstract
Air quality and environmental fairness have always been an area of prime interest across the globe. The significance low-cost air quality sensing and practices spikes during the time of pan-demic and epidemics when the air becomes a threat to living beings especially human beings. The gradual innovation and enrichment in low-cost air quality sensing sensors, nodes or devices, and systems are exponentially increasing for the last three decades. This work reviews the major contributions in a) low-cost scalable air quality assessment; b) low-cost air quality sensors, sensing approaches and technologies; c) low-cost state-of-the-art gas sensors fabrication methods (MEMS and CMOS); d) low-cost gas sensors measurement configurations and assemblies; and e) low-cost air quality sensors calibration and testing systems. A systematic review of past work with a goal to assist end-users, public health facilities, state agencies, researchers, scientists and air quality protection agencies has been rendered in this work. Starting from sensors electrodes to IoT based mobile smart nodes; all have been introduced in this article.
Keywords:
low-cost air quality sensors
; air quality assessment
; sensing technologies (STs)
; fabrication
; measurement
; configurations
; sensor assemblies
; gas sensors calibration systems (GSCS)
; evaluation
; mach
1. Introduction
The term “Air Quality” refers to a gas assessment mechanism that can be used as a standard unit variable to govern acceptable pollution in a reciprocal manner as defined per the worldwide health organization (WHO), the U.S. Environmental Protection Agency (US-EPA), and the United Nations Environment Programme (UNEP) [1,2,3]. An air quality gas sensor is an electronic or electro-chemical instrument that can measure the ratio of gas particles in a given volume of air, usually in units of part per million (ppm), through some sensing element. The air quality gas sensor may also have a variety of other applications [3,4,5]. In 1815, the first gas detector system known as Davy lamp was invented by Sir Humphry Davy (of England) to detect the presence of methane (firedamp) in underground coal mines [6]. The first gas sensor was invented by Dr. Oliver Johnson that originated from the catalytic combustion (LEL) sensor [7]. Clark and Lyons utilized the strategy of electrochemical detection of oxygen or hydrogen peroxide to measure glucose in biological samples [8]. The ubiquity of impedance mainly leveraged to realize the gas transducers [9]. The optical sensors are passive, i.e. require external field excitation source to inject some energy into the observation specimen for measurement [10,11,12]. The feedback of this energy can have many numerical relationships with the induced signal termed as working response (refractive coupling) [13]. The overall study carried out in this research is presented in Figure 1.
In this paper, the design of air quality gas sensors, their assembly arrays, systems, and the associated methods will be discussed in detail. This will lead to overcome the conceptual challenges that can make it difficult to recognize the similarities and the differences between existing gas sensing systems and the contributions of new techniques. The contributions of this paper are chronologically comprehended:
- Scalable low-cost air quality assessment (AQA).
- Low-cost air quality gas sensor (AQ-GS) technologies.
- Low-cost commercialized gas sensors fabrication approaches.
- Low-cost Configurations and topologies.
- Low-cost Gas sensors calibration and testing systems
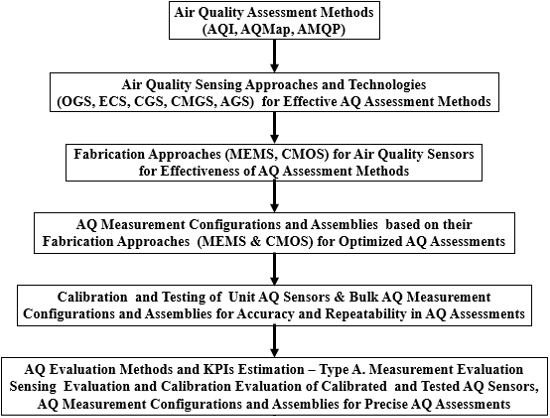
In Figure 1, the contributions from 1950 to 2021, i.e. last 70 years were focused more with slight theoretical backgrounds in pioneering. In this paper, we will discuss the design of air quality (AQ) sensors, their assembly arrays, systems, and the associated methods in a practical hierarchy presented in Figure 2.
This practice leads to transparency and conceptual challenges that can make it difficult to recognize the similarities and differences between existing gas sensing systems and the contributions of new techniques. The contributions of this paper are chronologically comprehended as: 1) Air quality assessment (AQA) frameworks; 2) AQ sensor types and technologies; 3) state-of-the-art AQ sensors fabrication approaches and technologies; 4) AQ sensors, configurations, and topologies; 5) AQ sensors calibration and testing systems; 6) AQ measurement systems; 7) AQ systems measurement evaluation methods or (KPIs) in air quality sensing.
2. Scalable Low-Cost Air Quality Assessment (AQA)
In the light of guidance documented by the core environmental protection agencies, WHO, US-EPA, EEA, and UNEP; air quality terminology refers to the entire legislative body of knowledge that involves analysis, methods, and criteria based on air quality [14,15,16,17]. The major terms used in this context are:
- Air Quality Index (AQI)
- Air Quality Mapping (AQMap)
- Air Quality Management Plan (AQMP)
Air quality assessment and air crisis risk (ACR) mitigation are strictly sequential and systematic processes. Each phase has its clear and precise significance and contribution in the next phase. AQA and ACR involve estimation of bio-tolerable gas threshold [18,19] such as hazardous gas magnitudes and pollutant ratios in atmospheric volume; geospatial AQA to orchestrate regional AQM [19,20,21,22], finally, design a model of regional air volume with effective and contributory variables to provide mitigation plan [23].
2.1. Air Quality Index (AQI)
AQI refers to a structured chart with a bio-tolerable threshold of specific pollutants and bio-hazardous gases recommended by EPA in the area under a specified border agency18-24. The top 10 environmental protection agencies (EPAs) unanimously agreed on the standard of four core gases for outdoor air quality [25] i.e. Ozone (O3), Nitrogen Dioxide (NO2), Sulphur Dioxide (SO2), Carbon Monoxide (CO).
In Figure 3a, the concentration of the four gases or the air particles part per million (ppm) constitutes the air quality index (AQI) [26,27] is the fundamental design i.e. the quantities of O3, SO2, CO, and NO2 are the standard gases considered in major environmental standards for AQI. The standard AQI evaluation template for a specific region provided by EEA as Common Air Quality Index (CAQI) and US EPA as AQI are presented in Figure 3. The dust pollutants include particulate matter (PM) versions PM-10 and PM-2.5A as standard outdoor AQI with distinguishable cross-sensitivities. In Figure 3b The air quality index chart in Figure 2 presents the mandatory thresholds and limit windows for AQI variables that serve as air pollution index (API). Another multi-parametric AQI innovation in assessment is the environmental performance index (EPI) by Yale Center for Environmental Law and Policy [28].
2.2. Air Quality Mapping (AQMap)
The geo-locations in the vicinity of AQ measurement using collective averaging and mean estimation procedures derive an air quality map with an additional parameter, that is geographical positioning system (GPS) value [29,30]. The process of collection of all such points and orientating them geo-spatially is called AQM [25,26,27,28,29,30,31]. There are two types of AQM: (i) indoor air quality mapping (I-AQM); and (ii) outdoor air quality mapping (O-AQM) [33] in Figure 4.
Figure 4, shows that I-AQM is buildings and O-AQM is region-wise. There are different sets of gases and ratios of pollutants with molecular sizes [33]. The charting and graphing as well as typo-graphic presentation schemes available, and their standardization process for AQM based on their relative effectiveness are mentioned in this work [34].
2.3. Air Quality Management Plan (AMQP)
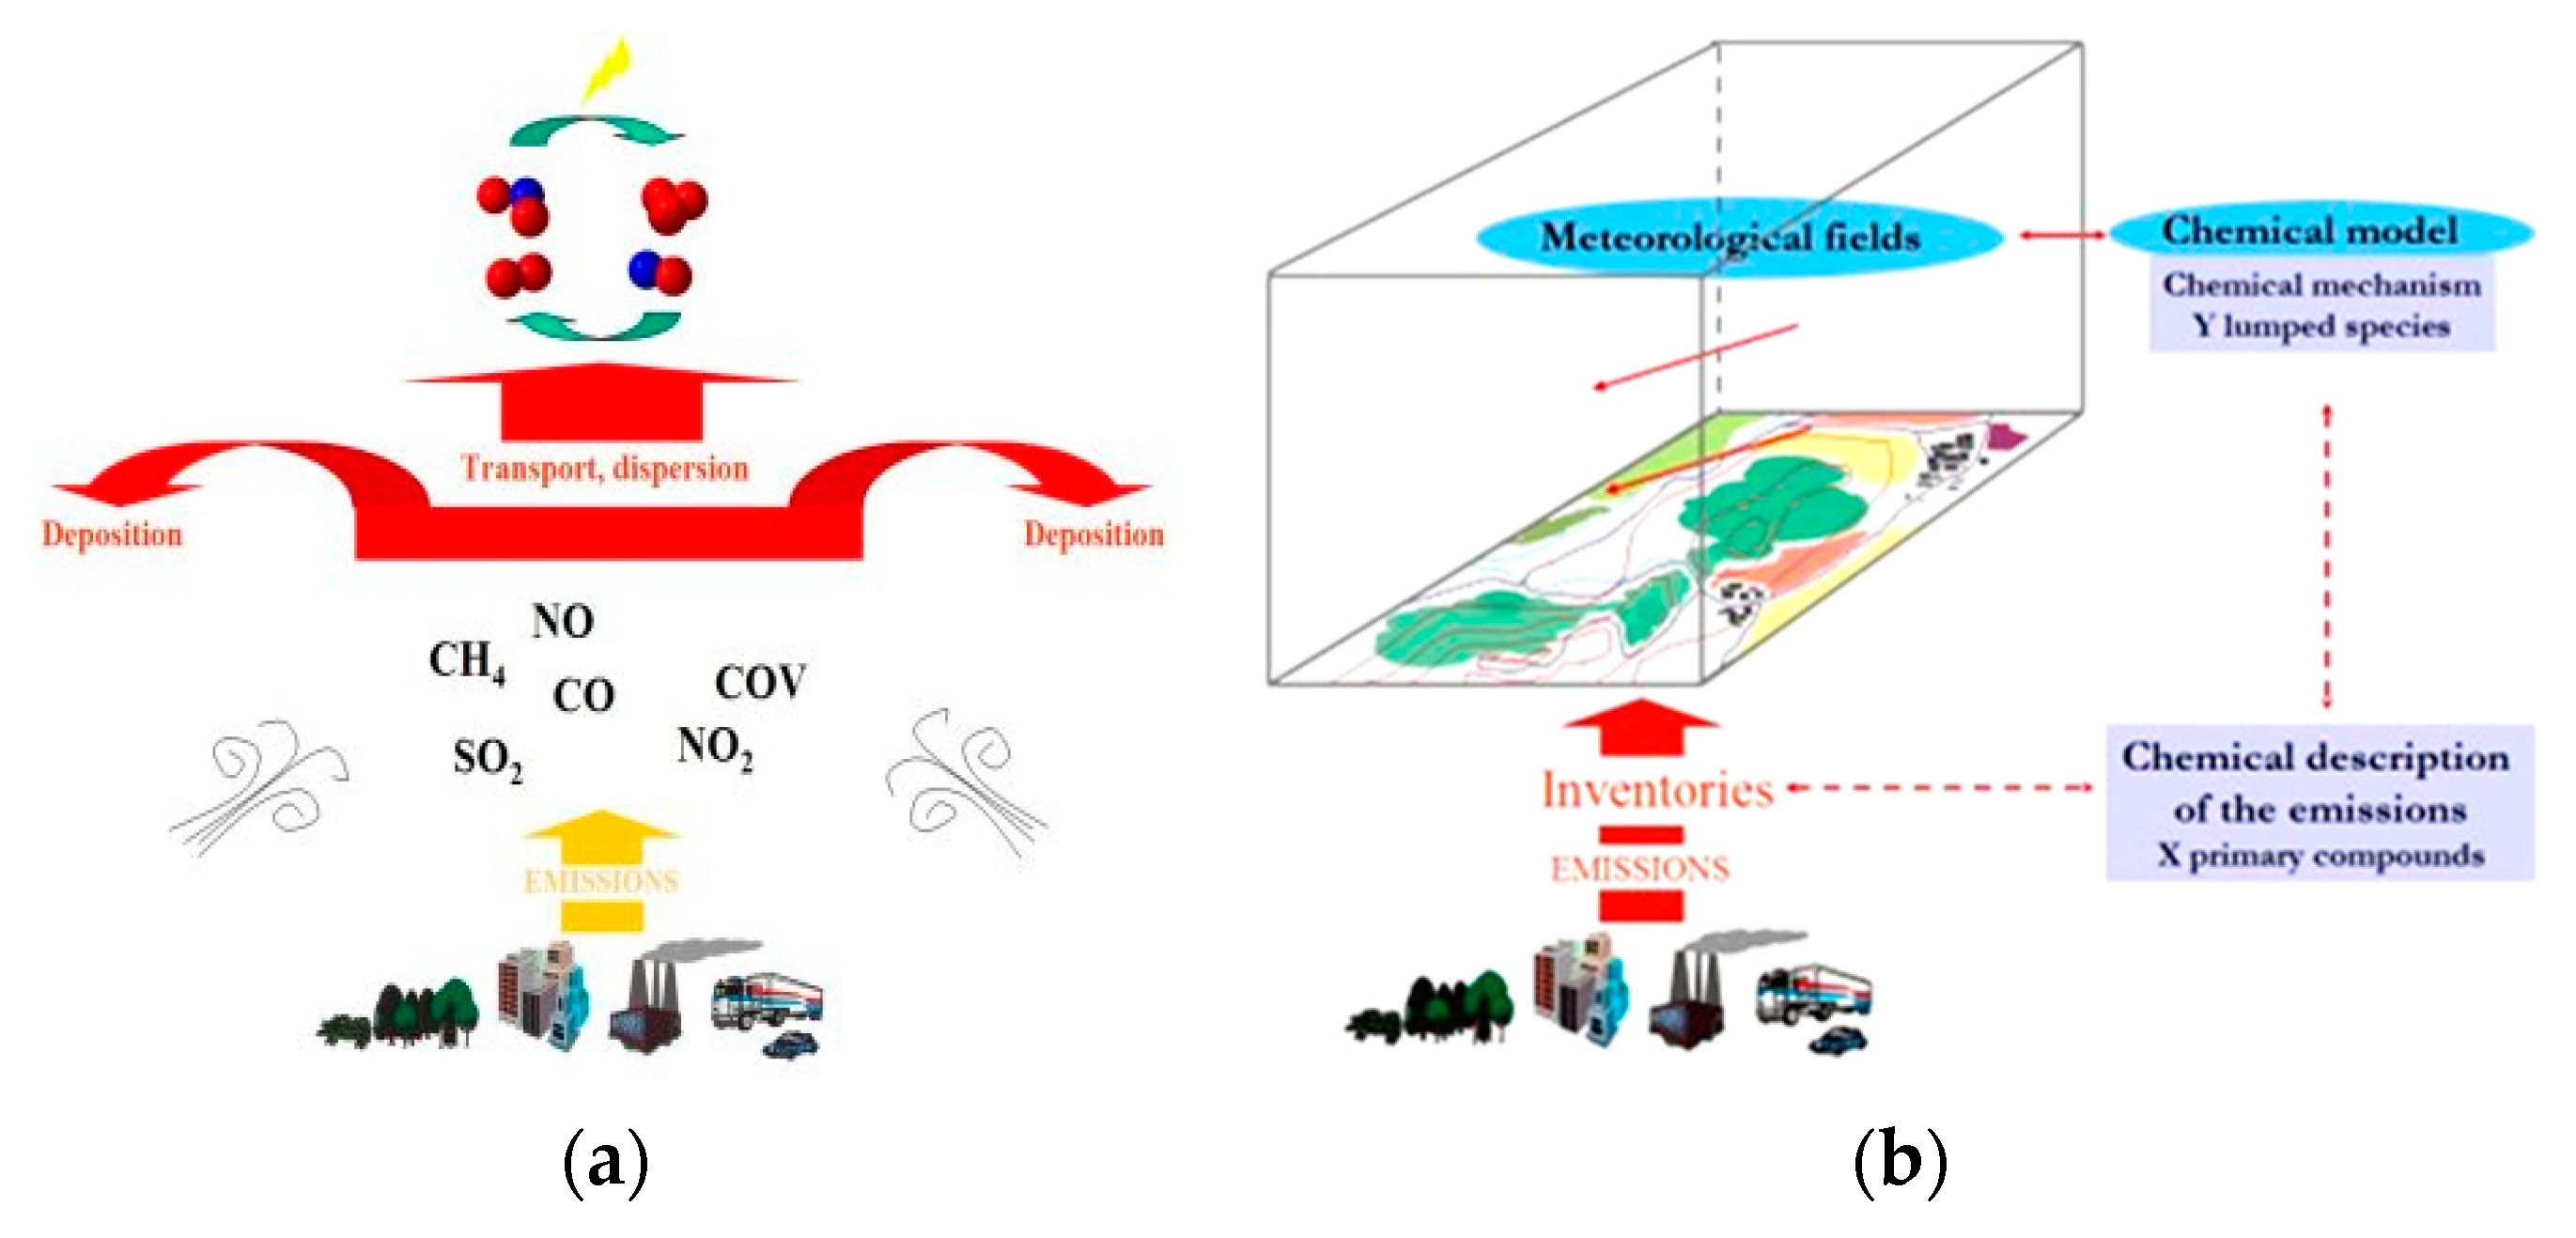
The AQMP or the Brownian motion (Robert Brown) is defined as the random nature of particle dynamics in the air. In the entire assessment of AQ, the most challenging and attention criteria is AQMP, especially air quality modeling [35]. The key work was accomplished by Dr. Gary Haq and Dr. Dieter Schwela in 2008 while modeling the toughest regions in Asia [36,37]. Claudia et al. presented a very appreciable work in virtual pollution modeling using Bayesian network theory [38]. The AQMP (2012) presented by Dr. Bjarne Sivertsen and Alena Bartonova holds a landmark value in regional level AQMP [39]. The INDAIR model and clean energy were focused on bounded value models for a clear interpretation of decision making AQMP parameters [40,41].
3. Low-Cost Air Quality Gas Sensor (AQ-GS) Technologies
There are five approaches to sense in air quality measurements and their architectures and presented in Figure 6 [44].
Furthermore, there are five unique technologies in low-cost air quality gas sensors (AQGS): a) Optical Gas Sensors (OGS); b) Electrochemical Gas Sensor (ECS); c) Capacitive Gas Sensor (CGS); d) Calorimetric Gas Sensor (CMGS); and e) Acoustic Gas Sensor (AGS) [33,34,35,36,37,38,39,40,41,42,43,44,45,46,47,48]. The architectural and working principles are explained in detail in the respective sections.
3.1. Low-Cost Optical Gas Sensors (OGS)
The AQMP or the Brownian motion (Robert Brown) is defined as the random nature of particle dynamics in the air. In the entire Identical or isometric coupling by 1:1 Tx/Rx is a combination of transmitting and receiving mode. In this case, a variable dielectric like the human body is introduced as exhibited in Figure 6 [49,50].
In Figure 7, a light source transmits a light array through a file-based sensor that measures the impact of light on air particles and returns an analog voltage value for every unique gas which is cycling through micro-OGS the chamber. The widely used OGS is non-dispersive infra-red (NDIR) gas sensor that has a swift response and long lifetime as this type does not use any consumables. The NDIR-GS is presented in Figure 8 below [49,50,51].
3.2. Low-Cost Electrochemical Gas Sensors (ECS)
In ECS, the receive mode can possibly be made by making the working electrode as sensing element and counter electrode as an extension of the transmitting electrode to pick transmitted electrons through the electrolyte [52,53,54]. In this case, a working electrode acts as a multi-channel receiver for multi-variable sensing as exhibited in Figure 9 below [53].
The ECS-GS presented in Figure 8 is a generic ECS architecture used by leading vendors in the gas sensors industry, i.e. FIGARO, SGX, and Honeywell. The faster response rates and solid-state architectures are presented in [54,55] needs fabrication tendering to assess their mass production feasibility over existing technologies.
3.3. Low-Cost Capacitive Gas Sensors (CGS)
In CGS, the transmit mode is made possible by making the sensor body an extension of the transmit electrode (or capacitor) to improvise the nearest transmitter created electric fields57. In this case, a gap volume acts as a multi-impedance transmitter for multi-variable sensing receivers as presented in Figure 10a below [58].
In Figure 10b, it is shown that CGS is merely a capacitor in an isolated circuit where the electric flux between the plates is the volume for gas measurement. The fill hole allows the air to enter the sensing zone and cycles back to the atmosphere through vents.
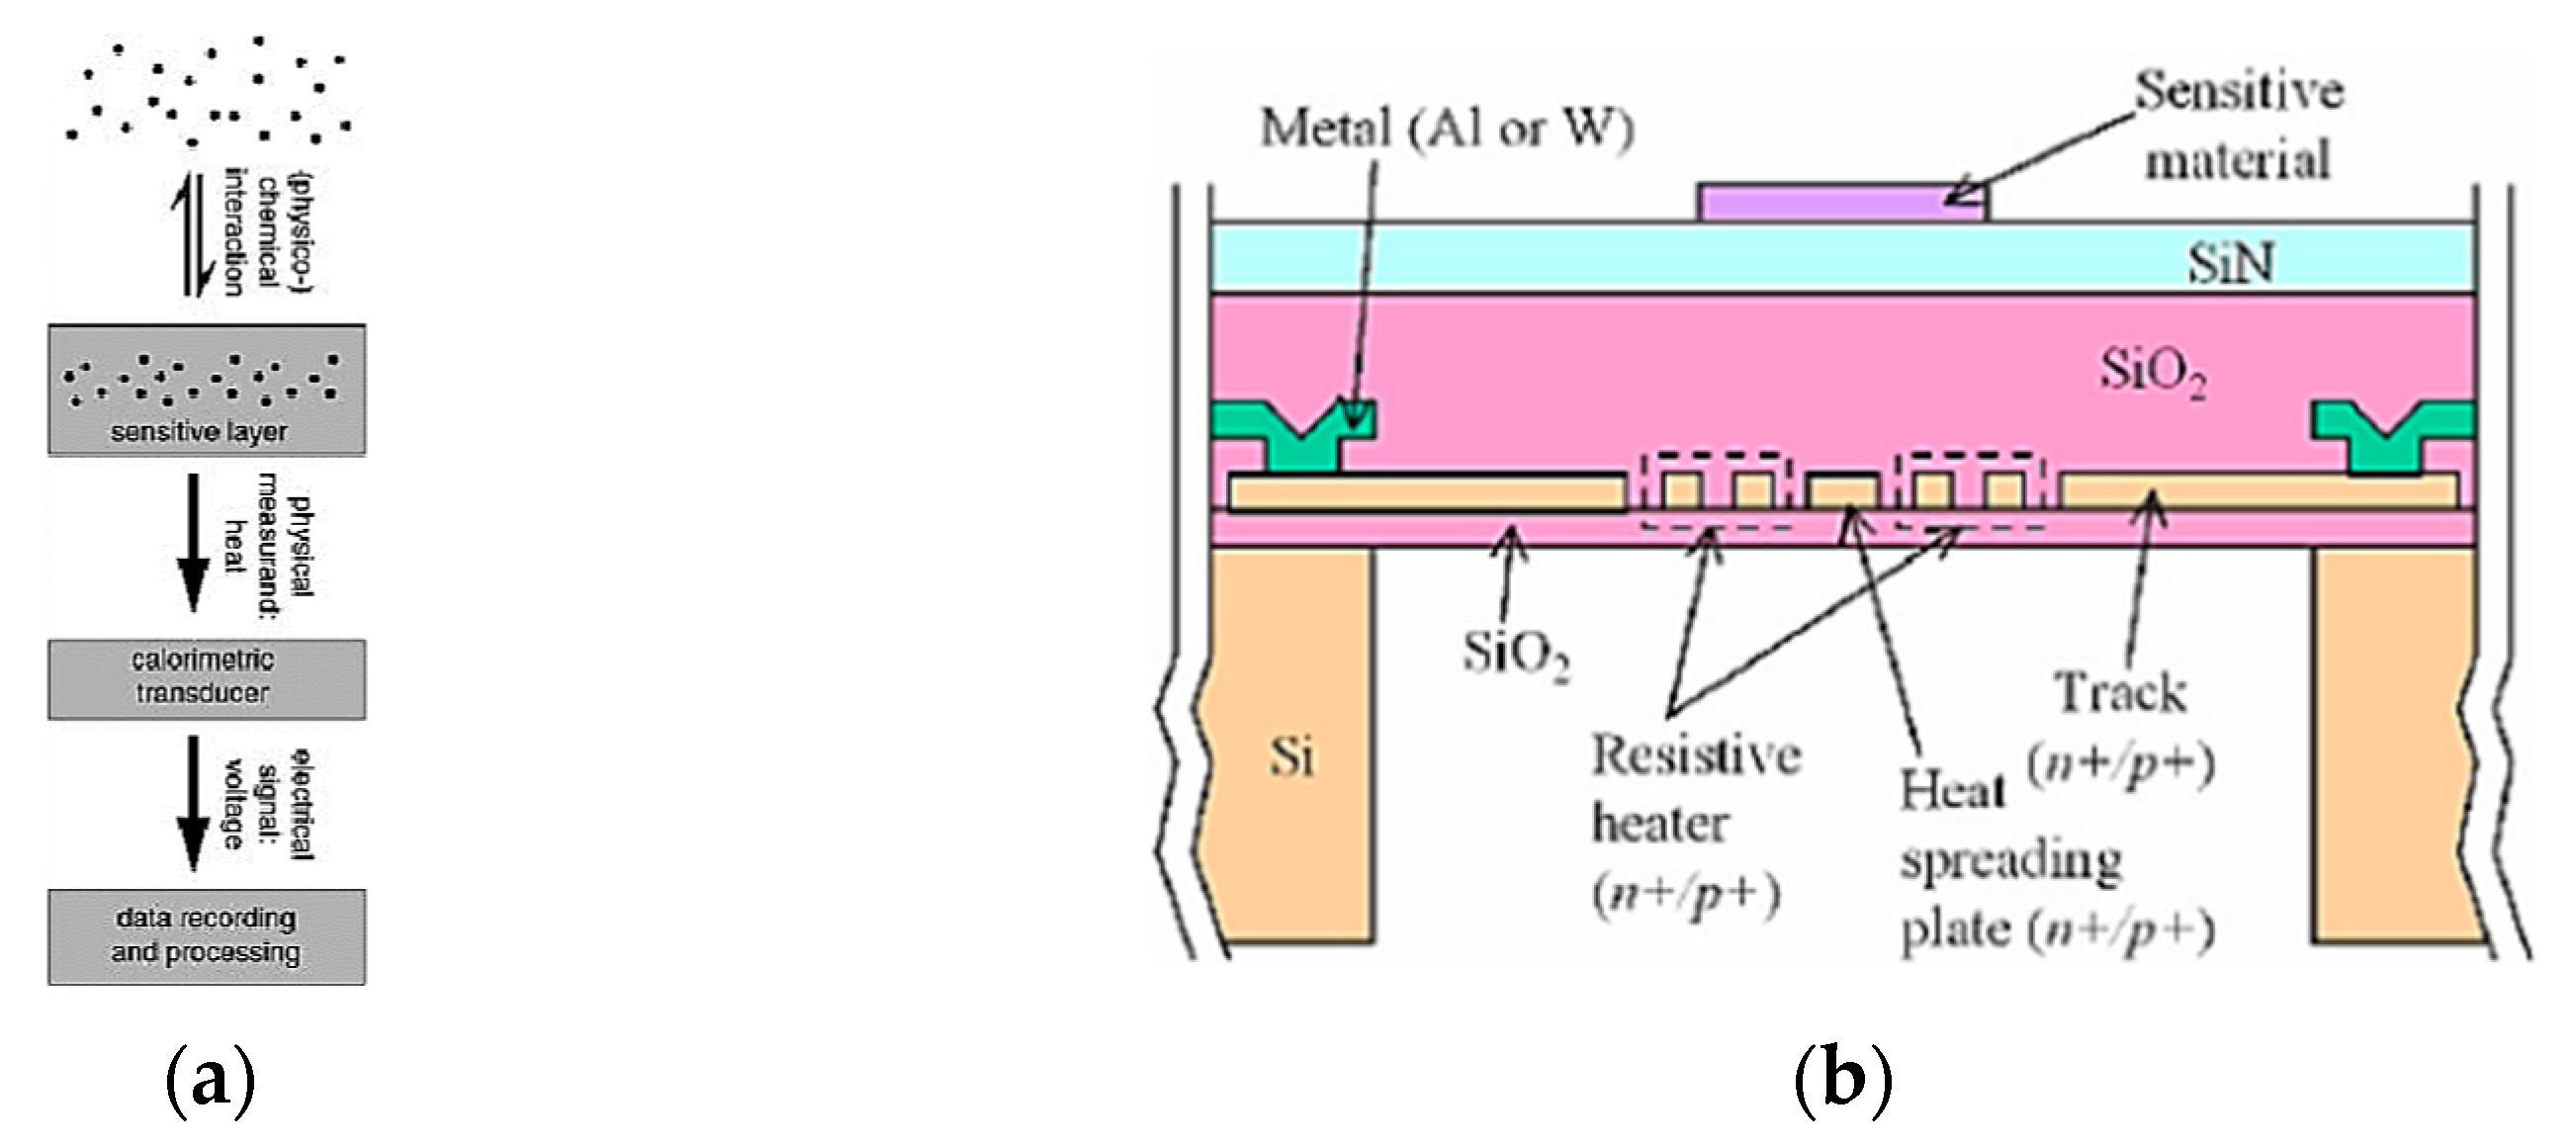
3.4. Low-Cost Calorimetric Gas Sensors (CMGS)
In CMGS, a displacement current flows through the body to ground through a catalyst loaded electrode gap [60]. A single electrode is utilized as a transmitter and receiver of flux as exhibited in Figure 10 below [61,62].
Figure 11.
Overview of CMGS [58]. (A) Architecture. (B) Working Principle.
Figure 11.
Overview of CMGS [58]. (A) Architecture. (B) Working Principle.
The finite element methods (FEM) used by Mohamed Serry et al. was a successful demonstration of a unique signal at different heater temperatures which could be increased more than 23 times by increasing the heater voltage from 3.5 to 5.0 V. Selectivity versus acetone vapor was also experimentally verified [63].
3.5. Low-Cost Acoustic Gas Sensors (AGS)
In AGS, a displacement or acoustic wave is transmitted through the gas and the difference in the characteristics of the received wave from the original wave is converted into an equivalent AGS value [64,65]. A single electrode is utilized as a transmitter and receiver of flux as exhibited in Figure 12 below [64,65,66].
The new dimension in AGSs was explored in 2018 by Xueli Liu et al. According to Xueli et al, a typical surface acoustic wave (SAW) gas sensor described in Figure 11 has a core element of thin-film coated along the SAW propagation path between the two interdigital transducers (IDTs). The absorption in sensitive thin-film modulates the SAW propagation by a so-called mass loading, viscoelastic or acoustic-electric effect, depending on the physical class of the sensitive thin-film itself [67].
4. Low-Cost Commercialized Gas Sensors Fabrication Approaches
A comprehensive work in micro-fabrication of gas sensors was accomplished by Jan et al. in [68] where different industries, based on multi-type gas sensors and their effective fabrication methods, were elaborated. The acoustic; carbon nano-tube (CNT); electrochemical; fiber-optic; metal oxide semiconductor (MOS); organic-based chemi-resistive; piezoelectric; photonic crystal gas sensors and volatile organic compound (VOC); sensors fabrication was categorically addressed in their works [69]. The most recent studies [68,69,70,71,72,73] highlighted only two state of the art fabrication approaches for the Gas Sensors (GS):
- Micro-Electro-Mechanical Systems (MEMS) Fabrication Approaches
- Complementary Metal Oxide Semiconductor (CMOS) Fabrication Approaches
4.1. Micro-Electro-Mechanical Systems (MEMS) Fabrication Approaches
The MEMS was the first of the commercialized approach for CEs fabrication and was composed of 15 core steps as shown in Figure 13 for the first steps in gas sensing as electrode fabrication and placement. The molybdenum micro-heaters were prepared in the following steps [74]: a) the membrane micro-heater utilized 104 mW to acquire an 800 °C with a thermal resistance of 7.2 °C/mW; b) FLIR camera was used to acquire thermal distribution patterns overheating area; c) a temperature gradient of 1.18 % to its periphery; d) stabilities of the micro-heated were analyzed (mechanically and chemically as well its membrane failures safety threshold was estimated;) e) the characterization of micro-heater using optical profile-meter was estimated to be 16.25 µm at 800 °C.
In Figure 13 the entire MEMS fabrication process flow of the electrode can be observed. The pulse train and the constant DC voltages were also characterized in [74]. The response time is in the order of 19ms and the recovery time is equal to 34 ms. A stable temperature was exhibited by a micro-heater with a negligible resistance drift (0.96%) for 600 hours. The accuracy of CO was (5000 parts-per-billion (ppb)) measured between 300 to 700 °C. Another MEMS process for ECGS based on micro-heaters are using SiO2 with sputtering of a 10/60 nm were coated with thick Ti/Pt metal layer of 300nm thickness of a 10/60 nm Cr/Au layer [75].
In Figure 14, it can be noticed that the AGS (quartz crystal micro-balance) was manufactured on a 168 µm to 330 µm and a diameter of about 5 mm to 25 mm quartz [77]. Gold (Au) and Platinum (Pt) were used as electrodes. Each quartz was etched using RIE. An anisotropic and inductively-coupled plasma reactive ion etching (ICP RIE) method can be used with etch quartz [78]. Deposition, lift-off, photolithography, beam evaporation, Ni patterning were the major processes employed in these methods [79]. The capacitive micro-machined ultrasonic transducer gas sensor has also been introduced as an exemplary case of MEMS fabrication in 12 sequential steps for AGS given in Figure 15 [80,81].
It is eloquent from Figure 15 that in MEMS fabrication is mainly dependent on the coating, sputtering, exposure, electroplating, and photolithography. One of the state-of-the-art methods was the sacrificial method and wafer bonding [80,81,82,83,84,85], i.e. utilizing the cavity flow for sensing in first and trapping air in second.
4.2. Complementary Metal Oxide Semiconductor (CMOS) Fabrication Approaches
The current CMOS fabrication approaches mainly cover field-effect transistors (FETs) using Silicon on insulator (SOI) technology [86,87,88,89,90] for GSs is CMOS based and its primitive impedance model and assembly are presented in Figure 16 [87].
The entire CMOS electrode microchip cluster is resolved into finite elements and is equivalent to a capacitance and a resistance between electrode 1 and electrode 2 [86,87]. The CMOS capacitive electrode-based sensors assembly of manufactured GSs is presented in Figure 16b. The CMOS fabricated FET sensors are nano-capacitive types in a vast sense and are presented in Figure 17 and Figure 15. The Twelve Step MEMS Fabrication Process for GSs is presented in the following references [80,81,82,83,84,85].
The three major features of the sensors presented in Figure 17 from [35,56,57,58,86,87,88,89,90] were able to deliver the response rates of less than 3 seconds and with a resolution of ppb. The SOI technology used in the FETs (from Figure 17) is produced through the CMOS process (Figure 18) detailed in [91].
For wet etching Tetra-methyl-ammonium hydroxide (TMAH) was used being fully compatible with CMOS processes [90,91,92]. The deep reactive-ion etching (DRIE) in such a case was used for miniaturization of the sensor [91]. The layered deposition of the SOI technique enabled fabrication at 400 to 600C with lowering the leakage current [92,93,94].
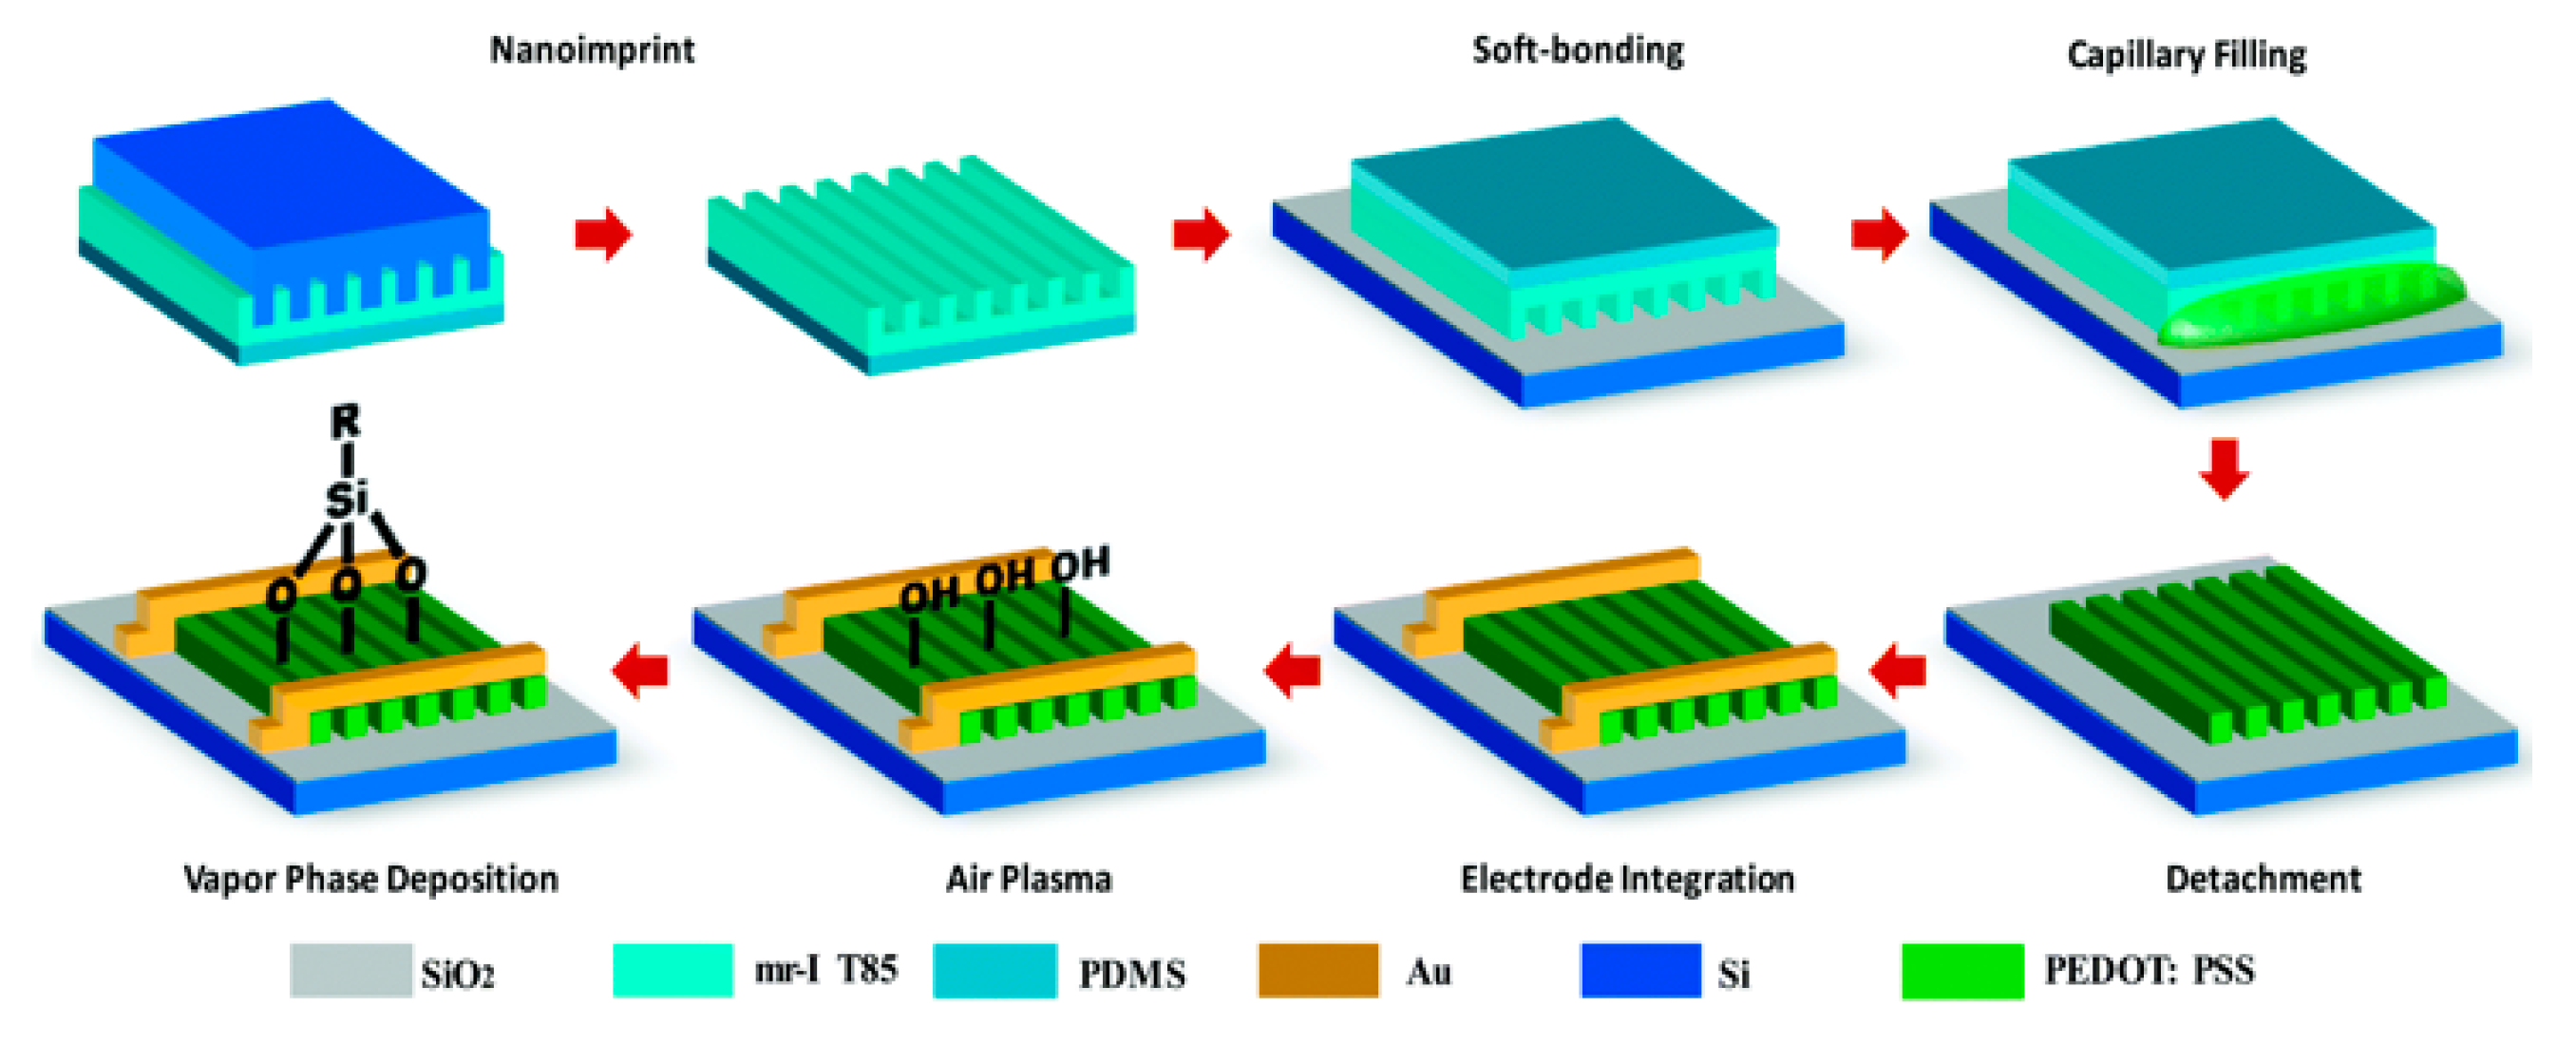
The most recent work [95] in Mar 2020 by Yiang et al. is the state of the art in the entire generation [96,97,98,99,100] of CMOS nanofabrication based on nano-wires and nano-electrode deposition. The E-Nose term is often used for nano-scale fabrication in CMOS with multi-sensor electrode integration over a single dye [95]. The soft-lithographic technique for chemo-resistive gas sensor array fabrication with ordered sub-100 nm wide conducting polymer nanowires (poly-ethylene-dioxythiophene). The poly (styrene sulfonate) (PEDOT: PSS) functionalized in an assembly of different self-assembled monolayers (SAMs) were able to measure VOCs at ppb.
5. Low-Cost AQ Measurement Configurations and Assemblies
Smart methods like machine learning and data analysis for AQA processes require the gas sensors to be in specific format or topology for accuracy, effectiveness, and trustable measurements [101,102,103,104,105,106,107,108]. There are two core multi-gas sensing or sensor topologies (also called electronic nose) arrays and grids, further elaborated as; a) Gas Sensor Arrays and Grids based on System on Module (SoM) Approach; b) Gas Sensors Array on Chip based SOI.
5.1. Gas Sensor Arrays and Grids based on System on Module (SoM) Approach
The term electronic nose board (ENB) was used by various researchers across the world for a specific multi-sensor heterogeneous instrumentation PCB (Figure 20 and Figure 21) from [103,104,105,106,107,108,109]. The orientation of ENBs is for a typical sensing application is called gas sensing array (GSA) or GS grid (GSG) [102]. The multiple GSAs send data to a central data acquisition collector or gateway called GSG [104]. Different GSAs and GSGs from novel works were objectively discussed in [103,104,105,106,107,108,109].
Gradient descent method was used to detect food ripening by GSA interfaced with STM32 in Figure 20a [103]. Later outdoor air quality assessment was forecasted by GSA in Figure 20b. Similarly, the water filtration assessment was performed using particle swarm optimization (PSO) by 8 MOX GSA boards formed a GSG interfaced with MSP430F247 board as presented in Figure 20c [105,106].
Figure 21.
Major contributions in Applied GSGs and ENBs. (a) Trio GSG for I-AQA [107]. (b) Wound Infection ENB [108] (c) Smart Rig Test ENB [109].
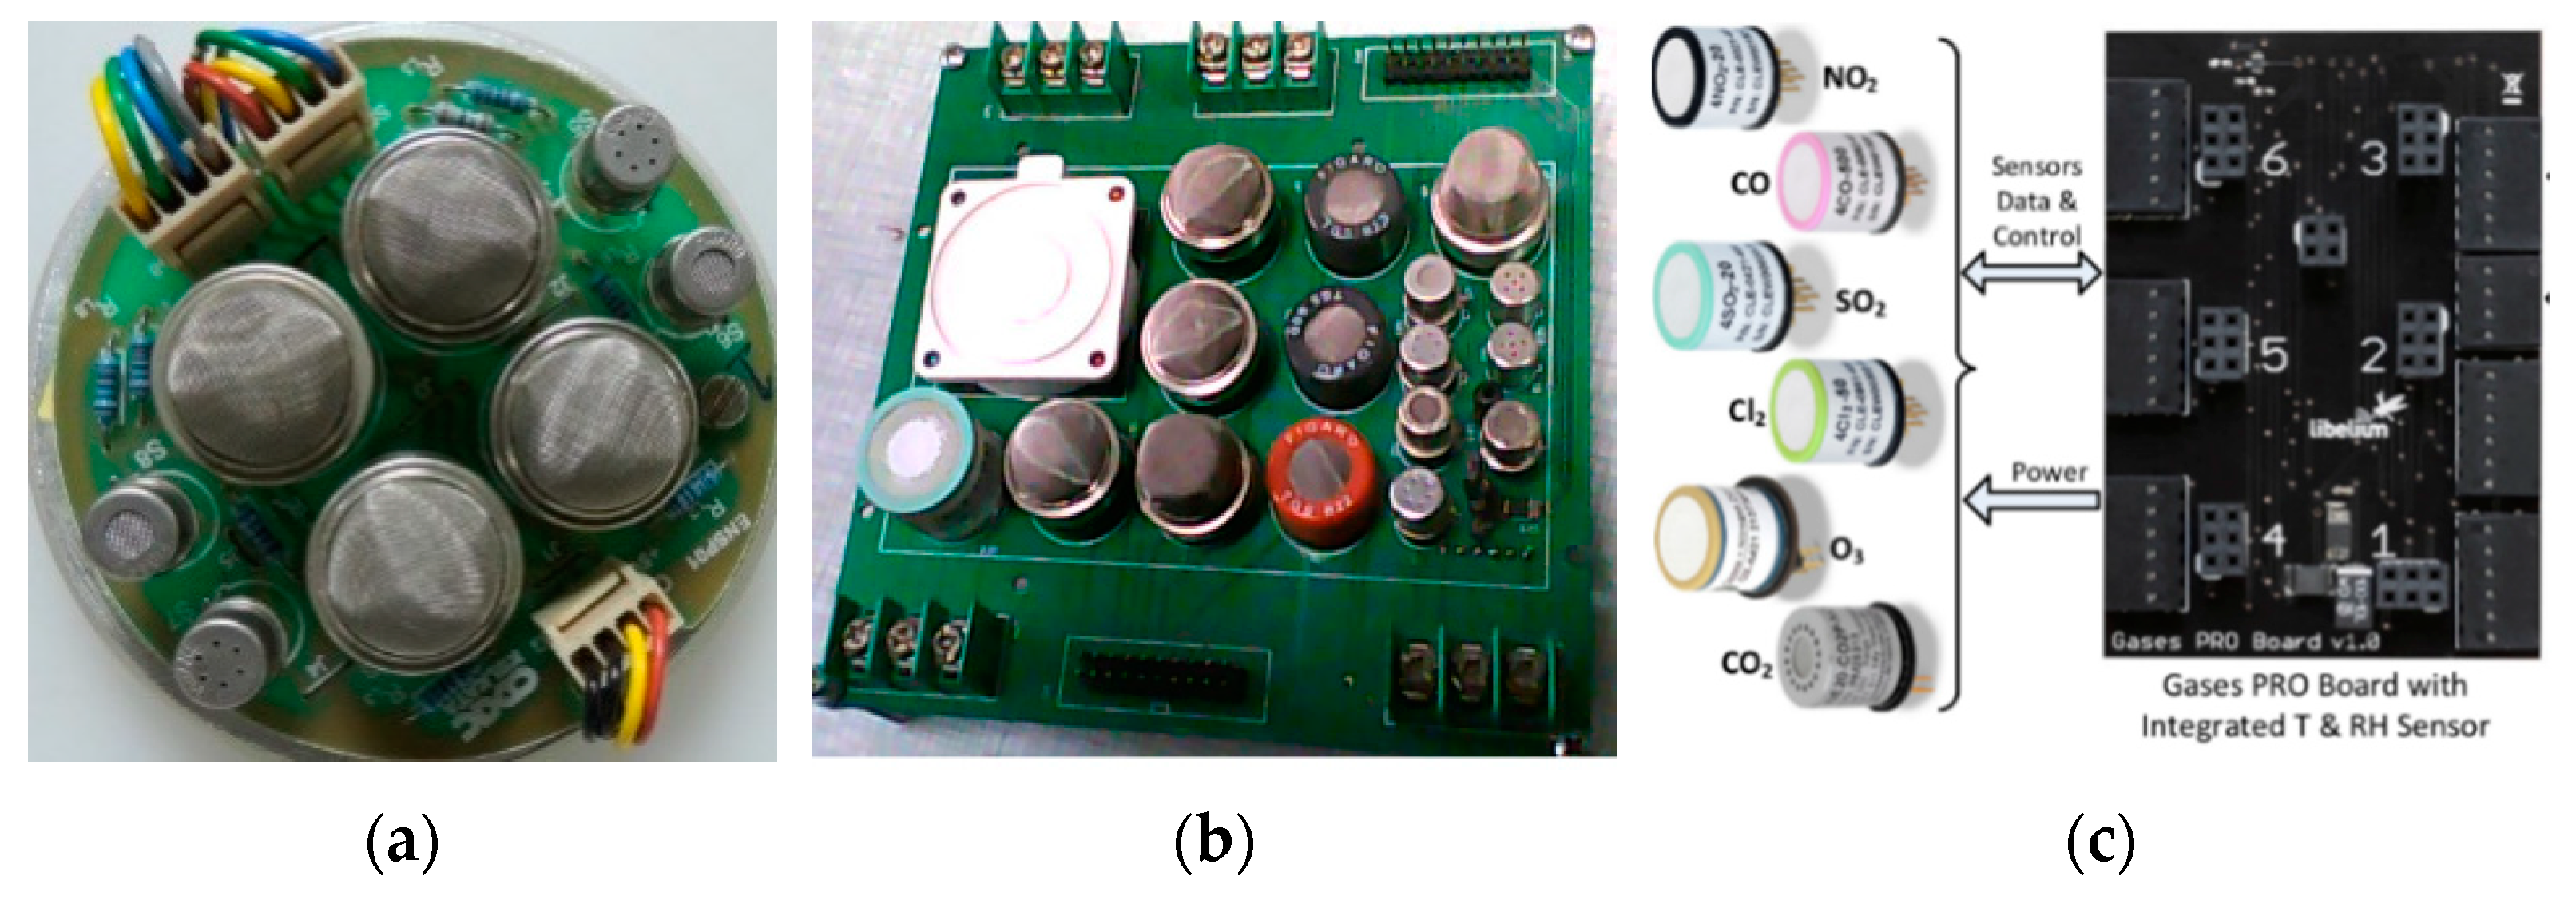
I-AQA was performed in a hospital using least square estimation for HVAC testing using Trio GSG [107], i.e. the 8 indoor gases were assessed from Figure 20a. In Figure 21b, the SVM was used to assess wound infection by ENB based on 4 types of sensors [108]. In April 2020 the most recent ENB was used for assessment of MFCs in a gas sensors calibration test bench [109] presented in Figure 21c.
5.2. Gas Sensor Arrays and Grids based on System on Module (SoM) Approach
In 2019-2020, state of the art appeared in the market as GSA on Chip, the next step in Sensor on Chip prepositions [110,111,112,113]. These arrays delivered accuracy at details of ppb. In 2016, Screen Printed Electro-chemical (SPEC) sensors shrinked this gas sensing technology down to a size appropriate for consumer devices that can be made at the volumes and costs suitable to the mass market [110] in Figure 22a. The multi-sensor chip was proprieted as Digital Sensor Platform on Chip (DSPoC) and the overall ENB was called Open Source DSPoC Kit.
In 2017, H2S, H2, and NO2 gases were sensed using a novel GSAoC with 3.5nm wires [111]. The most recent work was Single-Chip Gas Sensors Array (SC-GSA) in which a set of four micro-heaters were used to access a single suspended SiO2 diaphragm [112], using thermal proximity and achieved low power consumption (∼10 mW for 300 °C). The plasma optimized thin films of ZnO, BaTiO3-CuO doped with 1% Ag, WO3, and V2O5 are employed for selective sensing of CO, CO2, NO2, and SO2. The four sensors were controlled independently and demonstrated CO (∼78.3% for 4.75 ppm) at 330 °C, CO2 (∼65% for 900 ppm) at 298 °C, NO2 (∼1948.8% for 0.9 ppm) at 150 °C, and SO2 (∼77% for 3 ppm) at 405 °C operating temperatures. The complete implementation for GSAOC is the current state of the art [113].
6. Low-Cost Calibration and Testing of AQ Gas Sensors
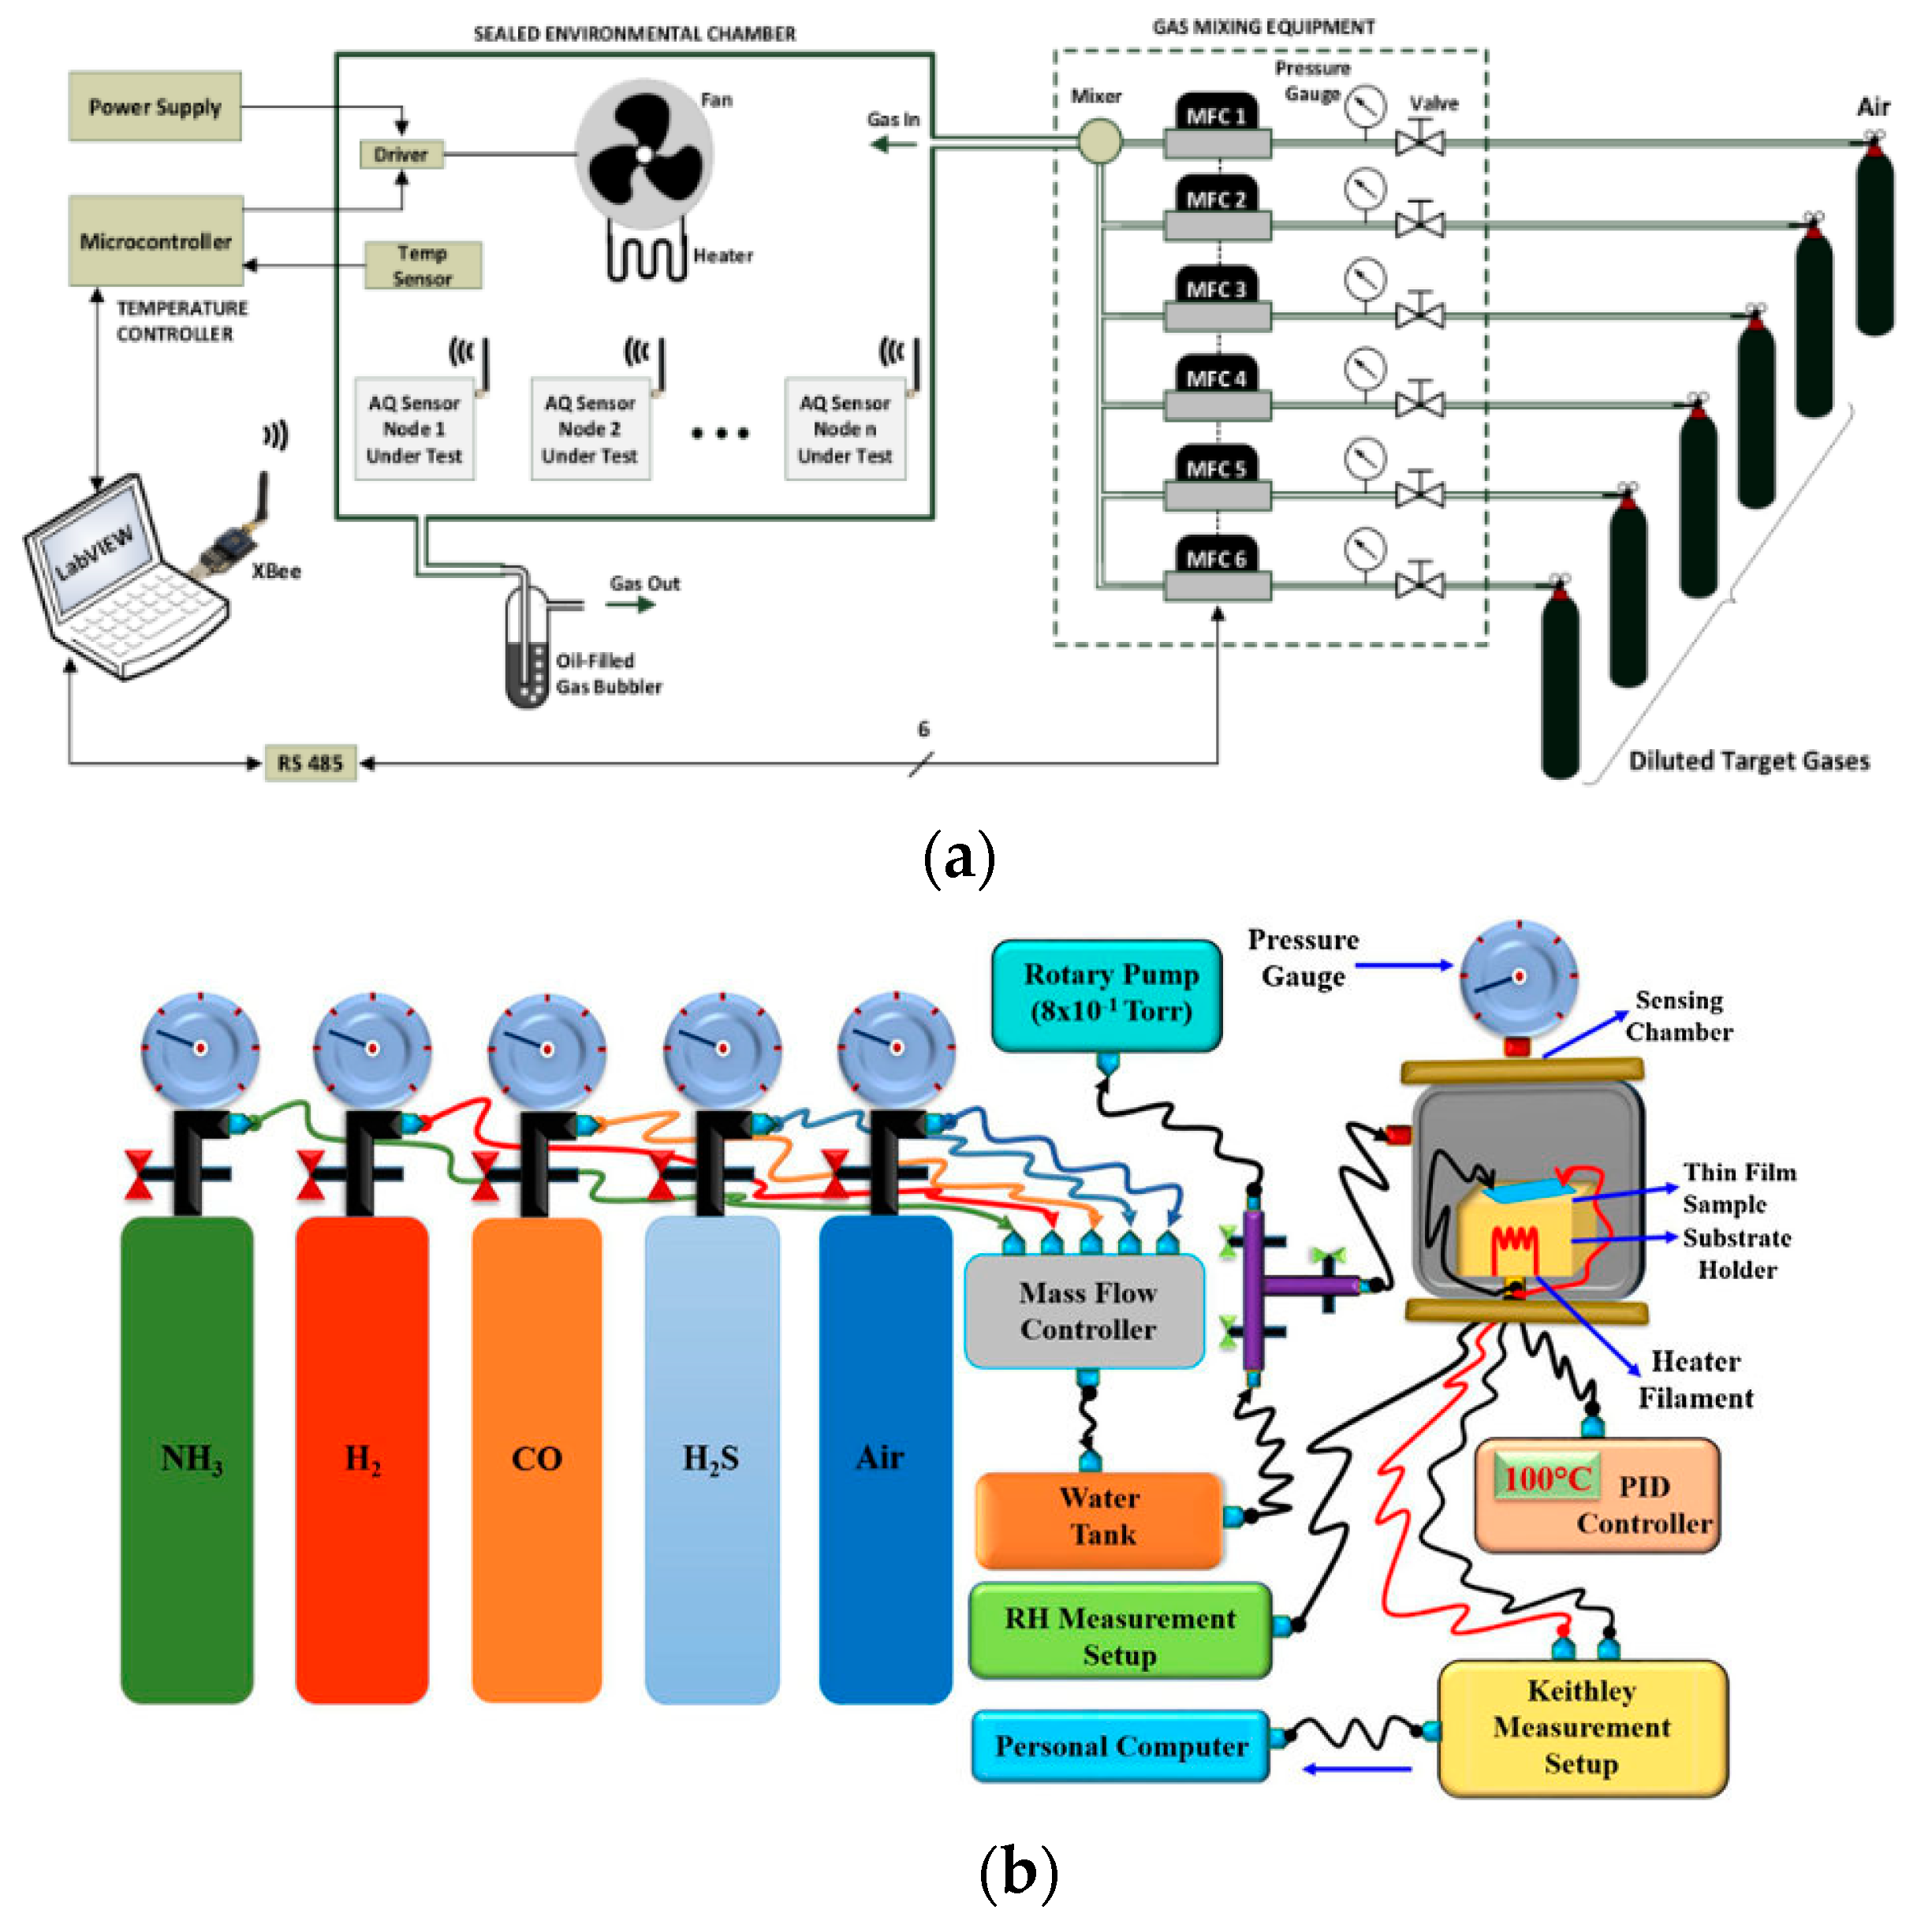
In 2009, the first structured gas sensors calibration system was designed and implemented by a measurement calibration system that was developed by Octavian et al. [114]. A standard AQS Calibration follows the [114] schematic as: a) An Air-sealed chamber with inflow and outflow valves; b) mass flow controllers (MFCs) for the desired concentration of gas from a cylinder or a PID controller gas flow loop; c) gas cylinders with different concentrations; d) temperature actuator (heater); e) humidity actuator (steam regulator); f) gas collectors for the environmental model; g) measurement instruments other than gas sensors for comparison interfaced with a computer. The recent work realized a plethora of efforts made in gas sensors calibration [114,115,116,117,118,119,120,121,122,123,124,125,126,127] presented in Figure 23, Figure 24, Figure 25 and Figure 26
In Figure 23a, an industry-standard instrumentation topology, i.e. piping and instrumentation diagram (P&ID) is presented for AQGS [114]. It consists of 14 components: 1) CGB: Calibration gas bottle; 2) MFC: Mass flow control; 3) TCE: Testing chamber electro-valve; 4) DCE: Drying chamber electro-valve; 5) SC: Saturation chamber electro-valve; 6) DCP: Drying chamber pump; 7) SCP: Saturation chamber pump; 8) DC: Drying chamber; 9) SC: Saturation chamber; 10) HC: Heater control; 11) H: Heater; 12) WT: Water tank; 13) TCV: Testing chamber ventilator and 14) SCV: Saturation chamber ventilator.
The chamber ventilator's internal architecture varies with the sensing technology detailed in a survey on gas sensing (Xiao Liu et al. [115]). The two studies in testing performance of field gas sensor calibration techniques were proposed by Joanna et al. [116] for Colorado. The characterization study conducted by Leidinger et al. led to a new horizon in test gas generation systems [117]. In Figure 23b, an experimental gas sensor test, and calibration system by for SnO2 nanowires based gas sensors are presented (Le Viet Thong et al. [118]). The test was performed by measuring all the sensors with liquid petroleum gas (LPG, 500–2000 ppm) and NH3 (300–1000 ppm) at different temperatures (50–450 ◦C) using a set up with high speed switching gas flow (from/to air to/from balance gas). Balance gases (0.1% in air) were purchased from Air Liquid Group, Singapore. The system employed a flow-through with a constant rate of 200 sccm. The miniaturized environmental control chambers presented in Figure 24 were introduced by Yi Chen et al.[119] and Jordi Follonosa et al [120].
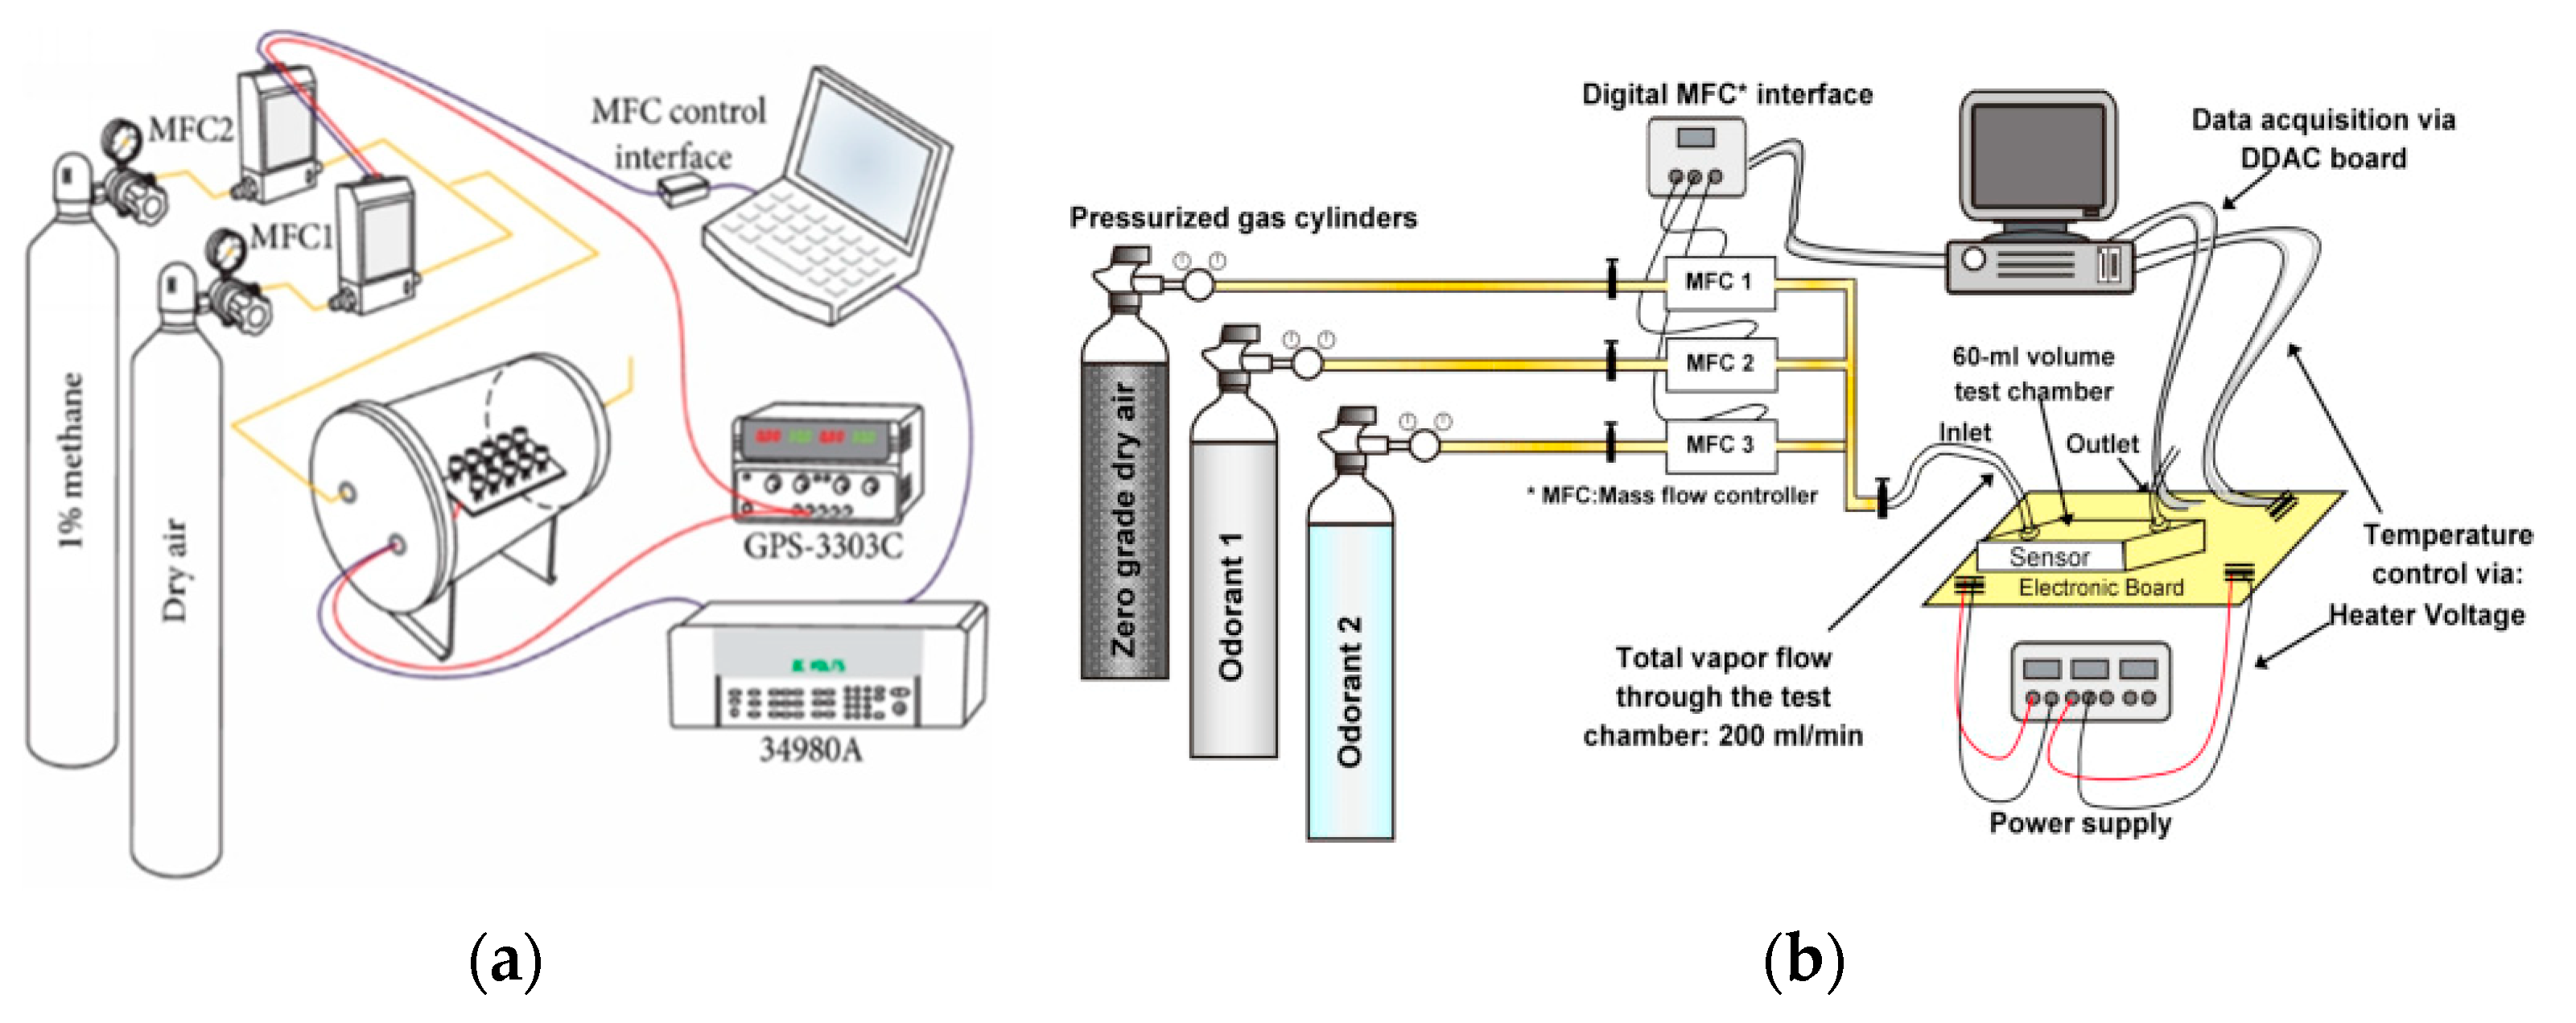
In Figure 24a, the sensor array was placed in a test chamber with a volume of 20 L, composed of ten metal oxide semiconductor gas sensors TGS 2620 by Joanna et al. [119]. The sensor array resistances were acquired by a half-bridge configuration and collected by a multifunction switch/measuring unit 34980A via an electrical interface on the chamber. The gas mixture, based on PID experimented by Jordi et al. [120] and using the dynamic response of each sensor, was recorded at a sample rate of 100 Hz. In this chamber, the RH (0~10%) was varied and captured using a 16-channel ADC. The time-series sequence for entire dataset from 16 channel acquisition system from sensors in the given order, i.e. (CH0-CH15): TGS2602; TGS2602; TGS2600; TGS2600; TGS2610; TGS2610; TGS2620; TGS2620; TGS2602; TGS2602; TGS2600; TGS2600; TGS2610; TGS2610; TGS2620; TGS2620. This discussion will follow a sub-type capacitive bio-sensors (the first type of bio-sensors), further trimmed down to branch bio-sensors based on contactless capacitive electrodes.
In 2020, the most recent state of the smart gas sensors calibration test rig appeared in literature by Mohieddine A. Benammar et al. [122] presented in Figure 25a. In Figure 25a, Smart TestRig took account of all the major improvements recommended in studies by Maag, B. et al. [123] for gas sensor calibration in air monitoring deployments. Spinelle, L. et al. [124] present field calibration of a cluster of low-cost available sensors for air quality monitoring using O3 and NO2. Mijling, B. et al. [125] worked on field calibration of electrochemical NO2 sensors in a citizen science context. Hagan et al. [126] present calibration and assessment of electrochemical gas sensors by co-location with regulatory-grade instruments; Hasenfratz. D. et al. [127] for on-the-fly calibration of low-cost gas sensors; Yang, F. et al. work [128] introduced dynamic calibration of electrochemical gas sensors for accelerated analytic quantification; Tian, B. et al. [129] proposed an environment-adaptive calibration system for outdoor low-cost electrochemical gas sensors. In Figure 25b, Arvind et al. [121] performed the entire testing and calibration of several gas sensors using a custom sensing chamber (volume ∼300 cm3), PID controller electric heater. The gases were individually mixed with dry synthetic air and introduced inside the test chamber at the controlled flow rate of 50 cm3/min. One of the core innovations in this work was an evacuation pump scheme with 8×10⁻¹ Torr using a rotary vacuum pump. In the next generation, testing calibration systems curve fitting and error proportionalities performed for porous silicon filled Pd/SiC nano-cauliflower thin films for high-performance H2 gas sensors as an example by Arvind Kumar et al. [121] presented in Figure 25b.
8. Conclusions
The key challenges low-cost sensors utilization in the study of air quality measurement, assessment, systems, and their life-cycle were elaborated in this work in a systematic portrait with state-of-the-art contributions by researchers around the world. This research served its purpose in key factors and criterion in AQ a) the effective assessment techniques at urban and regional level defined the credibility and accuracy of air quality status; b) the appropriate sensors selection and optimizable components contributed to achieve the desired measurements; c) the tactical and strategic orientation of sensors assemblies and arrays were used to meet critical application challenges; d) the state-of-the-art sensors on chip options assisted in meeting the cutting edge market needs; f) the fabrication technologies and methods streamlined the properties, specifications and capabilities of sensors; g) the gradual improvement in testing methods of AQ sensors harnessed enhanced calibration methods; and h) the multi-parametric and dedicated sensor testing and calibration systems gave better insights of operational, measurement, and transient anomalies.
Author Contributions
Conceptualization, H.T.; Data curation, H.T.; Formal analysis, H.T.; Funding acquisition, F.T., D.C. and A.B.M.; Investigation, H.T; Methodology, H.T.; Project administration, F.T.; Resources, F.T., D.C. and A.B.M.; Software, H.T.; Supervision, F.T.; Validation, H.T.; Visualization, H.T.; Writing—original draft, H.T.; Writing—review & editing, F.T., D.C. and A.B.M.
Acknowledgments
This publication was made possible by NPRP grant # 10-0102-170094 from the Qatar National Research Fund (a member of Qatar Foundation). The statements made herein are solely the responsibility of the authors.
Conflicts of Interest
The authors declare no conflict of interest. The funders had no role in the design of the study; in the collection, analyses, or interpretation of data; in the writing of the manuscript, or in the decision to publish the results.
References
- Bruce, N.; Perez-Padilla, R.; Albalak, R. Indoor air pollution in developing countries: a major environmental and public health challenge. Bull. World Health Organ. 2000, 78, 1078–1092. [Google Scholar]
- E. Taylor, The Air Quality Health Index and its Relation to Air Pollutants at Vancouver Airport, B.C. Ministry of Environment, 2018.
- A Guide to Air Quality and Your Health, U.S. Environmental Protection Agency, Office of Air Quality Planning and Standards, Outreach and Information Division, Research Triangle Park, NC. EPA-456/F-14-002, 2014.
- The Plain English Guide to the Clean Air Act, United States Office of Air Quality Planning and Standards, Environmental Protection Agency Research Triangle Park, Publication No. EPA-456/K-07-001, April 2007.
- Xie, X.; Semanjski, I.; Gautama, S.; Tsiligianni, E.; Deligiannis, N.; Rajan, R.T.; Pasveer, F.; Philips, W. A Review of Urban Air Pollution Monitoring and Exposure Assessment Methods. ISPRS Int. J. Geo-Inf. 2017, 6, 389. [Google Scholar] [CrossRef]
- J. M. Thomas, Sir Humphry Davy and the coal miners of the world: a commentary on Davy (1816), ‘An account of an invention for giving light in explosive mixtures of fire-damp in coal mines’, Philosophical Transactions A, 2014.
- Setiawan, A.; Friggieri, J.; Kennedy, E.M.; Dlugogorski, B.Z.; Stockenhuber, M. Catalytic combustion of ventilation air methane (VAM) – long term catalyst stability in the presence of water vapour and mine dust. Catal. Sci. Technol. 2014, 4, 1793–1802. [Google Scholar] [CrossRef]
- Yoo, E.-H.; Lee, S.-Y. Glucose Biosensors: An Overview of Use in Clinical Practice. Sensors 2010, 10, 4558–4576. [Google Scholar] [CrossRef]
- C. Cowie, K. F. Rust, D. Byrd-Holt, E. W. Gregg, E.S. Ford, L. S. Geiss, K. E. Bainbridge, J. E. Fradkin, Prevalence of diabetes and high risk for diabetes using hemoglobin A1c criteria in the U.S. population in 1988–2006, Diabetes Care. 2010.
- A. P. Turner, Biosensors--sense and sensitivity, Science, 2000.
- Lee, T.M.-H. Over-the-Counter Biosensors: Past, Present, and Future. Sensors 2008, 8, 5535–5559. [Google Scholar] [CrossRef] [PubMed]
- Rodriguez-Mozaz, S.; de Alda, M.J.L.; Barceló, D. Biosensors as useful tools for environmental analysis and monitoring. Anal. Bioanal. Chem. 2006, 386, 1025–1041. [Google Scholar] [CrossRef] [PubMed]
- Allsop, T.; Neal, R.; Davies, E.M.; Mou, C.; Bond, P.; Rehman, S.; Kalli, K.; Webb, D.J.; Calverhouse, P.; Bennion, I. Low refractive index gas sensing using a surface plasmon resonance fibre device. Meas. Sci. Technol. 2010, 21. [Google Scholar] [CrossRef]
- World Health Organisation: Data and Statistics, World Health Organization, Geneva, Switzerland, 2017.
- Gillis, D.; Semanjski, I.; Lauwers, D. How to Monitor Sustainable Mobility in Cities? Literature Review in the Frame of Creating a Set of Sustainable Mobility Indicators. Sustainability 2016, 8, 29. [Google Scholar] [CrossRef]
- Kanaroglou, P.S.; Jerrett, M.; Morrison, J.; Beckerman, B.; Arain, M.A.; Gilbert, N.L.; Brook, J.R. Establishing an air pollution monitoring network for intra-urban population exposure assessment: A location-allocation approach. Atmospheric Environ. 2005, 39, 2399–2409. [Google Scholar] [CrossRef]
- Wang, M.; Zhu, T.; Zheng, J.; Zhang, R.Y.; Zhang, S.Q.; Xie, X.X.; Han, Y.Q.; Li, Y. Use of a mobile laboratory to evaluate changes in on-road air pollutants during the Beijing 2008 Summer Olympics. Atmospheric Meas. Tech. 2009, 9, 8247–8263. [Google Scholar] [CrossRef]
- K. Amit, K. Gorai, and P. Goyal, A review on Air Quality Indexing system, Asian Journal of Atmospheric Environment, Vol. 9-2, pp. 101-113, 15. 20 June.
- Bezuglaya, E.; Shchutskaya, A.; Smirnova, I. Air pollution index and interpretation of measurements of toxic pollutant concentrations. Atmospheric Environ. Part A. Gen. Top. 1993, 27, 773–779. [Google Scholar] [CrossRef]
- E. Taylor, The Air Quality Health Index and its Relation to Air Pollutants at Vancouver Airport, B.C. Ministry of Environment, 2008.
- A. Yerramilli, V. Bhaskar, R. Dodla, and S. Yerramilli, Air Pollution, Modeling and GIS based Decision Support Systems for Air Quality Risk Assessment, Environmental Science, 2011.
- E.Bozyazi, S. Incecik, C. Mannaerts, and M. Brussel, Analysis and mapping of air pollution using a GIS approach: A case study of Istanbul, AIR POLLUTION VIII, 2000.
- A. Kumar, I. Gupta, J. Brandt, R. Kumar, A. K. Dikshit and R. S. Patil, Air quality mapping using GIS and economic evaluation of health impact for Mumbai City, India, Journal of the Air & Waste Management Association, 2016.
- IEA, IRENA, UNSD, WB, WHO. Tracking SDG 7: the energy Progress report 2019. Washington: International Bank for Reconstruction and Development, The World Bank, 2019.
- K. R. Smith, J. M. Samet, I. Romieu, N. Bruce, Indoor air pollution in developing countries and acute lower respiratory infections in children, Thorax, 2000.
- Global health risks: Mortality and burden of diseases attributable to selected major risks. Geneva, World Health Organization. 2014.
- Parajuli, I.; Lee, H.; Shrestha, K.R. Indoor Air Quality and ventilation assessment of rural mountainous households of Nepal. Int. J. Sustain. Built Environ. 2016, 5, 301–311. [Google Scholar] [CrossRef]
- Z. A. Wendling, J. W. Emerson, D. C. Esty, M. A. Levy, and A. Sherbinin, Environmental performance Index, New Haven: Yale Center for Environmental Law & Policy, 2018.
- Air quality guidelines for particulate matter, ozone, nitrogen dioxide and sulfur dioxide: global update 2005. Summary of risk assessment. Geneva, World Health Organization, 2005.
- Lewis, A.; Edwards, P. Validate personal air-pollution sensors. Nature 2016, 535, 29–31. [Google Scholar] [CrossRef] [PubMed]
- Sicard, P.; Lesne, O.; Alexandre, N.; Mangin, A.; Collomp, R. Air quality trends and potential health effects – Development of an aggregate risk index. Atmospheric Environ. 2011, 45, 1145–1153. [Google Scholar] [CrossRef]
- Elen, B.; Peters, J.; Van Poppel, M.; Bleux, N.; Theunis, J.; Reggente, M.; Standaert, A. The Aeroflex: A Bicycle for Mobile Air Quality Measurements. Sensors 2012, 13, 221–240. [Google Scholar] [CrossRef] [PubMed]
- G. Cannistraro, L. Ponterio, Analysis of Air Quality in the Outdoor Environment of the City of Messina by an Application of the Pollution Index Method, International Journal of Civil and Environment Engineering, 2009.
- A. Cincinelli, and T. Martellini, Indoor air quality and health, Int J Environ Res Pu, 2017.
- A Strategic Framework for Air Quality Management in Asia, G. Haq, and D. Schwela, Technical Report, January 2004.
- A Strategic Framework for Air Quality Management in Asia, G. Haq, and D. Schwela, Technical Report, January 2004.
- Clean Air Act Advisory Committee Meeting, L. Naess, OAQPS, January 2008.
- C. Vitolo, M. Scutari, M. Ghalaieny, A. Tucker,and A. Russell, Modeling Air Pollution, Climate, and Health Data Using Bayesian Networks: A Case Studyof the English Regions. Earth and Space Science, 2018.
- B. Sivertsen and A. Bartonov. Air Quality Management Planning (AMQP). Chemical Industry & Chemical Engineering Quarterly, 2012.
- S. Larssen, F. Gram, I. Haugsbakk, URBAIR. Urban air quality management strategy in Asia, Kathmandu Valley city specific report, NILU Kjeller, 1995.
- C. Dimitroulopoulou, M. Ashmore, M. Byrne, and R.P. Kinnersley, NDAIR: A probabilistic model of indoor air pollution in UK homes, Atmospheric Environment, 2006.
- S. Arungu-Olende, Rural energy, Nat Resour Forum, 1984.
- F. Karagulian, M. Gerboles, M. Barbiere, A. Kotsev, F. Lagler, and A. Borowiak, Review of sensors for air quality monitoring, Joint Research Centre (JRC) Technical Reports, 2019.
- M. Alexandre, and M. Gerboles, Review of small commercial sensors for indicative monitoring of ambient gas, Chemical Engineering Transactions, 2012.
- Castell, N.; Dauge, F.R.; Schneider, P.; Vogt, M.; Lerner, U.; Fishbain, B.; Broday, D.; Bartonova, A. Can commercial low-cost sensor platforms contribute to air quality monitoring and exposure estimates? Environ. Int. 2017, 99, 293–302. [Google Scholar] [CrossRef]
- D. L. Jiang, Environmental Gas Sensors 2020-2030, Technologies, Manufacturers, Forecasts, 2020.
- K. S. Yoo, Gas Sensors for Monitoring Air Pollution, Monitoring, Control and Effects of Air Pollution, 2011.
- C. M. Huang, Y. J. Liu, Y. J. Hsieh, W. L. Lai, C. Y. Juan, and S. Chen, A multi-gas sensing system for air quality monitoring, 2018 IEEE International Conference on Applied System Invention, 2018.
- Summary of air quality sensors and recommendations for application, iSCAPE - Improving the Smart Control of Air Pollution in Europe, C. Aakash, and P. Kumar, 2017.
- H. Kawasaki, T. Ueda, Y. Suda, and T. Ohshima, Optical Emission Spectroscopy of Low-Discharge-Power Magnetron Sputtering Plasmas Using Pure Tungsten Target, Sensors and Actuators B, 2004.
- D. L. West, F. C. Montgomery, and T. R. Armstrong, Development of NOx Sensors for Heavy Vehicle Applications, Sensors and Actuators B, 2005.
- Hodgkinson, J.; Tatam, R.P. Optical gas sensing: A review. Meas. Sci. Technol. 2013, 24, 012004. [Google Scholar] [CrossRef]
- E. Bakker, and M. Telting-Diaz, Electrochemical Sensors, Anal. Chem. 2004.
- Cretescu, I.; Lutic, D.; Manea, L.R. Electrochemical Sensors for Monitoring of Indoor and Outdoor Air Pollution. IntechOpen 2017. [Google Scholar] [CrossRef]
- Tierney, M.J.; Kim, H.O.L. Electrochemical gas sensor with extremely fast response times. Anal. Chem. 1993, 65, 3435–3440. [Google Scholar] [CrossRef]
- C. O. Park, J. W. Fergus, N. Miura, J. Park, and A. Choi, Solid-state electrochemical gas sensors, Ionics, 2009.
- Ishihara, T.; Matsubara, S. Capacitive Type Gas Sensors. J. Electroceramics 1998, 2, 215–228. [Google Scholar] [CrossRef]
- Schoeneberg, U.; Hosticka, B.; Zimmer, G.; Maclay, G. A novel readout technique for capacitive gas sensors. Sensors Actuators B: Chem. 1990, 1, 58–61. [Google Scholar] [CrossRef]
- Briand, D.; Colin, S.; Courbat, J.; Raible, S.; Kappler, J.; Derooij, N. Integration of MOX gas sensors on polyimide hotplates. Sensors Actuators B: Chem. 2008, 130, 430–435. [Google Scholar] [CrossRef]
- J. Amirola; A. Rodiguez, and L. Castaner, Design fabrication and test of micromachined-silicon capacitive gas sensors with integrated readout, Proceedings Smart Sensors, Actuators, and MEMS, 2003. [CrossRef]
- J. Oberländer, P. Kirchner, H. Gerd, B. Michael, and J. Schöning, Detection of hydrogen peroxide vapor by use of manganese (IV) oxide as catalyst for calorimetric gas sensors, Physica Status Solidi (A) Applications and Materials, 2014.
- Riegel, J.; Härdtl, K. Analysis of combustible gases in air with calorimetric gas sensors based on semiconducting BaTiO3 ceramics. Sensors Actuators B: Chem. 1990, 1, 54–57. [Google Scholar] [CrossRef]
- Kirchner, P.; Oberländer, J.; Friedrich, P.; Berger, J.; Rysstad, G.; Keusgen, M.; Schöning, M.J. Realisation of a calorimetric gas sensor on polyimide foil for applications in aseptic food industry. Sensors Actuators B: Chem. 2012, 170, 60–66. [Google Scholar] [CrossRef]
- Serry, M.; Voiculcscu, I.; Kobtan, A. Catalytic Hafnium Oxide Calorimetric MEMS Gas and Chemical Sensor. IEEE Sensors 2018, 1–4. [Google Scholar] [CrossRef]
- Wang, Y.W.; Ao, C.Y.; Hui, Z.P.; Yan, X.; Hu, Z.; Chang, Y.; Qu, H.M.; Duan, X.X.; Pang, W. Film bulk acoustic resonator based gas sensor: A sensitive detector for gas chromatography, Transducers. 2017. [Google Scholar] [CrossRef]
- W. Reichl, J. Runck, M. Schreiter, E. Green, and R. Gabl, Novel Gas Sensors Based on Thin Film Bulk Acoustic Resonators, IEEE Sensors, 2004. [CrossRef]
- Barie, N.; Skrypnik, A.; Voigt, A.; Rapp, M.; Marcoll, J. Work Place Monitoring using a High Sensitive Surface Acoustic Wave Based Sensor System. Transducers 2007, 1003–1006. [Google Scholar] [CrossRef]
- Liu, X.; Wang, W.; Zhang, Y.; Pan, Y.; Liang, Y.; Li, J. Enhanced Sensitivity of a Hydrogen Sulfide Sensor Based on Surface Acoustic Waves at Room Temperature. Sensors 2018, 18, 3796. [Google Scholar] [CrossRef]
- Spannhake, J.; Helwig, A.; Schulz, O.; Müller, G. Micro-Fabrication of Gas Sensors. Solid State Gas Sensing 2008, 1–46. [Google Scholar] [CrossRef]
- Nazemi, H.; Joseph, A.; Park, J.; Emadi, A. Advanced Micro- and Nano-Gas Sensor Technology: A Review. Sensors 2019, 19, 1285. [Google Scholar] [CrossRef]
- P. Kakoty, and M. Bhuyan, Fabrication of Micromachined SnO2 Based MOS Gas Sensor with Inbuilt Microheater for Detection of Methanol, Sens. Transducers, 2016.
- Liu, T.; Burger, C.; Chu, B. Nanofabrication in polymer matrices. Prog. Polym. Sci. 2003, 28, 5–26. [Google Scholar] [CrossRef]
- Park, K.K.; Lee, H.; Kupnik, M.; Khuri-Yakub, B.T. Fabrication of Capacitive Micromachined Ultrasonic Transducers via Local Oxidation and Direct Wafer Bonding. J. Microelectromechanical Syst. 2011, 20, 95–103. [Google Scholar] [CrossRef]
- Hung, V.N.; Abe, T.; Minh, P.N.; Esashi, M. High-frequency one-chip multichannel quartz crystal microbalance fabricated by deep RIE. Sensors Actuators A: Phys. 2003, 108, 91–96. [Google Scholar] [CrossRef]
- Bochenkov, V.; Sergeev, G. Preparation and chemiresistive properties of nanostructured materials. Adv. Colloid Interface Sci. 2005, 116, 245–254. [Google Scholar] [CrossRef]
- A. Ghoorchian, N. Alizadeh, Chemiresistor gas sensor based on sulfonated dye-doped modified conducting polypyrole film for high sensitive detection of 2, 4, 6-trinitrotoluene in air, Sens. Actuators B Chem, 2018.
- Y. T. Hsueh, R. L. Smith, and M. A. Northrup, Microfabricated, Electrochemi-iluminescence Cell for the Detection of Amplified DNA, Transducers, 1995.
- Lakin, K.; Kline, G.; McCarron, K. High-Q microwave acoustic resonators and filters. IEEE Trans. Microw. Theory Tech. 1993, 41, 2139–2146. [Google Scholar] [CrossRef]
- Ergun, A.S.; Huang, Y.; Zhuang, X.; Oralkan, Ö.; Yaralıoglu, G.G.; Khuri-Yakub, B.T. Capacitive Micromachined Ultrasonic Transducers: Fabrication Technology. IEEE Trans. Ultrason. Ferroelectr. Freq. Control 2005, 52, 2242–2258. [Google Scholar] [CrossRef]
- Lee, H.J.; Park, K.K.; Kupnik, M.; Khuri-Yakub, B.T. Functionalization layers for CO2 sensing using capacitive micromachined ultrasonic transducers. Sensors Actuators B: Chem. 2012, 174, 87–93. [Google Scholar] [CrossRef]
- Ergun, A.S.; Yaralioglu, G.G.; Khuri-Yakub, B.T. Capacitive Micromachined Ultrasonic Transducers: Theory and Technology. J. Aerosp. Eng. 2003, 16, 76–84. [Google Scholar] [CrossRef]
- Gerardo, C.D.; Cretu, E.; Rohling, R. Fabrication and testing of polymer-based capacitive micromachined ultrasound transducers for medical imaging. Microsystems Nanoeng. 2018, 4, 1–12. [Google Scholar] [CrossRef]
- Lee, H.J.; Park, K.K.; Kupnik, M.; Oralkan, Ö.; Khuri-Yakub, B.T. Highly sensitive detection of DMMP using a CMUT-based chemical sensor. In Proceedings of the IEEE Sensors, Waikoloa, HI, USA, 1–4 November 2010; pp. 2122–2126. [Google Scholar]
- A. Emadi, and D. Buchanan, Capacitive Micromachined Ultrasonic Transducer with Multiple Deflectable Membranes, U.S. Patent 9,925,561, 27 March 2018.
- Park, K.K.; Lee, H.; Kupnik, M.; Khuri-Yakub, B.T. Fabrication of Capacitive Micromachined Ultrasonic Transducers via Local Oxidation and Direct Wafer Bonding. J. Microelectromechanical Syst. 2011, 20, 95–103. [Google Scholar] [CrossRef]
- Microhotplates for Metal Oxide Semiconductor Gas Sensor Applications—Towards the CMOS-MEMS Monolithic Approach. Haotian Liu, Li Zhang, King Ho Holden Li, and Ooi Kiang Tan.
- M. Graf, A Gurlo, N. Barsan, U. Weimar, A. Hierlemann, Microfabricated gas sensor systems with sensitive nanocrystalline metal-oxide films, J. Nanoparticle Res. 2006. [CrossRef]
- Afridi, M.; Suehle, J.; Zaghloul, M.; Berning, D.; Hefner, A.; Cavicchi, R.; Semancik, S.; Montgomery, C.; Taylor, C. A monolithic CMOS microhotplate-based gas sensor system. IEEE Sensors J. 2002, 2, 644–655. [Google Scholar] [CrossRef]
- M. Graf, A. Gurlo, N. Barsan, U. Weimar, and A. Hierlemann, Micro-fabricated gas sensor systems with sensitive nanocrystalline metal-oxide films, J. Nanoparticle Res., 2006.
- Jiang, Y.; Tang, N.; Zhou, C.; Han, Z.; Qu, H.; Duan, X. A chemiresistive sensor array from conductive polymer nanowires fabricated by nanoscale soft lithography. Nanoscale 2018, 10, 20578–20586. [Google Scholar] [CrossRef] [PubMed]
- Jian, Y.; Hu, W.; Zhao, Z.; Cheng, P.; Haick, H.; Yao, M.; Wu, W. Gas Sensors Based on Chemi-Resistive Hybrid Functional Nanomaterials. Nano-Micro Lett. 2020, 12, 1–43. [Google Scholar] [CrossRef] [PubMed]
- Park, S.Y.; Kim, Y.; Kim, T.; Eom, T.H.; Kim, S.Y.; Jang, H.W. Chemoresistive materials for electronic nose: Progress, perspectives, and challenges. InfoMat 2019, 1, 289–316. [Google Scholar] [CrossRef]
- Qu, H.; Duan, X. Recent advances in micro detectors for micro gas chromatography. Sci. China Mater. 2019, 62, 611–623. [Google Scholar] [CrossRef]
- Li, Z.; Xue, Q.; Wang, Q.; Zhang, H.; Duan, X. Biomolecules Detection Using Microstrip Sensor with Highly-ordered Nanowires Array. IEEE Sens. J. 2019, 1–4. [Google Scholar] [CrossRef]
- Hwang, S.; Kwon, H.; Chhajed, S.; Byon, J.W.; Baik, J.M.; Im, J.; Oh, S.H.; Jang, H.W.; Yoon, S.J.; Kim, J.K. A near single crystalline TiO2nanohelix array: enhanced gas sensing performance and its application as a monolithically integrated electronic nose. Anal. 2012, 138, 443–450. [Google Scholar] [CrossRef]
- Z. Chen, Z. Chen, Z. Song, W. Ye, and Zh. Fan, Smart gas sensor arrays powered by artificial intelligence, Journal of Semiconductors, 2019.
- Ł. Guz et al., Application of Gas Sensor Arrays in Assessment of Wastewater Purification Effects, Sensors, 2014.
- Lipatov, A.; Varezhnikov, A.; Wilson, P.; Sysoev, V.; Kolmakov, A.; Sinitskii, A. Highly selective gas sensor arrays based on thermally reduced graphene oxide. Nanoscale 2013, 5, 5426–5434. [Google Scholar] [CrossRef] [PubMed]
- Macías, M.M.; Agudo, J.E.; Manso, A.G.; Orellana, C.J.G.; Velasco, H.M.G.; Caballero, R.G. A Compact and Low Cost Electronic Nose for Aroma Detection. Sensors 2013, 13, 5528–5541. [Google Scholar] [CrossRef] [PubMed]
- Shahid, A.; Choi, J.-H.; Rana, A.U.H.S.; Kim, H.-S. Least Squares Neural Network-Based Wireless E-Nose System Using an SnO2 Sensor Array. Sensors 2018, 18, 1446. [Google Scholar] [CrossRef]
- H. Mohammad et al., Room temperature multiplexed gas sensing using chemical-sensitive 3.5-nm-thin silicon transistors, Science Advances, 2017.
- https://pib.gov.in/NEWSITE/erelcontent.aspx?relid=123091 (accessed on 6 October 2020).
- Yan, J.; Tian, F.; Feng, J.; Jia, P.; He, Q.; Shen, Y. A PSO-SVM Method for Parameters and Sensor Array Optimization in Wound Infection Detection based on Electronic Nose. J. Comput. 2012, 7, 2663–2670. [Google Scholar] [CrossRef]
- Hung, C.M.; Le, D.T.T.; Van Hieu, N. On-chip growth of semiconductor metal oxide nanowires for gas sensors: A review. J. Sci. Adv. Mater. Devices 2017, 2, 263–285. [Google Scholar] [CrossRef]
- https://www.globenewswire.com/news-release/2016/08/18/985749/0/en/SPEC-Sensors-Releases-Open-Source-Digital-Gas-Sensor-Developer-Kit-for-the-Internet-of-Things.html (accessed on 6 October 2020).
- C. Shekhar et al., Single Chip Gas Sensor Array for Air Quality Monitoring, IEEE Journal of Microelectromechanical Systems, 2017.
- Z. Y. Gang et al., An Innovative Gas Sensor with On-Chip Reference Using Monolithic Twin Laser, Chinese Physics Letters, 2017.
- Zhang, G.; Zhang, S.; Yang, L.; Zou, Z.; Zeng, D.; Xie, C. La2O3-sensitized SnO2 nanocrystalline porous film gas sensors and sensing mechanism toward formaldehyde. Sensors Actuators B: Chem. 2013, 188, 137–146. [Google Scholar] [CrossRef]
- Postolache, O.A.; Pereira, J.M.D.; Girao, P.M.B.S. Smart Sensors Network for Air Quality Monitoring Applications. IEEE Trans. Instrum. Meas. 2009, 58, 3253–3262. [Google Scholar] [CrossRef]
- Liu, X.; Cheng, S.; Liu, H.; Hu, S.; Zhang, D.; Ning, H. A Survey on Gas Sensing Technology. Sensors 2012, 12, 9635–9665. [Google Scholar] [CrossRef]
- Casey, J.G.; Hannigan, M.P. Testing the performance of field calibration techniques for low-cost gas sensors in new deployment locations: across a county line and across Colorado. Atmospheric Meas. Tech. 2018, 11, 6351–6378. [Google Scholar] [CrossRef]
- Leidinger, M.; Schultealbert, C.; Neu, J.; Schuetze, A.; Sauerwald, T. Characterization and calibration of gas sensor systems at ppb level—a versatile test gas generation system. Meas. Sci. Technol. 2017, 29, 015901. [Google Scholar] [CrossRef]
- Thong, L.V.; Loan, L.T.N.; Van Hieu, N. Comparative study of gas sensor performance of SnO2 nanowires and their hierarchical nanostructures. Sensors Actuators B: Chem. 2010, 150, 112–119. [Google Scholar] [CrossRef]
- Chen, Y.; Yu, J.; He, A.; Tang, Z.-A. A Method for Selecting Optimal Number of Sensors to Improve the Credibility. J. Sensors 2015, 2016, 1–9. [Google Scholar] [CrossRef]
- Fonollosa, J.; Rodríguez-Luján, I.; Huerta, R. Chemical gas sensor array dataset. Data Brief 2015, 3, 85–89. [Google Scholar] [CrossRef]
- A. Kumar et al., Fabrication of porous silicon filled Pd/SiC nanocauliflower thin films for high performance H2 gas sensor, Sensors and Actuators B, 2018.
- Benammar, M.A.; Ahmad, S.H.M.; Abdaoui, A.; Tariq, H.; Touati, F.; Al-Hitmi, M.; Crescini, D. A Smart Rig for Calibration of Gas Sensor Nodes. Sensors 2020, 20, 2341. [Google Scholar] [CrossRef]
- Maag, B.; Zhou, Z.; Thiele, L. A Survey on Sensor Calibration in Air Pollution Monitoring Deployments. IEEE Internet Things J. 2018, 5, 4857–4870. [Google Scholar] [CrossRef]
- Spinelle, L.; Gerboles, M.; Villani, M.G.; Aleixandre, M.; Bonavitacola, F. Field calibration of a cluster of low-cost available sensors for air quality monitoring. Part A: Ozone and nitrogen dioxide. Sensors Actuators B: Chem. 2015, 215, 249–257. [Google Scholar] [CrossRef]
- Mijling, B.; Jiang, Q.; de Jonge, D.; Bocconi, S. Field calibration of electrochemical NO2 sensors in a citizen science context. Atmospheric Meas. Tech. 2018, 11, 1297–1312. [Google Scholar] [CrossRef]
- Hagan, D.H.; Isaacman-VanWertz, G.; Franklin, J.P.; Wallace, L.M.M.; Kocar, B.D.; Heald, C.L.; Kroll, J.H. Calibration and assessment of electrochemical air quality sensors by co-location with regulatory-grade instruments. Atmospheric Meas. Tech. 2018, 11, 315–328. [Google Scholar] [CrossRef]
- D. Hasenfratz et al., On-the-fly calibration of low-cost gas sensors. 9th European Conference on Wireless Sensor Networks, pp. 228–244, 2012.
- Yang, F.; Geng, Z.; Koneru, A.; Zhi, M.; Li, H.; Wu, N. Dynamic Calibration of Electrochemical Sensor for Accelerated Analyte Quantification. IEEE Sensors J. 2012, 13, 1192–1199. [Google Scholar] [CrossRef]
- Tian, B. et al., Environment-Adaptive Calibration System for Outdoor Low-Cost Electrochemical Gas Sensors, IEEE Access, 2019.
- U. Asghar et al., Development of Highly Efficient Multi-invariable Wireless Sensor System Design for Energy Harvesting, arXiv:1802.05755, 2018.
- H. Luo et al., Design of indoor air quality monitoring system based on wireless sensor network, International Wireless Communications & Mobile Computing Conference, 2019.
- Al-Ali, A.R.; Zualkernan, I.; Aloul, F. A Mobile GPRS-Sensors Array for Air Pollution Monitoring. IEEE Sensors J. 2010, 10, 1666–1671. [Google Scholar] [CrossRef]
- Penza, M.; Suriano, D.; Pfister, V.; Prato, M.; Cassano, G. Urban Air Quality Monitoring with Networked Low-Cost Sensor-Systems. Eurosensors 2017, 1, 573. [Google Scholar] [CrossRef]
- F. Touati et al., Environmentally Powered Multiparametric Wireless Sensor Node for Air Quality Diagnostic, Sensors and Materials, 2015.
Figure 1.
A Chronological Walkthrough of Air Quality Gas Sensors, Methods and Systems [1-177].
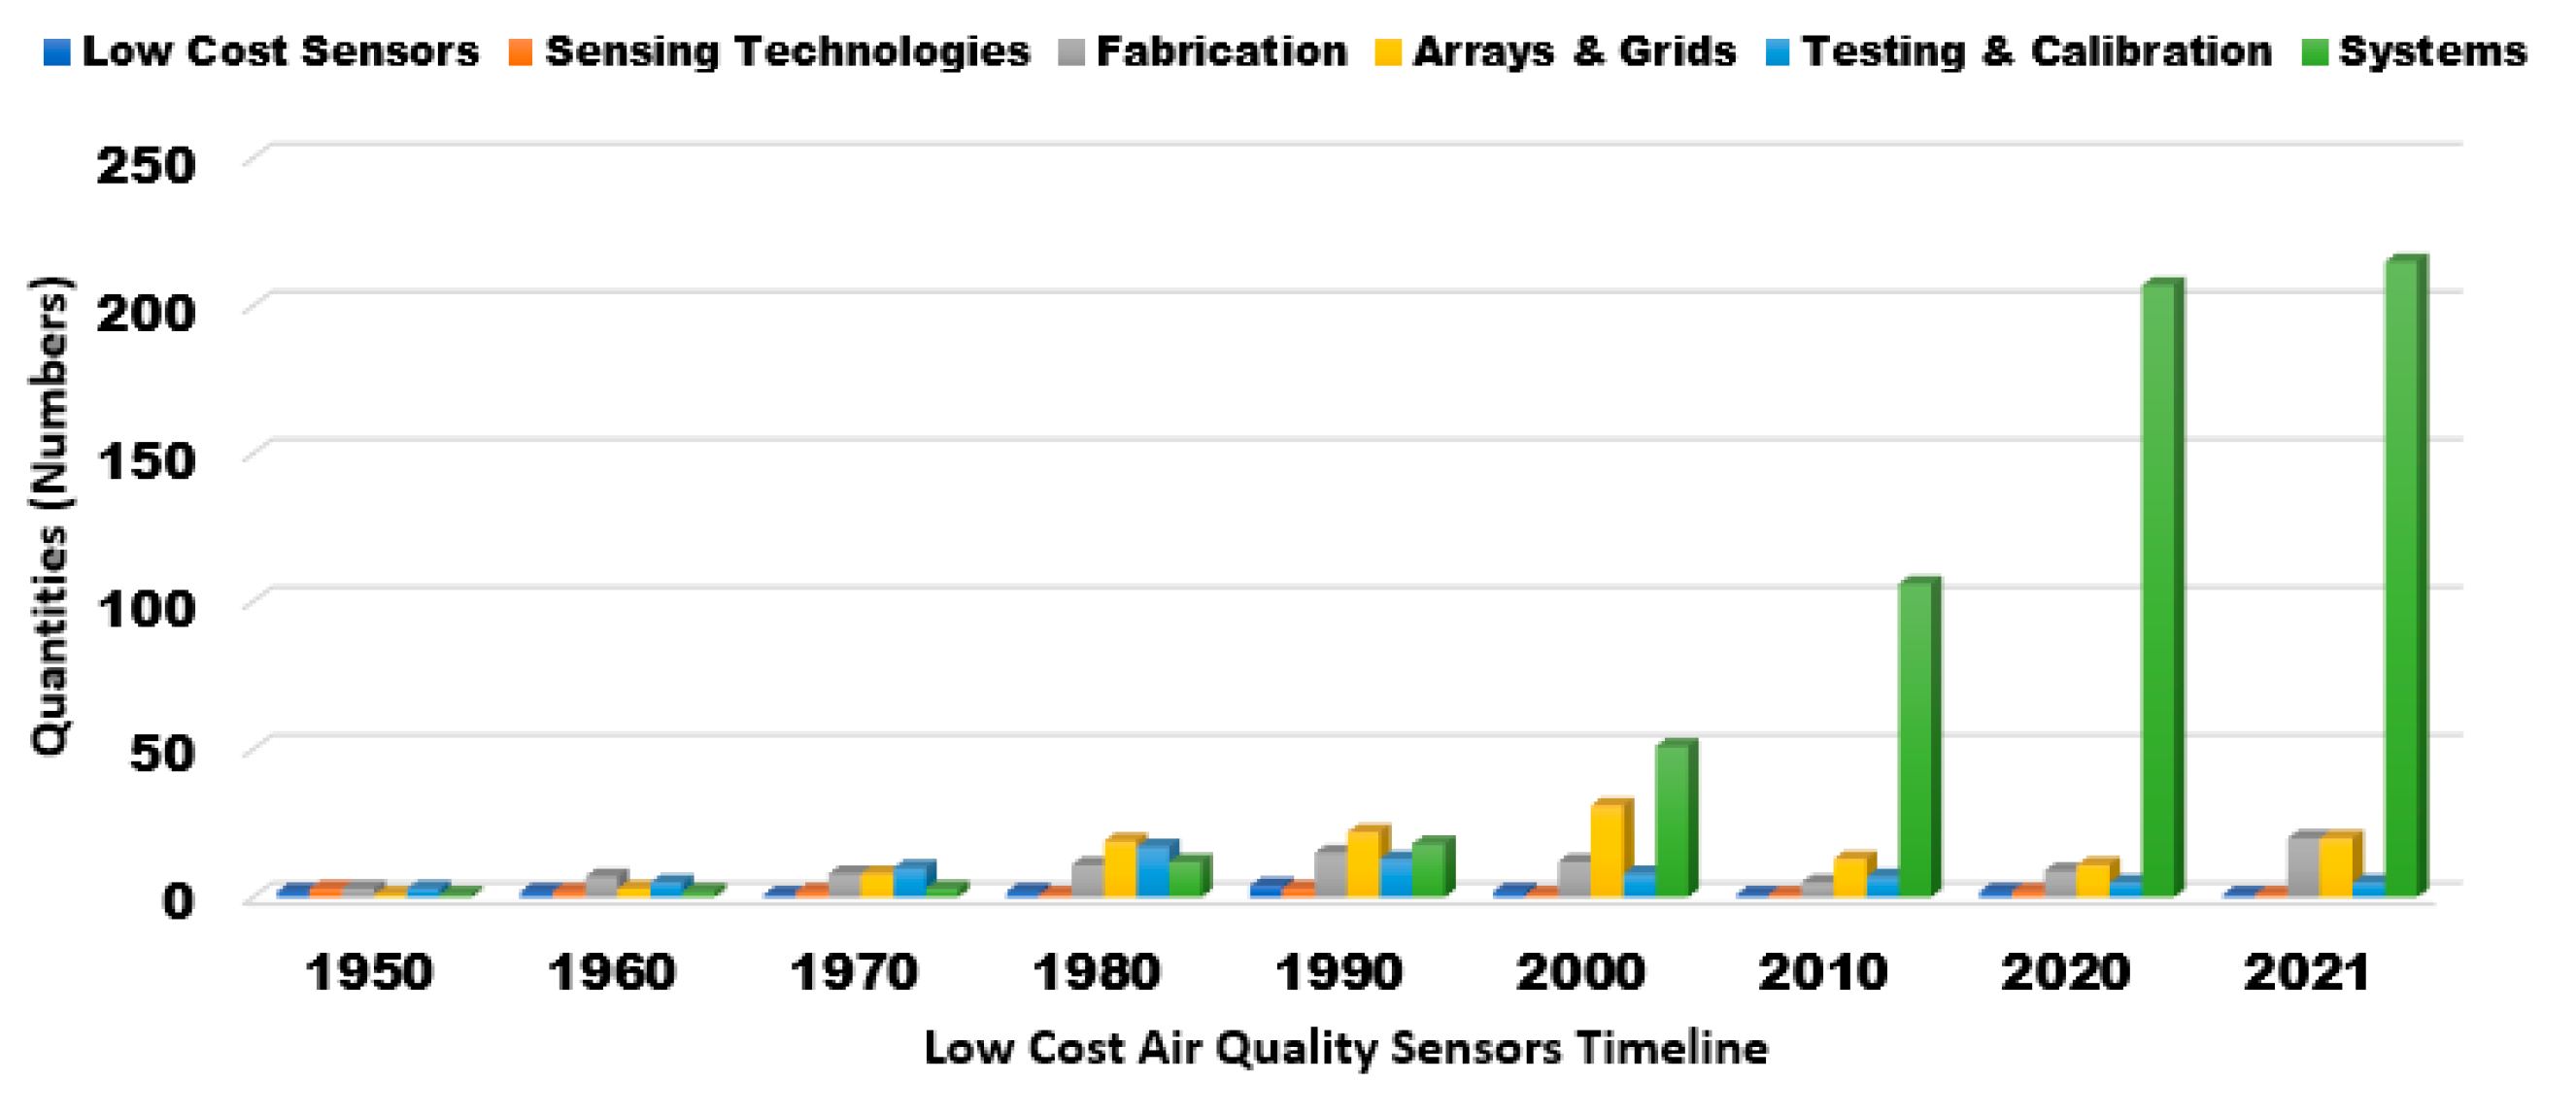
Figure 2.
A Practical Hierarchy of Air Quality Assessment, Sensors, Configurations, Fabrication, Calibration, and Evaluation Methods [1-178].
Figure 2.
A Practical Hierarchy of Air Quality Assessment, Sensors, Configurations, Fabrication, Calibration, and Evaluation Methods [1-178].
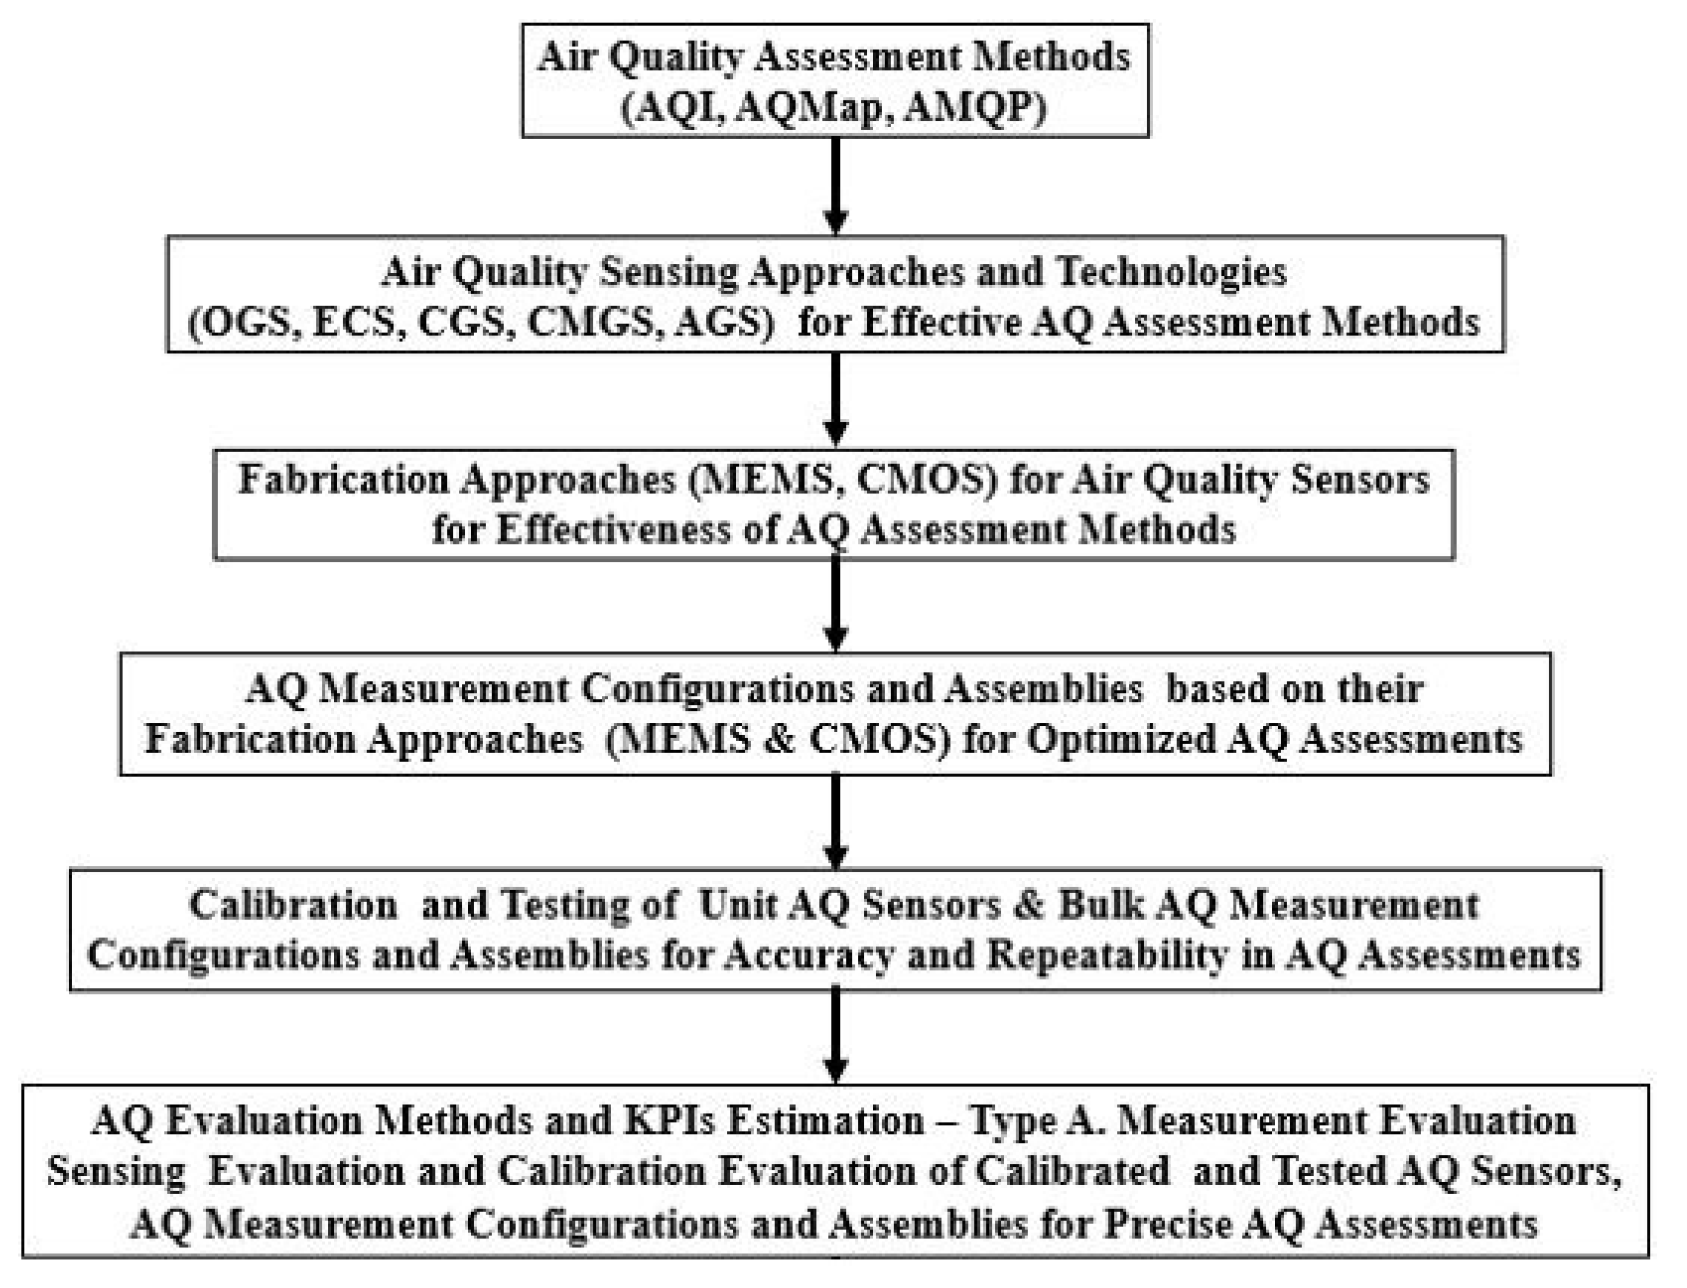
Figure 3.
AQI Charts by EEA and US EPAs [21,22,23,24,25,26,27] (a) CAQI EEA AQI Cumulative State Chart (b) US EPA AQI Cumulative State Chart.
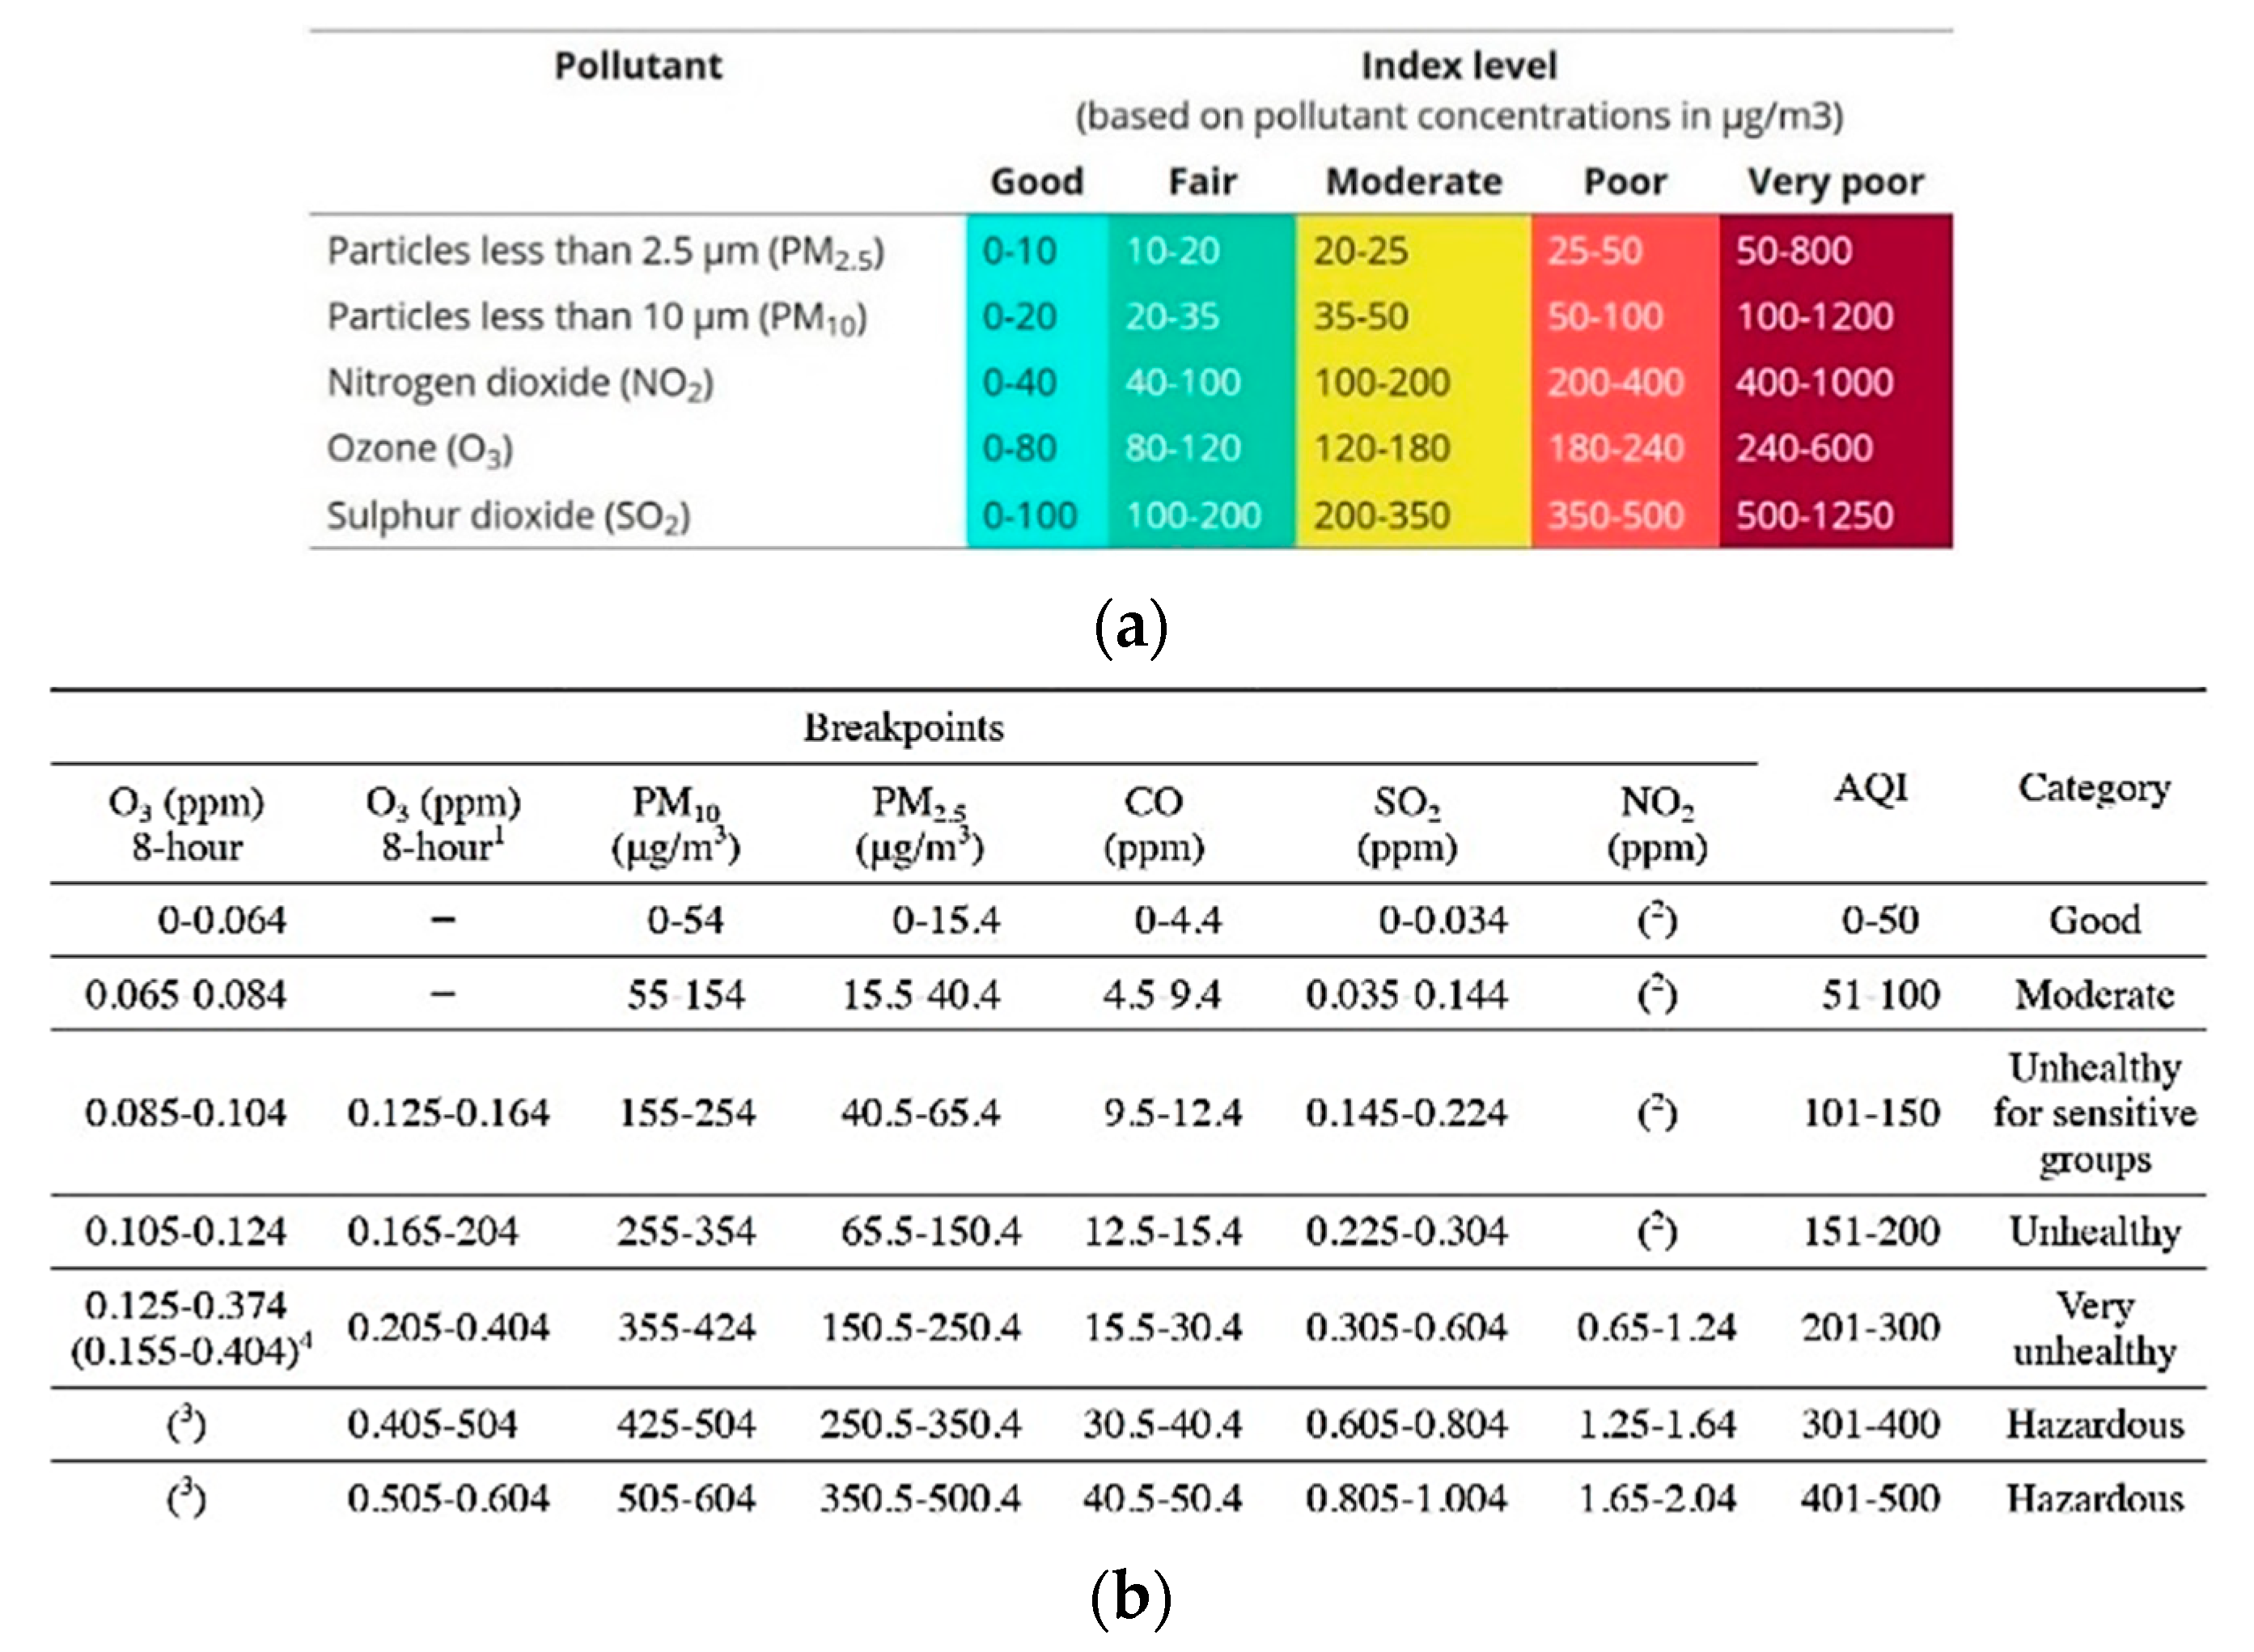
Figure 4.
Two fundamental approaches in AQM24−33. (a) Indoor Air Quality Mapping. (b) Outdoor Air Quality Mapping.
Figure 4.
Two fundamental approaches in AQM24−33. (a) Indoor Air Quality Mapping. (b) Outdoor Air Quality Mapping.
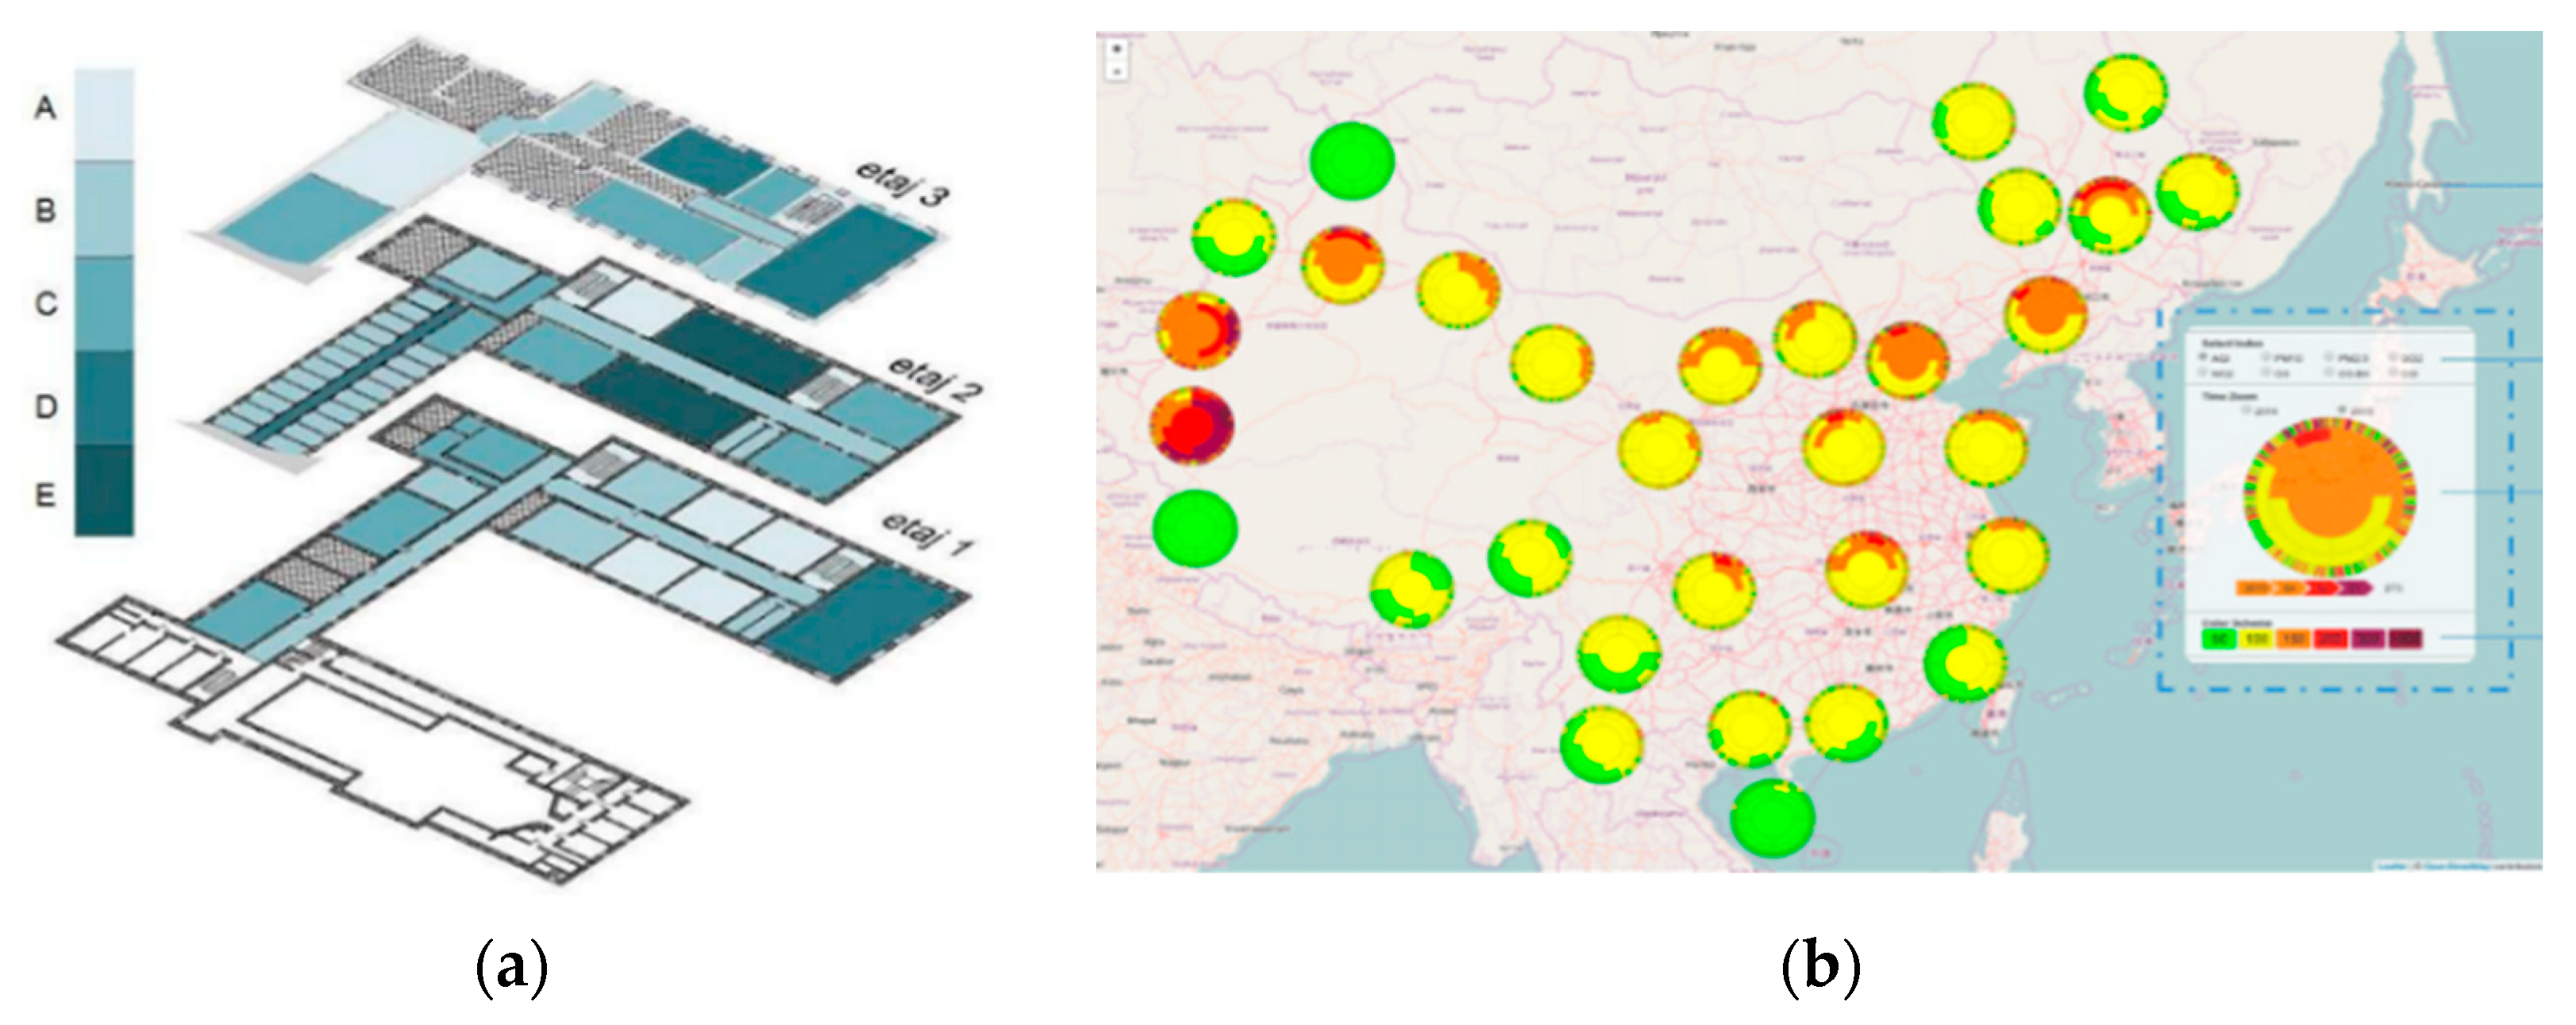
Figure 6.
Five Primitive Approaches in AQ Gas Sensors Technologies [44].
Figure 6.
Five Primitive Approaches in AQ Gas Sensors Technologies [44].
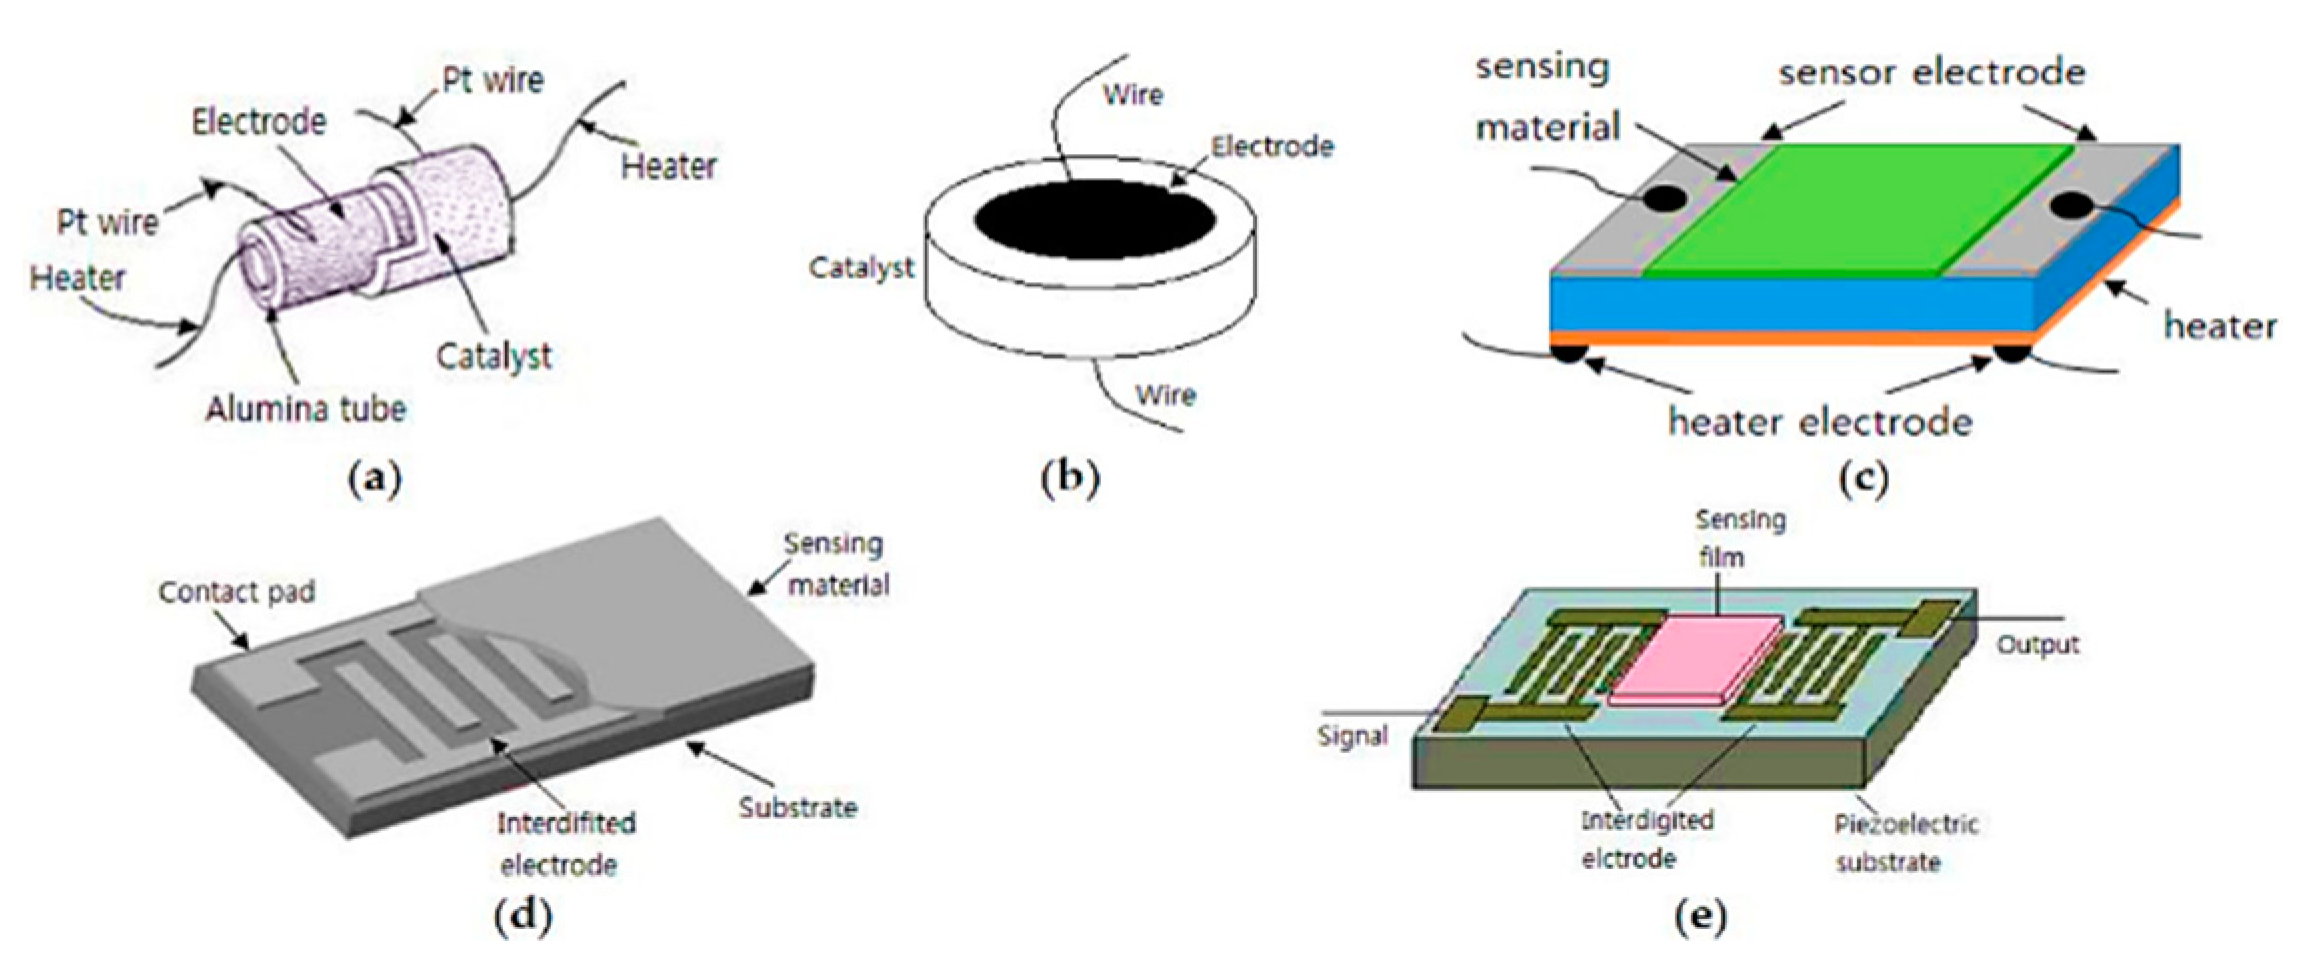
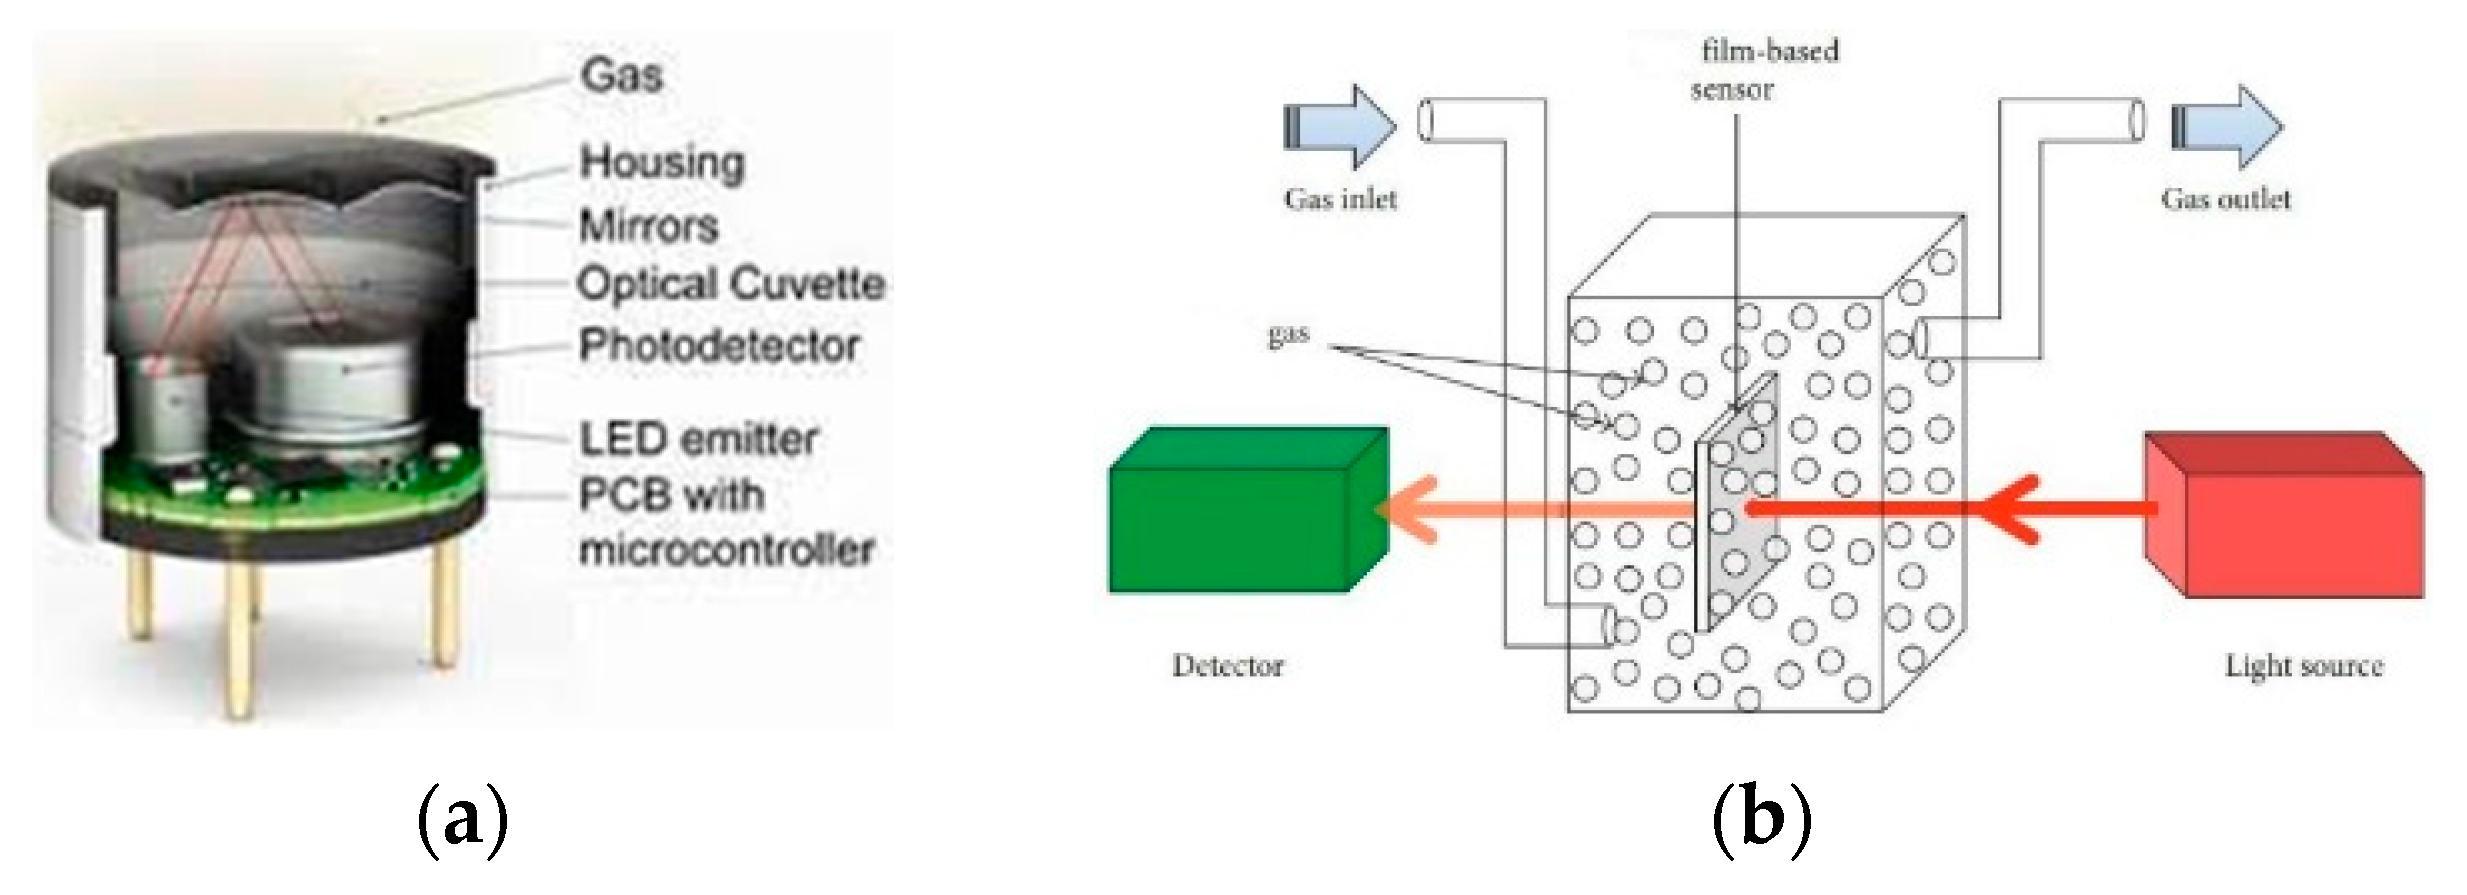
Figure 8.
Overview of NDIR-GS [51] (a) Architecture. (b) Working Principle.
Figure 8.
Overview of NDIR-GS [51] (a) Architecture. (b) Working Principle.
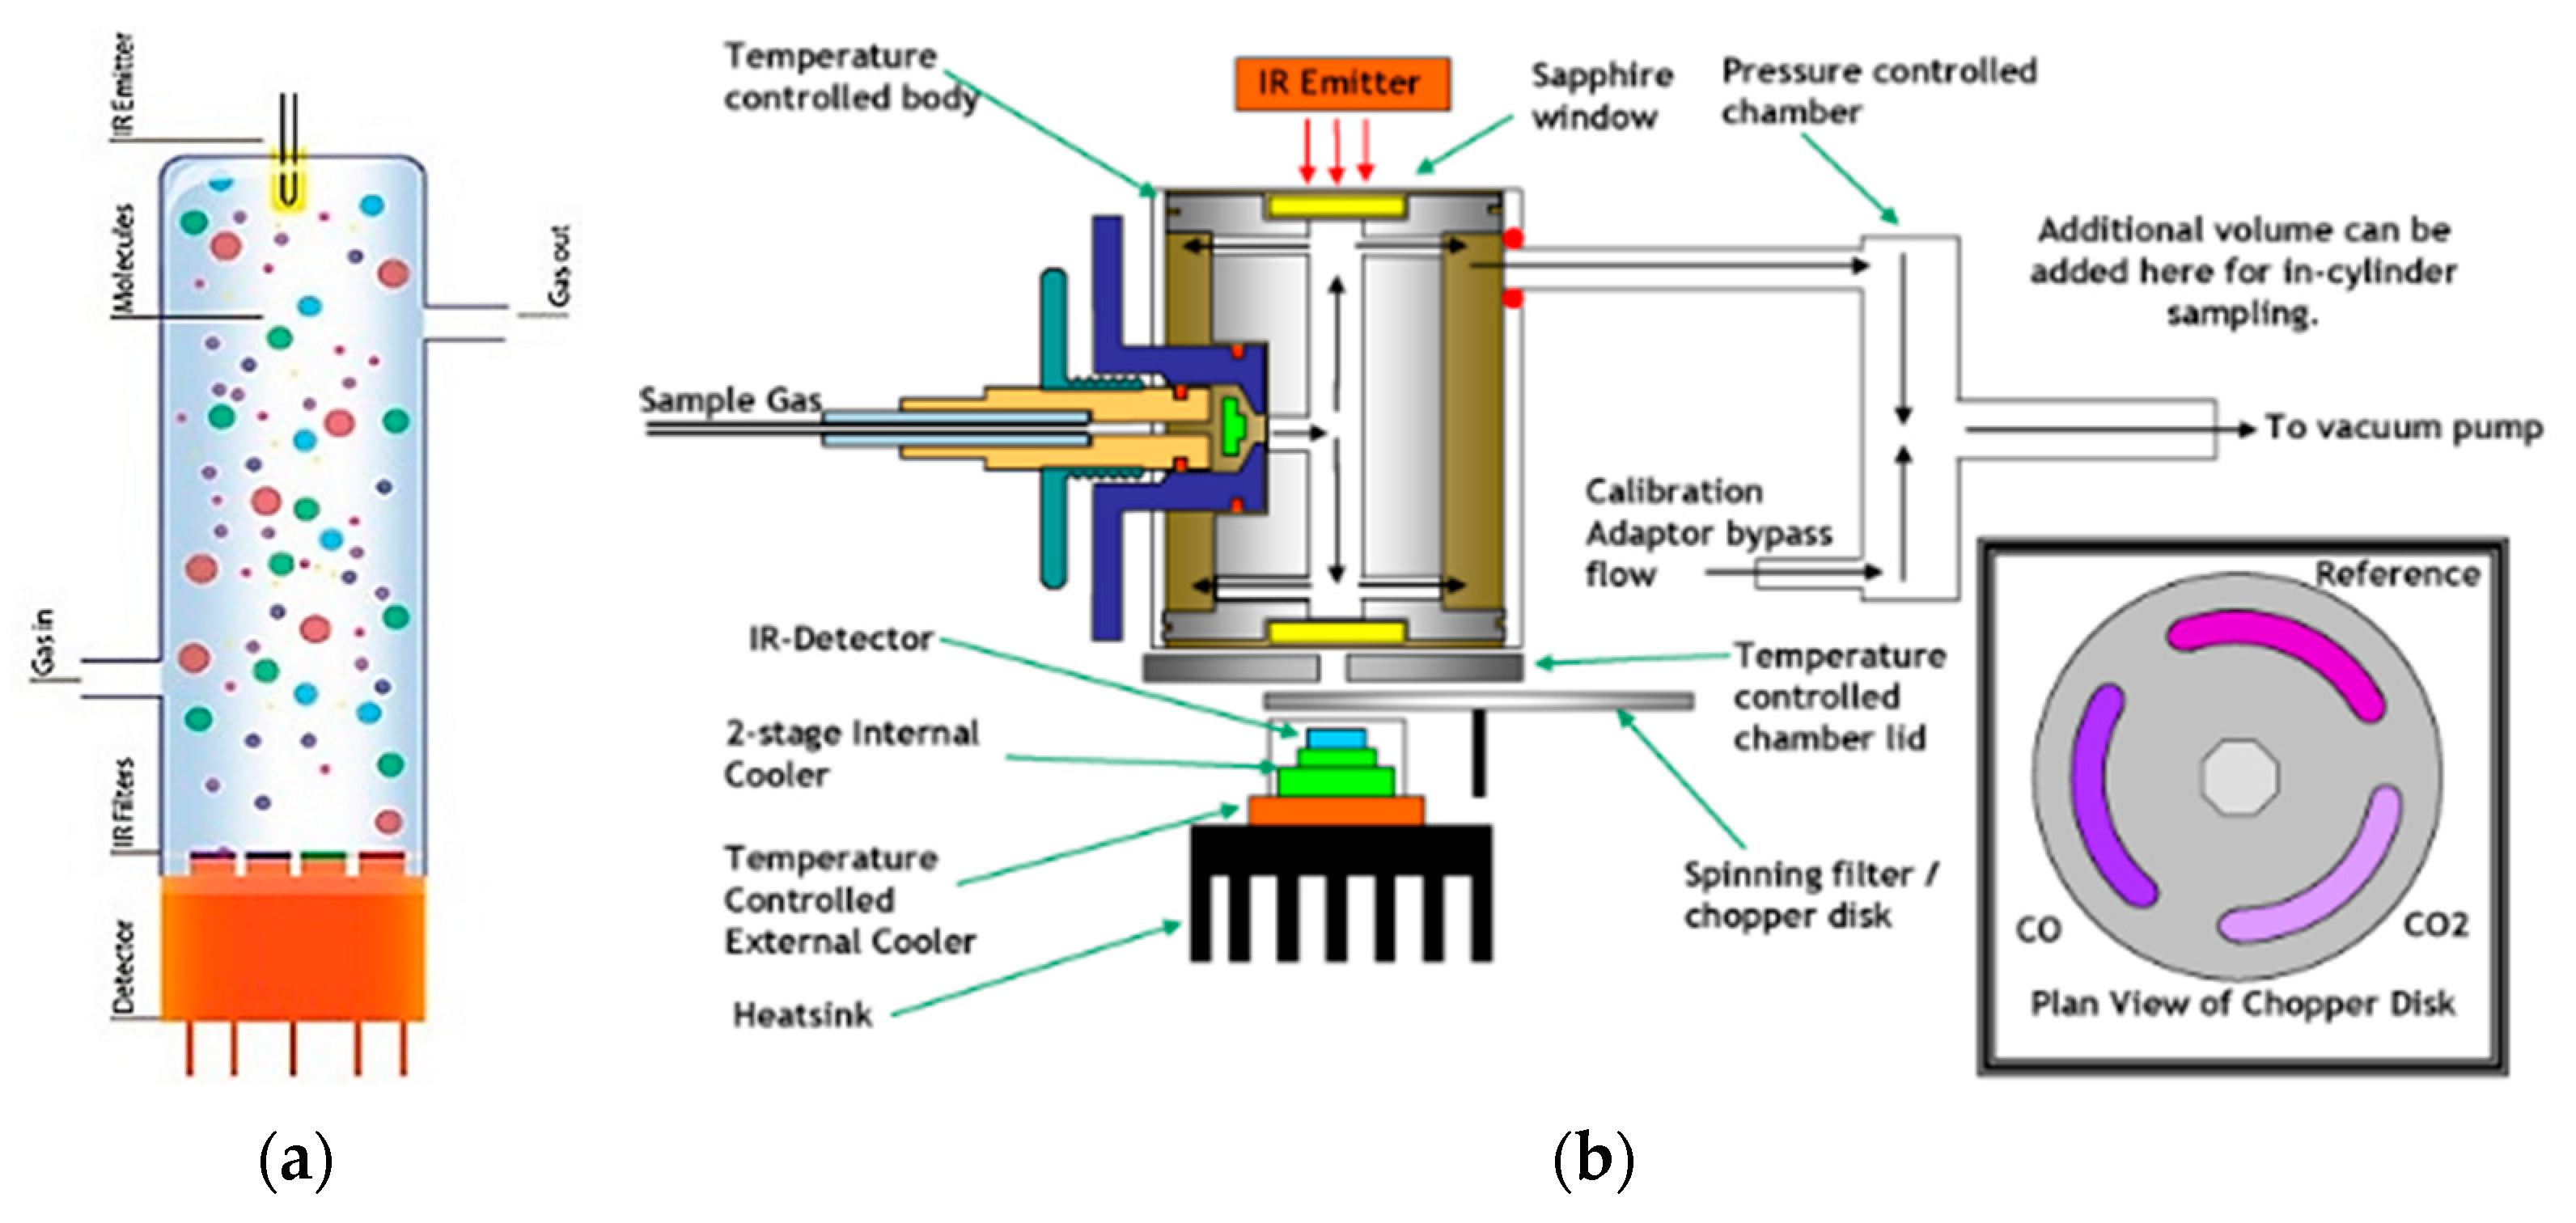
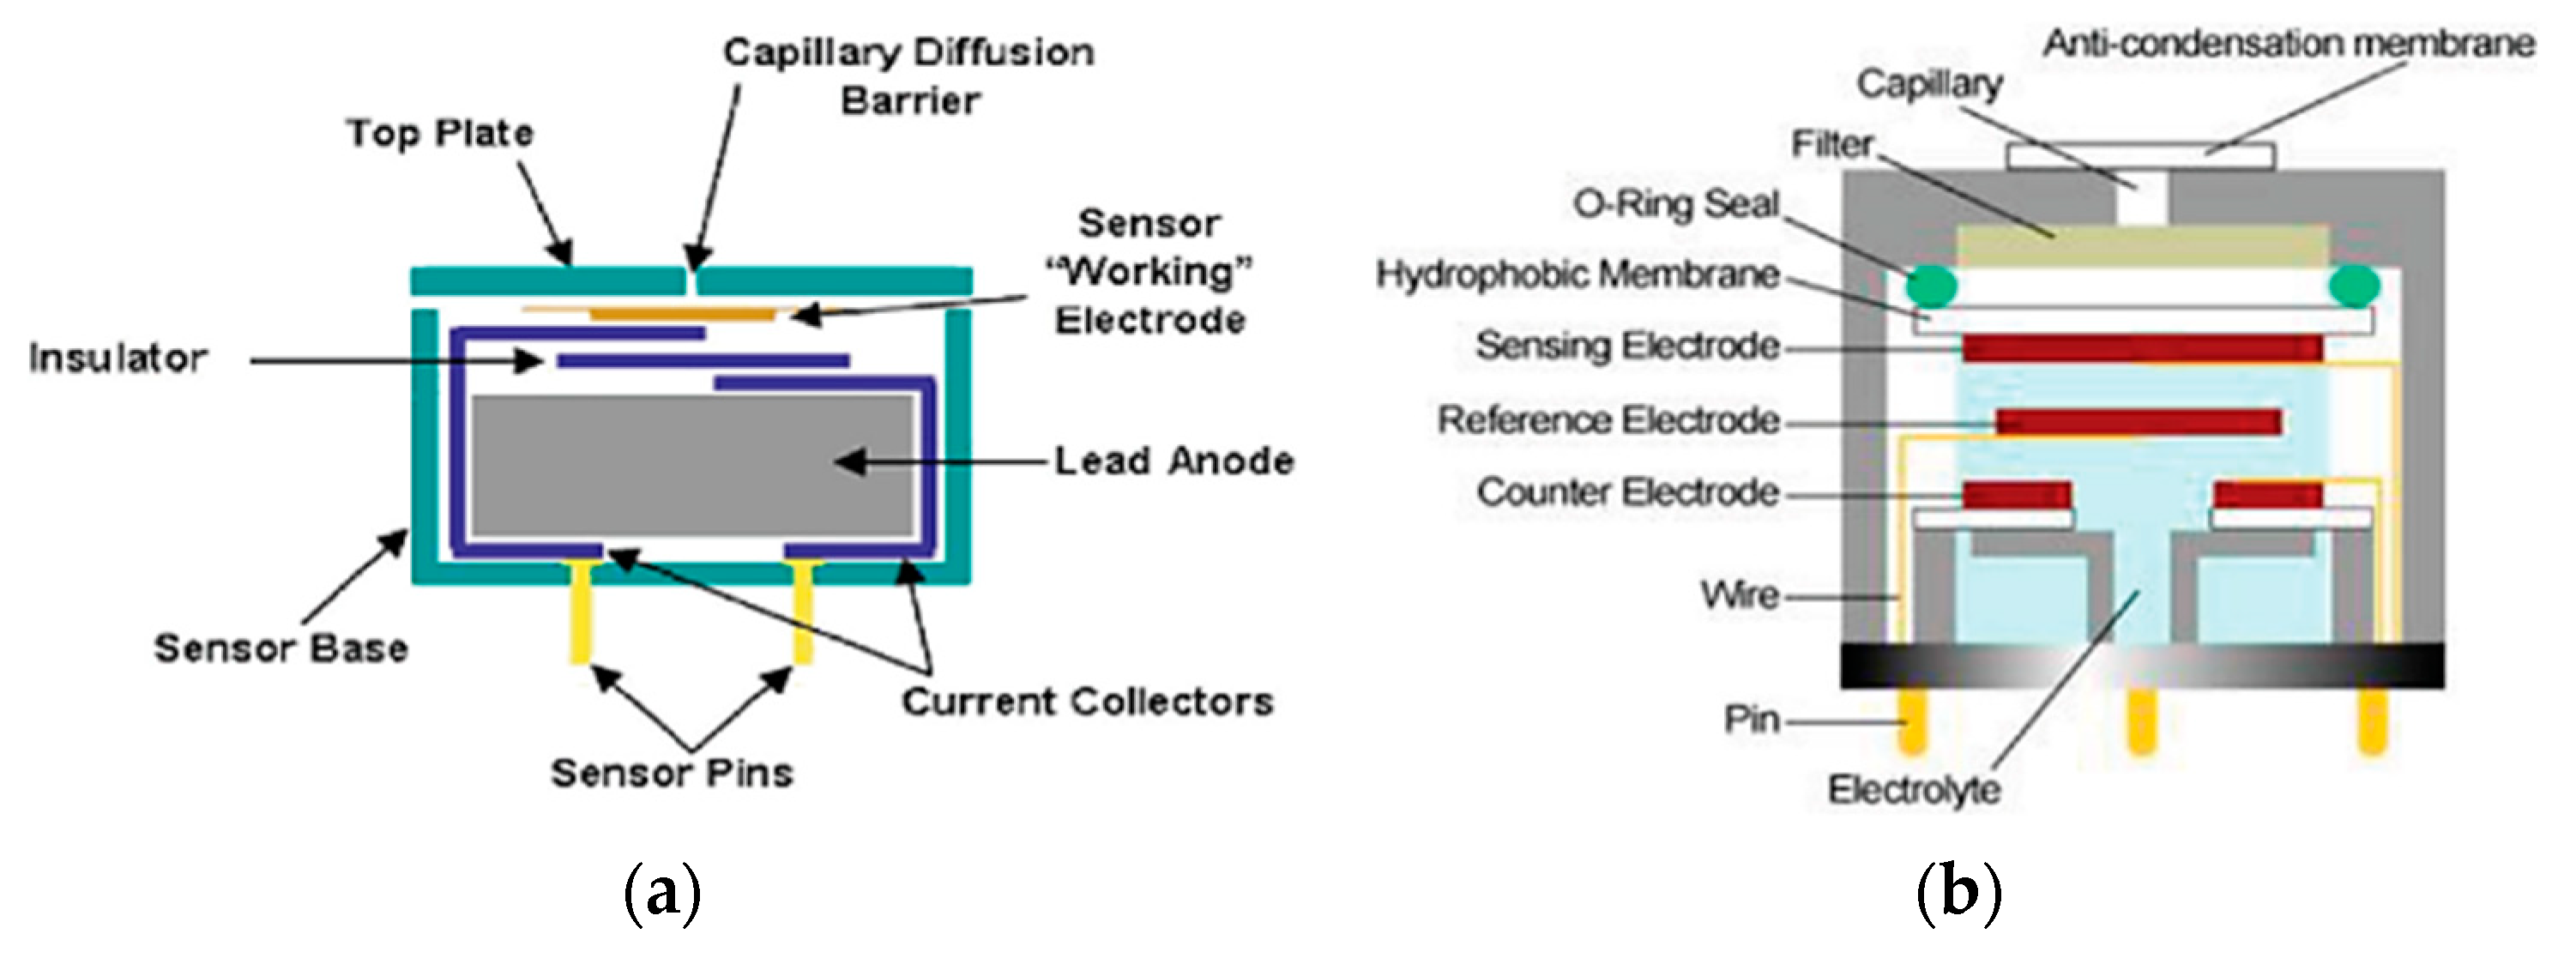
Figure 10.
Overview of CGS [58]. (A) Architecture. (B) Working Principle.
Figure 10.
Overview of CGS [58]. (A) Architecture. (B) Working Principle.
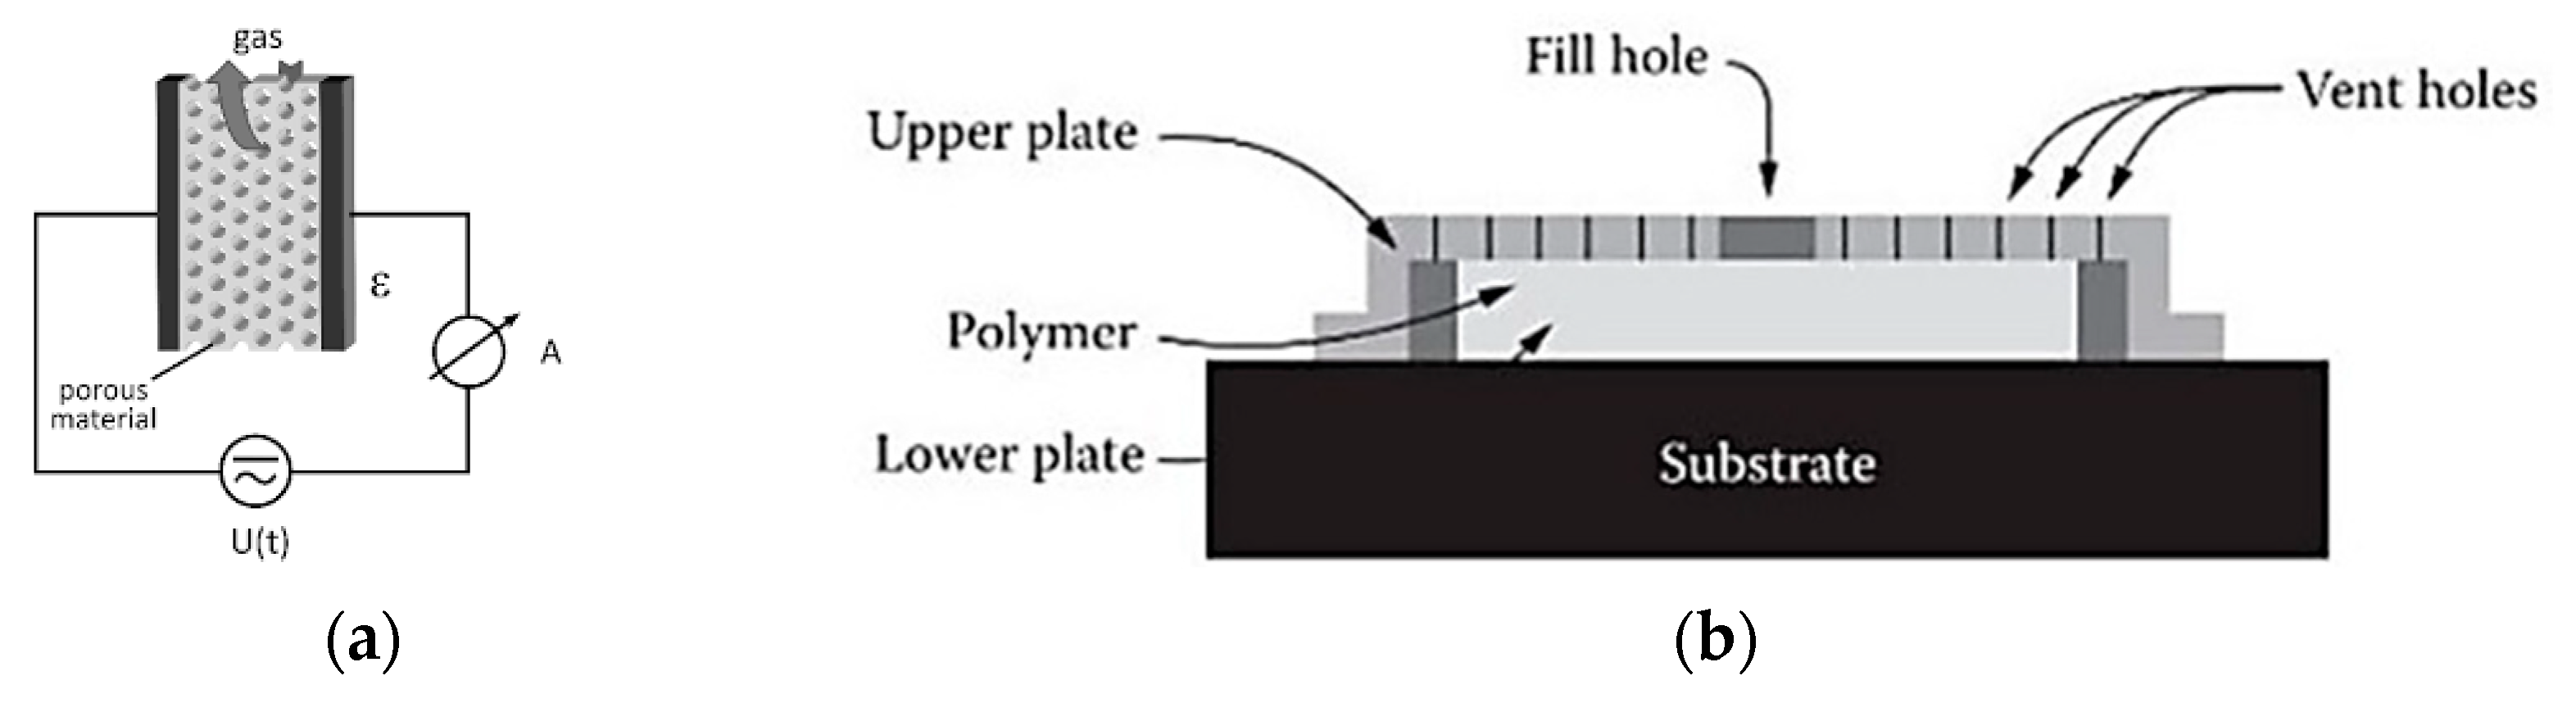
Figure 12.
Overview of CGS [58]. (A) Architecture. (B) Working Principle.
Figure 12.
Overview of CGS [58]. (A) Architecture. (B) Working Principle.
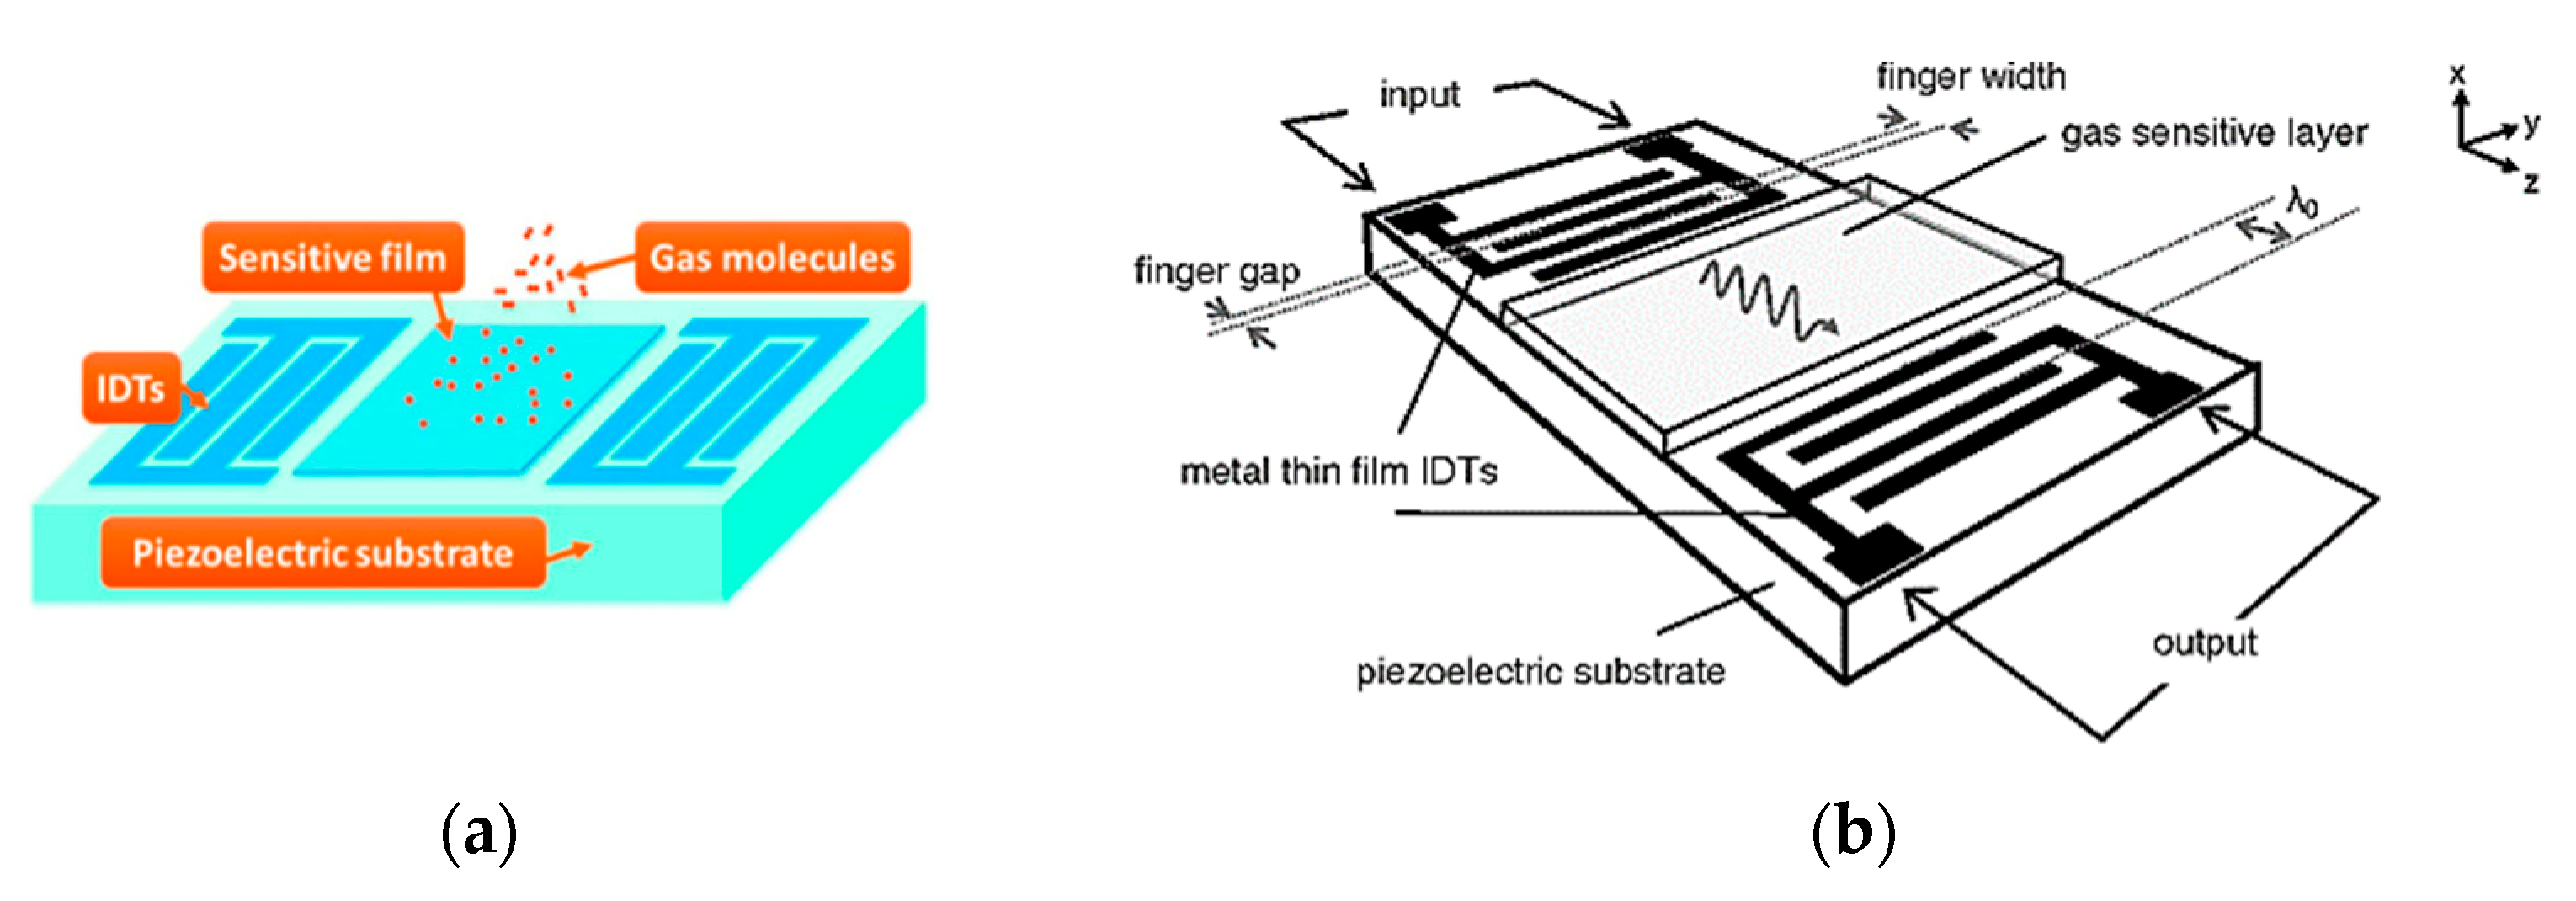
Figure 13.
The Fifteen Step MEMS Fabrication Process for GSs [75]
Figure 13.
The Fifteen Step MEMS Fabrication Process for GSs [75]
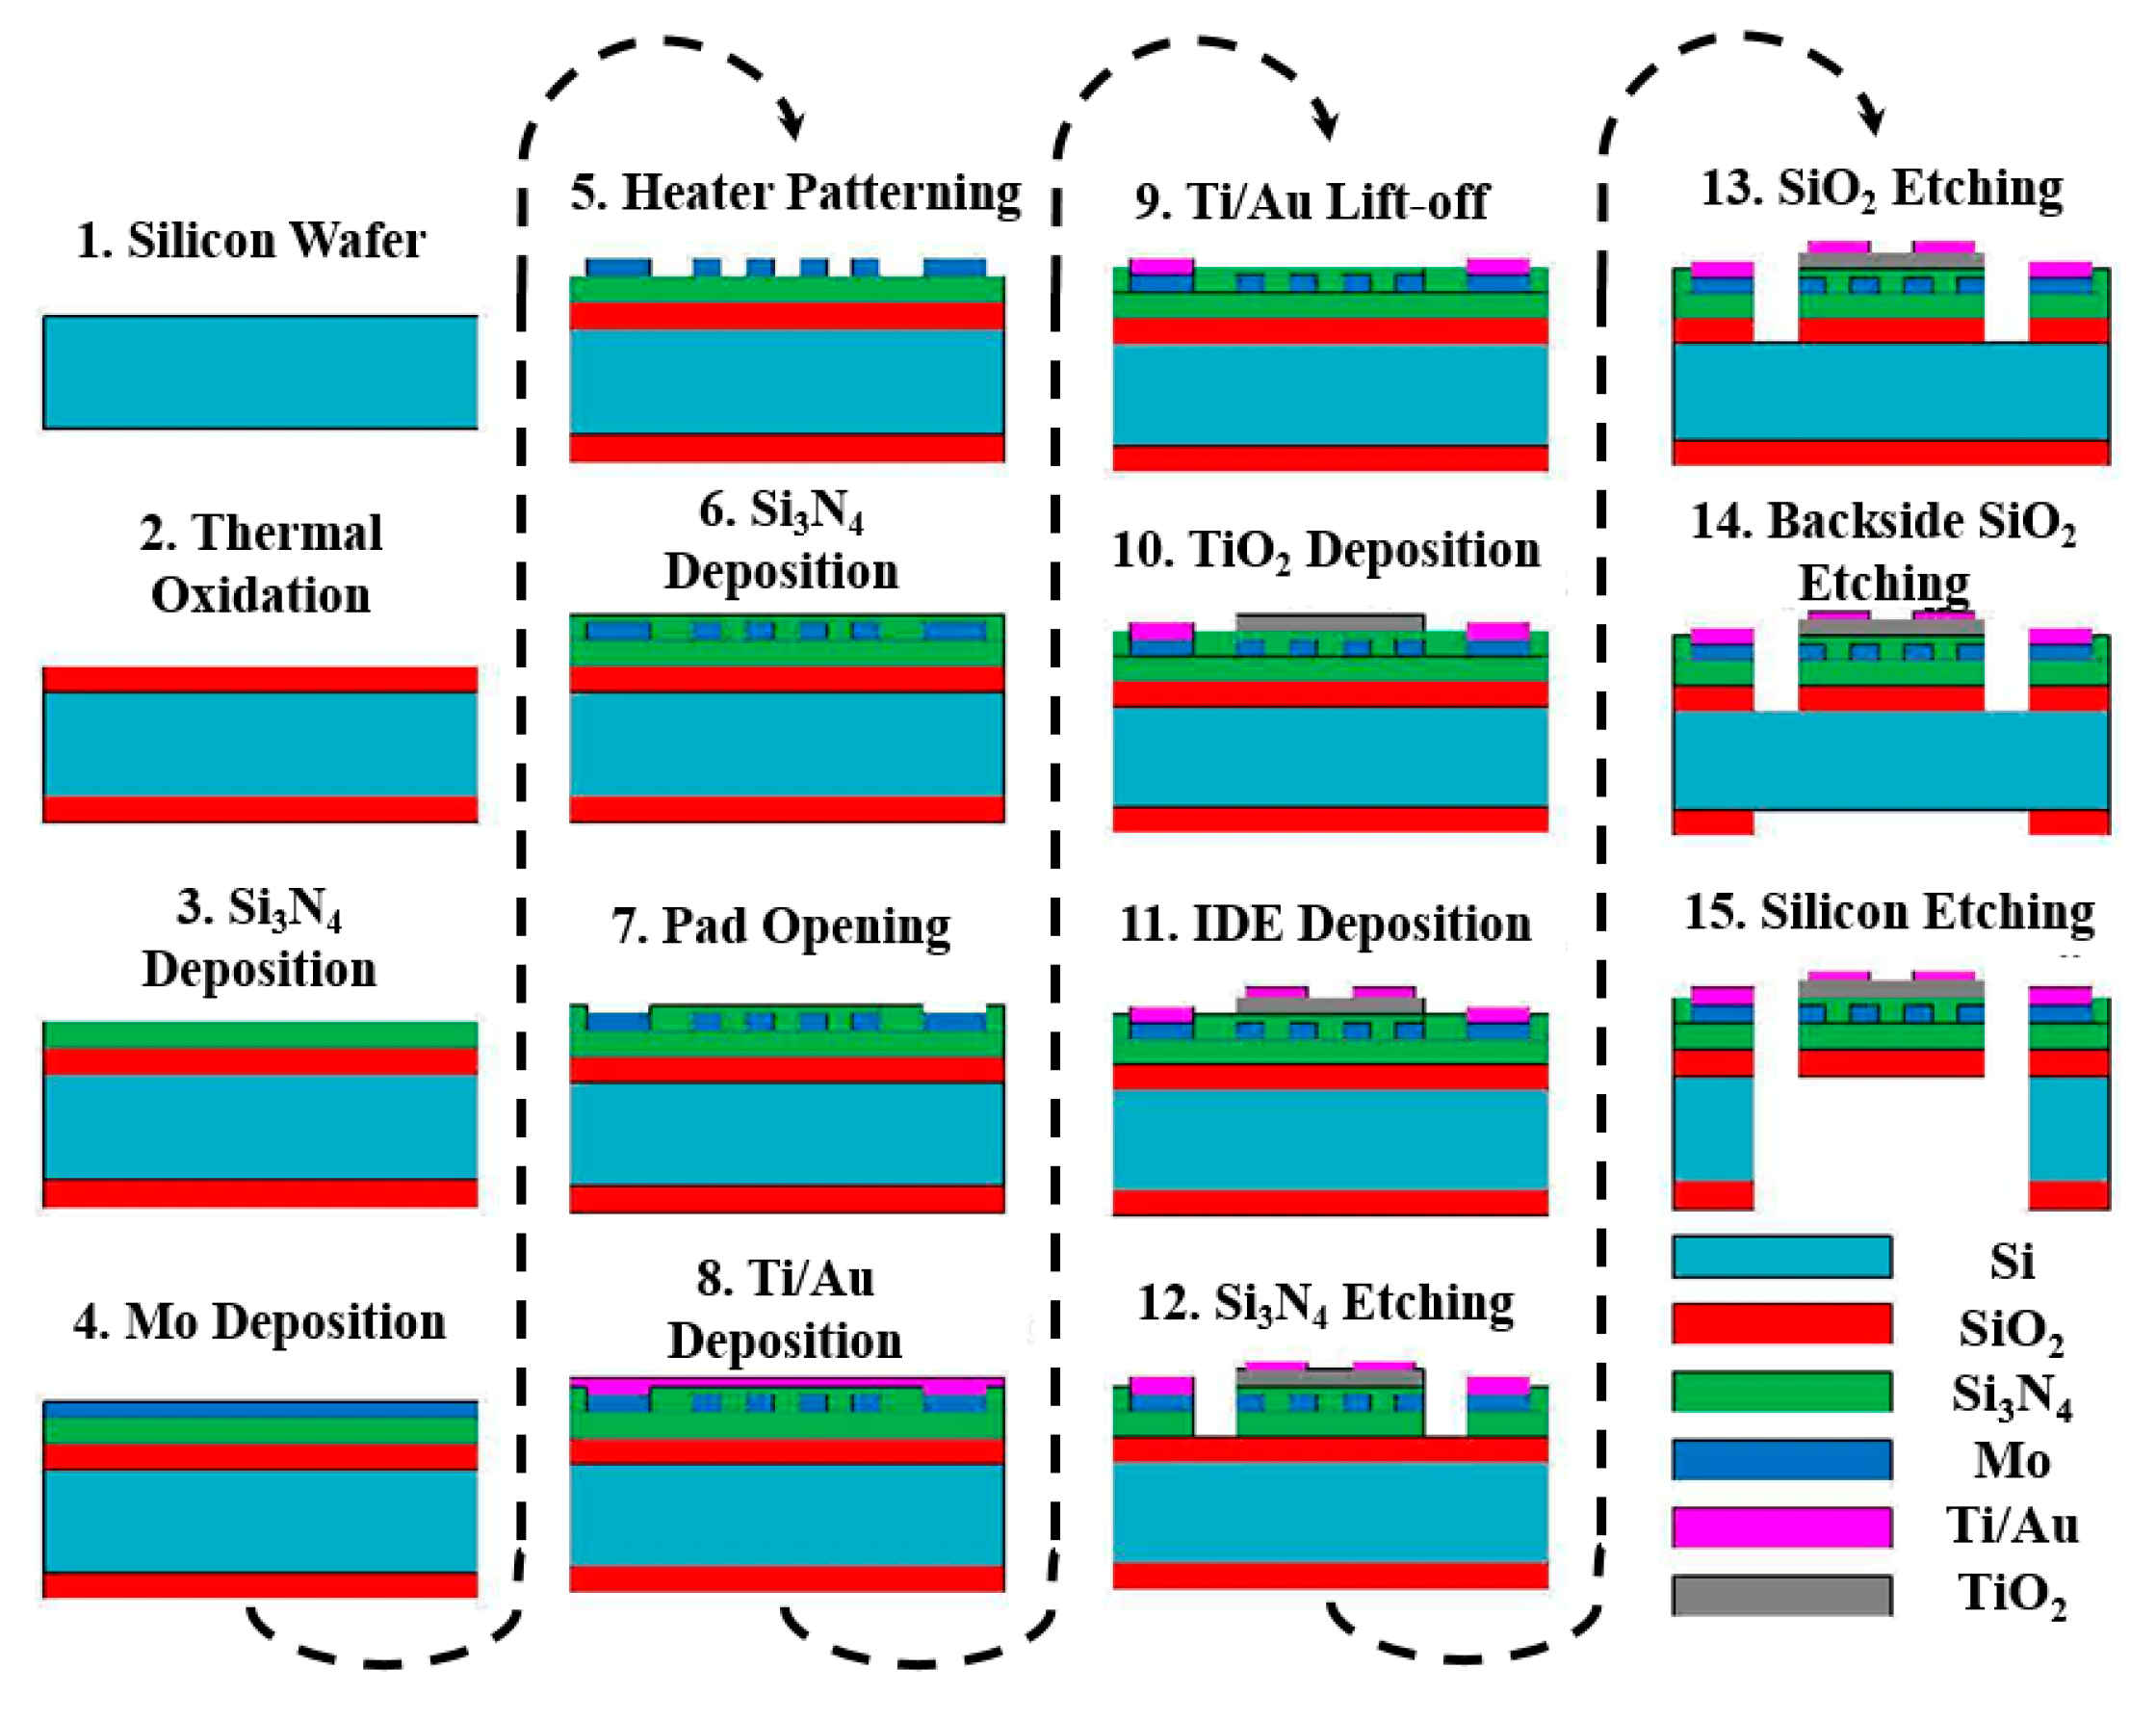
Figure 14.
Two Six-Step Electro-chemical gas sensors (ECS) fabrication by MEMS Fabrication Approaches [75,76,77,78,79] (A) RIE Method [74,75]. (B) Au Electrodes [76,77,78,79].
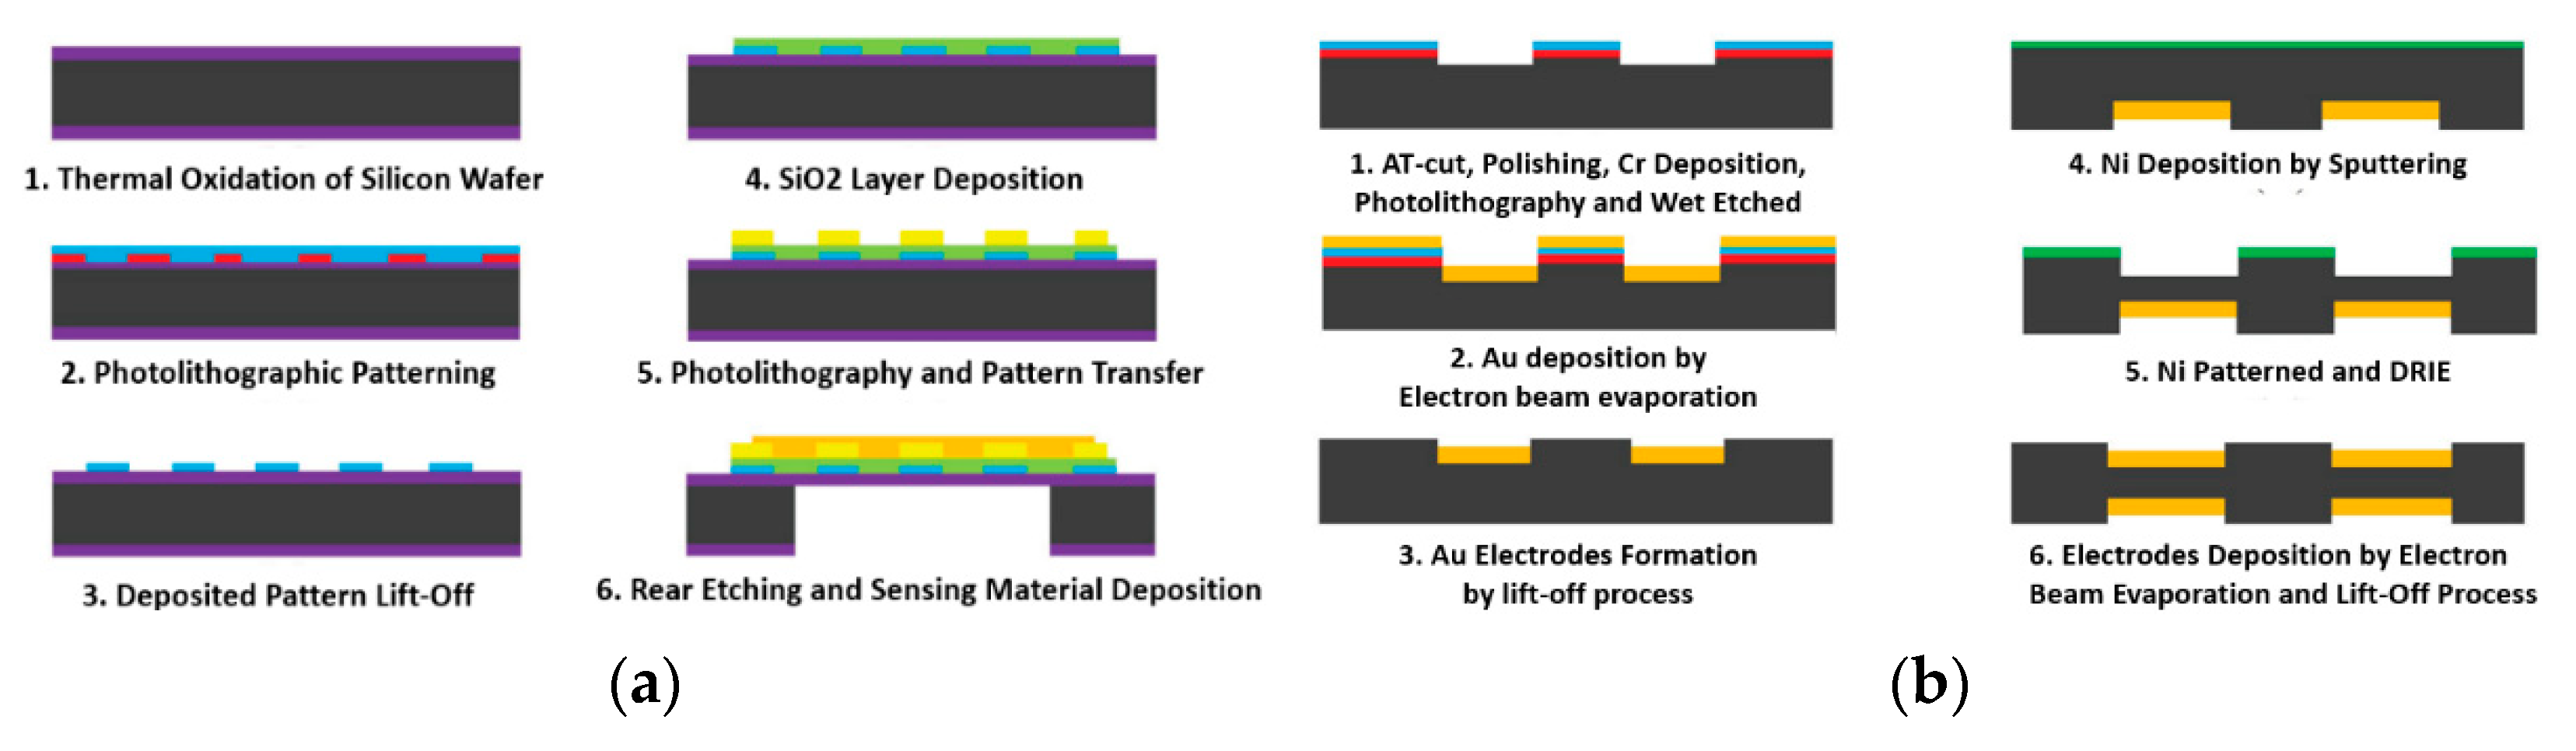
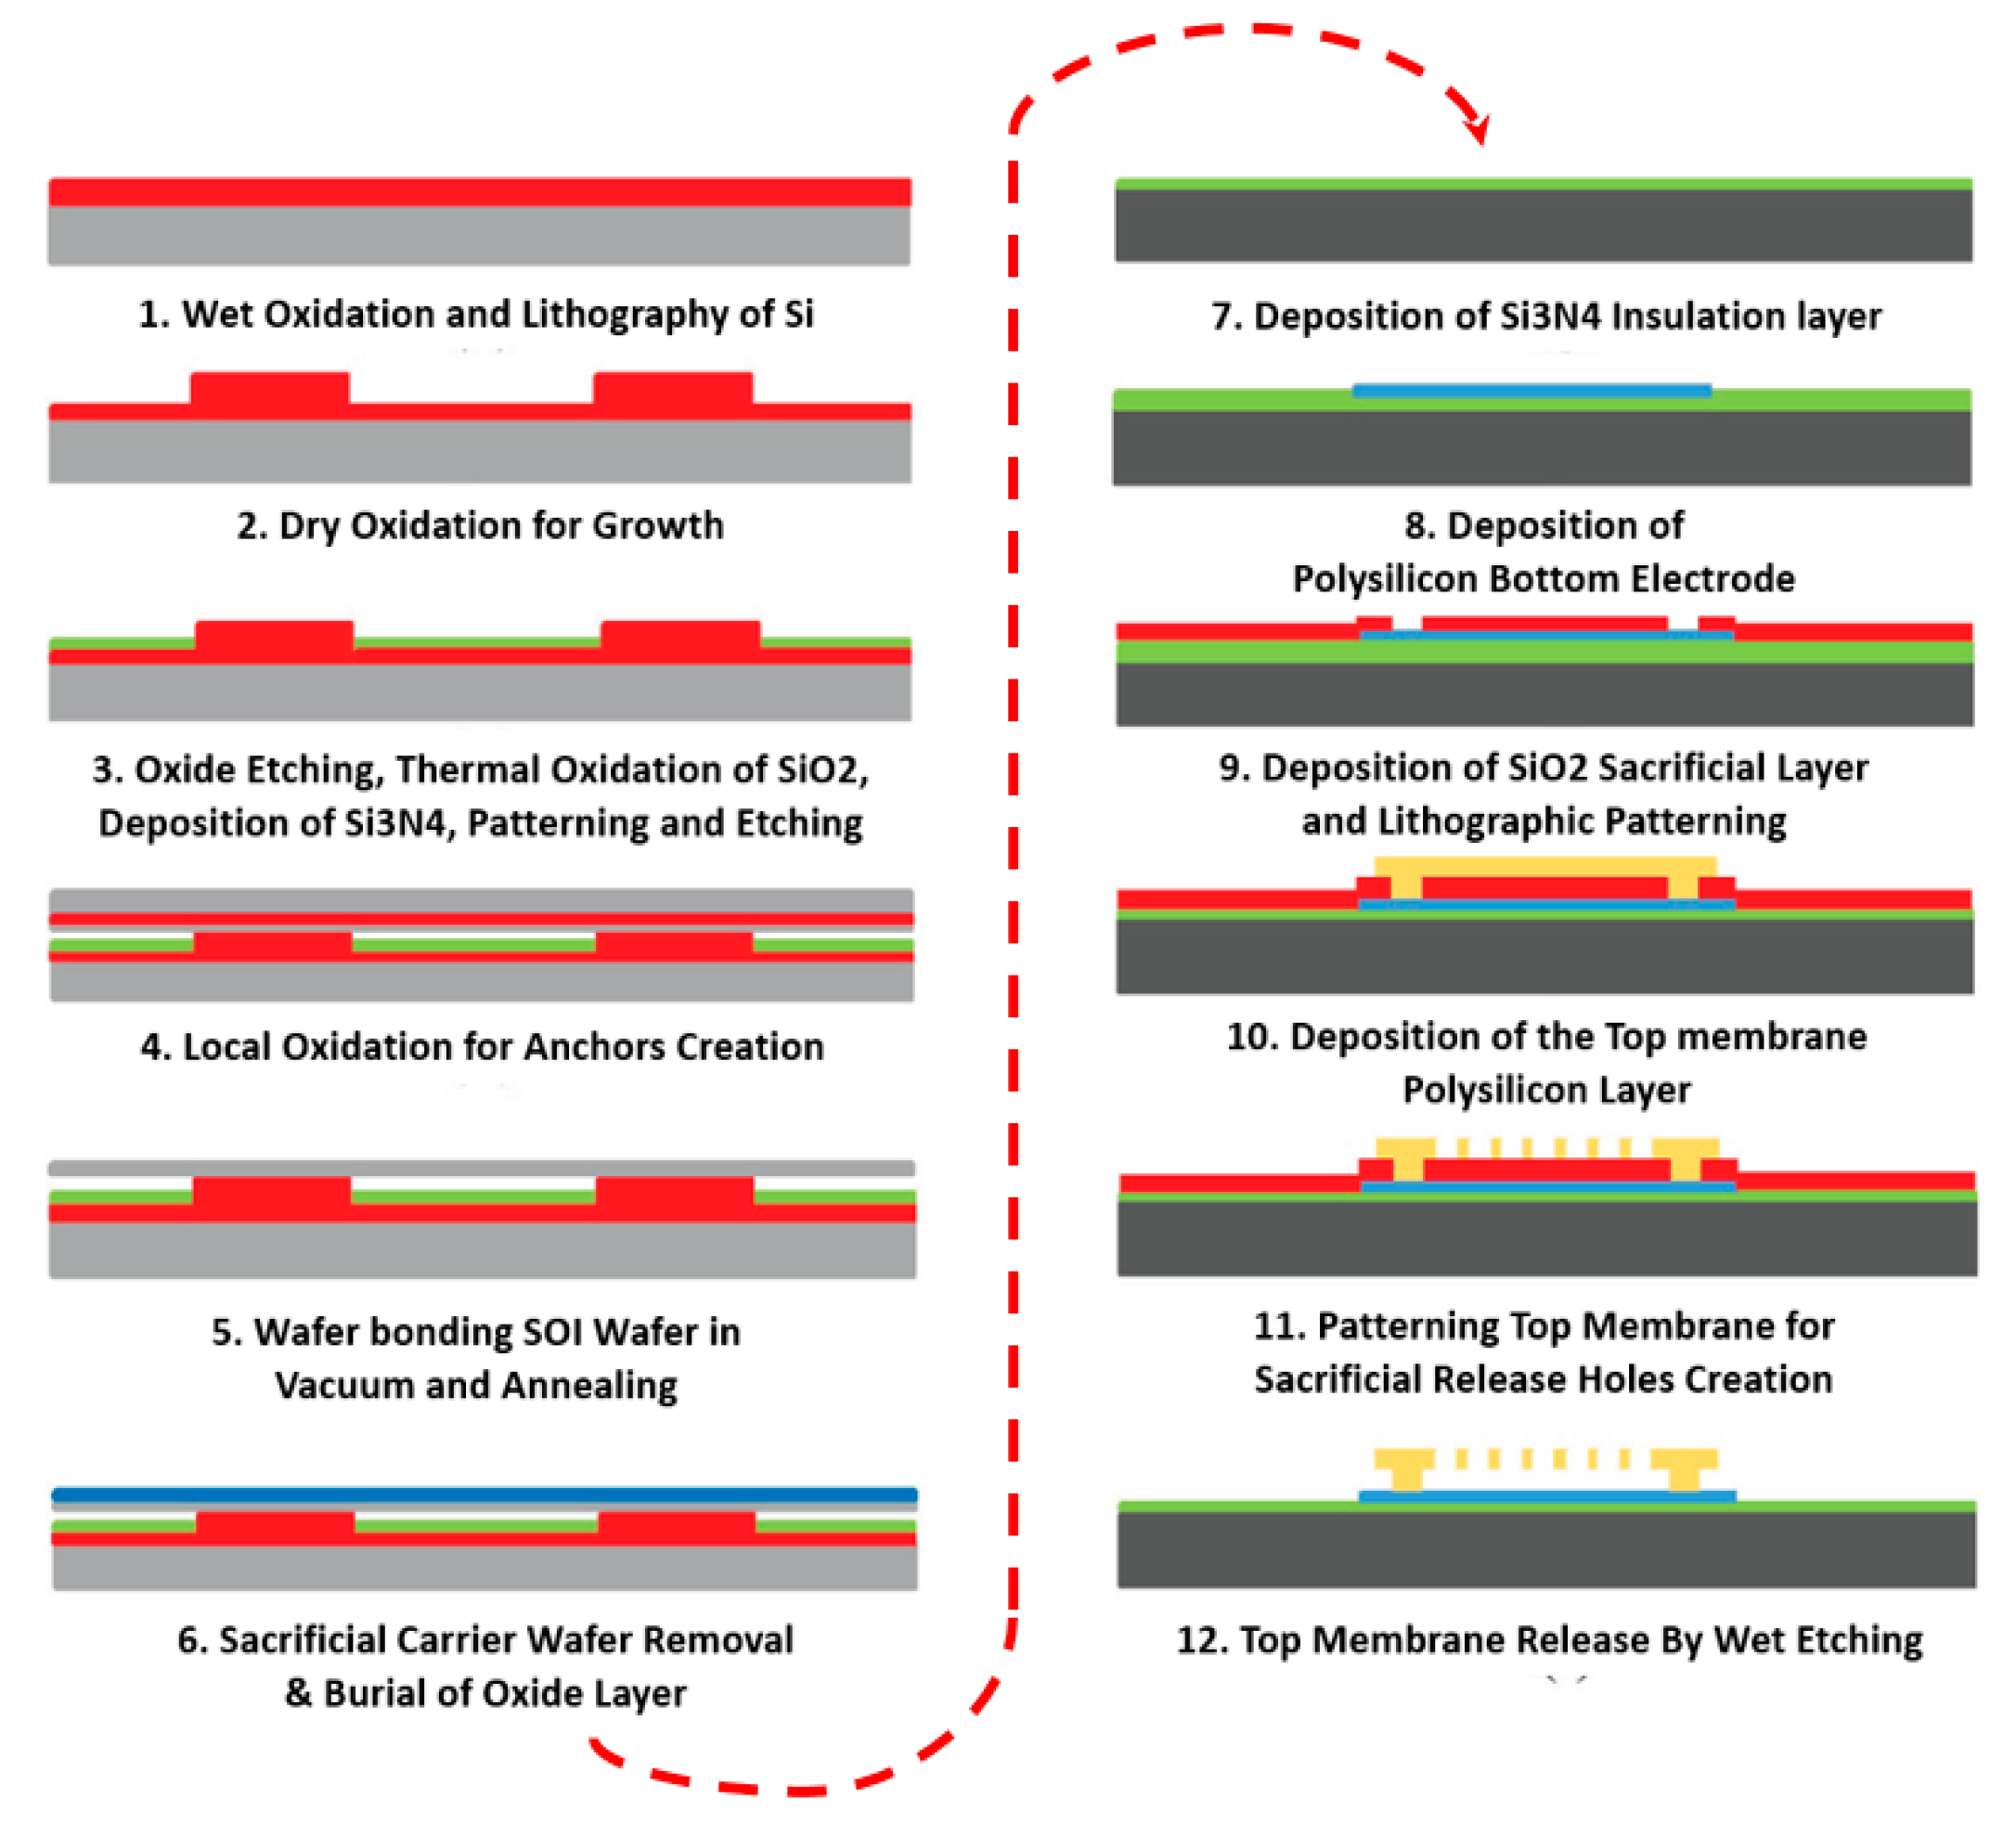
Figure 16.
CMOS Realization of GS and its Post Fabrication Assembly (a) Impedance Model and Dye Realization [35,56] (b) Sensor Assembly (LoC) [35,56,57,58].
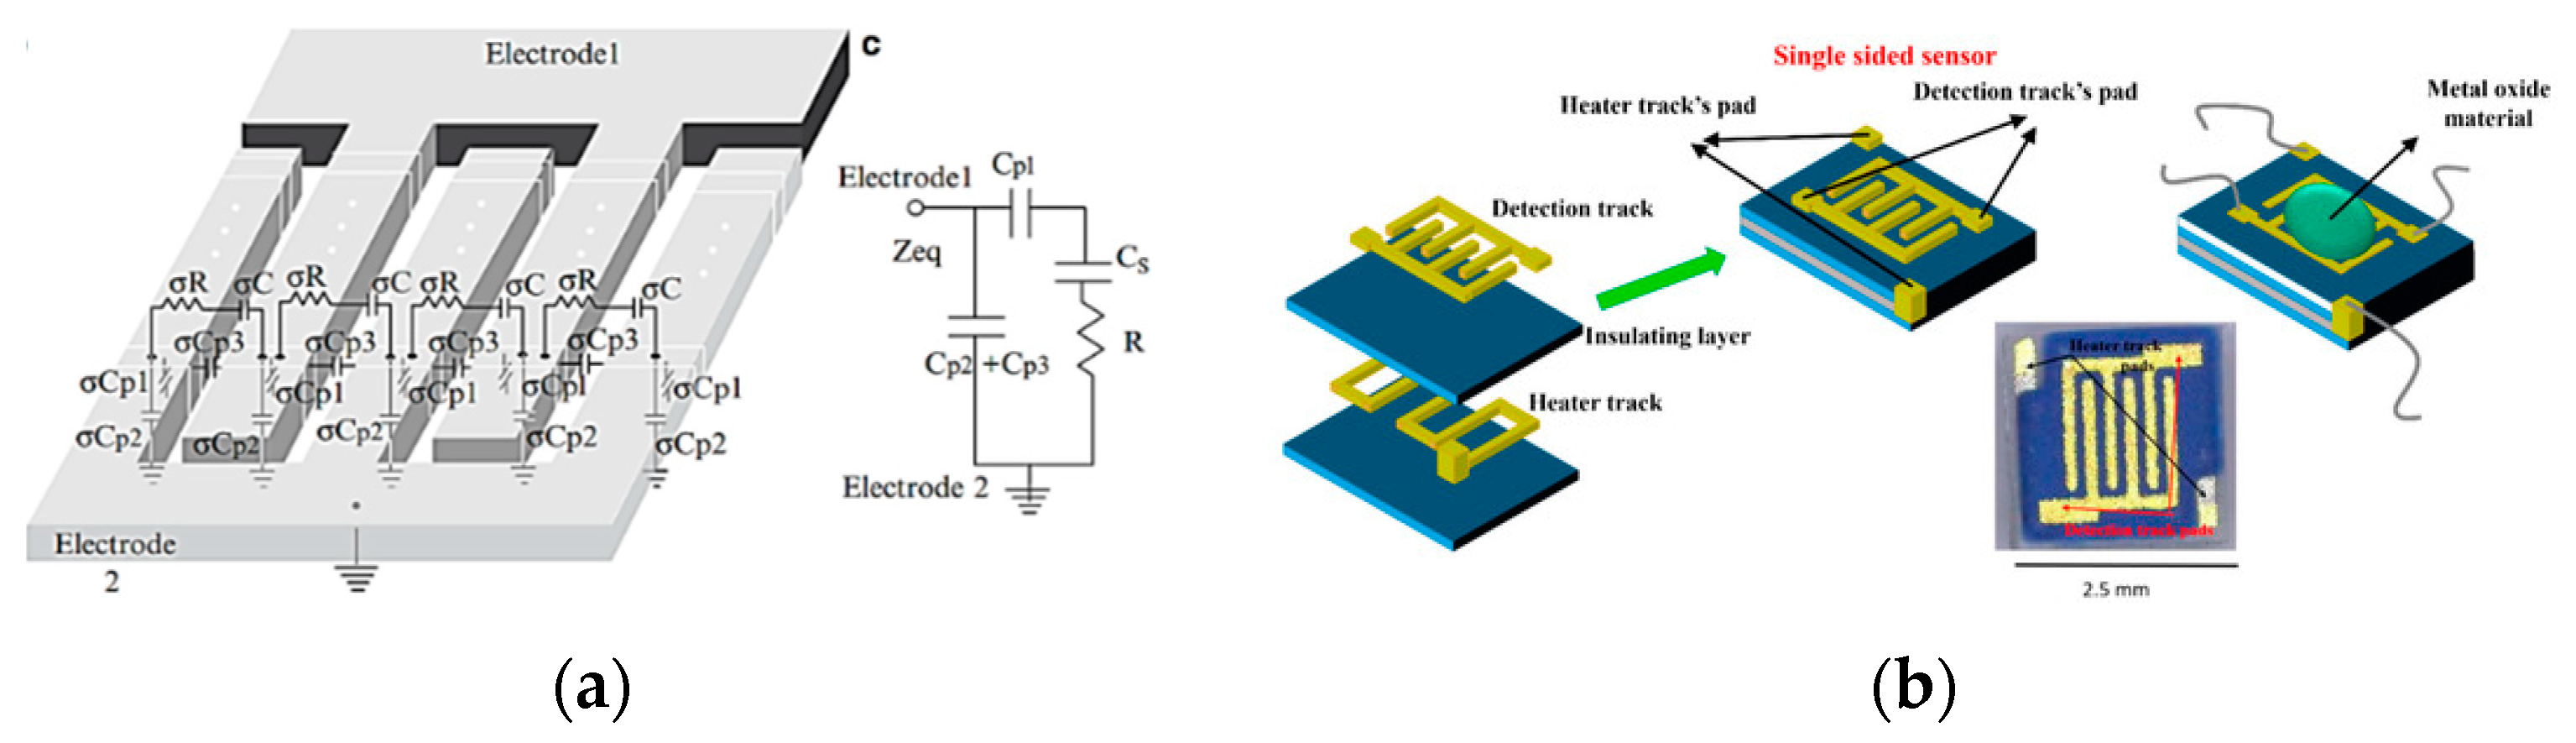
Figure 17.
Major FET Gas sensor architectures using CMOS Approach (a) Schematic of a Cascaded MOS-FETs coupled with IC area with Si Substrate [87] (b) Detailed view of a FET based Gas Sensor [86,87,88] (c) Complete FET Sensor Assembly [86,87,88,89].
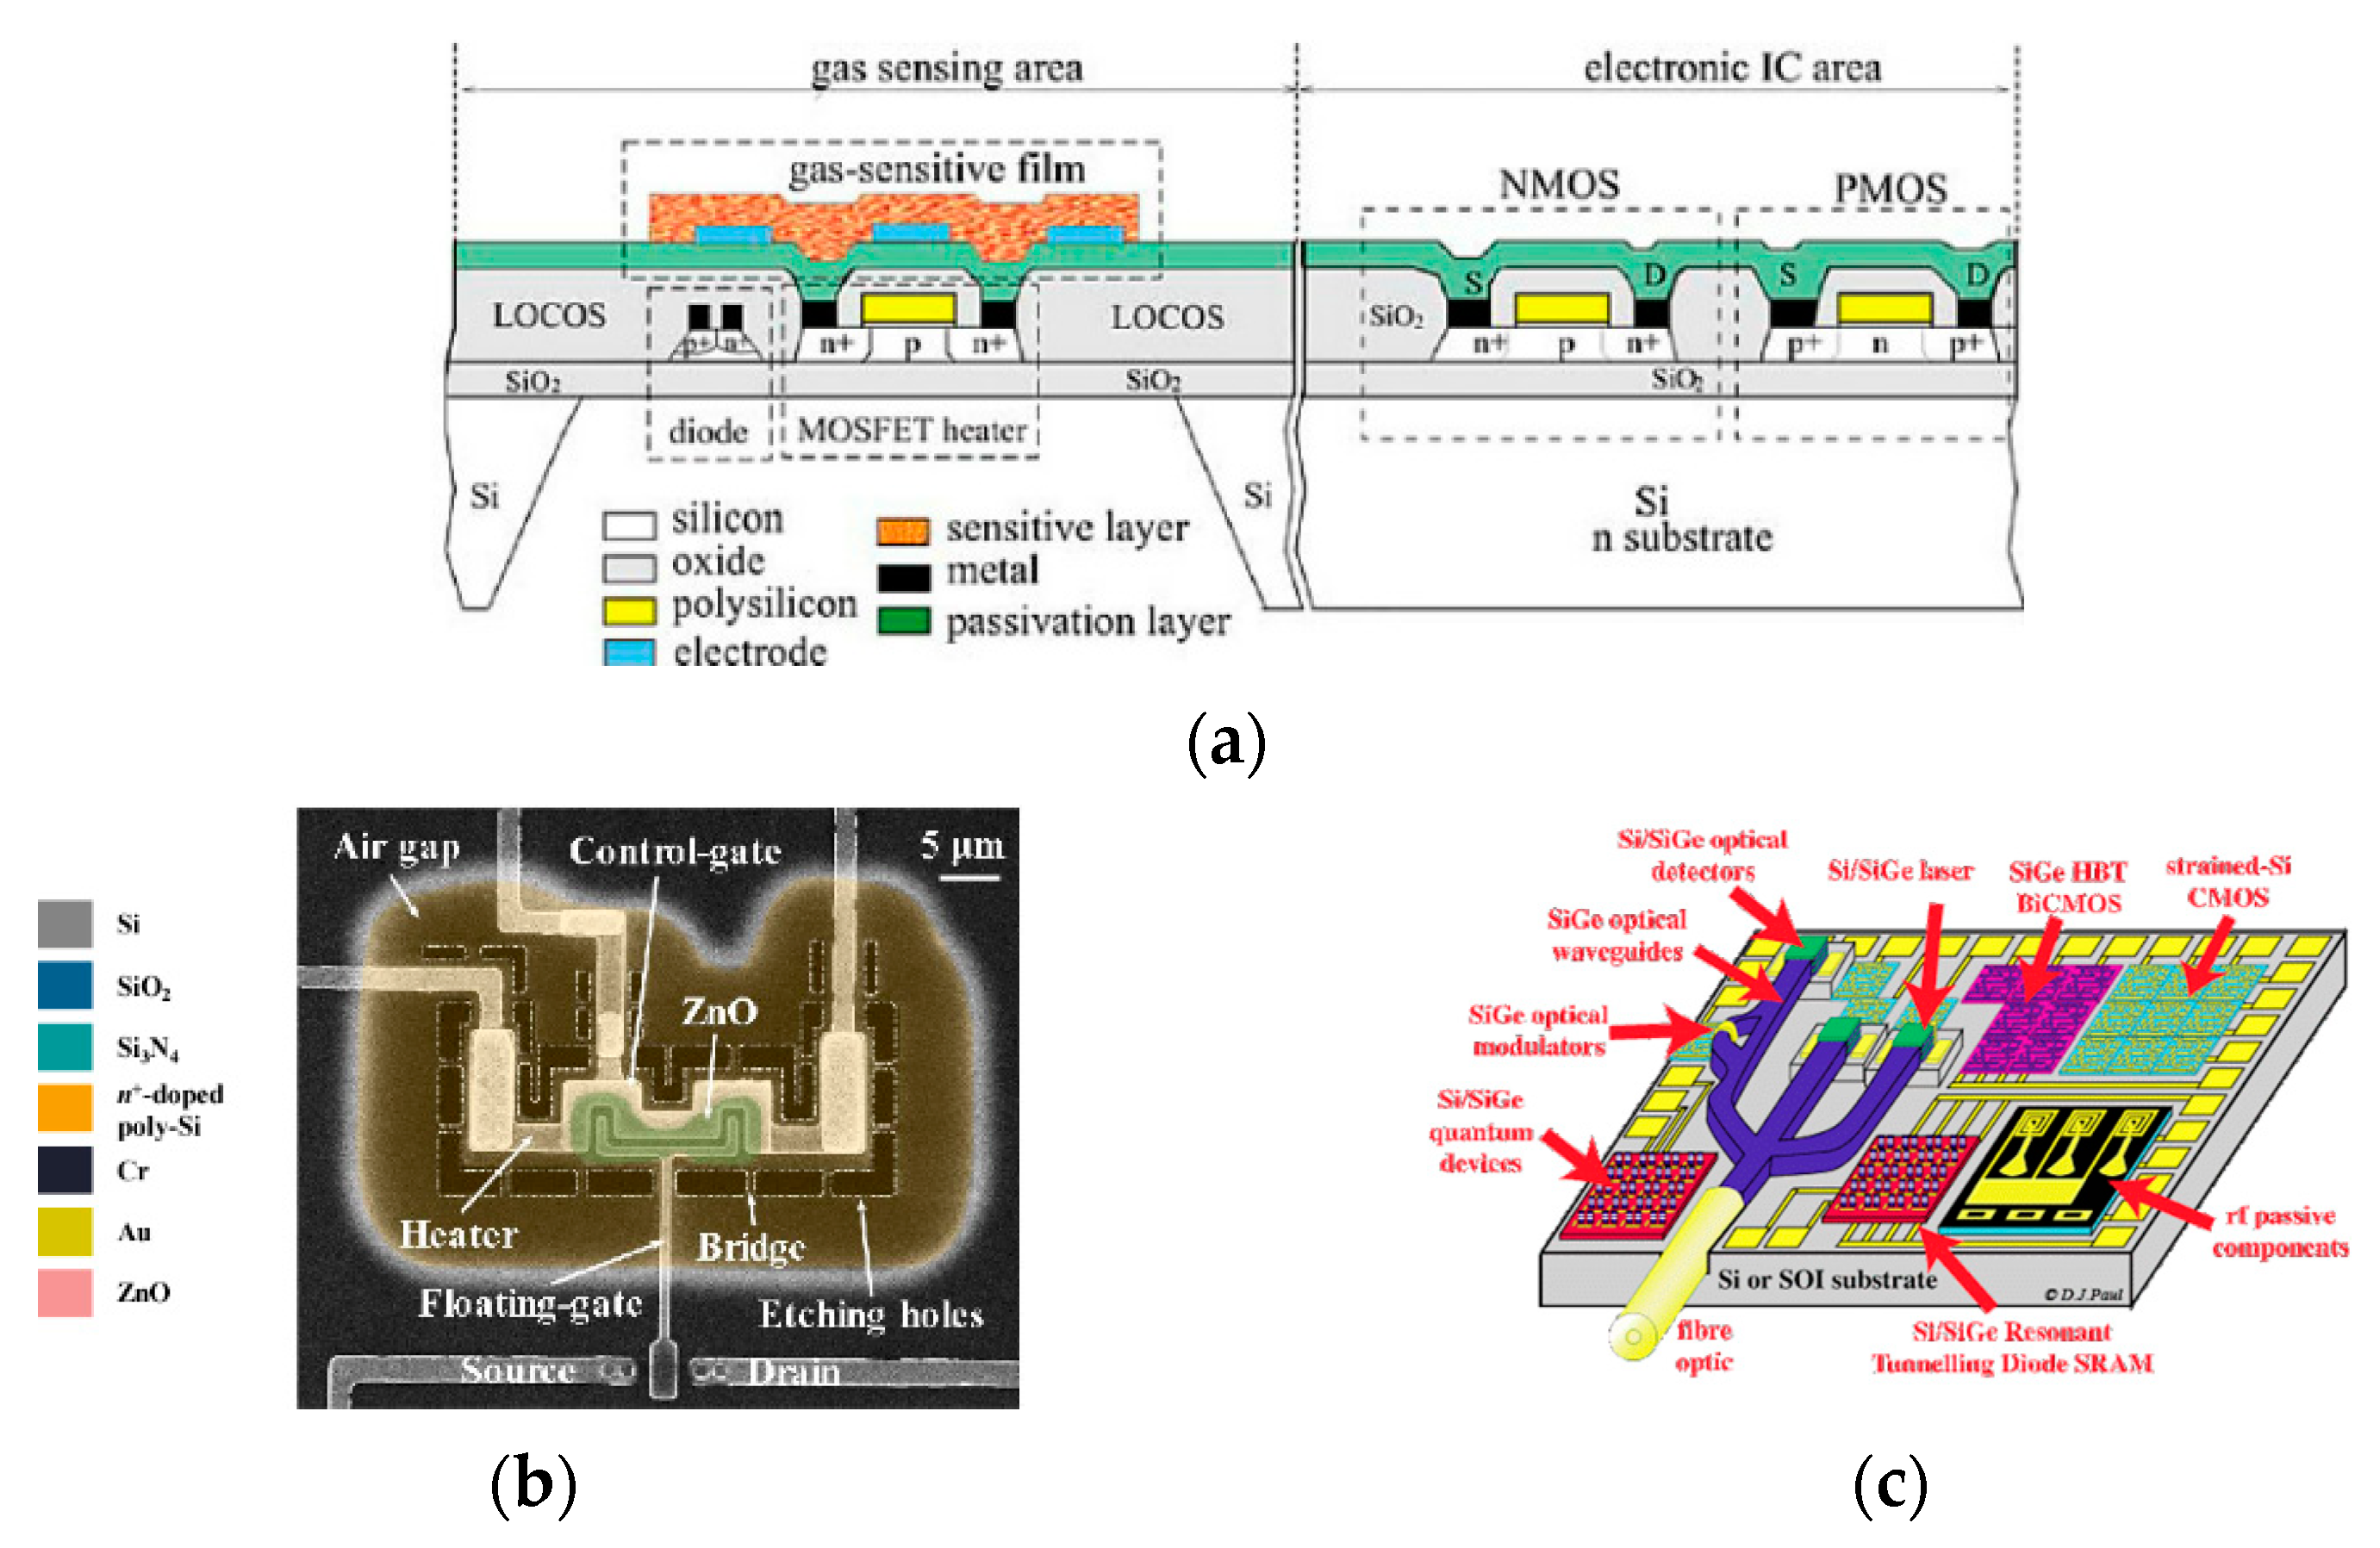
Figure 18.
Process of Fabrication of Monolithic GS by CMOS technology [91]
Figure 18.
Process of Fabrication of Monolithic GS by CMOS technology [91]
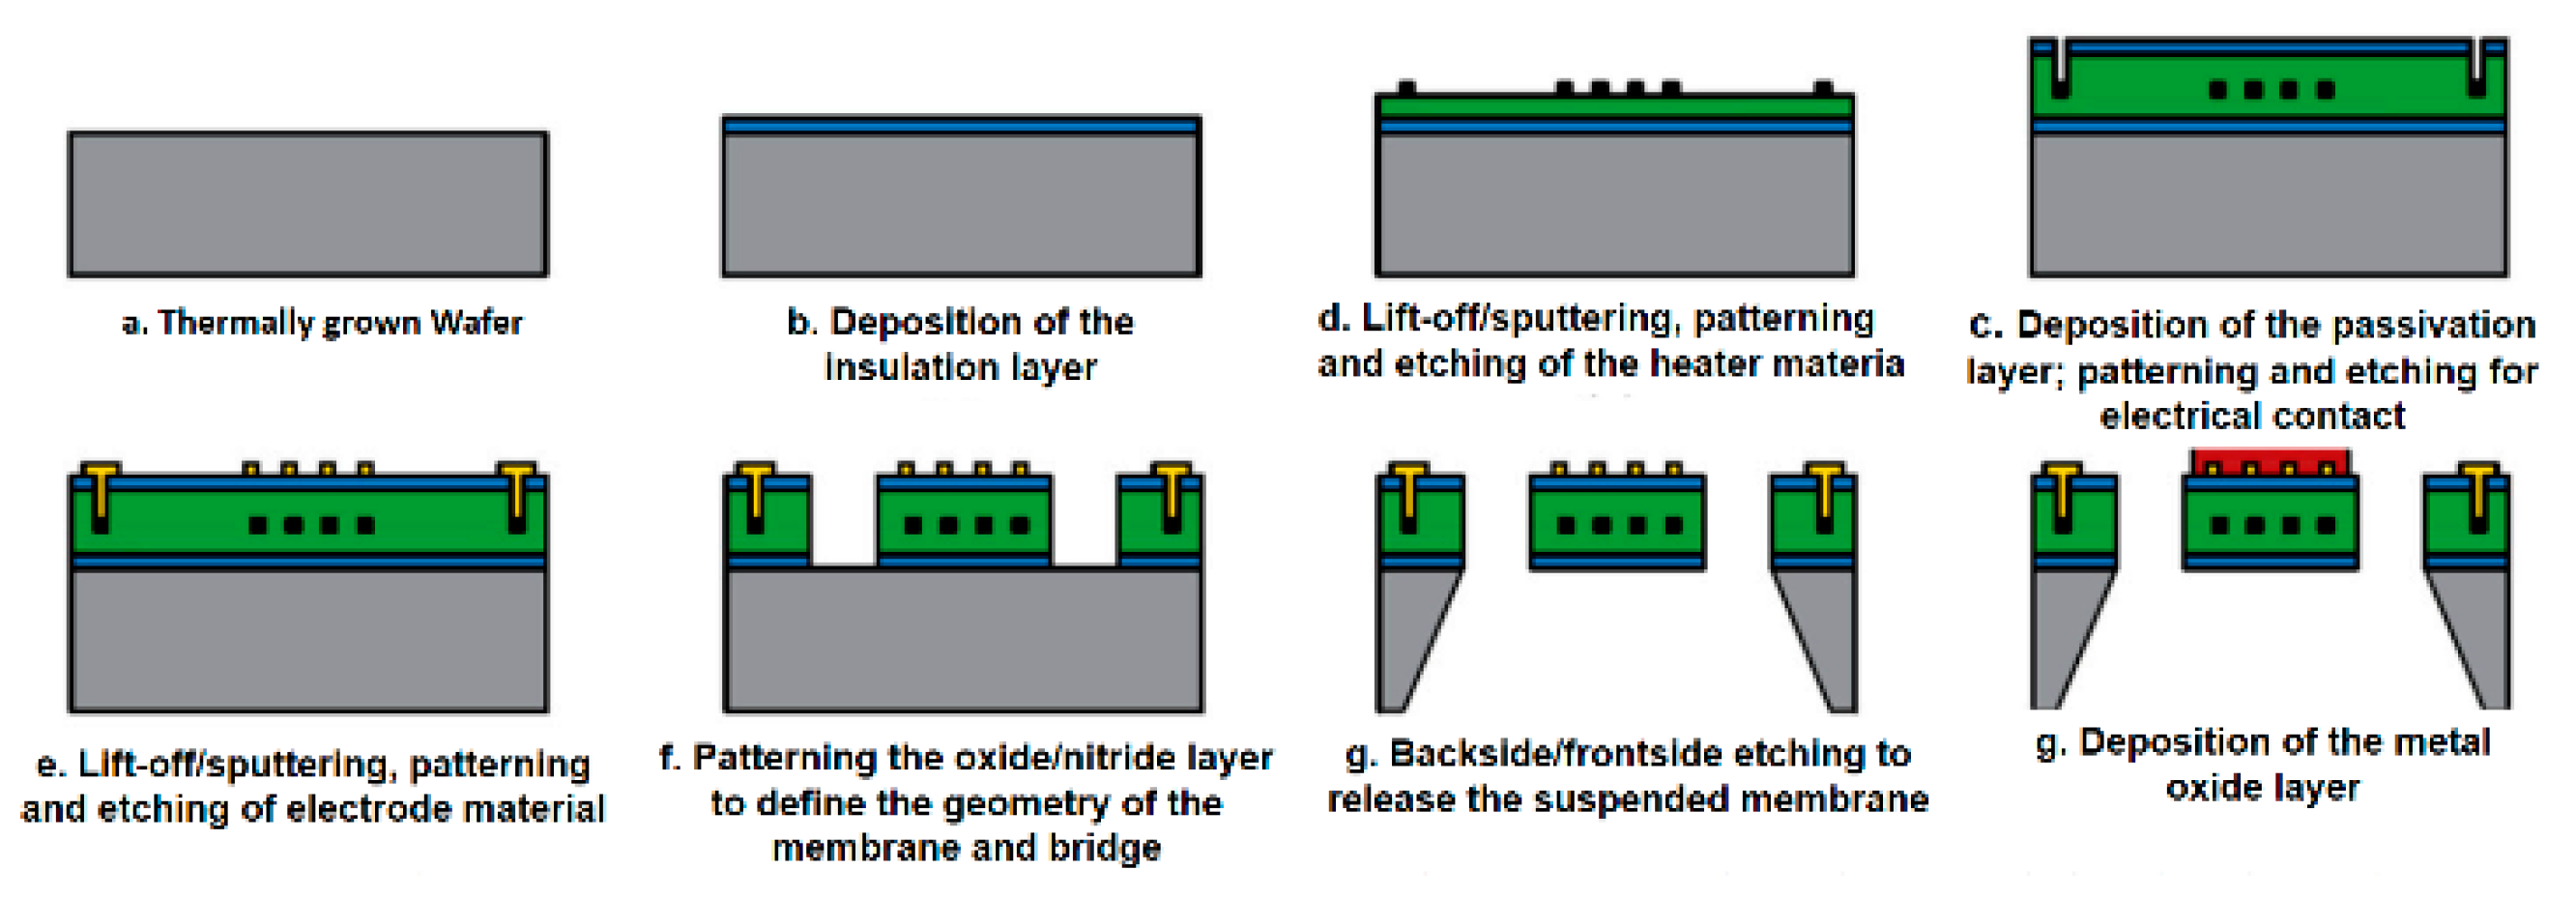
Figure 20.
Major contributions in Applied GSGs and ENBs. (a) Trio GSG for I-AQA [107]. (b) Wound Infection ENB [108] (c) Smart Rig Test ENB [109].
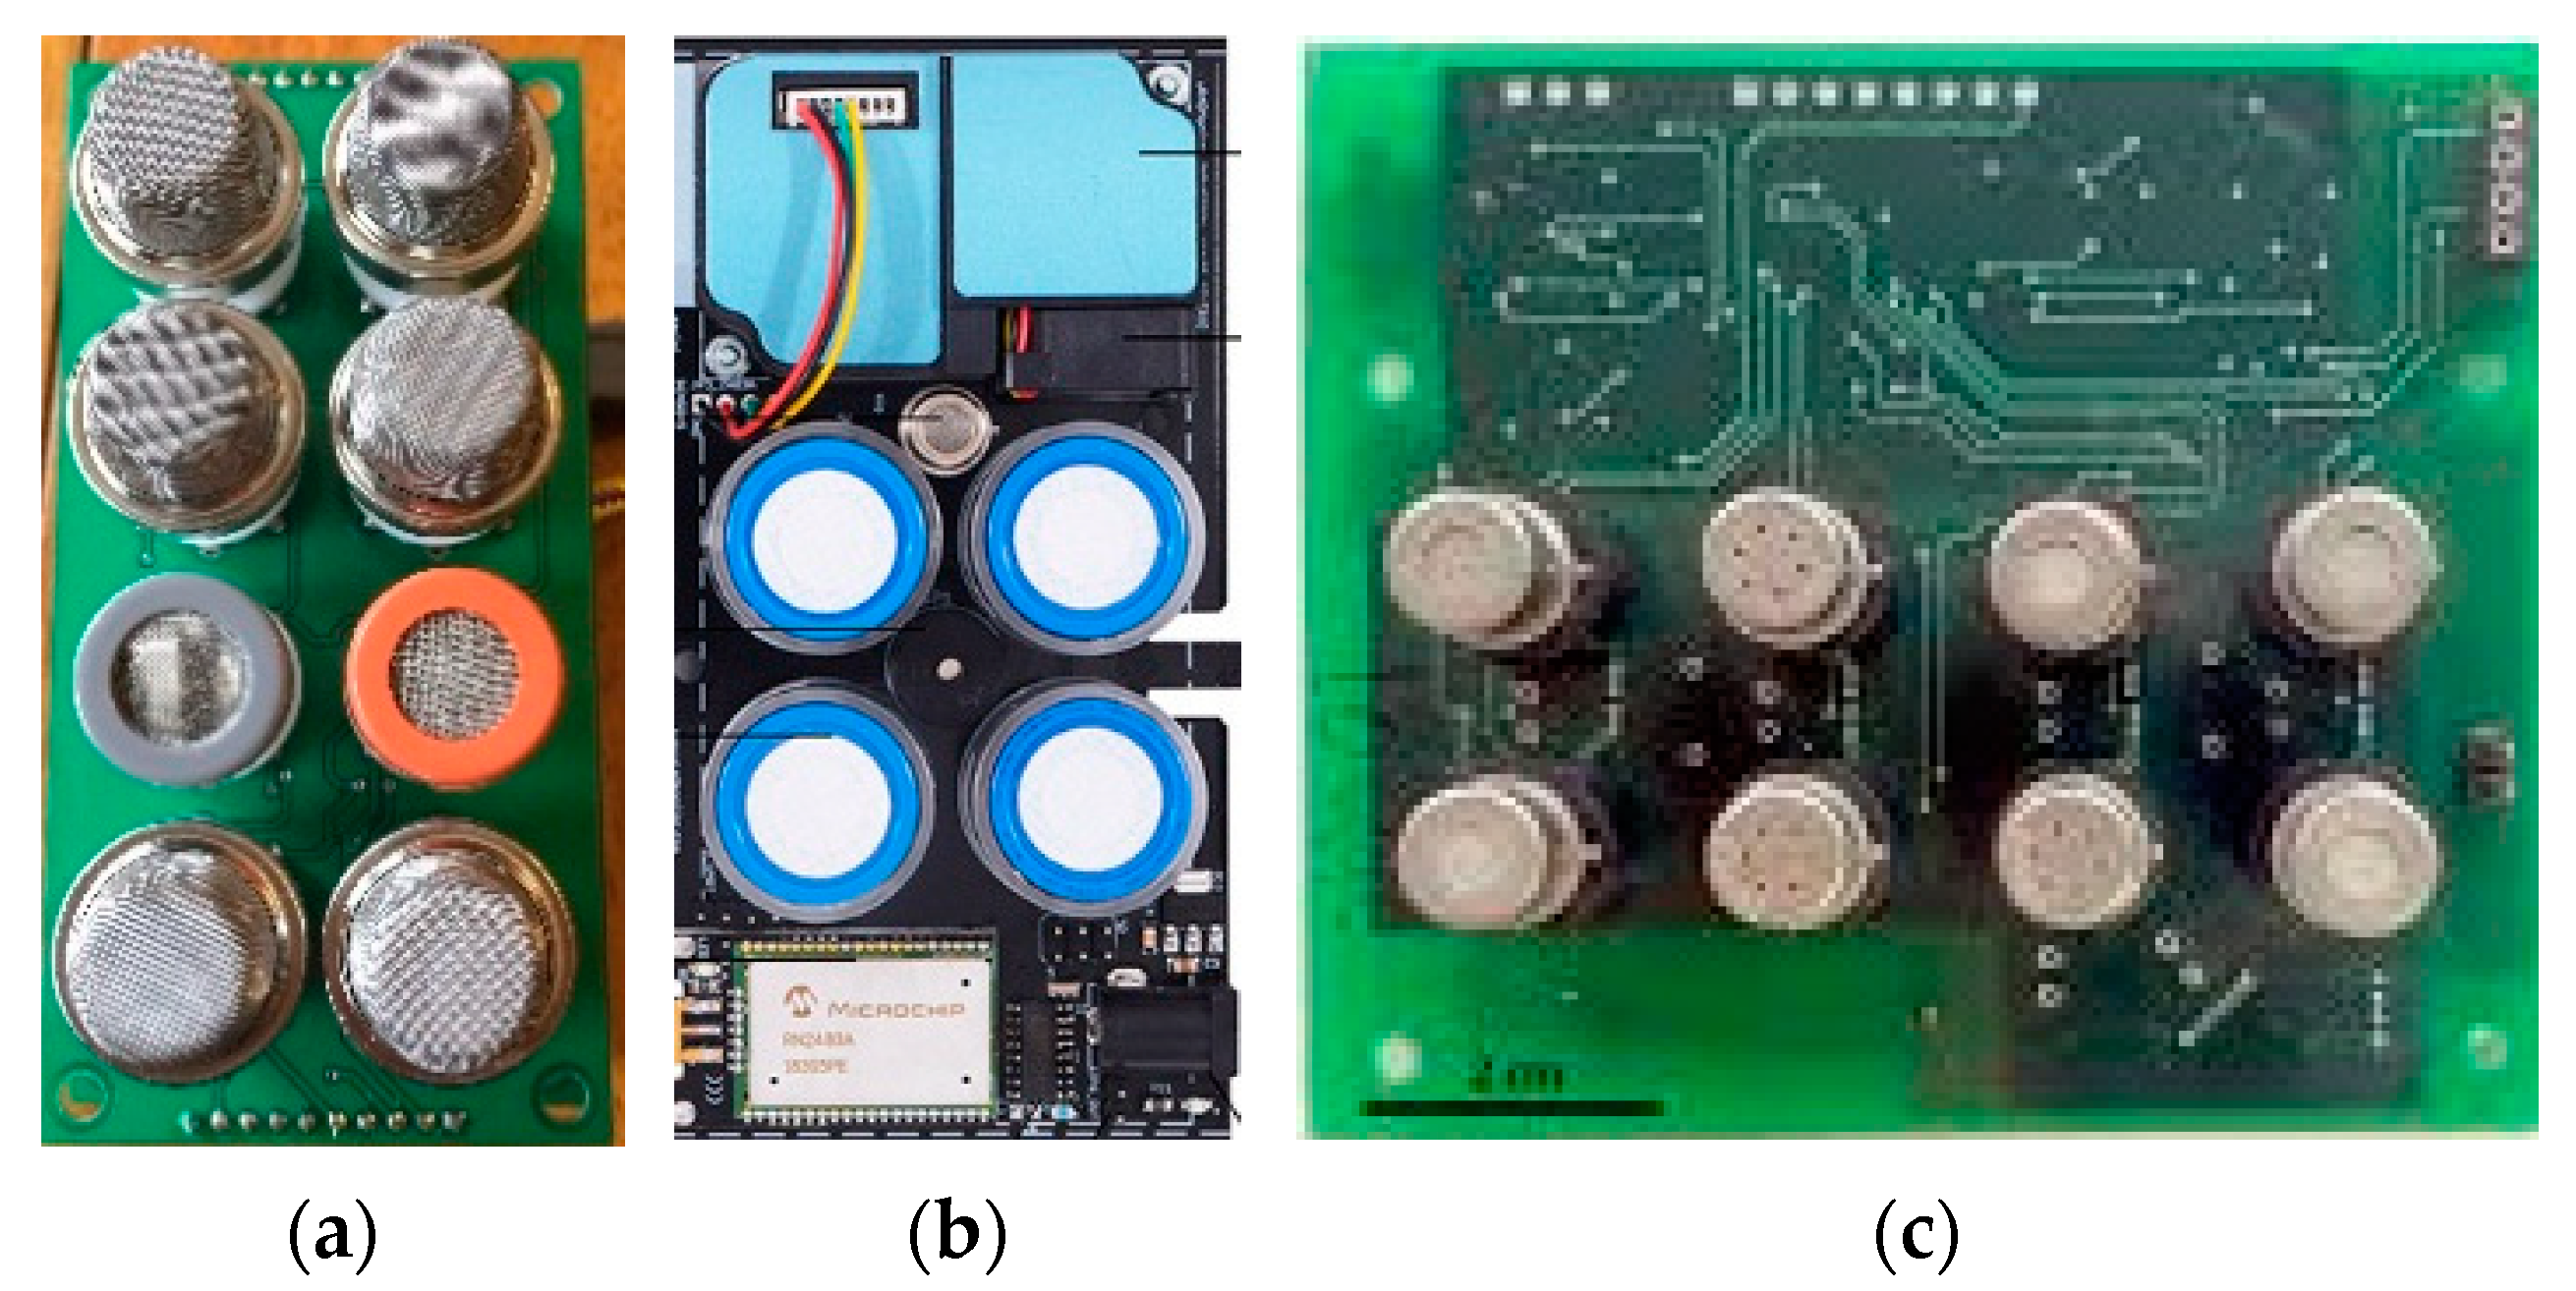
Figure 22.
Major contributions in GSAoC) based SOI for Applied GSGs and ENBs. (A) SPEC DSPoC with GSA on Chip [110]. (B) Monolithic GSA on Chip with 3.5 nm wires [111].
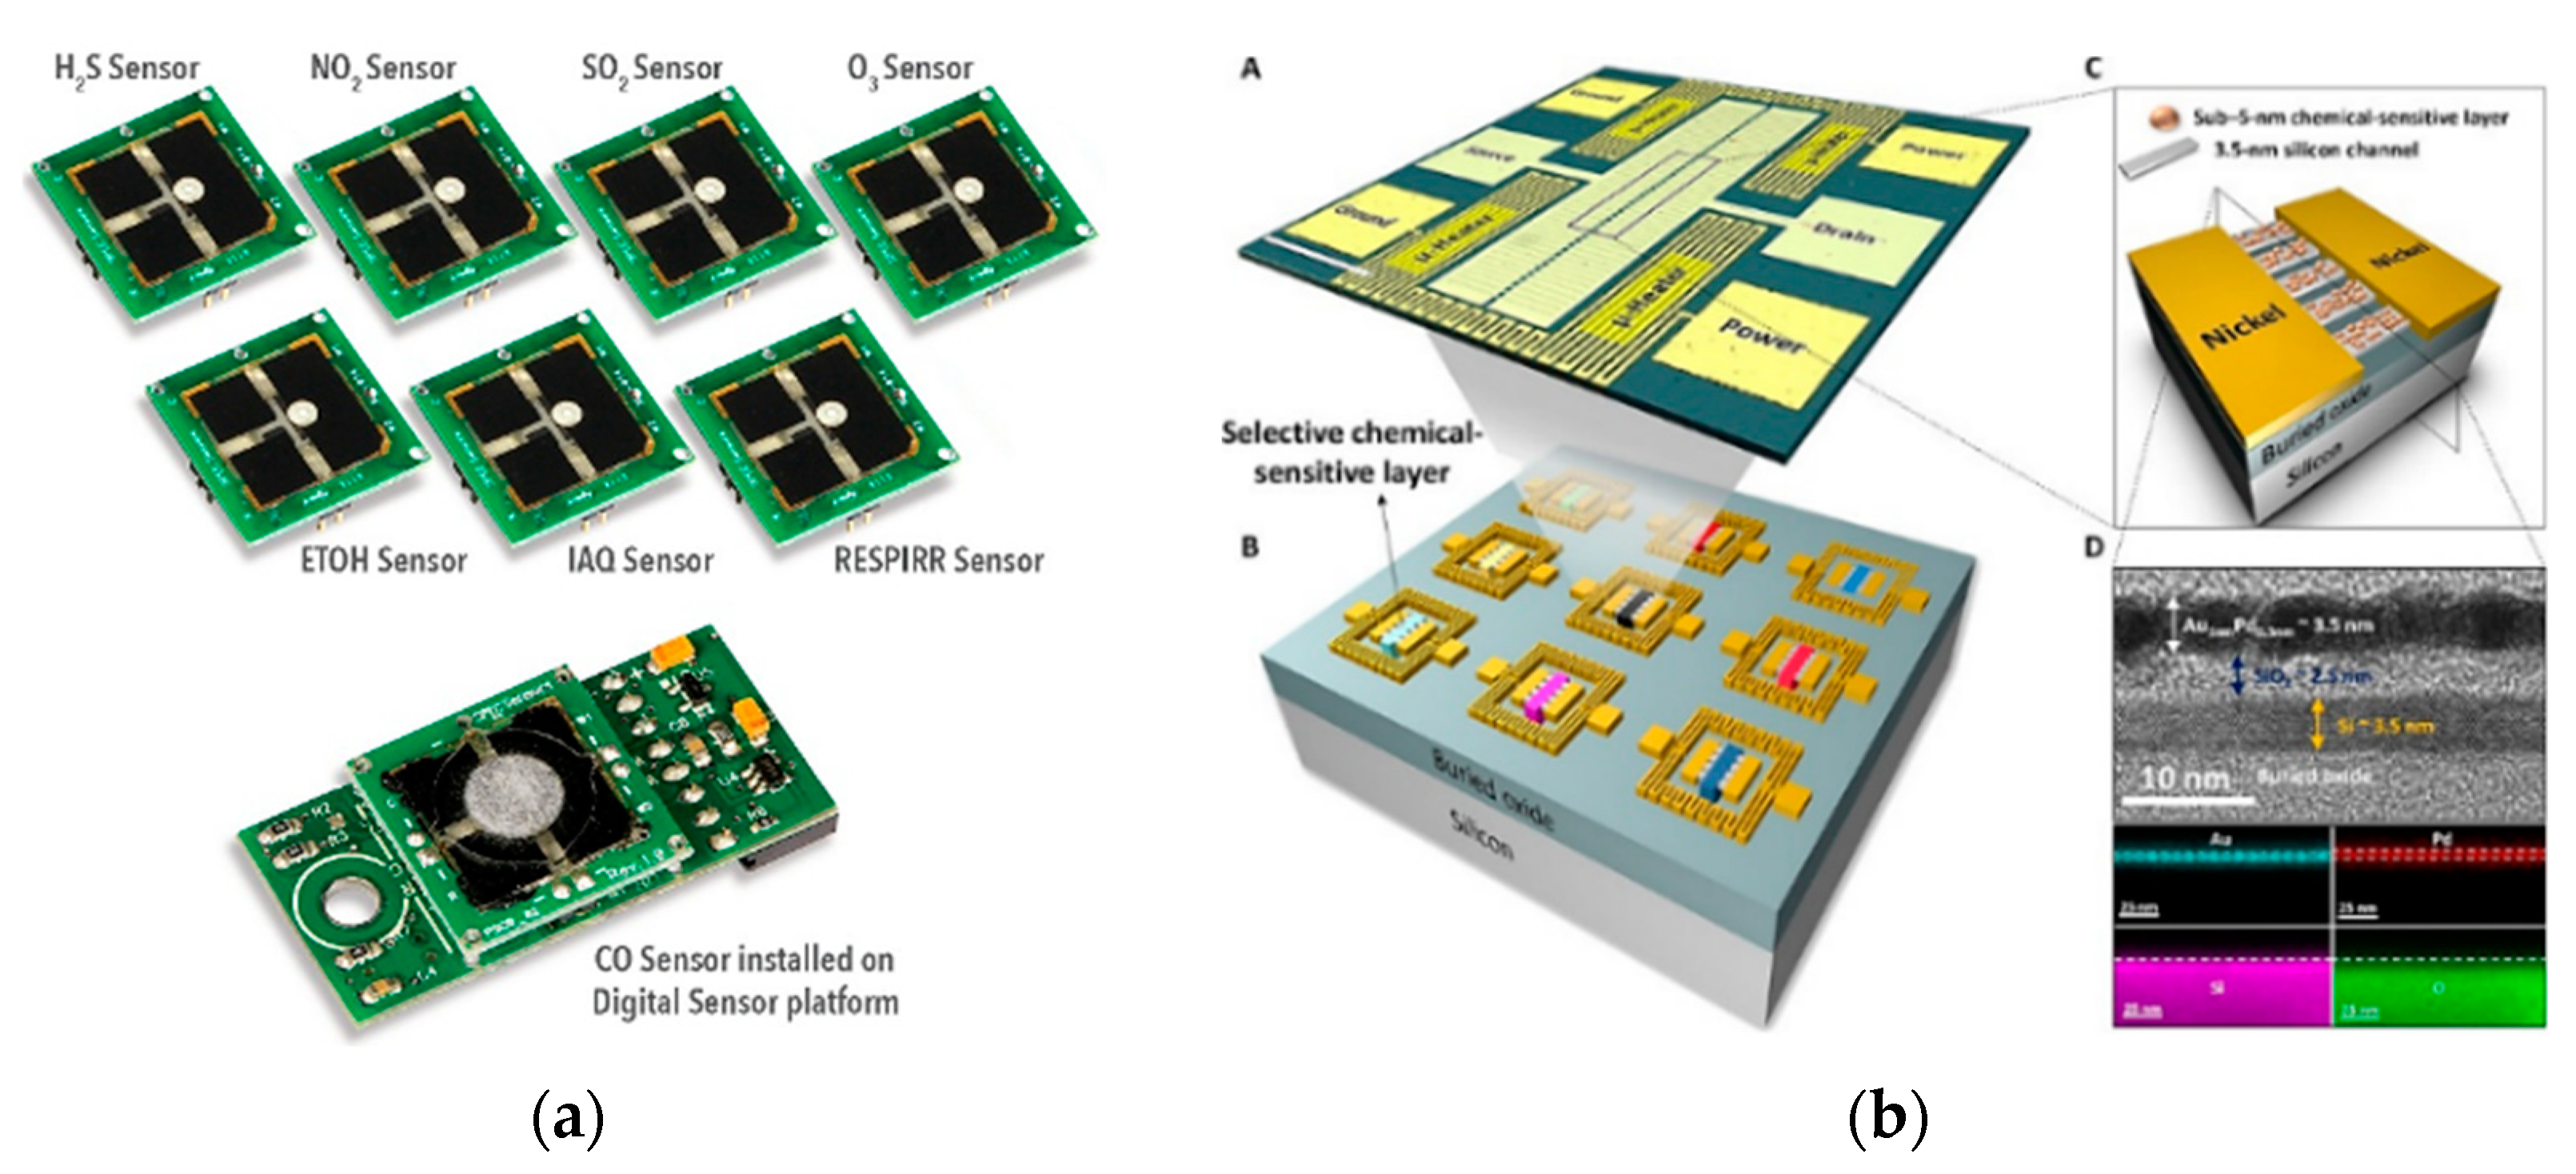
Figure 23.
The AQ gas sensor calibration chamber-based system. (a) P&ID of a Unit AQGS Testing and Calibration System [114]. (b) System Assembly and Architecture [115].
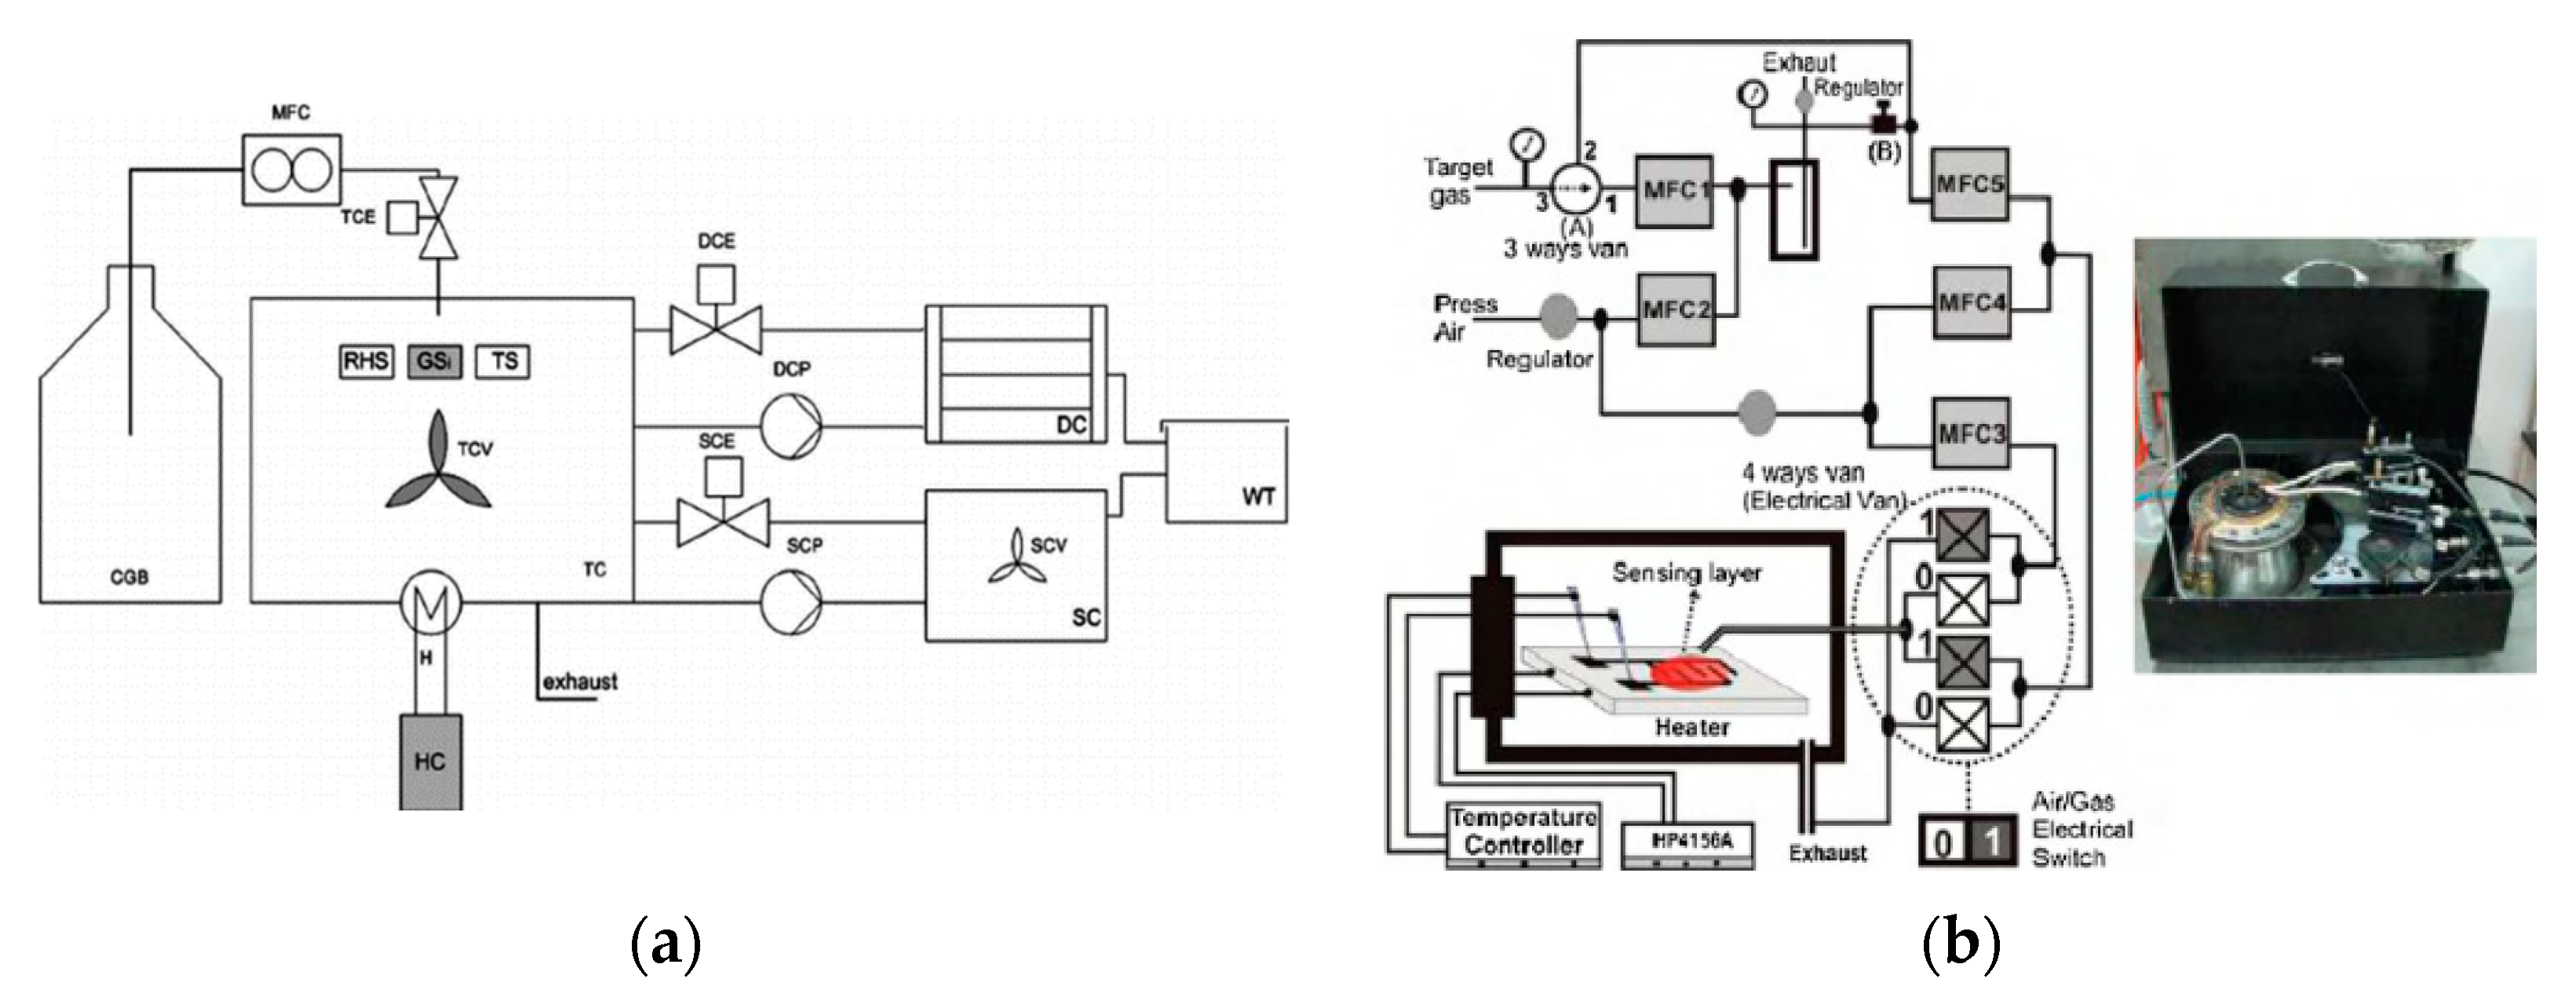
Figure 24.
The Computer Supervised AQGS Testing Systems [119,121]. (a) AQGS Array Testing and Calibration System [119]. (b) The ENB Testing and Calibration System [120].
Disclaimer/Publisher’s Note: The statements, opinions and data contained in all publications are solely those of the individual author(s) and contributor(s) and not of MDPI and/or the editor(s). MDPI and/or the editor(s) disclaim responsibility for any injury to people or property resulting from any ideas, methods, instructions or products referred to in the content. |
© 2023 by the authors. Licensee MDPI, Basel, Switzerland. This article is an open access article distributed under the terms and conditions of the Creative Commons Attribution (CC BY) license (http://creativecommons.org/licenses/by/4.0/).
Copyright: This open access article is published under a Creative Commons CC BY 4.0 license, which permit the free download, distribution, and reuse, provided that the author and preprint are cited in any reuse.


