
Submitted:
25 October 2020
Posted:
26 October 2020
You are already at the latest version
Abstract
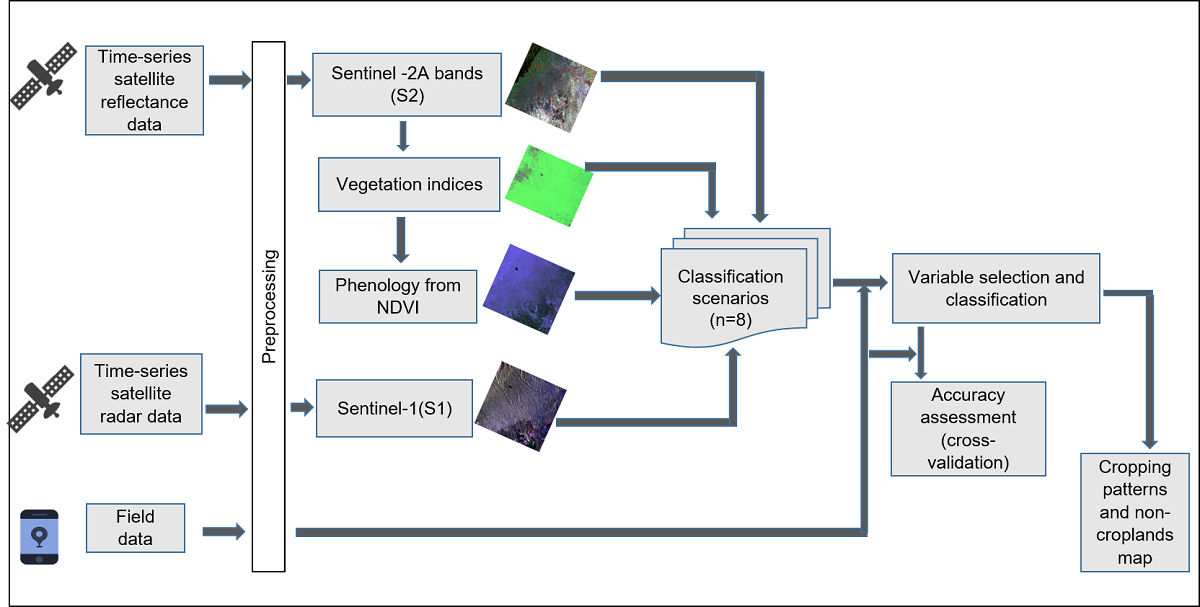
The proportion of area under various crops at a given point in time, known as a cropping pattern, plays an essential role in determining the level of agricultural production. In this study, cropping patterns of three sub-counties in Murang’a County, a typical African smallholder farming area in Kenya, were mapped. Specifically, we compared the performance of eight classification scenarios for mapping cropping patterns; namely using (i) only Sentinel-2 reflectance bands (S2), (ii) S2 and S2 derived vegetation indices (VIs); (iii) S2 and S2 vegetation phenology (VP); (iv) S2 and Sentinel-1 radar backscatter data (S1); (v) S2, VIs, and S1; (vi) S2, VP, and S1; (vii) S2, VIs and VP, and (viii) S2, VIs, VP and S1. Reference data of the dominant cropping patterns and non-croplands were collected. The guided regularized random forest (GRRF) algorithm was used to select the optimum variables and to perform the respective classification for each scenario. The most accurate result of the overall accuracy of 93.16% was attained from the scenario (viii) S2, VIs, VP, and S1. The McNemar’s test of significance did not show significant differences (p≤0.05) among the tested scenarios. Our study demonstrated the strength of GRRF and the synergetic advantage of S2 and S1 derivatives to map cropping patterns in a heterogeneous landscape where high resolution imagery are inaccessible. Our cropping pattern mapping approach can be used in other sites of relatively similar agro-ecological conditions.
Keywords:
agricultural productivity
; cropping patterns
; Kenya
; multi-data analysis
Copyright: This open access article is published under a Creative Commons CC BY 4.0 license, which permit the free download, distribution, and reuse, provided that the author and preprint are cited in any reuse.


