
Submitted:
22 September 2020
Posted:
24 September 2020
You are already at the latest version
Abstract
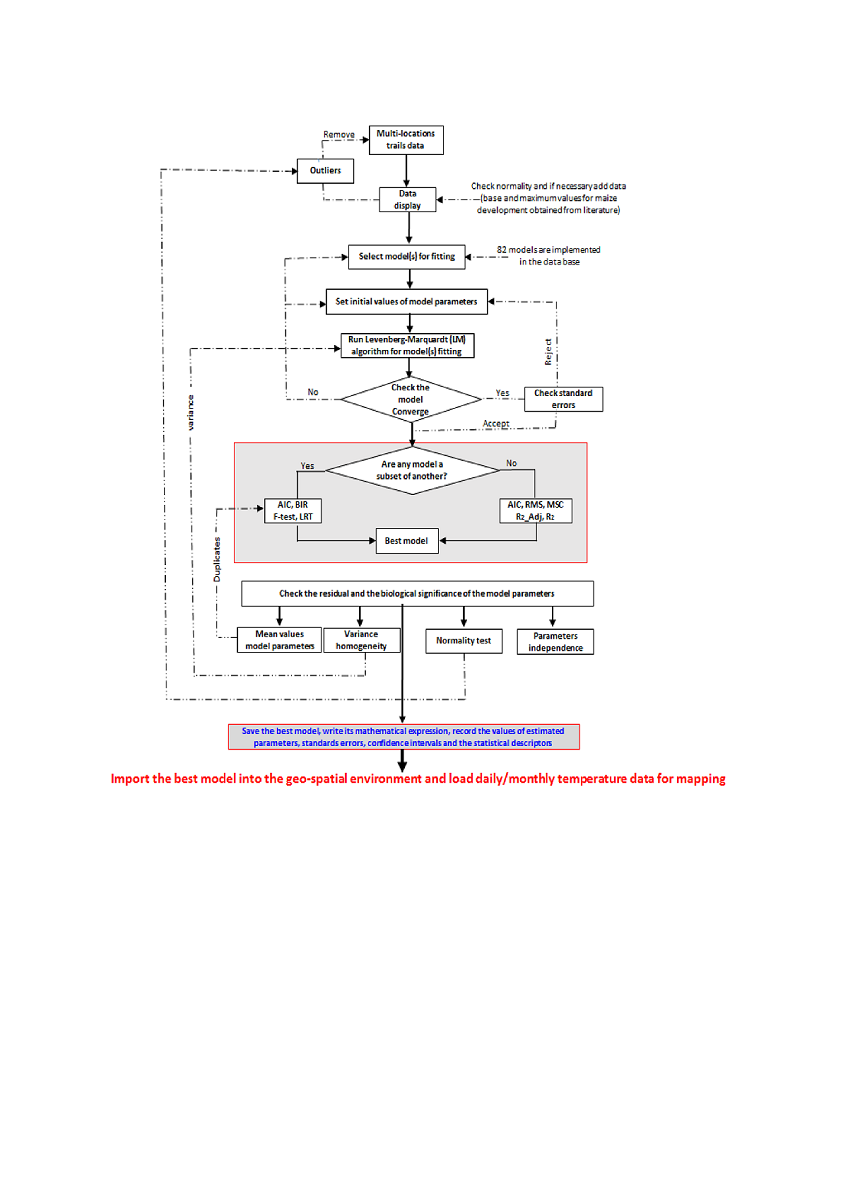
Understanding the detailed timing of crop phenology and their variability enhances grain yield and quality by providing precise scheduling of irrigation, fertilization, and crop protection mechanisms. Advances in information and communication technology (ICT) provide a unique opportunity to develop agriculture-related tools that enhance wall-to-wall upscaling of data outputs from point-location data to wide-area spatial scales. Because of the heterogeneity of the worldwide agro-ecological zones where crops are cultivated, it is unproductive to perform plant phenology research without providing means to upscale results to landscape-level while safeguarding field-scale relevance. This paper presents an advanced, reproducible, and open-source software for plant phenology prediction and mapping (PPMaP) that inputs data obtained from multi-location field experiments to derive models for any crop variety. This information can then be applied consecutively at a localized grid within a spatial framework to produce plant phenology predictions at the landscape level. This software supports the development of process-oriented and temperature-driven plant phenology models by intuitively and interactively leading the user through a step-by-step progression to the production of spatial maps for any region of interest. Maize (Zea mays L.) was used to demonstrate the robustness, versatility, and high computing efficiency of the resulting modeling outputs of the PPMaP. The framework is implemented in R, providing a flexible and easy‐to‐use GUI interface. Since this allows appropriate scaling to the larger spatial domain, the software can effectively be used to determine the spatially explicit length of growing period (LGP) of any variety.
Keywords:
plant development rate
; temperature-dependent
; landscape
; multi-location trials
Copyright: This open access article is published under a Creative Commons CC BY 4.0 license, which permit the free download, distribution, and reuse, provided that the author and preprint are cited in any reuse.


