
Submitted:
21 December 2018
Posted:
24 December 2018
You are already at the latest version
Abstract
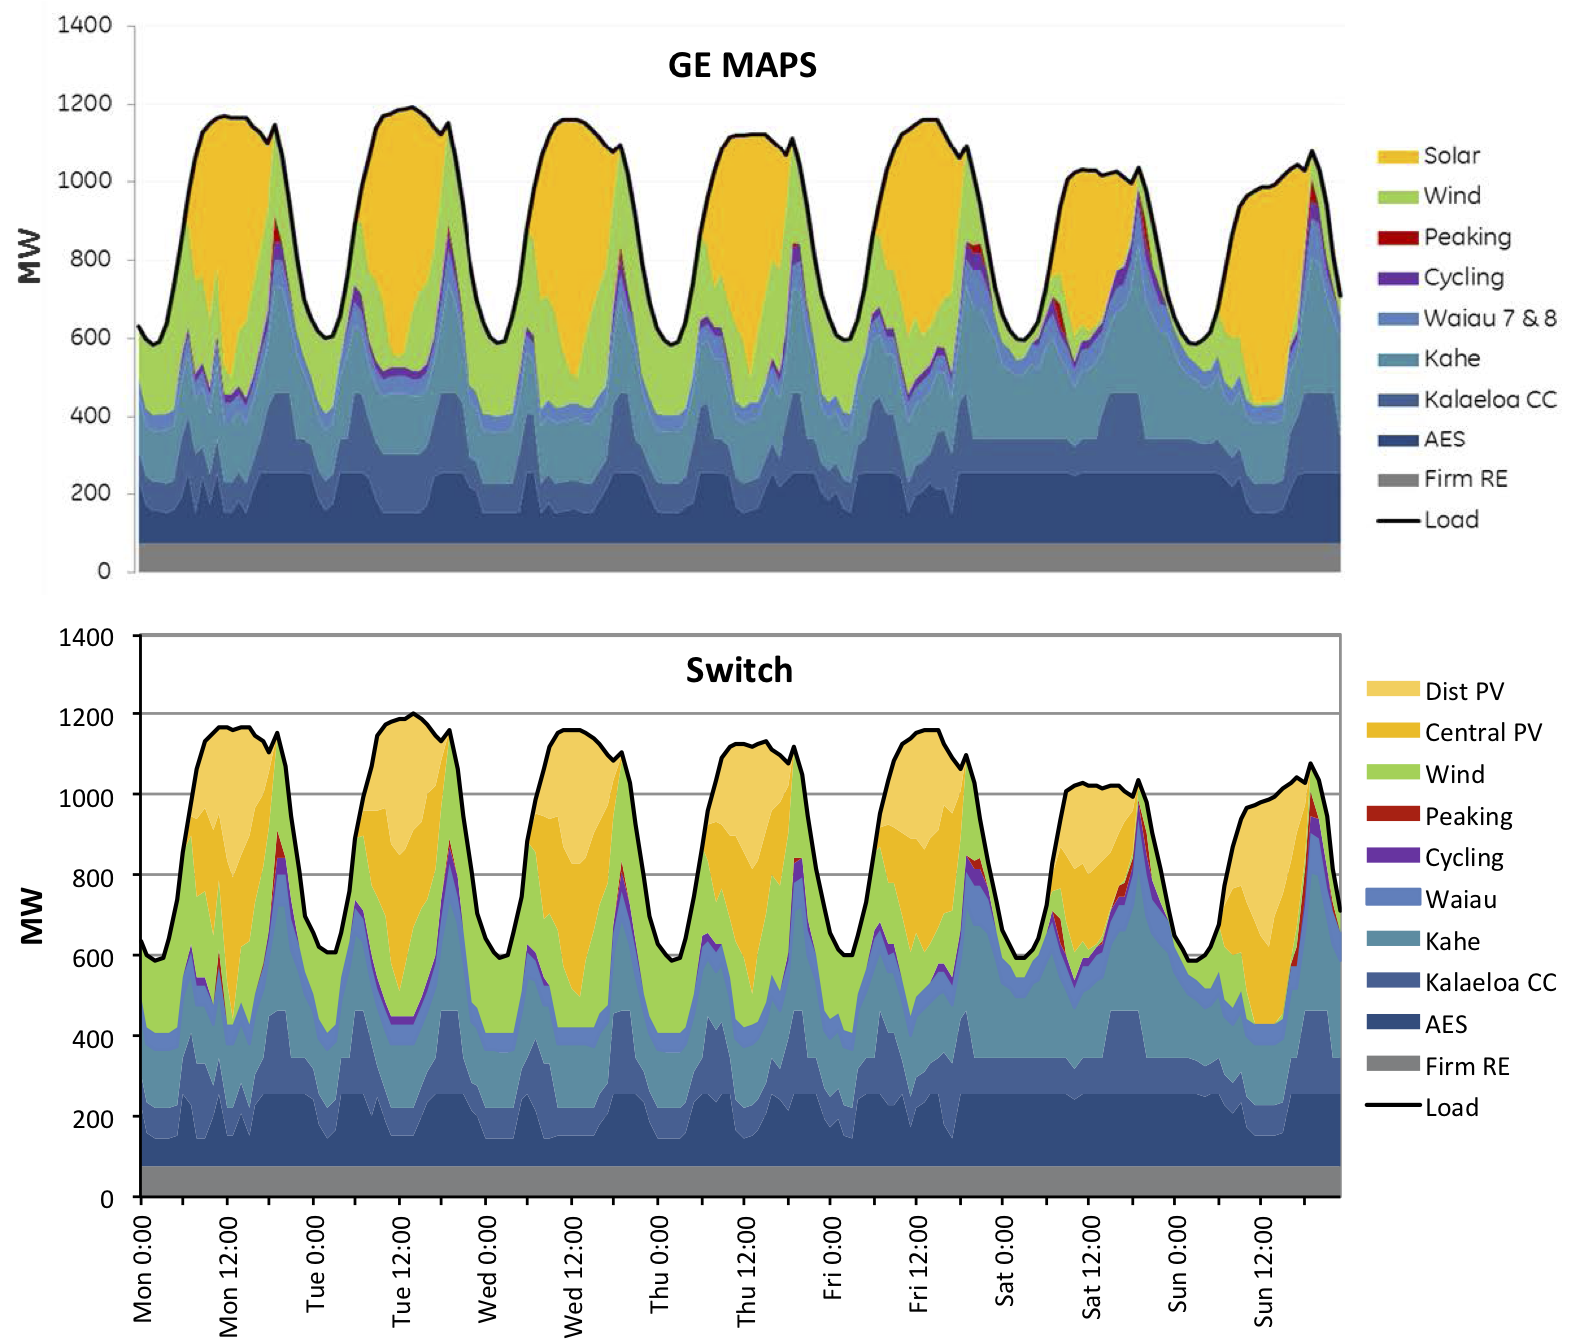
Background: New open-source electric-grid planning models have the potential to improve power system planning and bring a wider range of stakeholders into the planning process for next-generation, high-renewable power systems. However, it has not yet been established whether open-source models perform similarly to the more established commercial models for power system analysis. This reduces their credibility and attractiveness to stakeholders, postponing the benefits they could offer. In this paper, we report the first model intercomparison between an open-source power system model and an established commercial production cost model. Results: We compare the open-source Switch 2.0 to GE Energy Consulting’s Multi Area Production Simulation (MAPS) for production-cost modeling, considering hourly operation under 17 scenarios of renewable energy adoption in Hawaii. We find that after configuring Switch with similar inputs to MAPS, the two models agree closely on hourly and annual production from all power sources. Comparing production gave a coefficient of determination of 0.996 across all energy sources and scenarios, indicating that the two models agree on 99.6% of the variation. For individual energy sources, the coefficient of determination was 69–100. Conclusions: Although some disagreement remains between the two models, this work indicates that Switch is a viable choice for renewable integration modeling, at least for the small power systems considered here. Although some disagreement remains between the two models, this work indicates that Switch is a viable choice for renewable integration modeling, at least for the small power systems considered here.
Keywords:
model intercomparison
; renewable energy
; production cost modeling
; security-constrained unit commitment
; open-source software
Copyright: This open access article is published under a Creative Commons CC BY 4.0 license, which permit the free download, distribution, and reuse, provided that the author and preprint are cited in any reuse.


