
Submitted:
16 November 2026
Posted:
18 November 2026
You are already at the latest version
Abstract
Highway contract-modification records capture administrative activity, positive monetary adjustments, and award-relative financial materiality, but these outcomes answer different engineering-management questions. We reconcile Kentucky Transportation Cabinet procurement and approved change-order records for 2,494 conventional highway contracts observed over the first 730 calendar days after letting. In contractor-clustered models, an award doubling is associated with higher odds of a positive-dollar order (odds ratio 1.381; 95% confidence interval 1.292–1.476). For the 835 contracts with positive additions, conditional gross positive dollars increase by a factor of 1.568 (1.445–1.702), consistent with sub proportional scaling. An award doubling shows no statistically clear association with positive signed-net changes above 5% of award (odds ratio 1.014; 0.929–1.107). Administrative orders occur on 1,726 contracts, versus positive-dollar orders on 835; gross-positive and signed-net 5% classifications differ for only five contracts. Nonlinear, program, and contractor-influence analyses qualify the pooled results. The framework supports separate reporting of ad-ministrative activity, conditional amounts, and positive net changes, not causal claims or validated cost forecasts. Monetary findings depend on source accounting definitions requiring authoritative verification.
Keywords:
highway construction
; engineering management
; change orders
; construction contract administration
; financial modifications
; public procurement
; materiality thresholds
; two-part models
1. Introduction
Contract-change records are widely used in engineering management to monitor administrative workload and monetary exposure. Nevertheless, one recorded approval can represent a nonfinancial administrative action, an addition to an approved financial amount, an offsetting reduction, or a material net change. These observations differ in their unit, denominator, and managerial interpretation. A single change-order score can obscure both administrative activity and the amount and direction of recorded financial adjustments. This study compares these outcomes within a consistent portfolio of Kentucky highway contracts [1,2,3,4].
The meaning of financial change also depends on its comparison baseline. A modification approved after letting is not necessarily an increase in the final paid cost relative to an approved budget or estimate. Work on completed road contracts demonstrates that both escalation incidence and percentage escalation depend on contract scale and baseline definition [5]. The present study instead examines approved administrative entries within a common post-letting window. Its results should consequently be interpreted as early-period contract-record associations, not realized final-project overruns.
The study is motivated by four distinct reporting questions: (i) Has a contract registered any administrative order? (ii) Has it registered a positive-dollar order? (iii) Among contracts with positive additions, what is the amount and the share of award? (iv) Does the signed net increase exceed a specified fraction of award? The first two distinguish administrative occurrence from positive monetary occurrence; the latter two concern differently conditioned financial outcomes. Prior work has modeled change-order occurrence and severity [6,7]. Our contribution is not a new two-part estimator but a consistently defined comparison of those indicators, supplemented by an exploratory occurrence-weighted arithmetic-mean amount.
The study builds on several complementary streams. Historical Kentucky analyses characterize highway change-order patterns [1], while road-contract research distinguishes frequency from proportional financial escalation [5]. Indiana transportation research examines the occurrence, counts, and severity of modifications [7]. Governance-oriented studies also separate occurrence from severity [6], and recurrent-event approaches account more explicitly for changes across project phases [8]. These contributions motivate a common-cohort comparison without implying that its outcomes measure equivalent aspects of project performance.
We reconcile procurement awards and approved-order identifiers, resolve repeated allocation rows, and separate alternative-delivery records whose agreement amounts may reflect staged authorization rather than a full construction award. We observe each eligible conventional contract for the first 730 calendar days after letting. These are approval-ledger associations, not completed-project cost overruns, and the observation window does not establish equal days of active construction. The records do not directly observe design completeness, site conditions, final payments, or managerial interventions.
The study advances engineering-management measurement in three ways. First, the reconciled cohort and explicit linkage exclusions make differences in the reporting population auditable. Second, a common covariate specification estimates positive-dollar occurrence, conditional gross additions, and positive signed-net materiality on their appropriate scales. Third, standardized two-part amounts and nonlinear, work-program, and contractor-influence checks show why a single award-size coefficient cannot stand in for an operational risk score. The central practical implication is a transparent set of complementary indicators that can be reported with their denominators, horizons, and uncertainties; the usefulness of such reporting for decisions remains to be evaluated.
Five questions guide the analysis. RQ1 asks whether original award is associated with positive-dollar occurrence. RQ2 evaluates conditional gross additions in dollars and relative to award. RQ3 assesses positive signed-net increases exceeding illustrative thresholds of 2%, 5%, and 10%. Exploratory RQ4 examines differences across work programs; exploratory RQ5 combines positive-order probability with conditional arithmetic-mean dollars. Figure 1 summarizes the reporting hierarchy and explicitly avoids implying identified causal effects.
1.1. Measurement of Contract Modifications and Cost Change
Contract modifications, cost growth, budget escalation, and final cost overruns are distinct constructs. Final-project overrun analysis requires actual paid expenditure and a clearly identified budget or contract comparator. The choice of financial baseline can materially change reported escalation patterns [5], while project scale and delivery method complicate cross-project comparison [2,9]. Here the available monetary information consists of administrative approval entries; without verified final payments, financial modification is the appropriate description.
Recorded orders may have positive, negative, or zero monetary entries. Zero values may represent authentic nonfinancial modifications, recording conventions, or incomplete fields; the extract cannot reliably distinguish these possibilities. Further, negative entries can offset positive ones when amounts are summed. A defensible reporting hierarchy therefore separates any order, positive-dollar occurrence, gross positive amounts, and signed-net change. None of these categories alone establishes inefficient project management [1,3,10,11]. A construction-industry design-thinking study links knowledge loss and design information-flow problems with change orders and rework, but does not quantify their causal contribution to KYTC approvals [12].
1.2. Contract size, Heterogeneity, and Governance
Original contract award is routinely available in public procurement systems and provides a measure of recorded initial financial scale. It is not a direct indicator of project complexity, design maturity, active construction duration, or managerial capability. Studies of road contracts report scale-related differences in escalation and other project outcomes [2,5,13]. Observed award associations may also reflect the allocation of project types, contract durations, and location-specific conditions. Accordingly, covariate adjustment is used to describe within-portfolio associations, not to identify the causal effect of contract size.
Contract delivery further affects the interpretation of award-normalized adjustments. Comparative highway research identifies differences in the types and magnitudes of orders across delivery methods [9], and design–build evidence examines the predictability of cost, time, and quality [14]. Progressive design-build literature documents distinct procurement and risk-allocation processes [15]; survey-based studies discuss practitioner perceptions of PDB adoption, satisfaction, and risk management [16,17]. These sources motivate attention to delivery context but do not establish the meaning of a KYTC award field. In staged alternative-delivery agreements, an initial design or preconstruction authorization can be followed by major construction authorizations. Large subsequent amounts divided by that small initial baseline need not represent extraordinary escalation in a conventional full-construction contract. For this reason, alternative-delivery agreements are reconciled separately rather than included in the principal award-relative models.
Financial adjustments can arise from scope changes, contract administration, design development, unforeseen conditions, and institutional decisions. Research on governance and project performance identifies mechanisms that cannot be observed reliably in procurement ledgers [18,19,20]. Taxonomies of change causes and measures of modification complexity also caution against a single explanation [21,22]. Complementary supplier-qualification research identifies financial stability, quality systems, technical capabilities, and collaborative capacity as relevant pre-award risk-governance considerations [23,24]. These supplier studies address different evidence and decisions from the post-award KYTC ledger. Because the KYTC extracts lack direct observations of collaboration, supervision, and design completeness, work-program and district categories are used for descriptive adjustment and heterogeneity analysis, not as proxies for managerial effectiveness.
1.3. Occurrence, Financial Magnitude, and Materiality
A two-part representation distinguishes the probability of a positive-dollar modification from the magnitude of its recorded financial additions, conditional on their occurrence [6,7]. A companion comparison examines signed-net positive threshold exceedance. Combining occurrence and conditional arithmetic mean yields a portfolio-standardized illustration of gross positive additions. These indicators have different denominators and describe different populations. Their use as a management dashboard is a proposed interpretation rather than an evaluated intervention.
The ratio of gross additions C to original award A contains A mechanically in its denominator. Thus, an inverse relationship between C/A and A may arise when dollars increase more slowly than award, without demonstrating better management on larger contracts. The problem of denominator-induced associations has long been recognized [25]. We therefore estimate both log-dollar and log-ratio scaling. On identical observations with identical covariates, however, these regressions are algebraic reparameterizations rather than independent corroboration.
Signed-net materiality is defined here as a positive net change exceeding a stated fraction of recorded original award. We examine 2%, 5%, and 10% as sensitivity thresholds spanning relatively small to more consequential proportional increases; they are not official KYTC action triggers, externally validated cutoffs, or optimized intervention rules. We report negative net changes separately rather than treating them as positive overruns.
1.4. Observation Time and Statistical Approaches
Approval events accumulate with elapsed time after letting. Fixed-snapshot analysis otherwise gives older contracts more opportunity to register orders than recently let contracts. Recurrent-event methods explicitly address timing and phase-dependent exposure [8,26]. Our eligibility restriction equalizes the first 730 calendar days after letting, not confirmed active-construction days. Since larger contracts may stay active longer, the estimand is a fixed-calendar-horizon association rather than a lifetime probability or equal-active-exposure construction risk.
Skewed monetary data require separate attention to the estimand and uncertainty model. Log-OLS describes conditional log-scale differences; a Gamma regression with log link targets the conditional arithmetic mean [27]. Contract outcomes may also be correlated within prime contractors, motivating cluster-robust inference [28]. For limited prediction diagnostics, contractor-group-held-out folds reduce within-contractor leakage [29]. Discrimination alone is insufficient for calibrated, transportable prediction [30].
1.5. Evidence Gap and Analytical Contribution
The empirical contribution is to reconcile an administrative highway contracting cohort and compare several related but non-equivalent outcome measures using the same initial-award covariates and an identical post-letting horizon. In the observed ledger, any-order occurrence and positive-dollar occurrence differ substantially, whereas 5% gross-positive and signed-net classifications differ for only five contracts. This supports careful separation of administrative activity, monetary additions, and material positive net changes; it does not, without prospective testing, establish improved management performance or optimal decision thresholds.
2. Materials and Methods
2.1. Data Sources and Unit of Analysis
Four Kentucky Transportation Cabinet (KYTC) TRAK Data Hub CSV extracts were downloaded on 3 November 2026: Construction Procurement (5,257 rows), Agency Construction Change Orders (5,493 rows), Program Management Cost Change (37 rows), and Agency Construction Procurement Alternative Delivery (56 rows). The first two supply the conventional-contract analysis; the program-management file is retained for provenance only, and alternative-delivery records are audited separately (Table 1; Kentucky Transportation Cabinet [31]). The analytical unit is a distinct conventional procurement contract, not a duplicated allocation or order row. The dated inputs, scripts, derived cohort, checksums, and outputs are retained in an author-controlled archive; public redistribution rights and reviewer access to that snapshot have not yet been confirmed.
Repeated procurement rows were collapsed only after checking agreement on award, contractor, letting date, and district; an award was never summed across project-allocation rows. Orders were deduplicated when identifiers repeated with matching approval date, district, reason, and financial entry. The 5,493 raw order rows yield 5,341 distinct order identifiers: 144 identifiers repeat, creating 152 excess rows. Of the distinct orders, 4,144 match a conventional procurement record, whereas 1,197 do not. Among those 1,197, 46 match separately identified alternative-delivery agreements, leaving 1,151 with no comparable conventional baseline. Unmatched orders are concentrated in early approval years; for example, 547 versus 194 unmatched and matched orders occur in 2021, while 322 versus 726 occur in 2022. Time-dependent differences in linkage may affect representativeness and cannot be assumed missing at random. The extracted AWARD_AMOUNT is provisionally treated as the original award and Total_Adjusted_Change_Order as an incremental signed order-level adjustment, although neither accounting meaning has been independently confirmed by KYTC.
The separate alternative-delivery extract contains eight base agreements and 48 suffixed order-like records, 46 of which link to those eight bases. Seven events for agreement 239001 show amounts approximately twice those recorded for the same identifiers in the general change-order file. The alternative-delivery source produces $903.17 million in linked signed net adjustments, but this number is source-dependent and not comparable to conventional full-award change ratios. Because the bases can represent phased authorizations rather than fully committed construction awards, these eight agreements are excluded from conventional award-normalized regression. Two additional alternative-delivery order entries have no base agreement in that extract. These boundaries are retained in the reconciliation ledger, not interpreted as delivery-method performance differences.
2.2. Cohort Selection and Observation Window
The latest recorded approval is dated 30 October 2026. Lettings were eligible if the end of the first 730 calendar days fell no later than that approval cutoff. The study evaluates events whose elapsed calendar-day difference between approval and letting is between 0 and 730, inclusive; thus the event interval includes the letting date and day 730. Of 3,490 unique conventional procurement contracts, 2,496 met the eligibility rule. We excluded one $0.04 original-award record and one singleton Statewide District 99 record using baseline attributes rather than modification outcomes, leaving 2,494 contracts assigned to 115 prime contractors (Table 2). Eligible lettings span 2021–2024, with partial-year coverage in 2024. Calendar eligibility does not establish contract completion or equal active-construction exposure.
The cohort divides into four mutually exclusive contract profiles: 768 with no recorded order, 826 with only zero-dollar orders, 65 with negative orders but no positive order, and 835 with at least one positive-dollar order. They sum to 2,494. Within the 730-day event ledger, 754 administrative, 543 specification, and 295 scope events have recorded zero-dollar amounts (Supplementary Table S2). Reason labels are order classifications, not pre-award predictors. The extract does not establish whether every zero entry is an authorized nonfinancial modification, a reporting convention, or an incomplete financial field; the any-order endpoint is therefore a record-presence measure rather than a validated count of substantive nonfinancial actions.
2.3. Variables and Outcomes
Let Ai denote original contract award (USD), Ci⁺ the sum of positive recorded order amounts, and Ci⁻ the sum of negative signed amounts within 730 days. Then Ni = Ci⁺ + Ci⁻ is signed net recorded adjustment; positive occurrence is 1(Ci⁺ > 0); and the conditional gross positive ratio is for Ci⁺ > 0. Net materiality is , with t = 0.02, 0.05, or 0.10. The terms gross positive and signed net refer to the recorded transaction values—not verified final payments. Their arithmetic requires an unconfirmed assumption that each row's Total_Adjusted_Change_Order value represents an incremental financial adjustment rather than a cumulative total. The analyses are consequently conditional on that accounting interpretation.
For clarity, 'any recorded order' equals one when the linked approval ledger contains at least one event within the common observation window, regardless of its recorded dollar amount. 'Positive-dollar occurrence' requires at least one strictly positive event entry; it is not the same outcome as any order. 'Gross positive additions' sum strictly positive entries, whereas 'signed net' also includes negative entries. The threshold endpoint is positive signed-net exceedance rather than the absolute value of a change. These constructs are descriptive of the ledger and depend on its original accounting semantics.

Table 3.
Recorded-outcome and baseline-covariate definitions. Monetary fields are provisional pending accounting-source confirmation.
Table 3.
Recorded-outcome and baseline-covariate definitions. Monetary fields are provisional pending accounting-source confirmation.
| Construct | Type | Operational definition |
|---|---|---|
| Any recorded order | Binary | 1 if one or more approved order identifiers are recorded within days 0–730 after letting (including zero-dollar entries) |
| Any positive modification | Binary | 1 if positive approved amount occurs within 730 days |
| Gross positive dollars | Continuous | Sum of positive approved adjustments (C+) |
| Signed-net recorded adjustment | Continuous | Sum of positive and negative signed entries within 730 days; depends on incremental-entry assumption |
| Conditional positive ratio | Continuous | C+ / original awarded amount A, for C+>0 |
| Positive signed-net threshold | Binary | 1 if (C+ + C−)/A exceeds 2%, 5%, or 10% |
| Original award | Continuous | log2 of unique contract-level award |
| Work program / district / year | Categorical | Recorded procurement attributes |
| Multi-project status | Binary | More than one allocated project in one contract |
All principal regressions include log2(Ai), so a one-unit increase corresponds to doubling the recorded contract award. Adjustments comprise letting year, work program, district, and a multi-project-allocation indicator. Where multiple programs are assigned without a unique program classification, contracts form a separate multi-program category. These covariates address measured portfolio composition but cannot remove unobserved confounding by duration, project characteristics, procurement arrangements, or physical conditions.
2.4. Statistical Models
Let denote positive-dollar occurrence, where Xi includes letting year, work program, district, and allocation characteristics. Equation (1) specifies the logistic model. The exponentiated coefficient on log2(Ai) is an adjusted odds ratio for an award doubling, not a risk ratio or universal probability difference.
Among 835 contracts with positive recorded amounts, Equation (2) models ln(Ri) using ordinary least squares (OLS) and identical baseline covariates. Exponentiation of its award coefficient gives a conditional geometric-mean multiplier. A Gamma generalized linear model with a log link instead targets the conditional arithmetic-mean ratio [27]. Equation (3) changes the OLS response to ln(Ci⁺) to describe positive-dollar scaling. Because ln(Ci⁺) = ln(Ri) + ln(Ai), the log-dollar and log-ratio models are algebraically equivalent when fitted to the same records with the same covariates; they are not independent robustness tests.
With log2(Ai) as a predictor, the log-dollar coefficient equals the log-ratio coefficient plus ln(2); equivalently, its multiplier is twice the ratio multiplier. Logistic materiality models use the outcomes , with t = 0.02, 0.05, and 0.10, and the same baseline controls. Positive-amount regressions are conditioned on observed occurrence and cannot identify causal effects. Confidence intervals use prime-contractor-clustered sandwich standard errors [28], with 115 clusters for the occurrence cohort and 91 for the positive-only cohort.
For conditional positive dollars, exponentiating the log-OLS award coefficient yields a geometric-scale contrast rather than a direct arithmetic-mean dollar factor. The Gamma log-link regression targets the arithmetic conditional mean on the positive subset. For any binary model, exponentiated logit coefficients represent odds ratios and must not be interpreted as probabilities or risk ratios.
2.5. Diagnostics, Sensitivity, and Reproducibility
The primary horizon covers calendar days 0–730 after letting. Separately eligible 365- and 1,095-day cohorts and a common 1,978-contract sample assess the influence of observation-window eligibility (Supplementary Table S4). Exploratory regressions add a quadratic log-award term or award-by-program interactions; uncertainty comes from contractor-clustered covariance matrices. These extensions are hypothesis-generating secondary analyses. We do not treat the algebraically linked log-dollar and log-ratio coefficients as independent robustness replications [25]. The 2%, 5%, and 10% materiality cutoffs are sensitivity thresholds rather than preregistered or agency-prescribed action limits.
A limited internal prediction exercise uses regularized logistic regression and five-fold stratified contractor-group cross-validation, with AUC and Brier score compared against simpler baselines [29,30]. The results are internal diagnostics, not prospective or external validation. The exploratory two-part model multiplies a fitted positive-order probability by a Gamma log-link conditional arithmetic mean, then averages the resulting profile-specific products over the observed covariate mix. Hypothetical awards can generate uncommon award–program combinations, so the results are not individual forecasts. Uncertainty uses prime-contractor resampling: 1,000 retained draws from 1,013 attempted samples, seed 5021. Both logistics and Gamma fits had to converge within 350 iterations and produce finite, admissible parameters and predictions; 13 attempts were rejected for Gamma nonconvergence and their details were logged. A deterministic replay of all resampled contractor groups showed that the 13 rejected draws had fewer weighted contracts (median 1,626 versus 2,489 among retained draws) and fewer positive-dollar contracts (614 versus 838); this suggests numerical failures may be selective. The percentile intervals are exploratory and conditional on convergence, the assumed field definition, and the analyzed cohort; they do not account for possible selection induced by fit rejection or for accounting or coverage error (Supplementary Table S10). Gamma mean-model influence and Poisson quasi-maximum-likelihood checks remain sensitivity analyses, not source validation.
Computational environment: the supplied reproducibility requirements file specifies pandas 2.2.3, NumPy 2.3.5, statsmodels 0.14.6, SciPy 1.17.0, and scikit-learn 1.8.0. These are the declared dependency targets for reproduction, not independently verified versions used throughout the original development history. Model specifications, feature engineering, bootstrap acceptance criteria, and seeds are documented in the scripts. External reproduction also requires access to the exact historical inputs or an approved equivalent.
For the Gamma mean model, observation-level Cook's distances guide sensitivity analyses; genuine large additions remain in the primary sample unless source records establish an error. We compare full-sample estimates with omission of the largest one, five, and 1% of positive contracts by influence, retain the same covariates and contractor clustering, and compare fitted and observed arithmetic means. A Poisson quasi-maximum-likelihood specification is a further mean-model check (Supplementary Table S9). Because prime-contractor contracts are unevenly distributed, we additionally omit each of the five largest contractor groups in turn from the binary occurrence and conditional log-dollar models. These checks evaluate dependence on individual contractors, not whether financial fields were coded correctly.
2.6. Research Ethics and Generative-AI Assistance
This observational study uses secondary public-sector contract-administration extracts and did not recruit participants or undertake an intervention. Generative AI was not used for this study.
3. Results
3.1. Portfolio Composition and Outcome Prevalence
Among 2,494 conventional contracts, 1,726 (69.2%) have at least one recorded order and 835 (33.5%) have at least one recorded positive-dollar order within 730 calendar days. Of 2,908 ledger events, 1,592 (54.7%) have zero amounts, 1,188 have positive amounts, and 128 have negative amounts. Eight hundred twenty-six contracts have only zero-dollar entries, and 65 have negative entries but no positive order. Conditional on the unverified incremental-entry interpretation, summed positive, negative, and signed-net amounts are approximately $109.88 million, −$7.49 million, and $102.39 million. Positive signed-net additions exceed 2%, 5%, and 10% of recorded awards for 535 (21.5%), 341 (13.7%), and 166 (6.7%) contracts, respectively. These values measure approvals recorded during the study horizon, not audited final payments.
Across award quartiles, the observed positive-order share increases from 23.2% in the lowest to 53.5% in the highest (Table 4; Figure 2). Conditional on a positive recorded order, the median gross-positive amount grows from $10,800 to $95,806, while its median award-relative ratio declines from 6.6% to 2.3% (Figure 3). These descriptive differences combine changing award scale and portfolio composition; they are not within-project effects or evidence of superior management in larger contracts.
3.2. Positive-Modification Occurrence
In the baseline contractor-clustered logistic model, a doubling of recorded award is associated with higher odds of positive-dollar occurrence (odds ratio 1.381; 95% confidence interval [CI] 1.292–1.476; p < 0.001). This describes a 38.1% increase in odds, not a 38.1-percentage-point probability increase. The model adjusts for letting year, work program, district, and multi-project status but does not address unmeasured active construction time, initial design maturity, or contractual complexity. A quadratic log-award term and program interactions indicate that the single pooled slope should not be interpreted as constant across the full portfolio. Deviance pseudo-R² is 0.128, which is not the proportion of ordinary outcome variance explained (Table 5; Figure 4).
A quadratic term in log award is supported in the occurrence model (contractor-clustered p = 0.00121), indicating that the pooled constant-slope odds ratio is an incomplete description. The nonlinear model gives standardized positive-order probabilities of 25.8% (pointwise 95% CI 24.0%–27.7%) at a $280,000 award and 45.0% (41.6%–48.4%) at $2.2 million, averaging over the observed baseline covariate profiles. Figure 5 now shows uncertainty bands; these are conditional model estimates, not calibrated forecasts for new projects. Program-specific award support must be considered before interpreting standardized cross-program contrasts.
3.3. Conditional Monetary Magnitude and Scaling
Under the assumed incremental accounting interpretation, the cohort contains $109.88 million in gross positive recorded modifications. The 25 largest positive-adjustment contracts account for 43.1% of that total and the 50 largest for 57.7%, indicating a highly concentrated monetary distribution. Seven contracts have gross positive additions above their recorded award, including three above twice the award. These high-ratio observations remain in the main analysis, with identifiers and amounts documented in Supplementary Table S8, but their original award and order-record accounting requires direct verification.
Conditional financial results are directionally stable under several truncation sensitivities. The positive-dollar log-OLS multiplier per award doubling is 1.568 in the complete positive subset, 1.590 when gross-positive ratios above 100% are omitted, 1.600 when ratios above 50% are omitted, and 1.529 when the largest 1% of dollar adjustments are omitted. The corresponding Gamma arithmetic-mean multipliers are 1.643, 1.683, 1.703, and 1.564 (Supplementary Table S7). These checks assess coefficient sensitivity but cannot authenticate original awards or extreme order amounts.
Among the 835 contracts with positive recorded amounts, a doubling of award is associated with a conditional gross positive ratio multiplier of 0.784 in the log-OLS model (95% CI 0.723–0.851; p < 0.001), representing a geometric-mean relationship. The Gamma log-link ratio model gives an arithmetic-mean multiplier of 0.822 (0.768–0.879). Log-OLS R² is 0.143, and a Breusch–Pagan test rejects homoskedasticity (p = 5.63 × 10⁻⁵). Conditional positive-dollar amounts exhibit pronounced skewness and influential observations; these features motivate complementary mean-model and influence checks rather than unquestioned reliance on one distributional family.
In the same 835 positive-dollar contracts, the conditional positive-dollar log-OLS multiplier is 1.568 (95% CI 1.445–1.702; p < 0.001). The corresponding award elasticity is approximately 0.649, significantly below one in the fitted specification (Wald test p = 5.20 × 10⁻⁹). The log-dollar and log-ratio results are linked by construction on the same observations and covariates: the dollar multiplier equals twice the ratio multiplier (1.568 = 2 × 0.784). This relationship describes less-than-proportional recorded dollar scaling, not independent confirmation of two distinct mechanisms.
3.4. Integrated Expected Gross Positive Additions
For exploratory RQ5, the two-part expected gross-addition estimate averages contract-profile-specific products of fitted positive-order probabilities and Gamma log-link conditional arithmetic means. At illustrative awards of $170,000, $400,000, $700,000, and $2.2 million, the standardized unconditional amounts are $4,764, $11,449, $19,978, and $59,794; corresponding occurrence probabilities are 22.2%, 29.1%, 34.3%, and 45.8%. Contractor-bootstrap percentile intervals for the dollar estimates are $3,760–$6,390, $9,713–$14,211, $17,344–$24,158, and $49,821–$73,905 (Supplementary Table S3). These are averages of profile-specific products, not products of separately averaged components. Award values can be outside the central range of some work programs: only three of seven programs contain $170,000 and five contain $2.2 million in their respective 10th–90th percentile award intervals. The amounts are illustrative model-standardized contrasts, not prospectively validated forecasts or contingency recommendations.
The Gamma conditional positive-dollar arithmetic-mean multiplier is 1.643 per award doubling (clustered 95% CI 1.536–1.758). A log-link Poisson quasi-maximum-likelihood mean specification gives a similar multiplier of 1.649 (1.515–1.794), without assuming a Poisson variance for dollar amounts. Gamma influence diagnostics identify a maximum Cook's distance of 7.78 and 63 of 835 positive contracts above the heuristic 4/n threshold. Excluding the single most influential observation yields a Gamma multiplier of 1.607 (1.510–1.711); excluding the top five yields 1.654 (1.567–1.746) and excluding the top 1% by Cook's distance yields 1.641 (1.554–1.734). This directional robustness does not verify financial source entries or rule out mean-model misspecification (Supplementary Table S9). Gamma ratio and positive-dollar specifications are algebraically linked under identical predictors and a log link; they are not independent corroboration. The additional outcome is the occurrence-weighted unconditional mean, with bootstrap intervals that represent sampling/model uncertainty under the assumed record interpretation—not uncertainty about KYTC accounting semantics. All 13 previously rejected Gamma fits were numerically recovered in a supplemental sensitivity; interval endpoints changed modestly, while primary results remain unchanged (Table S11).
3.5. Financial Materiality Thresholds
For positive signed-net adjustment exceeding 5% of original award, the adjusted odds ratio per award doubling is 1.014 (95% CI 0.929–1.107; p = 0.759). The estimate is not statistically distinguishable from an odds ratio of one, but neither equivalence nor the absence of an effect follows. The 2% model yields a positive association (odds ratio 1.126; 95% CI 1.060–1.197), whereas the 10% model does not show a clear association (0.966; 0.866–1.077). Thus, the award-size result depends on the definition of positive financial materiality (Table 6). The endpoint concerns positive signed-net increases, not changes of either sign. Fifteen contracts have a net reduction larger than 5% of award in absolute magnitude, and seven exceed 10% in the negative direction. An absolute net-change rule would classify 356 contracts above 5% and 173 above 10% but would combine increases and decreases with different implications.
Positive signed-net and gross-positive materiality classify different monetary constructs, because negative entries can offset additions. The recorded gross-positive share exceeds 5% for 346 contracts, versus signed-net positive exceedance for 341; only five cross the first cutoff without crossing the second. Fifty-four contracts contain both positive and negative entries. The three positive net thresholds are descriptive sensitivity choices, not KYTC intervention rules; their estimated associations should not be combined into a single universal materiality result. None measures verified final cost escalation.
3.6. Work-Program Heterogeneity
Observed positive-order occurrence is highest in Highway Improvement (68.3%), followed by Bridge Asset Management (51.0%), Safety (43.6%), Pavement Asset Management (28.5%), Rural Roads Projects (25.7%), and Other (24.8%). Highway Improvement also has a substantially larger median award (approximately $6.24 million), underscoring why unadjusted program comparisons should not be attributed to management quality. All seven program categories, including Multi-program, are summarized in Table 7.
The exploratory joint contractor-clustered award-by-program interaction test rejects equal occurrence slopes across work programs (p = 0.00732). Per award doubling, estimated odds ratios (95% CI) are 1.59 (1.31–1.94) for Safety, 1.54 (1.26–1.88) for Bridge Asset Management, 1.49 (1.25–1.78) for Highway Improvement, 1.38 (1.27–1.49) for Pavement Asset Management, and 0.90 (0.61–1.32) for Rural Roads Projects. Figure 6 displays all seven adjusted program estimates, with full results in Supplementary Table S5. A confidence interval including one for one program does not itself show that its effect differs significantly from another program. Interaction results are exploratory and cannot identify unobserved governance or physical mechanisms.
3.7. Stability, Internal Validation, and Delivery-Method Boundaries
Across separately eligible cohorts, occurrence odds ratios per award doubling are 1.249, 1.381, and 1.416 at 12, 24, and 36 months; corresponding conditional positive-ratio multipliers are 0.681, 0.784, and 0.810 (Table 8). In the fixed 1,978-contract cohort, the respective occurrence odds ratios are 1.301, 1.392, and 1.416 and ratio multipliers are 0.719, 0.789, and 0.810 (Supplementary Table S4). Directional agreement is reassuring but does not make the cohorts equivalent in active-construction exposure or correct record linkage limitations.
In five-fold contractor-held-out internal cross-validation, the full baseline-feature classifier achieves mean AUC 0.715 and mean Brier score 0.193. Simpler models yield AUC/Brier of 0.528/0.222 (year only), 0.651/0.204 (award only), and 0.666/0.201 (award plus program). Across folds, the full AUC ranges from 0.612 to 0.766. Figure 7 illustrates pooled decile calibration, but these internal results do not establish transportability to future contract cohorts, agency-specific decision thresholds, or effectiveness of a deployed system (Supplementary Table S6).
The prime-contractor distribution is concentrated: the median contractor appears on four contracts, the largest appears on 272, and the ten largest contractor groups account for 57.0% of contracts. Repeating the baseline occurrence and conditional positive-dollar log-OLS analyses while excluding each of the five largest contractors individually yields occurrence odds ratios from 1.361 to 1.404 and conditional dollar multipliers from 1.562 to 1.577 (Table 9). This new analysis was fitted to the archived contract-level cohort with the same covariates and contractor-clustered covariance; it assesses concentration-driven influence but not causal validity or source accounting.
A distinct data-coverage limitation arises in the alternative-delivery reconciliation. Forty-six approval-like events match eight base agreements in that extract and sum to $903.17 million under the alternative-delivery source's accounting. Seven amounts for agreement 239001 are approximately twice those of corresponding general change-order records; the descriptive total is therefore source dependent. Two further alternative-delivery entries lack a base in that extract. An additional 1,151 distinct change-order identifiers have no comparable conventional-procurement baseline and were not silently recoded as zero-order contracts. These records are excluded from the main regression cohort. Table 10 summarizes the calendar-year pattern of linked and unlinked general-procurement order identifiers, emphasizing an important boundary on cohort representativeness.
4. Discussion
4.1. Contribution Relative to Existing Highway Evidence
The central contribution is a coherent comparison of distinct administrative-record outcomes rather than a new statistical estimator or a universal contract-size rule. Existing occurrence–severity research [6,7] and completed-road-contract evidence [5] establish important precedents, but they do not use this same KYTC contract cohort, post-letting observation horizon, and set of positive occurrence, conditional geometric and arithmetic amounts, unconditional amounts, and signed-net threshold indicators. The value for engineering management lies in not conflating these measures, explicitly showing their denominators, and identifying where the same baseline predictor has different associations. The interpretation depends on validity of the recorded financial fields.
The difference between any recorded order and a positive-dollar order is especially consequential for portfolio reporting: 1,726 versus 835 contracts meet these definitions. The 1,592 zero-dollar events require record-level validation before they are described as verified nonfinancial modifications. Gross-versus-net status at 5% differs for just five contracts, so large-scale threshold reclassification is not the contribution. Rather, the empirical evidence makes clear why reporting 'changed contract,' 'positive financial addition,' and 'net change above 5%' as interchangeable risk counts would be misleading. The analysis does not estimate staffing needs or test management interventions.
4.2. Distinguishing Financial Exposure from Materiality
In the positive-dollar subset, the conditional log-OLS award elasticity is approximately 0.649, so additions grow less than proportionally with award in the fitted specification. Consequently, the corresponding positive-addition ratio decreases as award increases; the denominator creates a necessary algebraic connection rather than independent evidence of better management. The two-part standardized amounts reflect both changing occurrence probability and conditional arithmetic-mean addition. They are not contract-level forecasts, estimates of final paid overrun, or recommended contingency allowances.
Signed-net threshold status addresses a distinct question, but its 5% classification differs only modestly from gross-positive status in this cohort: 346 contracts exceed the gross-positive cutoff and 341 exceed the signed-net cutoff. The adjusted 5% signed-net award coefficient is not statistically distinguishable from one; this does not establish equivalence. Differences across the 2%, 5%, and 10% thresholds show that a single universal materiality rule is not supported. The thresholds should not be presented as agency-prescribed action triggers.
4.3. Influence of Construction Context
Work-program interactions show heterogeneity in the recorded association between award and occurrence, but those groups vary widely in award range and sample size. The results cannot identify effects of procurement governance, management competence, site conditions, or construction duration. A more defensible reporting practice is to display work-program composition and award support with pooled coefficients, rather than rank program managers based on unadjusted rates [18,19,21].
Alternative-delivery agreements illustrate why baseline construction matters. Initial authorizations may cover preconstruction or staged work rather than the full contract scope. Dividing later construction authorizations by such a limited baseline can create ratios that are not comparable with conventional procurement awards [9,14]. PDB research further illustrates that stage-gated pricing, early risk identification, and organizational experience influence how project stakeholders interpret delivery performance [15,16,17]. Those qualitative and perception-based findings should not be used to extrapolate monetary effects to the conventional-contract cohort. Separating the eight audited alternative-delivery base agreements from the regression cohort improves interpretability without claiming an advantage or disadvantage of any delivery method.
4.4. Measurement and Management Implications
A contract-level reporting view can retain separate flags for any administrative order, any positive-dollar order, summed gross positive additions, and positive signed-net changes beyond a stated fraction of award. The respective counts here are 1,726, 835, and 341 for any order, positive order, and signed-net increase above 5%; gross-positive dollars are conditional on the field accounting interpretation. Table 11 maps each measure to a management question, its necessary denominator, and the inference it cannot establish. For example, a manager could inspect a contract with several recorded administrative actions but no positive addition without automatically treating it as an overrun or evidence of poor performance. The proposed reporting sequence has not been tested for decision accuracy or cost savings.
The proposed dashboard would preserve record type, monetary direction, original-award baseline, observation horizon, and uncertainty rather than compressing them into a single risk index. If source definitions are confirmed, its model-based optional component could display profile-standardized unconditional gross-addition means with explicit common-support warnings. Such reporting could complement upstream supplier qualification and workforce knowledge practices discussed elsewhere [12,23,24], but those mechanisms are not measured by the KYTC ledger. This is a reporting-design implication, not evidence that an intervention improves construction outcomes.
Contractor-group-held-out cross-validation yields moderate discrimination but is limited to internal folds, not future letting periods or other agencies. AUC and Brier scores do not establish operational calibration under dataset shift or demonstrate that a chosen escalation threshold improves decisions. Richer recurrent-event and change-propagation approaches address complementary questions [8,32,33,34]. The present study prioritizes auditable outcome definitions and transparent uncertainty over a claimed competition with deployed prediction systems.
4.5. Limitations and Interpretation Boundaries
The monetary analysis remains conditional on unconfirmed accounting semantics. In particular, Total_Adjusted_Change_Order is provisionally summed as an incremental signed entry, while AWARD_AMOUNT is provisionally treated as the original award at letting. If either assumption is wrong, the monetary outcomes, award-normalized ratios, and fitted models must be reconstructed. Seven conventional contracts show gross positive amounts above the recorded original award, including three above 200%; their original award and approval documents require validation. The meanings of 1,592 zero-dollar events have not been established through original-record review. Of 5,341 distinct order identifiers, 1,197 lack a general-procurement baseline, including 46 alternative-delivery matches; the remaining 1,151 may reflect systematically incomplete coverage. The fixed 730-day calendar horizon does not equal measured active-construction exposure, and final payments are not available. Therefore, the study supports conditional statements about historical administrative entries, not verified final cost overruns.
The positive-only amount analysis is selected on occurrence and highly concentrated in a modest number of high-value contracts. Sensitivity analyses, including omitted influential observations, a Poisson quasi-mean alternative, and the newly added leave-one-largest-contractor-out checks, preserve the broad direction of the award associations but cannot eliminate selection bias or source misclassification. Program interactions and nonlinear associations qualify pooled slopes. Thirteen of 1,013 contractor-bootstrap Gamma fits were originally rejected; the rejected weighted resamples tended to be smaller and had fewer positive-dollar contracts. A numerical recovery sensitivity changed percentile endpoints only modestly but does not address accounting-definition error or the possibility of selective rejection. The standardized dollar scenarios have limited program-specific common support. These observational, internally validated findings require independent historical and external validation before use as a decision system.
5. Conclusions
This study examines 2,494 conventional Kentucky highway contracts within a common 730-calendar-day post-letting window and finds different award associations for the occurrence, conditional magnitude, and positive signed-net materiality of recorded changes. A doubling of recorded award is associated with an odds ratio of 1.381 for positive-dollar occurrence and a conditional positive-dollar geometric-scale multiplier of 1.568, consistent with subproportional dollar scaling; the award-relative result is its algebraic counterpart. At the illustrative 5% positive signed-net threshold, the adjusted odds ratio of 1.014 (95% CI 0.929–1.107) is not statistically distinguishable from one. Nonlinear, program, window, and contractor-sensitivity analyses limit any universal size interpretation. Exploratory two-part arithmetic-mean estimates provide standardized illustrative contrasts, not forecasts for specific contracts.
For engineering managers, the immediate contribution is a reporting framework that distinguishes any recorded administrative order from positive-dollar occurrence, conditionally positive financial additions, and positive signed-net thresholds. In the available data, 1,726 contracts have some recorded administrative activity, but only 835 have a positive-dollar order; five contracts differ between gross-positive and signed-net classification above 5%. Because outcomes refer to different denominators and observation conditions, they should not be interpreted interchangeably or as a validated risk score. Monetary interpretation remains conditional on confirmation of KYTC accounting meanings. Future research should validate original awards and orders, measure actual active-construction exposure and final payments, replicate the approach on later cohorts, and test whether outcome-differentiated reporting improves management decisions.
Supplementary Materials
Supplementary Methods and Results (Sections S1–S10, Table S1–S11, and associated code and derived summaries) accompanies this manuscript. The historical KYTC snapshot and analytical cohort remain in an author-controlled archive subject to data-release and reviewer-access determinations.
Author Contributions
Conceptualization, M.A. and K.H.; methodology, M.A. and K.H.; validation, M.A. and K.H.; formal analysis, M.A. and K.H.; investigation, M.A. and K.H.; data curation, M.A. and K.H.; writing—original draft preparation, M.A. and K.H.; writing—review and editing, M.A. and K.H.; visualization, M.A. and K.H. Both authors contributed equally to this work.
Funding
This research received no external funding.
Institutional Review Board Statement
Not applicable to this secondary analysis of publicly accessible construction administrative records; no human participants were recruited or intervened upon.
Informed Consent Statement
Not applicable; this study did not involve human-participant recruitment or identifiable personal study responses.
Data Availability Statement
The analysis relies on four dated Kentucky Transportation Cabinet TRAK Data Hub exports downloaded on 3 November 2026 (https://trak.kytc.ky.gov/data-hub). The authors retain the dated source files, their SHA-256 checksums, the reconstructed contract-level cohort, scripts, and derived outputs in an author-controlled archive. Reproducibility scripts and derived summary results were prepared for review, but the dated source snapshots and contract-level cohort have not been established as publicly accessible, and a stable repository identifier or authorized external-access arrangement has not been confirmed. The public portal may provide more recent exports rather than the exact historical snapshot analyzed here. The analytical variable dictionary documents the authors' transformations and does not establish KYTC's underlying accounting definitions; those definitions require authoritative verification.
References
- Taylor, T.R.B.; Uddin, M.; Goodrum, P.M.; McCoy, A.; Shan, Y. Change Orders and Lessons Learned: Knowledge from Statistical Analyses of Engineering Change Orders on Kentucky Highway Projects. J. Constr. Eng. Manag. 2012, 138(12), 1360–1369. [Google Scholar] [CrossRef]
- Shrestha, B.; Shrestha, P.P.; Maharjan, R.; Gransberg, D. Cost, Change Order, and Schedule Performance of Highway Projects. J. Leg. Aff. Disput. Resolut. Eng. Constr. 2022, 14(1). [Google Scholar] [CrossRef]
- Assaad, R.H.; Ahmed, M.O.; El-adaway, I.H.; Shrestha, P.P. Management of Change Orders in Infrastructure Transportation Projects. Pract. Period. Struct. Des. Constr. 2022, 27(1), 05021006. [Google Scholar] [CrossRef]
- Anastasopoulos, P.C.; Labi, S.; Bhargava, A.; Bordat, C.; Mannering, F.L. Frequency of Change Orders in Highway Construction Using Alternate Count-Data Modeling Methods. J. Constr. Eng. Manag. 2010, 136(8), 886–893. [Google Scholar] [CrossRef]
- Welde, M.; Dahl, R.E. Cost Escalation in Road Construction Contracts. Transp. Res. Rec. 2021, 2675(9), 1006–1015. [Google Scholar] [CrossRef]
- Al-Btoush, M.A.K.A.; Almashaqbeh, H.K.; Rawashdeh, T.M.; Aldiabat Al-Btoosh, J.A.; Al Shalout, I.; Alsubeh, M.A. Institutional Gatekeeping and Change Order Prevention in Public Infrastructure Projects: Evidence from a Governance Reform in Jordan. Front. Built Environ. 2026, 12, 1840012. [Google Scholar] [CrossRef]
- Padhye, S.; Sharma, A.; Arefkhani, H.; Benny, D.; Gkritza, K.; Labi, S.; Hastak, M. INDOT Project Change Orders: Root Causes and Recommendations. In Purdue University Joint Transportation Research Program, Report FHWA/IN/JTRP-2024/14; 2024. [Google Scholar] [CrossRef]
- Oh, J.; Touran, A.; D’Angelo, D.; Clark, T.; Fisher, C.; Gaskins, C.; Ashuri, B. Machine Learning–Enhanced Recurrent Event Modeling for Change Order Recurrence in Highway Construction. J. Manag. Eng. 2025, 41(5). [Google Scholar] [CrossRef]
- Alleman, D.; Antoine, A.L.C.; Stanford, M.S.; Molenaar, K.R. Project Delivery Methods’ Change-Order Types and Magnitudes Experienced in Highway Construction. J. Leg. Aff. Disput. Resolut. Eng. Constr. 2020, 12(2). [Google Scholar] [CrossRef]
- Fulton, G.; Mitropoulos, P. Frequency and Magnitude of Cost Growth in Public Works Contracts. Prof. Constr. 2021, 46(1), 5. [Google Scholar] [CrossRef]
- Ahmed, M.O.; Assaad, R.H.; El-adaway, I.H.; Echele, E.; Govro, K.; Watson, J. Administering Change Orders in Highway Projects. J. Leg. Aff. Disput. Resolut. Eng. Constr. 2022, 14(2). [Google Scholar] [CrossRef]
- Celoza, A.; Alazzam, M. Addressing the Impacts of an Inexperienced Workforce to Improve Project Delivery. In Proceedings of the Joint CSCE Construction Specialty and Construction Research Congress 2025, Montreal, QC, Canada, 28–31 July 2025; pp. Paper CON–051. [Google Scholar] [CrossRef] [PubMed]
- Odeck, J. Cost Overruns in Road Construction—What Are Their Sizes and Determinants? Transp. Policy 2004, 11(1), 43–53. [Google Scholar] [CrossRef]
- Aass, T.S.; Welde, M.; Engebø, A.; Haaskjold, H. Predictability of Cost, Time and Quality in Design–Build Construction Contracts: Evidence from 100 Public Projects. Int. J. Constr. Manag. 2026. [Google Scholar] [CrossRef]
- Alazzam, M.; Celoza, A.; Molenaar, K.R. Progressive Design-Build Opportunities and Challenges: A Literature Review. In Proceedings of the Joint CSCE Construction Specialty and Construction Research Congress 2025, Montreal, QC, Canada, 28–31 July 2025; pp. Paper CON–042. [Google Scholar] [CrossRef] [PubMed]
- Alazzam, M.; Celoza, A.; Molenaar, K.R. Evaluating Progressive Design-Build Trends and Satisfaction in the US Construction Industry. In Proceedings of the Construction Research Congress 2026; American Society of Civil Engineers: Reston, VA, USA, 2026; pp. 212–221. [Google Scholar] [CrossRef]
- Alazzam, M.; Celoza, A.; Molenaar, K.R. Risk Allocation and Management in Progressive Design-Build: A Comparative and Qualitative Analysis. In Proceedings of the Construction Research Congress 2026; American Society of Civil Engineers: Reston, VA, USA, 2026; pp. 202–211. [Google Scholar] [CrossRef]
- Zheng, X.; Hu, X.; Wu, C.; Li, Y.; Yang, D. Revisiting the Relationships between Governance Mechanisms and Project Performance: Meta-Analysis of Main and Moderating Effects. J. Constr. Eng. Manag. 2025, 151(11). [Google Scholar] [CrossRef]
- Luo, Y.; Chen, Y. How Does Contractual Governance Affect Construction Project Performance? The Mediating Role of the Contractor’s Behavior. J. Asian Archit. Build. Eng. 2025, 24(5), 3879–3897. [Google Scholar] [CrossRef]
- Hosseinian, S.M.; Tavakoli, M. Markets, Hierarchies, or Hybrids as Alternative Governance Structures in Construction Contracts: Transaction Cost Economics Analysis. J. Constr. Eng. Manag. 2023, 149(1). [Google Scholar] [CrossRef]
- Birgonul, Z.; Budayan, C.; Koc, K. Development of a Taxonomy for Causes of Changes in Construction Projects. Buildings 2024, 14(1), 278. [Google Scholar] [CrossRef]
- Nguyen, V.N.; Peansupap, V.; Tongthong, T. Complexity Measurement Framework for Change Orders in Construction Projects: Case Study of Vietnam. J. Eng. Des. Technol. 2025, 23(6), 2082–2104. [Google Scholar] [CrossRef]
- Celoza, A.; Alazzam, M. Managing Risk, Innovation, and Collaboration through Supplier Qualification. J. Constr. Eng. Manag. 2026, 152(1), 04025223. [Google Scholar] [CrossRef]
- Alazzam, M.; Celoza, A. Current State of Supplier Qualification in Capital Projects: Factors, Practices, and Industry Perspectives. J. Constr. Eng. Manag. 2026, 152(8), 04026111. [Google Scholar] [CrossRef]
- Kronmal, R.A. Spurious Correlation and the Fallacy of the Ratio Standard Revisited. J. R. Stat. Soc. Ser. A 1993, 156(3), 379–392. [Google Scholar] [CrossRef]
- Oh, J.; Touran, A.; D’Angelo, D.; Clark, T.; Gaskins, C.; Ashuri, B. A Comprehensive Analysis of Change Orders Based on Project Progress in Design-Build Highway Construction. In Proceedings of the Construction Research Congress, 2024, 2024. [Google Scholar] [CrossRef]
- Manning, W.G.; Mullahy, J. Estimating Log Models: To Transform or Not to Transform? J. Health Econ. 2001, 20(4), 461–494. [Google Scholar] [CrossRef] [PubMed]
- Cameron, A.C.; Miller, D.L. A Practitioner’s Guide to Cluster-Robust Inference. J. Hum. Resour. 2015, 50(2), 317–372. [Google Scholar] [CrossRef]
- Roberts, D.R.; Bahn, V.; Ciuti, S.; et al. Cross-Validation Strategies for Data with Temporal, Spatial, Hierarchical, or Phylogenetic Structure. Ecography 2017, 40(8), 913–929. [Google Scholar] [CrossRef]
- Van Calster, B.; McLernon, D.J.; van Smeden, M.; Wynants, L.; Steyerberg, E.W. Calibration: The Achilles Heel of Predictive Analytics. BMC Med. 2019, 17, 230. [Google Scholar] [CrossRef] [PubMed]
- Kentucky Transportation Cabinet. TRAK Data Hub: Construction Procurement, Change Orders, Cost Comparison, and Alternative Delivery Data. Available online: https://trak.kytc.ky.gov/data-hub (accessed on 3 November 2026).
- Oh, J.; Ashuri, B. Explainable AI-Driven Expert System for Impact Profiling of Contract Modifications in Construction Projects. Expert Syst. With Appl. 2026, 318, 132030. [Google Scholar] [CrossRef]
- Padhye, S.; Benny, D.; Labi, S.; Hastak, M. Modeling the Propagating Effects of Errors and Omissions in Highway Transportation Projects: Methodology and Case Study. J. Manag. Eng. 2026, 42(3). [Google Scholar] [CrossRef]
- Arashida, R.; Horita, M. A Data-Driven Framework for Causal Modeling of Design Change Propagation in Civil Infrastructure. J. Constr. Eng. Manag. 2026, 152(10). [Google Scholar] [CrossRef]
Figure 1.
Complementary indicators from a common contract cohort. The arrows describe a reporting sequence only and do not imply causation, validated managerial intervention, or a single composite risk score.
Figure 1.
Complementary indicators from a common contract cohort. The arrows describe a reporting sequence only and do not imply causation, validated managerial intervention, or a single composite risk score.
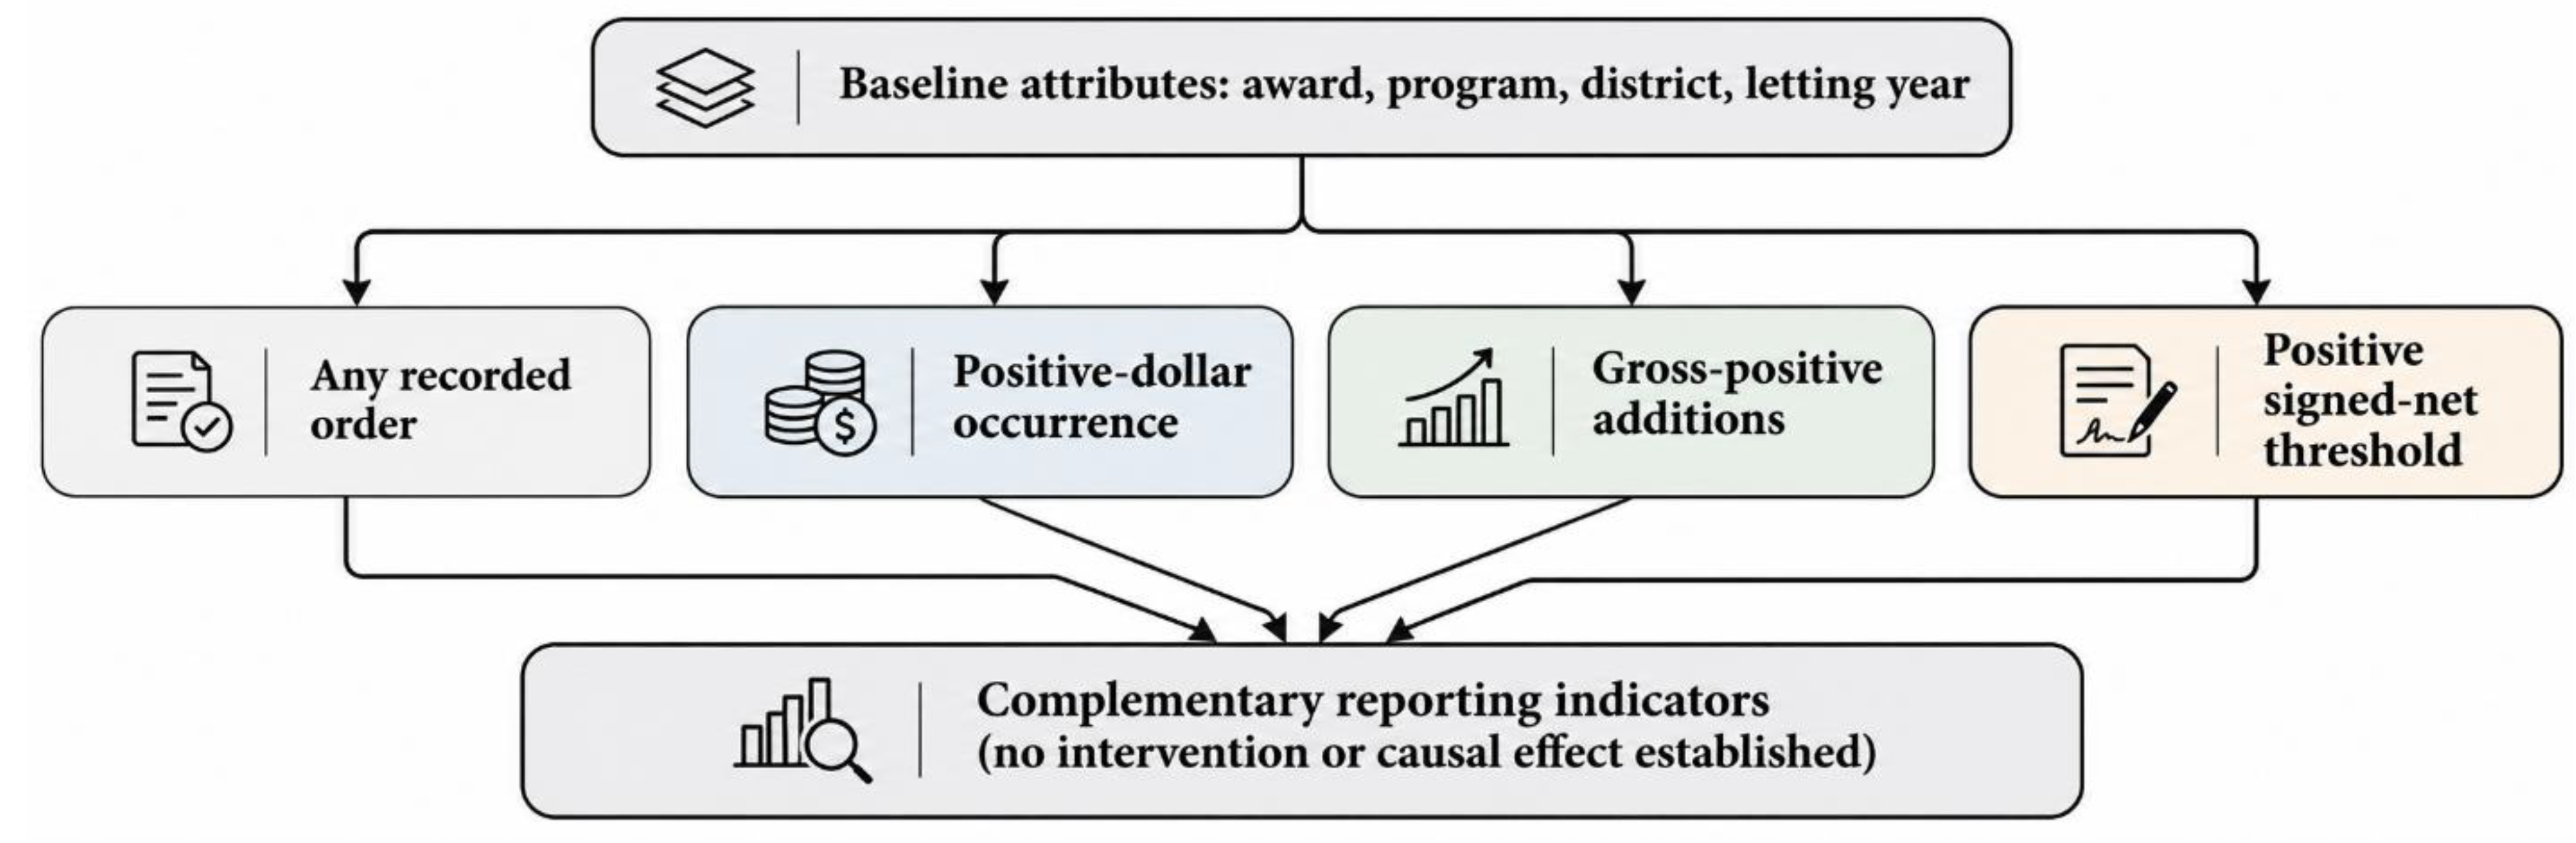
Figure 2.
Observed incidence of positive-dollar modifications by original contract award quartile, with Wilson 95% binomial confidence intervals.
Figure 2.
Observed incidence of positive-dollar modifications by original contract award quartile, with Wilson 95% binomial confidence intervals.
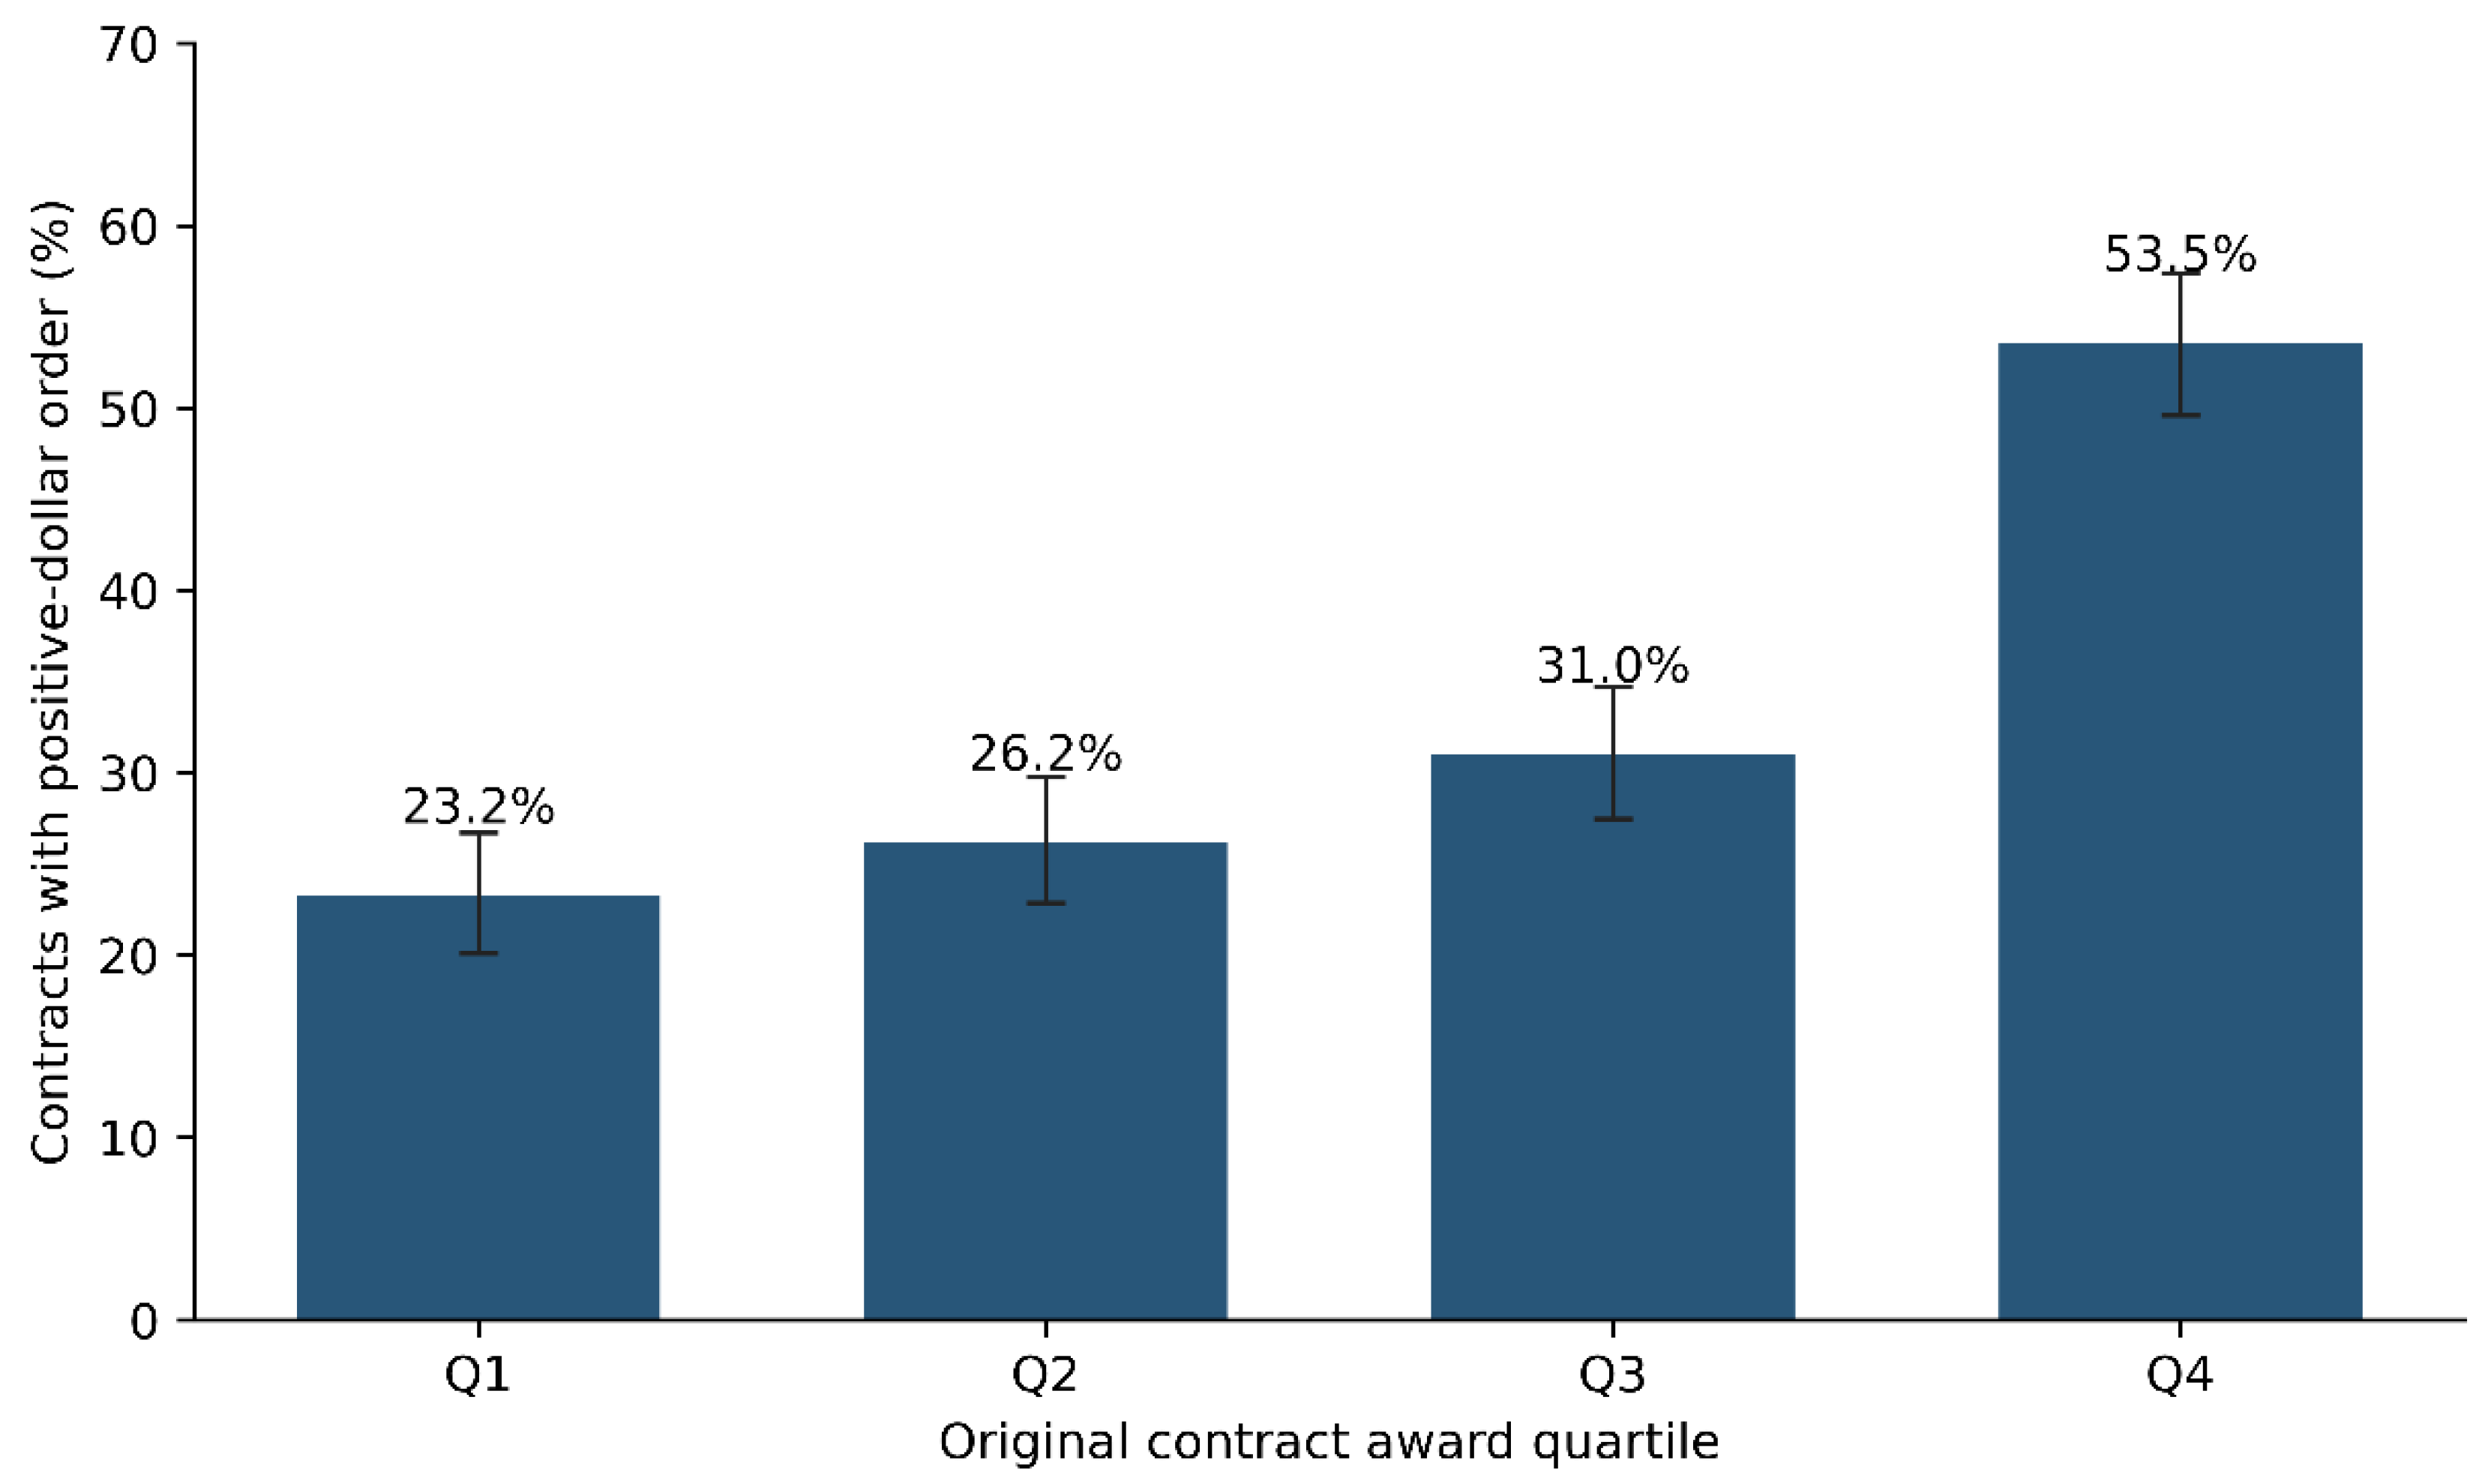
Figure 3.
Conditional median gross positive modification ratio by original contract award quartile.
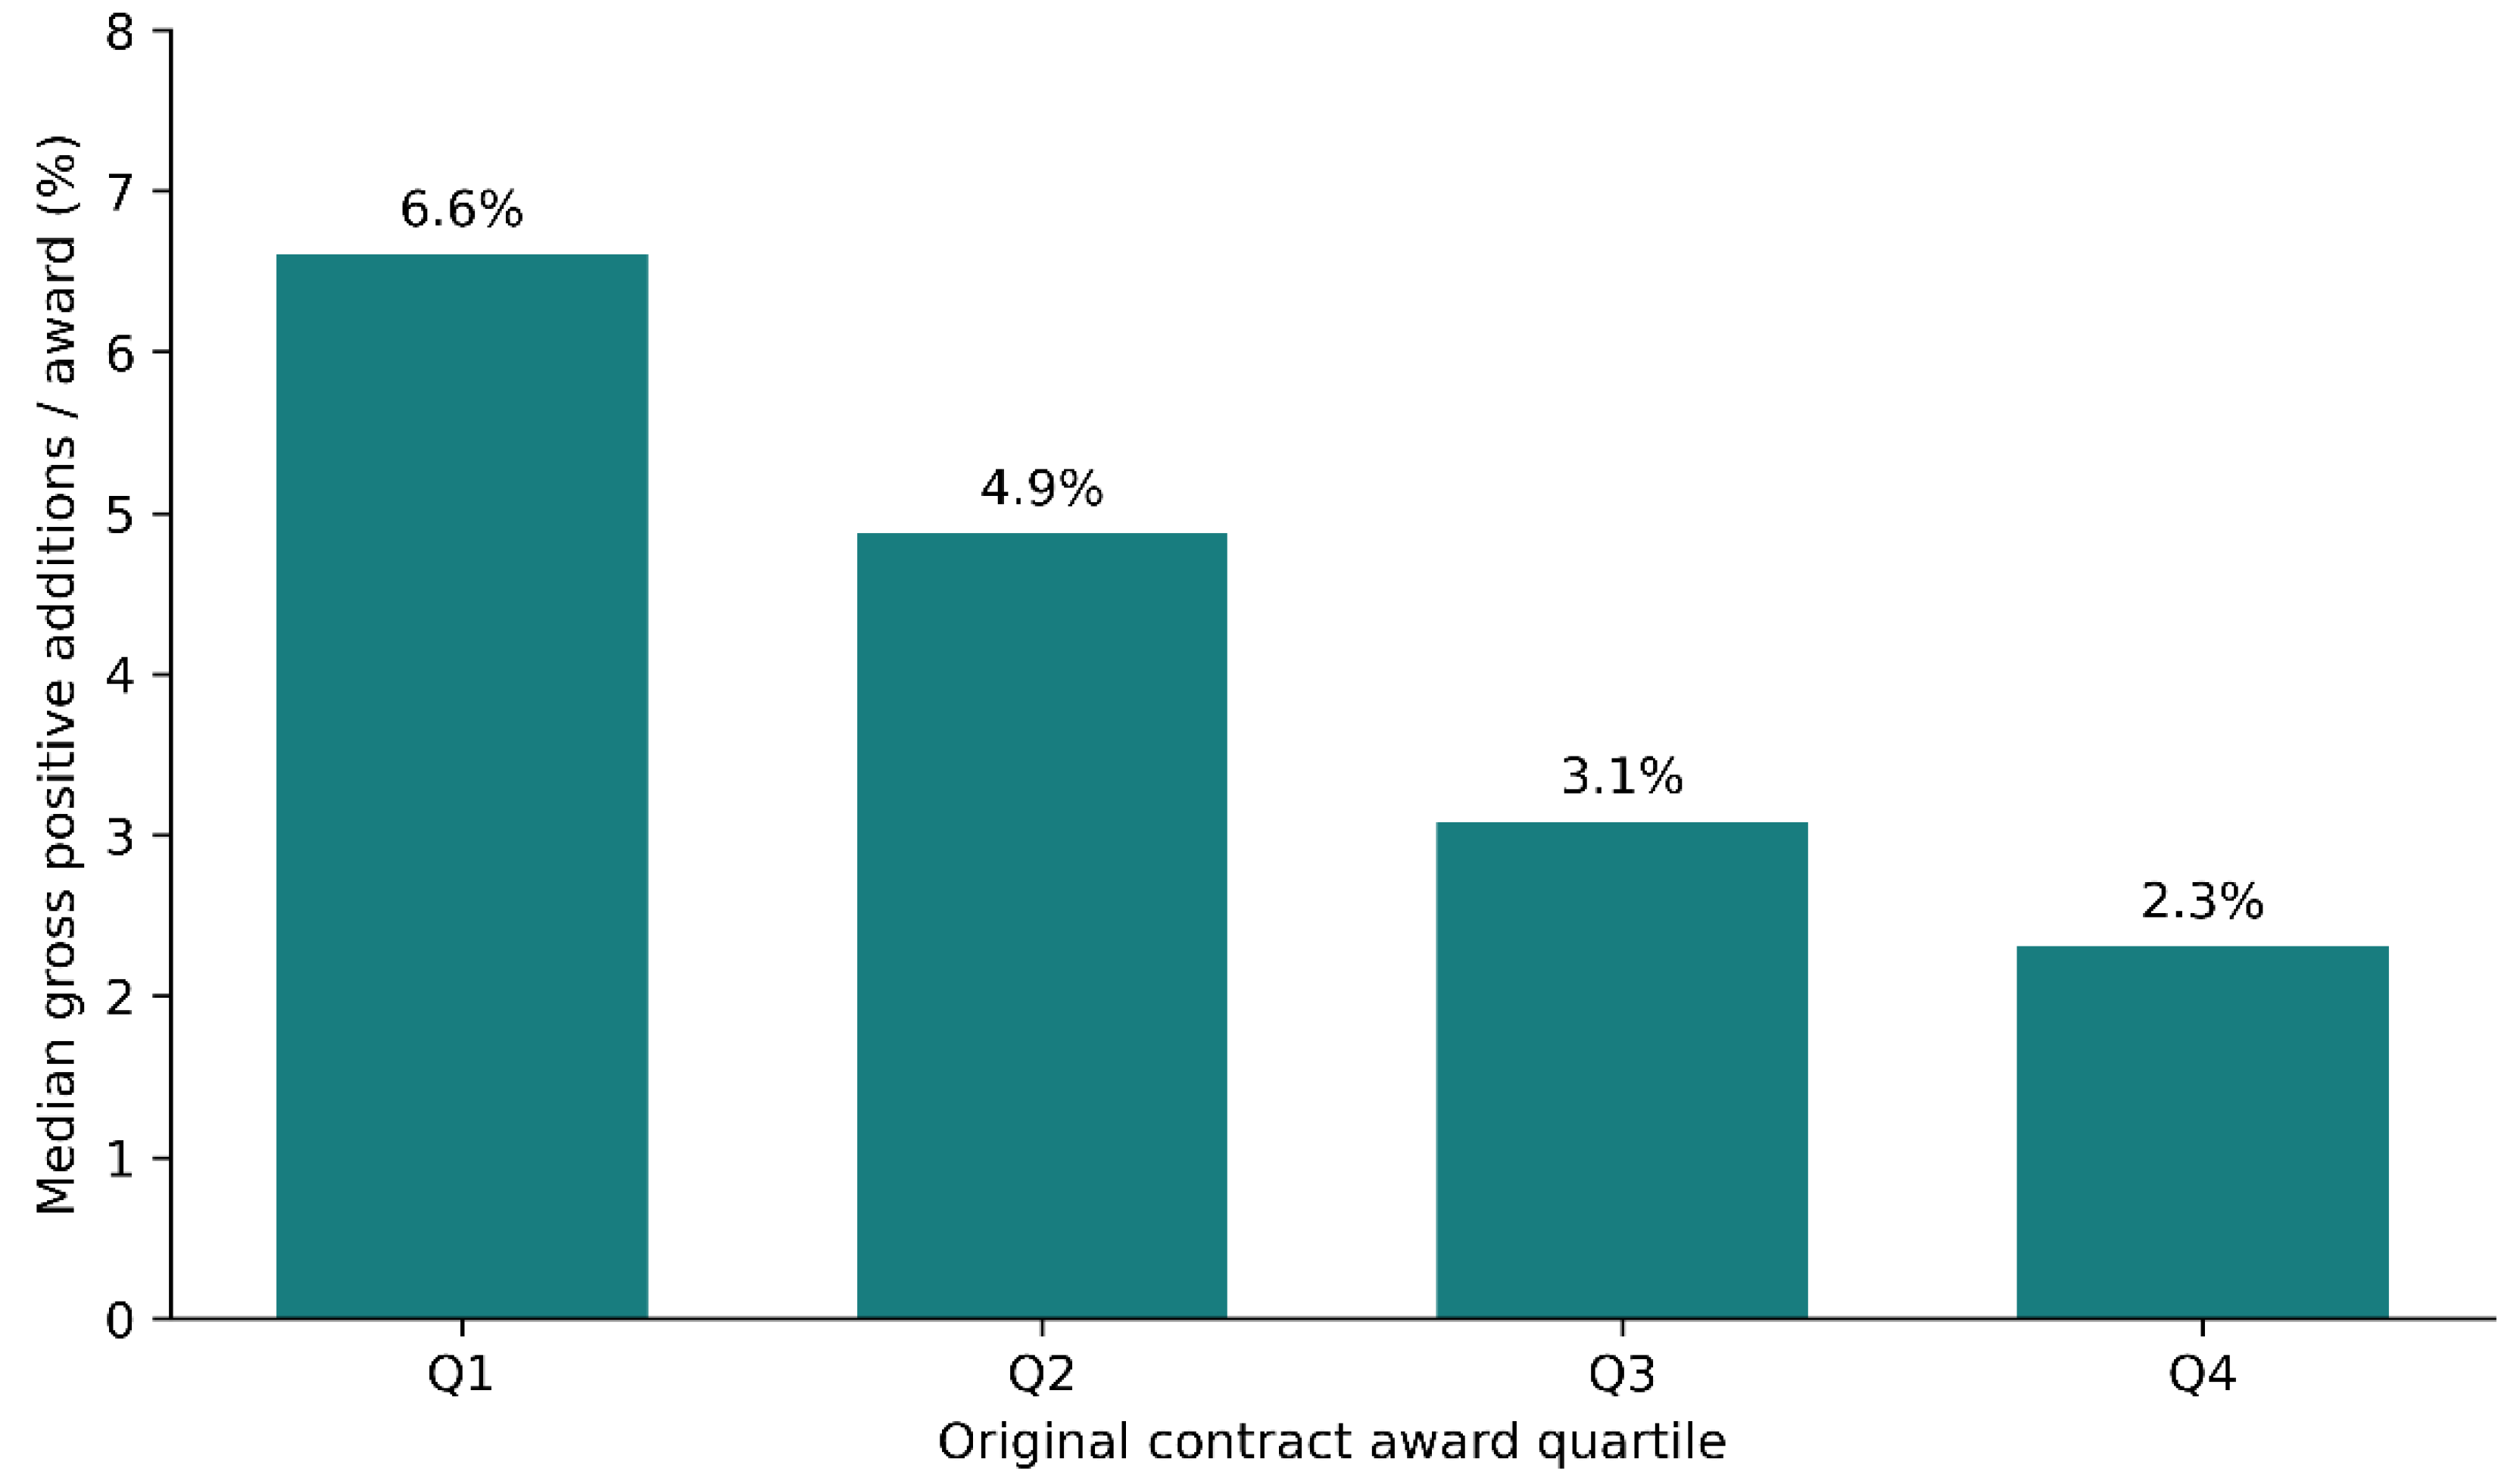
Figure 4.
Adjusted associations per award doubling shown in separate panels: odds ratios for binary outcomes (top) and conditional monetary multipliers among positive contracts (bottom). Numerical magnitudes have different interpretations; horizontal bars denote 95% clustered confidence intervals.
Figure 4.
Adjusted associations per award doubling shown in separate panels: odds ratios for binary outcomes (top) and conditional monetary multipliers among positive contracts (bottom). Numerical magnitudes have different interpretations; horizontal bars denote 95% clustered confidence intervals.
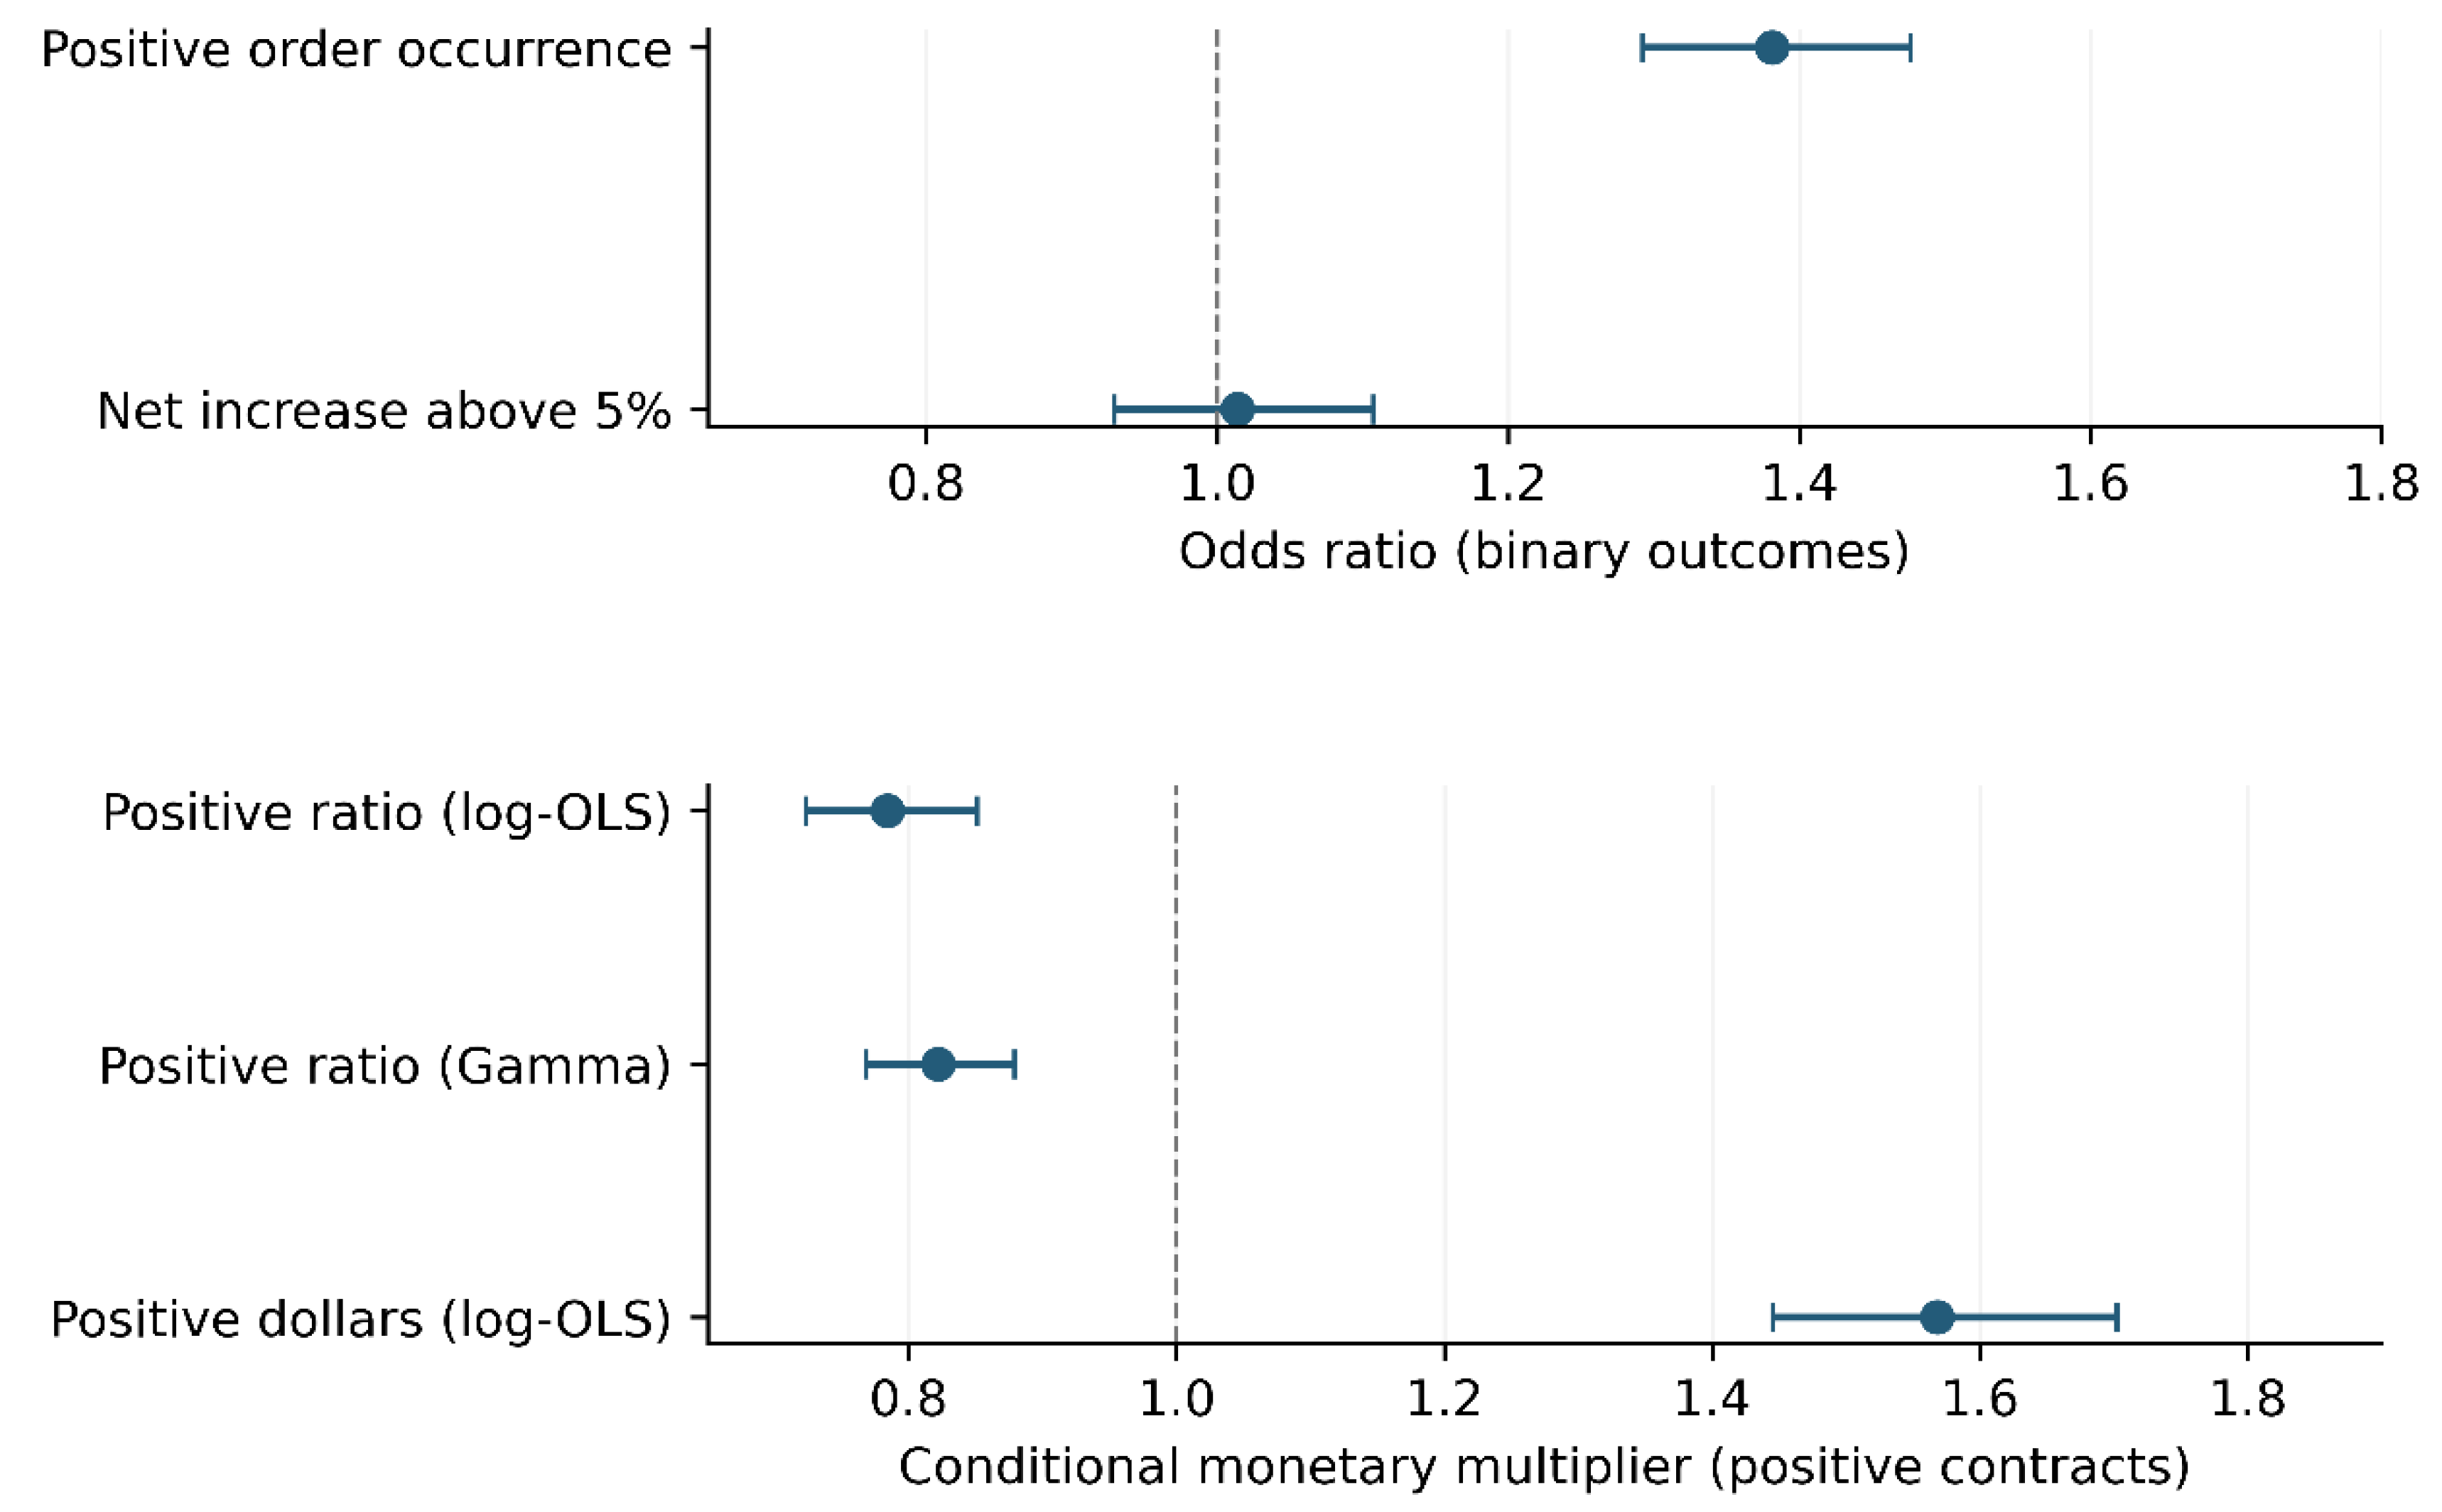
Figure 5.
Contractor-clustered nonlinear occurrence model: portfolio-standardized positive-order probabilities with pointwise 95% confidence bands. The curve describes model-based associations over illustrative award values, not prospectively validated forecasts.
Figure 5.
Contractor-clustered nonlinear occurrence model: portfolio-standardized positive-order probabilities with pointwise 95% confidence bands. The curve describes model-based associations over illustrative award values, not prospectively validated forecasts.
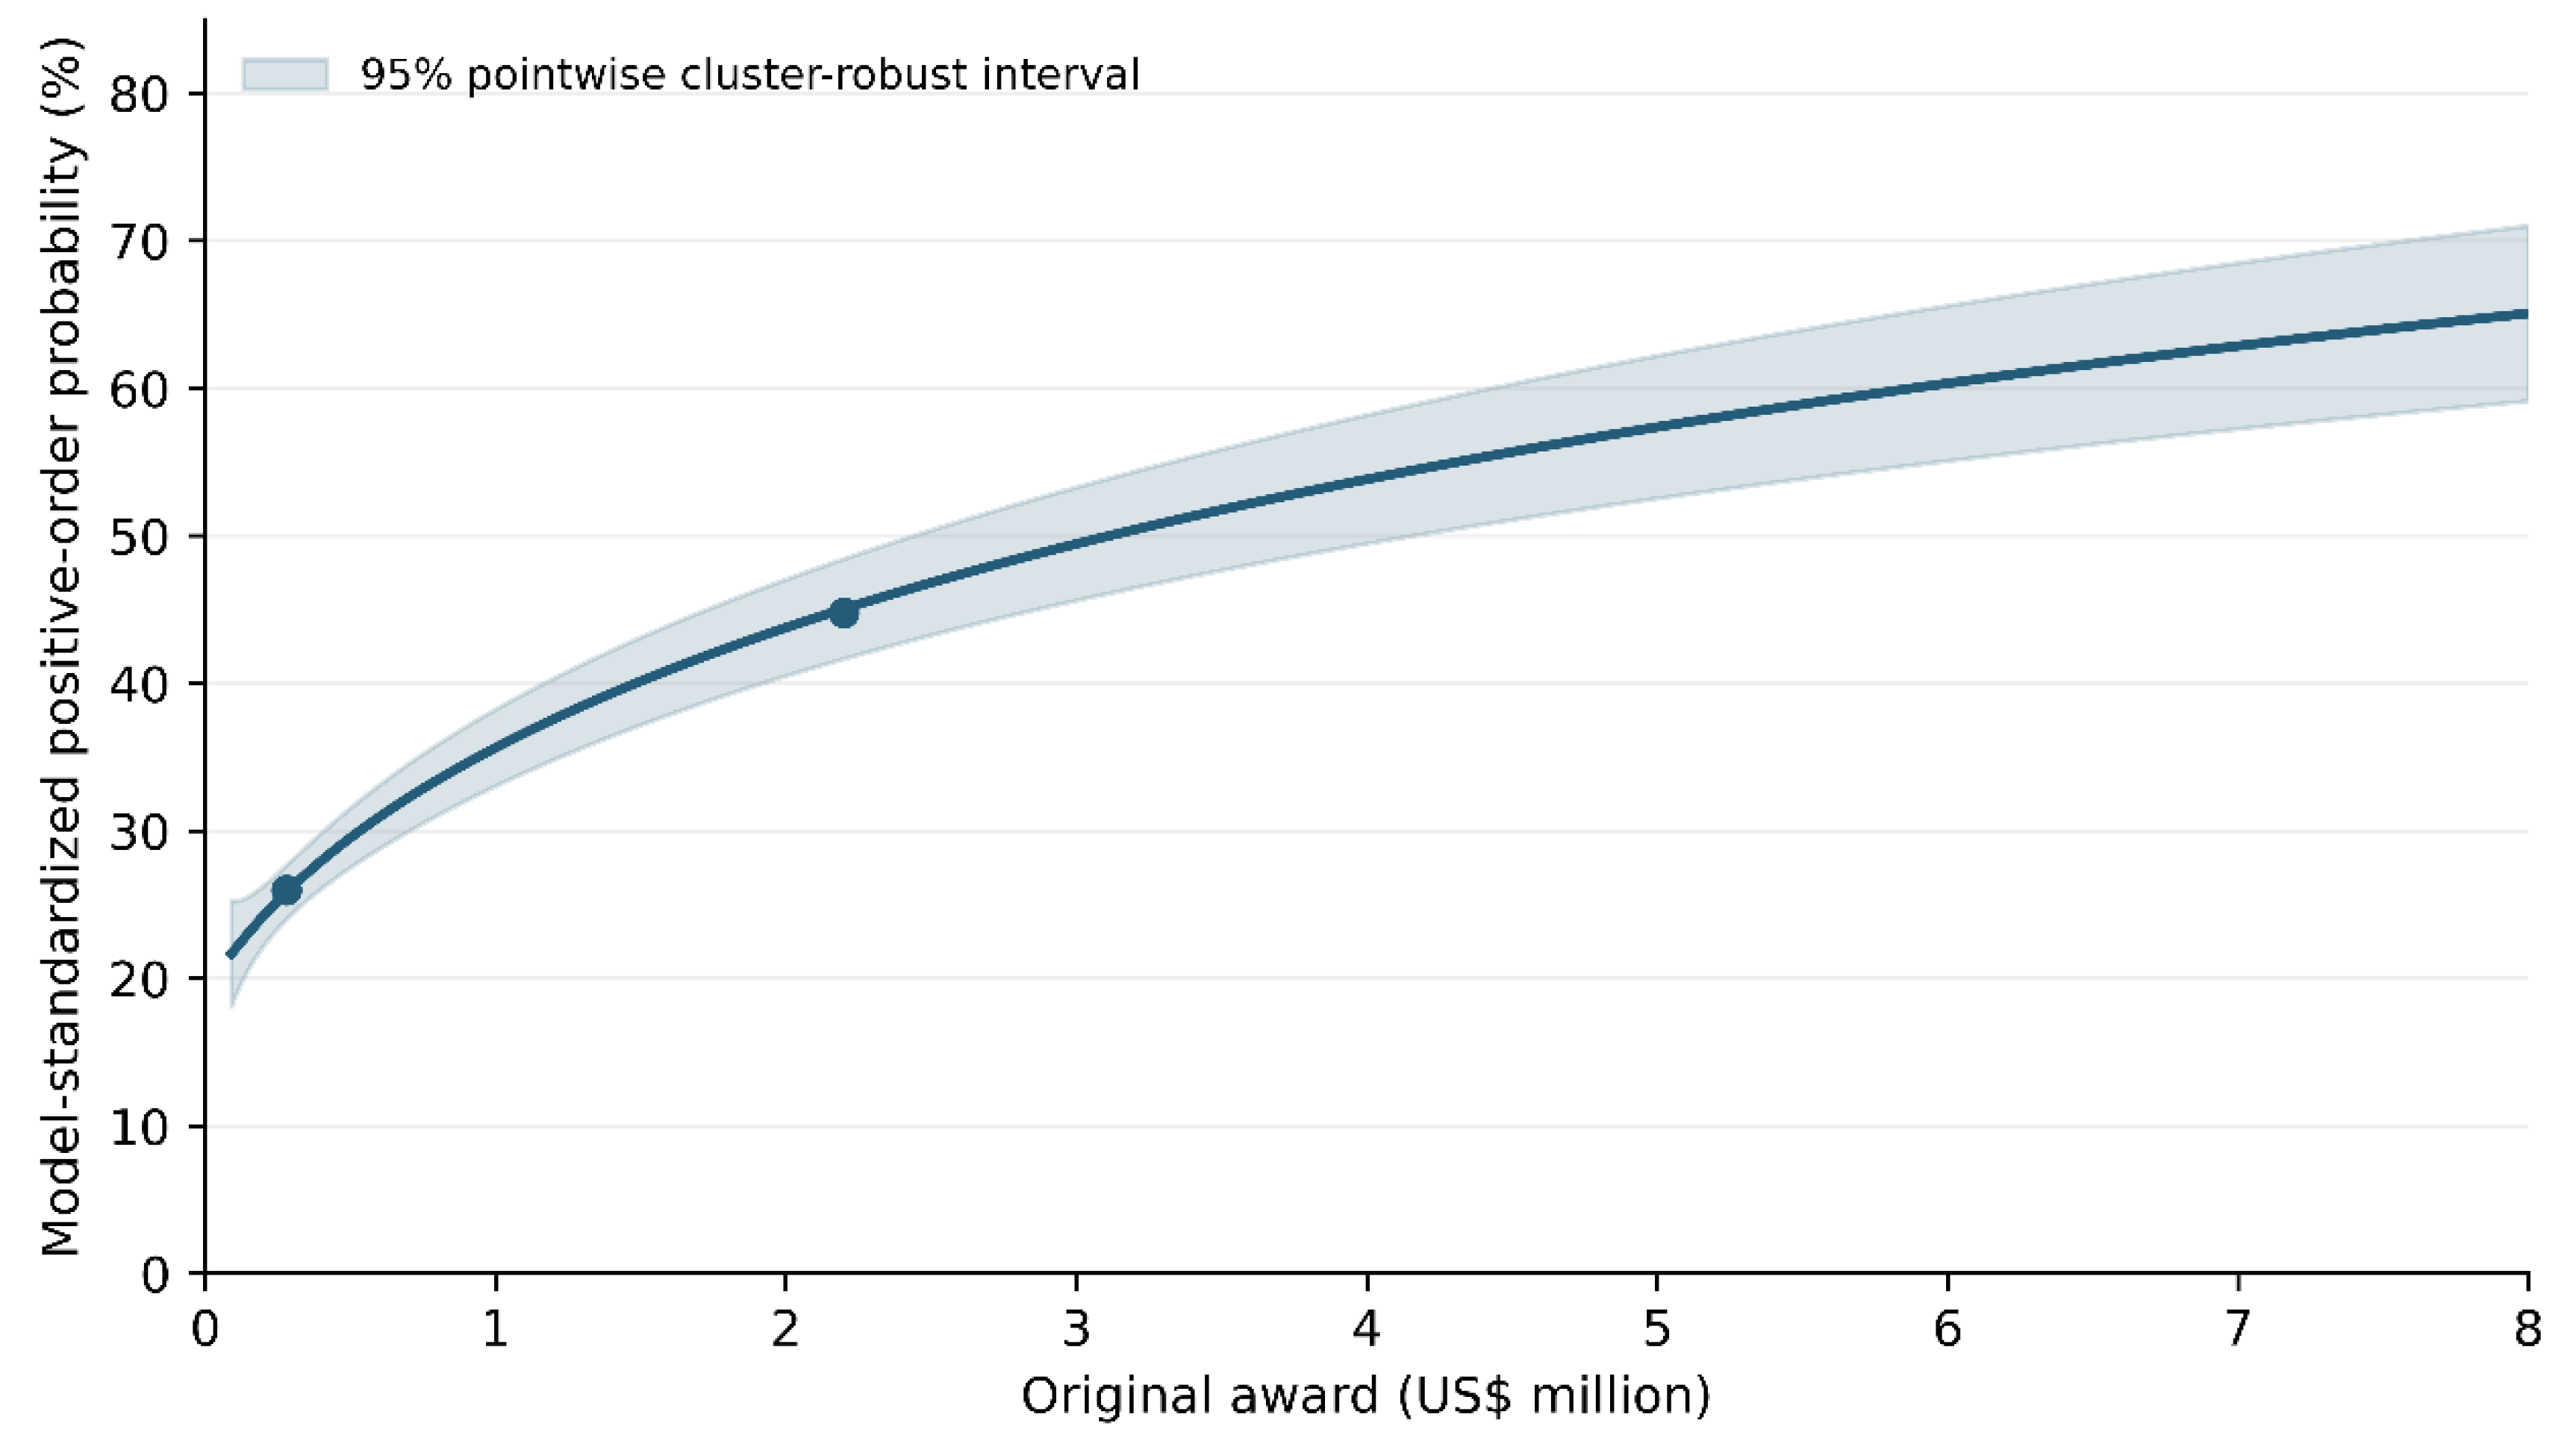
Figure 6.
Work-program-specific odds ratios for positive-dollar order occurrence per doubling of original award, from the exploratory contractor-clustered interaction model. Error bars are 95% confidence intervals; categories differ in sample size and award support.
Figure 6.
Work-program-specific odds ratios for positive-dollar order occurrence per doubling of original award, from the exploratory contractor-clustered interaction model. Error bars are 95% confidence intervals; categories differ in sample size and award support.
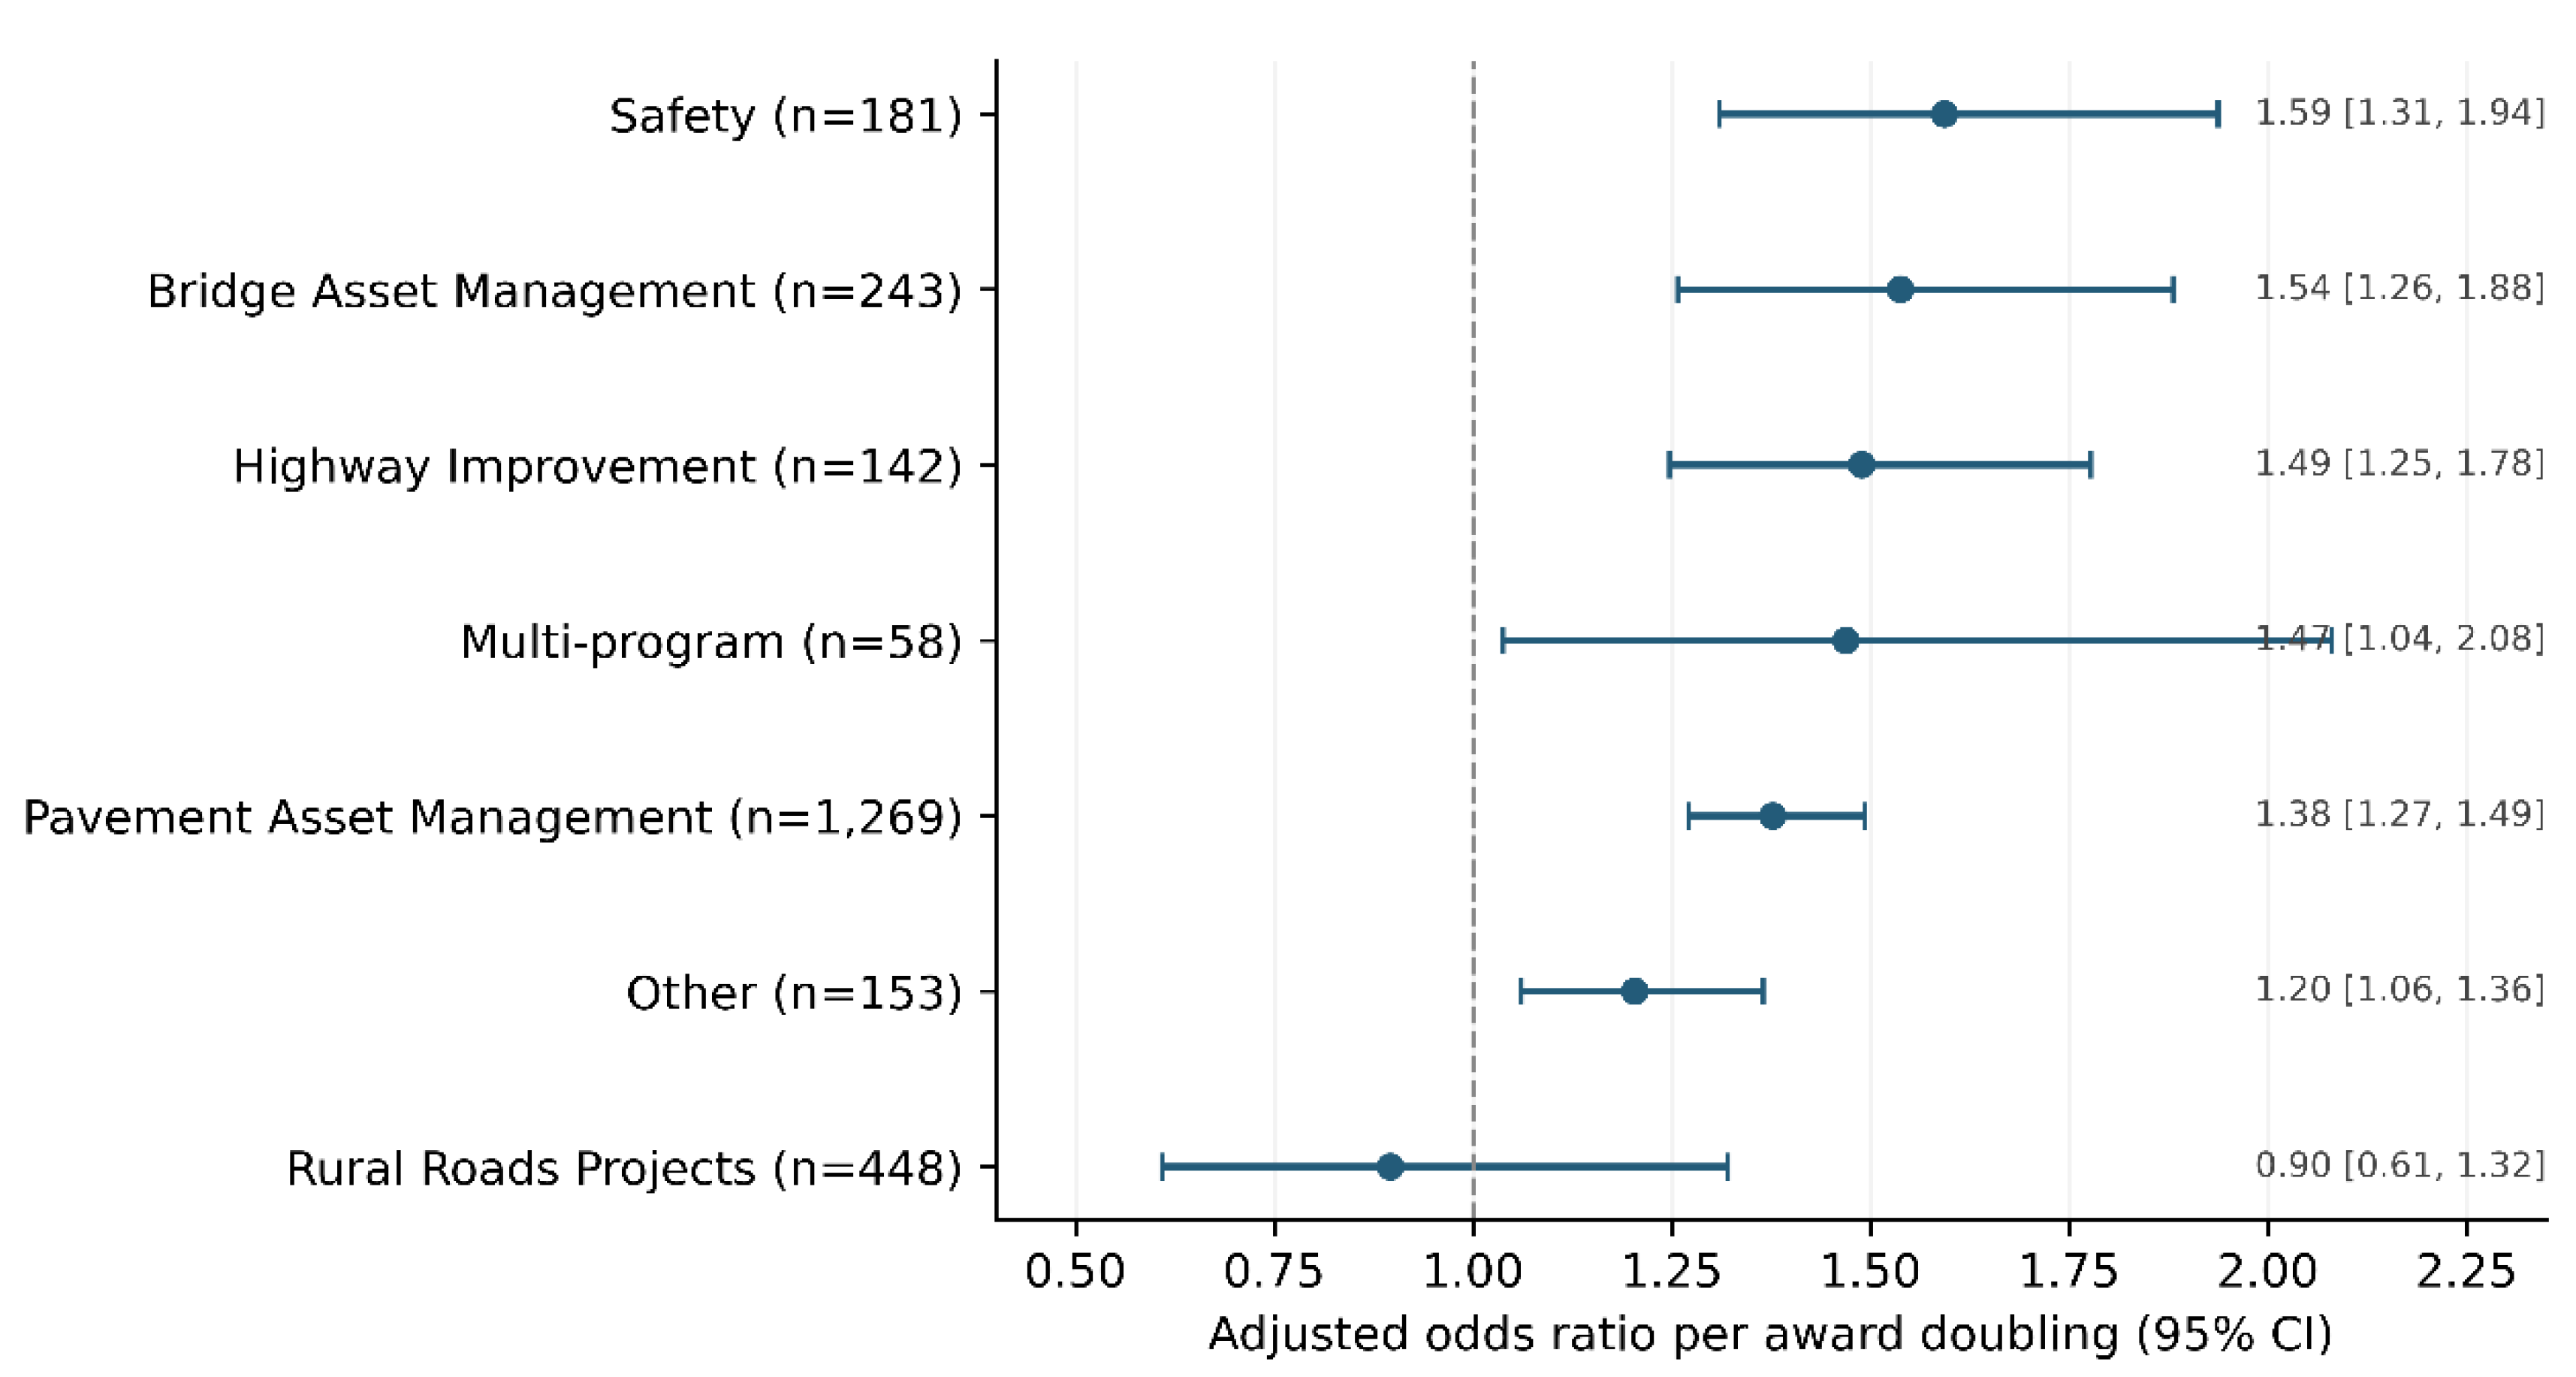
Figure 7.
Out-of-fold model calibration using contractor-held-out five-fold cross-validation; these diagnostics assess internal, not future-period or external, calibration.
Figure 7.
Out-of-fold model calibration using contractor-held-out five-fold cross-validation; these diagnostics assess internal, not future-period or external, calibration.
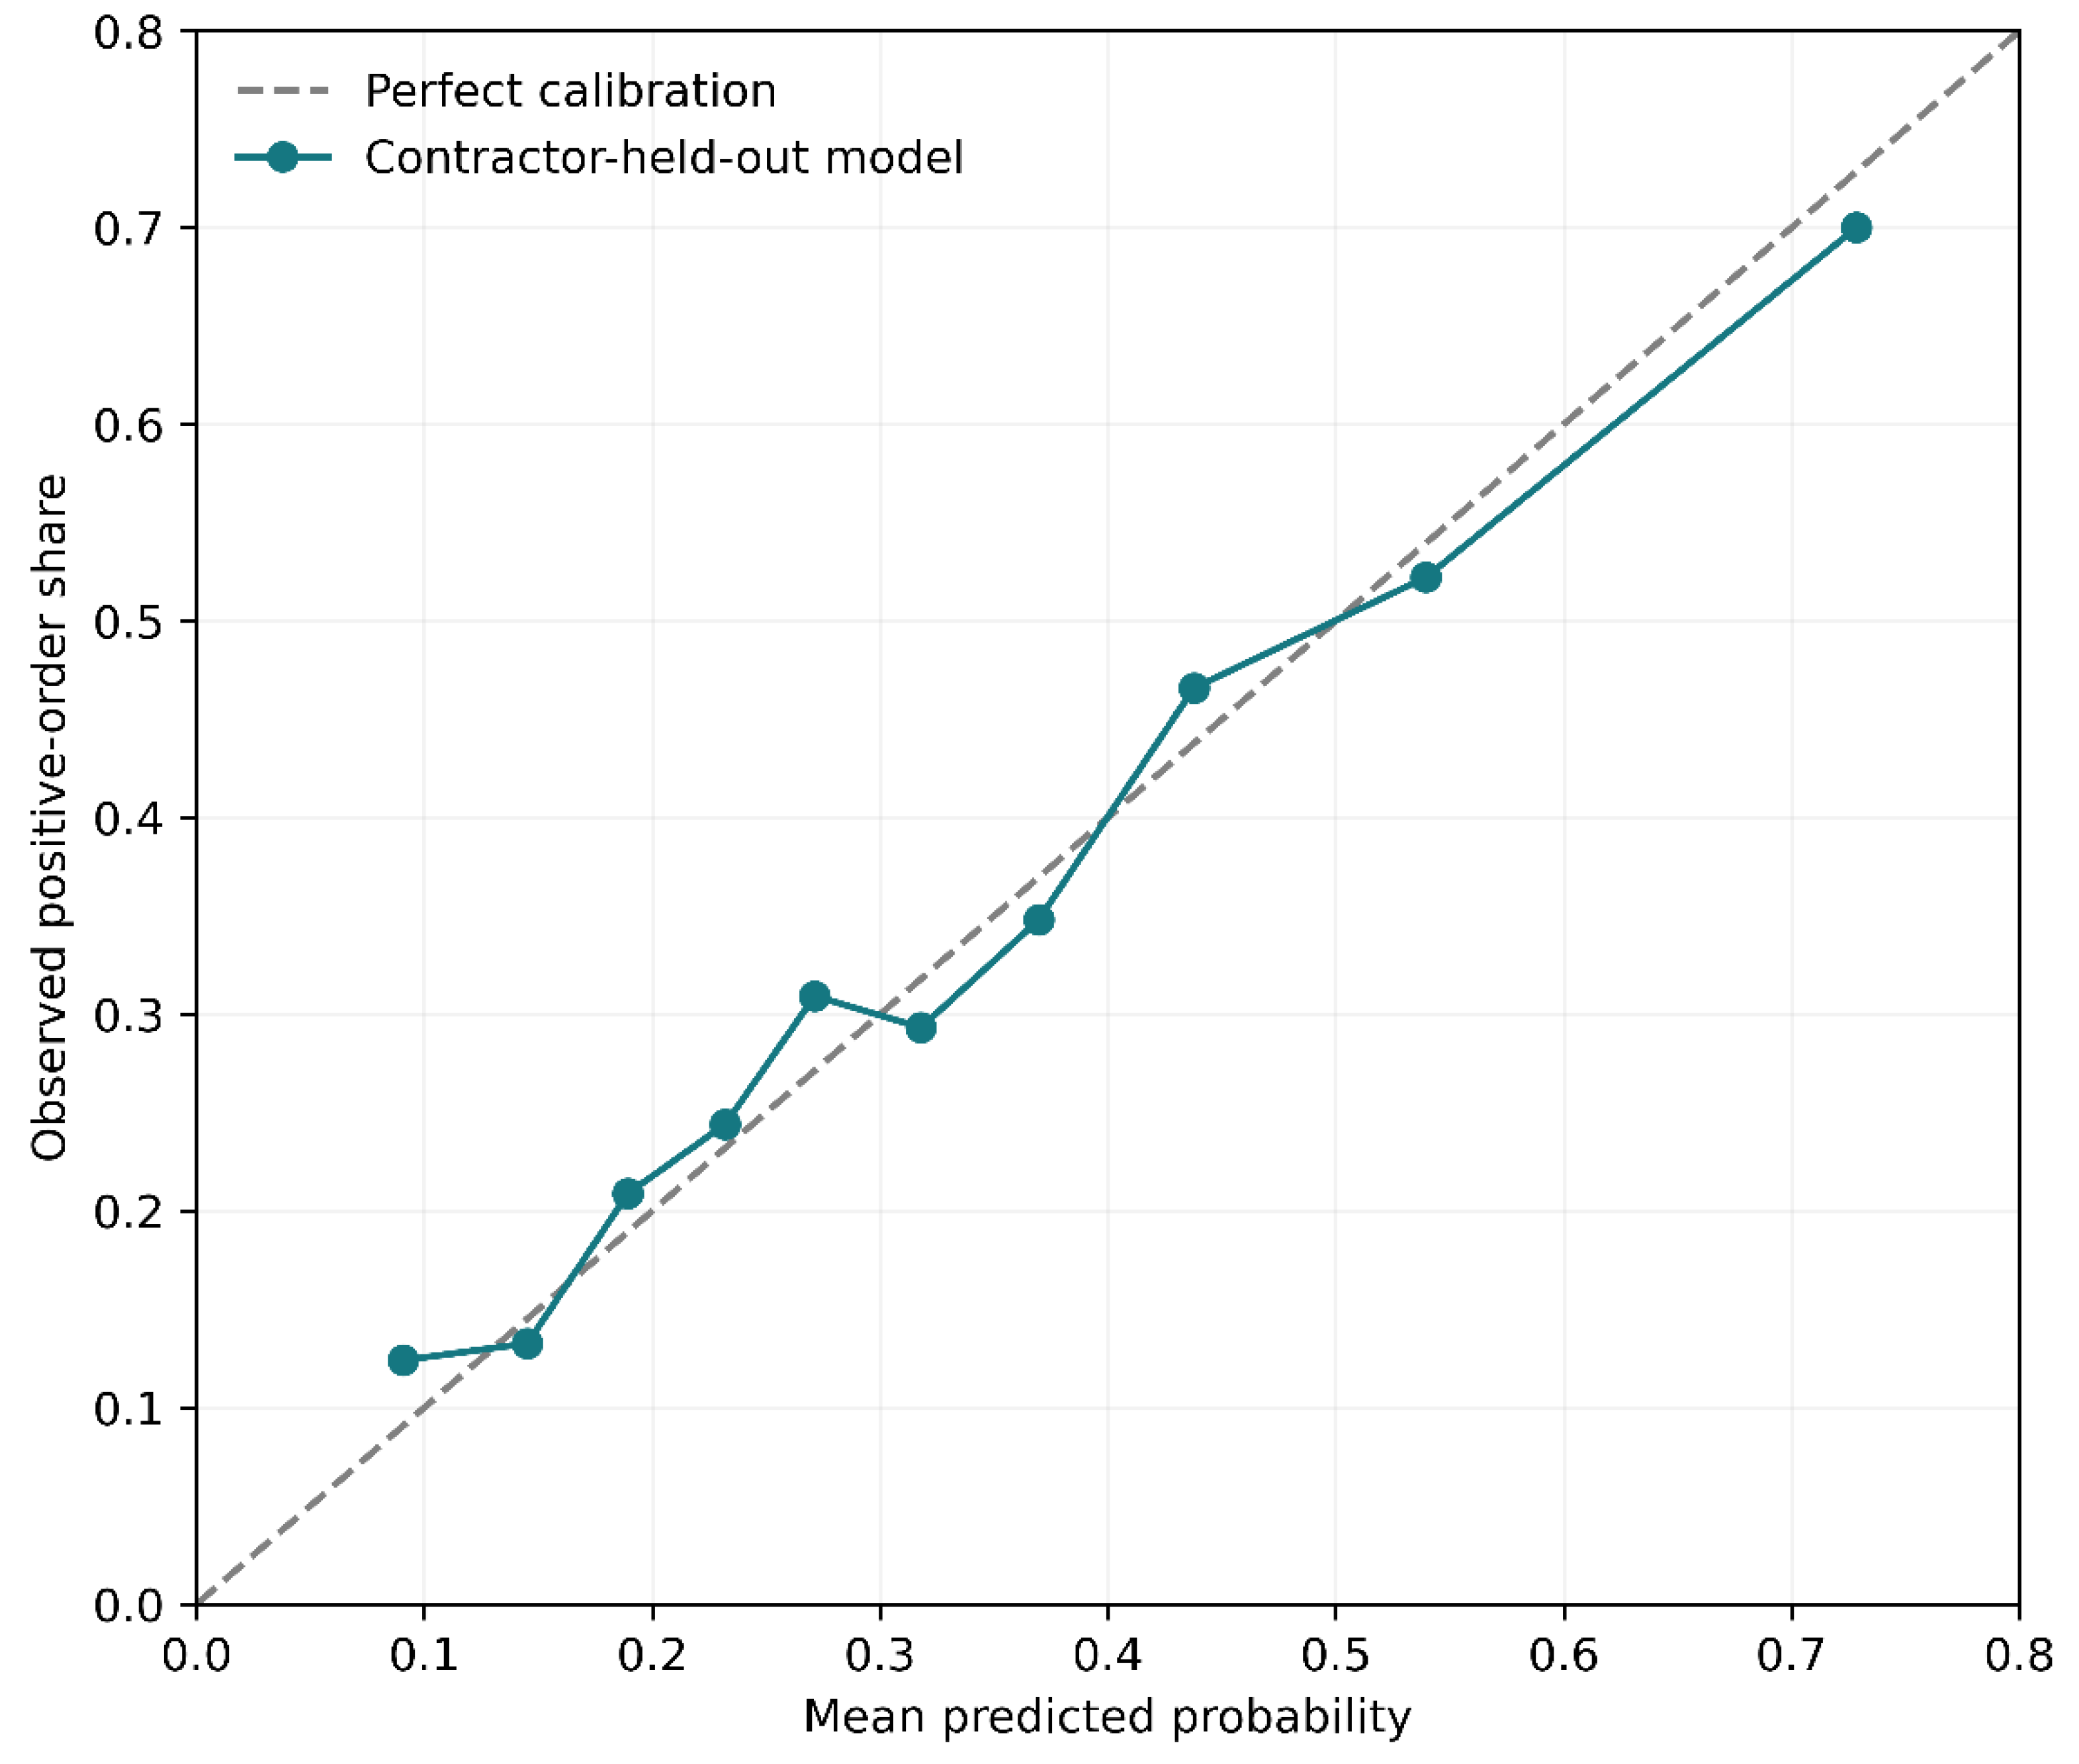
Table 1.
Original KYTC public-data extracts and analytical roles.
| Source extract | Raw rows | Fields | Use |
|---|---|---|---|
| Construction Procurement | 5,257 | 13 | Baseline awards and contract attributes |
| Agency Construction Change Orders | 5,493 | 6 | Approval dates, reasons, and monetary amounts |
| Program Management Cost Change | 37 | 11 | Separate estimate-audit sample |
| Alternative Delivery Procurement | 56 | 6 | Phased-award reconciliation; excluded from models |
Table 2.
Main contract-level sample construction.
| Sample selection | Contracts |
|---|---|
| Unique general-procurement contracts | 3,490 |
| Eligible for 730-day window | 2,496 |
| Excluded: anomalous $0.04 baseline | 1 |
| Excluded: Statewide District 99 | 1 |
| Main analytical contracts | 2,494 |
| At least one positive-dollar change order | 835 |
| Net recorded change above 5% of award | 341 |
Table 4.
Contract-level outcomes by recorded award quartile. *Medians conditional on at least one positive-dollar order; occurrence uses all contracts in each quartile.
Table 4.
Contract-level outcomes by recorded award quartile. *Medians conditional on at least one positive-dollar order; occurrence uses all contracts in each quartile.
| Award quartile | Contracts | Median original award | Positive-order occurrence | Median positive ratio* | Median positive dollars* |
|---|---|---|---|---|---|
| Q1 | 624 | $169,008 | 23.2% | 6.6% | $10,800 |
| Q2 | 623 | $396,827 | 26.2% | 4.9% | $19,082 |
| Q3 | 623 | $701,774 | 31.0% | 3.1% | $20,315 |
| Q4 | 624 | $2,200,345 | 53.5% | 2.3% | $95,806 |
Table 5.
Adjusted per-award-doubling odds ratios (binary models) and conditional monetary multipliers (positive-only models); 95% confidence intervals clustered by contractors.
Table 5.
Adjusted per-award-doubling odds ratios (binary models) and conditional monetary multipliers (positive-only models); 95% confidence intervals clustered by contractors.
| Dependent variable / model | Odds ratio or multiplier | 95% CI | p-value |
|---|---|---|---|
| Any positive-dollar modification (logit) | 1.381 | 1.292–1.476 | <0.001 |
| Conditional positive ratio (log-OLS) | 0.784 | 0.723–0.851 | <0.001 |
| Conditional positive ratio (Gamma log) | 0.822 | 0.768–0.879 | <0.001 |
| Conditional positive dollars (log-OLS) | 1.568 | 1.445–1.702 | <0.001 |
| Net positive change >5% (logit) | 1.014 | 0.929–1.107 | 0.759 |
Table 6.
Contracts with positive signed-net increases exceeding illustrative fractions of recorded original award.
Table 6.
Contracts with positive signed-net increases exceeding illustrative fractions of recorded original award.
| Net threshold | Contracts | Sample share | Adjusted OR (95% CI) |
|---|---|---|---|
| Net >2% | 535 | 21.5% | 1.126 (1.060–1.197) |
| Net >5% | 341 | 13.7% | 1.014 (0.929–1.107) |
| Net >10% | 166 | 6.7% | 0.966 (0.866–1.077) |
Table 7.
Work-program composition and observed positive modification occurrence.
| Work program | Contracts | Positive-order share | Median award |
|---|---|---|---|
| Pavement Asset Management | 1,269 | 28.5% | $450,353 |
| Rural Roads Projects | 448 | 25.7% | $483,717 |
| Bridge Asset Management | 243 | 51.0% | $881,795 |
| Safety | 181 | 43.6% | $617,688 |
| Other | 153 | 24.8% | $214,629 |
| Highway Improvement | 142 | 68.3% | $6,239,401 |
| Multi-program | 58 | 34.5% | $1,243,517 |
Table 8.
Observation-window robustness; eligible cohorts differ across windows.
| Window | Contracts | Occurrence OR (95% CI) | Relative amount factor (95% CI) |
|---|---|---|---|
| 12 months | 3,111 | 1.249 (1.170–1.333) | 0.681 (0.597–0.777) |
| 24 months | 2,494 | 1.381 (1.292–1.476) | 0.784 (0.723–0.851) |
| 36 months | 1,978 | 1.416 (1.319–1.521) | 0.810 (0.739–0.887) |
Table 9.
Prime-contractor concentration sensitivity: adjusted effects per award doubling (95% clustered CI).
Table 9.
Prime-contractor concentration sensitivity: adjusted effects per award doubling (95% clustered CI).
| Subset | Occurrence odds ratio | Positive-dollar log-OLS multiplier |
|---|---|---|
| Full cohort | 1.381 (1.292–1.476) | 1.568 (1.445–1.702) |
| Omit largest contractor 1 | 1.361 (1.271–1.456) | 1.562 (1.428–1.709) |
| Omit largest contractor 2 | 1.374 (1.280–1.475) | 1.565 (1.439–1.703) |
| Omit largest contractor 3 | 1.374 (1.282–1.473) | 1.575 (1.447–1.714) |
| Omit largest contractor 4 | 1.404 (1.321–1.493) | 1.563 (1.438–1.699) |
| Omit largest contractor 5 | 1.376 (1.282–1.477) | 1.577 (1.444–1.722) |
Table 10.
Distinct approved order identifiers with and without a matching general-procurement contract, by approval year. The 1,197 unmatched group includes 46 alternative-delivery matches.
Table 10.
Distinct approved order identifiers with and without a matching general-procurement contract, by approval year. The 1,197 unmatched group includes 46 alternative-delivery matches.
| Approval year | Linked to general procurement | No general-procurement match |
|---|---|---|
| 2021 | 194 | 547 |
| 2022 | 726 | 322 |
| 2023 | 934 | 123 |
| 2024 | 845 | 82 |
| 2025 | 786 | 59 |
| 2026 | 659 | 64 |
| Total | 4,144 | 1,197 |
Table 11.
Proposed outcome-differentiated reporting: management questions, populations, and interpretation limits.
Table 11.
Proposed outcome-differentiated reporting: management questions, populations, and interpretation limits.
| Recorded indicator | Denominator / population | Question it can address | Inference it cannot establish |
|---|---|---|---|
| Any order recorded | All eligible contracts | Whether the approval ledger registers activity | Does not verify nonfinancial work or efficiency |
| Positive-dollar occurrence | All eligible contracts | Whether a strictly positive approved amount is recorded | Not final paid cost or causal probability |
| Gross positive additions | Contracts with positive entries for conditional summaries | Amount of recorded additions before negative offsets | Not equivalent to net change or contingency need |
| Positive signed-net threshold | All eligible contracts | Whether positive net approval amounts exceed 2%, 5%, or 10% of award | Not a KYTC trigger or completed-project overrun |
| Two-part standardized gross mean | Observed portfolio covariate profiles at hypothetical awards | Occurrence-weighted conditional arithmetic-mean dollars | Not externally validated project prediction |
Disclaimer/Publisher’s Note: The statements, opinions and data contained in all publications are solely those of the individual author(s) and contributor(s) and not of MDPI and/or the editor(s). MDPI and/or the editor(s) disclaim responsibility for any injury to people or property resulting from any ideas, methods, instructions or products referred to in the content. |
© 2026 by the authors. Licensee MDPI, Basel, Switzerland. This article is an open access article distributed under the terms and conditions of the Creative Commons Attribution (CC BY) license (http://creativecommons.org/licenses/by/4.0/).
Copyright: This open access article is published under a Creative Commons CC BY 4.0 license, which permit the free download, distribution, and reuse, provided that the author and preprint are cited in any reuse.