
Submitted:
16 November 2026
Posted:
18 November 2026
You are already at the latest version
Abstract
In the semi-arid regions of northern Mexico, where water scarcity forces a single reservoir to sustain irrigation, fisheries, and domestic supply, water quality is usually assessed at the source and rarely at the tap. This study was conducted in a reservoir and in the household taps it supplies, using the same scale of indices. Water quality indices (WQI, EWQI, CCME-WQI), Mexican and international regulatory criteria, irrigation indices, hydrochemical diagrams, geospatial analysis, and a population survey were combined. The reservoir, a low-mineralization calcium-bicarbonate water source, proved suitable for irrigation and as a high-quality habitat, with a longitudinal gradient that clarifies the water toward the dam and concentrates fluoride near the intake. The domestic network showed two independent problems that no aggregate index captures at once: geogenic fluoride above the limit in two of every three taps and fecal coliforms in half of them. The supply chain does not treat the water: lower turbidity at the tap is due to the intake location, not treatment. Clarification, verifiable disinfection, and fluoride removal are the priority interventions.
Keywords:
La Boquilla reservoir
; water quality indices
; source-to-tap
; irrigation
; aquatic life
; freshwater scarcity
1. Introduction
Freshwater scarcity is one of the most severe environmental, socioeconomic, and public health challenges of the 21st century [1,2]: population growth, land-use change, and climate change put pressure on water sources, pollution reduces the usable volumes and raises the cost of treatment [3,4]. The World Health Organization (WHO) estimates that 829,000 people die every year from diseases associated with unsafe water, inadequate sanitation, and poor hygiene [4]. Agriculture accounts for about 75% of withdrawals, compared with 20% for industry and 5% for domestic use [1], and in arid regions, expanding irrigation competes with the water supply for towns that depend on the same sources [3,5].
Assessing the suitability of water for drinking and for irrigation [1,4] requires characterizing the physical, chemical, and microbiological properties of the water [5,6,7,8,9], judged against frameworks that differ by use: in Mexico, NOM-127-SSA1-2021 for drinking water and the Ecological Water Quality Criteria CE-CCA-001/89 for supply sources, irrigation, and aquatic life, complemented by the WHO guidelines, the criteria of the United States Environmental Protection Agency (EPA), and the FAO irrigation guidelines. To synthesize dozens of parameters, water quality indices (WQI) aggregate heterogeneous data into a dimensionless value translated into categories from excellent to unsuitable [1,4,8]: the weighted arithmetic WQI weights each parameter in inverse proportion to its permissible limit [9,10], the entropy-weighted WQI (EWQI) derives the weights from the dispersion of the data [11], and the index of the Canadian Council of Ministers of the Environment (CCME-WQI) summarizes the frequency and magnitude of exceedances of any set of objectives [4,8]. For irrigation, the sodium adsorption ratio (SAR), sodium percentage, magnesium hazard, potential salinity, and Kelly ratio anticipate soil salinization and sodification [5,6,7], together with the graphical USSL and Wilcox classifications and the FAO thresholds [1]. The Piper diagram identifies hydrochemical facies and whether the chemistry responds to water–rock interaction or to wastewater and agricultural return flows [5,10], and geographic information systems (GIS) make gradients along a reservoir or network visible to managers [4,5,12].
In the arid north of Mexico, rural localities are supplied from wells and reservoirs with limited treatment; their two best-documented problems are geogenic fluoride, which in Chihuahua exceeded 1.5 mg/L in 37% of 94 rural localities supplied by wells [13], and fecal contamination, detected by coliforms in the water bodies of the region's participatory observatories [4]. La Boquilla reservoir, in the upper Río Conchos basin, is the largest reservoir in Chihuahua and one of the most important in northern Mexico [2,14,15]: it stores the water for Irrigation District 005 Delicias (80,103 ha) [16] and is, directly or indirectly, the source of almost all the domestic supply of the locality of San Francisco de Conchos, which lacks a formal drinking-water treatment system [17] and draws on the municipal intake in the reservoir, on springs fed by its seepage, and on the Río Conchos (Section 2.1). The most complete precedent, the index of Rubio Arias et al. (2014) [2], studied the reservoir for one year at six sites and four depths, but not the network it supplies; to our knowledge, published studies of reservoir–network systems stop at the intake, without comparing source and tap with a single methodology, and the reservoir has not been assessed as a water supply source with the criteria that Mexican regulation sets for that use, nor for irrigation and aquatic life beyond the general suitability derived from that ICA (índice de calidad del agua, water quality index), without sodicity indices or toxicity criteria.
Therefore, the objectives of this research were: (i) to assess the quality of the water of the domestic supply network of San Francisco de Conchos (SFC) for human consumption, and that of La Boquilla reservoir as a water supply source and for irrigation, aquatic life, and fisheries, using quality indices and regulatory criteria; (ii) to characterize the hydrochemical facies of the reservoir and the spatial distribution of the sites with GIS; and (iii) to compare, on a single reference scale, the quality of the reservoir water and that of the taps, to determine whether they meet the drinking-water criteria and how they differ, whether the reservoir is suitable for the other uses, and which processes explain its chemical composition.
2. Materials and Methods
2.1. Study Area
The study area comprises La Boquilla reservoir and localities of the municipality of San Francisco de Conchos, Chihuahua, Mexico (27° 32′ 30″ N, 105° 24′ 10″ W), in the Río Conchos basin (Hydrological Region RH-24 Bravo-Conchos), the most important in the state, which covers about 30% of its area [14,18]. The climate is arid to semi-arid, with high rainfall variability and recurrent droughts; mean annual precipitation falls from 564 mm in the upper basin to less than 300 mm in the plains of the middle and lower sub-basin [14,15,19], so that reservoir recharge depends entirely on the seasonal runoff of the upper Río Conchos. The reservoir's immediate surroundings are Tertiary basalts, whereas adjacent elevations, such as the Sierra La Venada, consist of Lower Cretaceous limestones and shales with local rhyolitic tuffs [19].
The reservoir is the largest storage structure in Chihuahua, with a nominal capacity of 2,894 to 2,903 hm³ at the Maximum Ordinary Water Level (NAMO, Spanish acronym) [14,20]; the water body, known as Lake Toronto, reaches about 42 km in length at full capacity [21]. It feeds the canal network of Irrigation District 005 Delicias and irrigation units in Camargo, Saucillo, La Cruz, and San Francisco de Conchos. The Boquilla Hydroelectric Plant, commercial and sport fishing, and recreational tourism concentrated in the reservoir, Lake Colina, and the springs of the "Los Filtros" bathing resorts are the main drivers of the local economy [19,22].
San Francisco de Conchos, however, lacks a formal treatment system for the water distributed to dwellings [17] and is supplied through a multi-source scheme that ultimately derives from the reservoir: the municipal intake in the reservoir, for general domestic use; the El Pozito and El Ojito springs, fed by seepage; direct capture from the Río Conchos by some sectors for secondary activities; and purified water bought from local or municipal purification plants, the main source for cooking and drinking (Section 3.1.3). After the severe drought of 2023–2025, with a slight recovery after the 2025 rains [18,20], the reservoir was at 34% of its storage capacity during the fieldwork.
2.2. Sampling and Laboratory Analysis
2.2.1. Domestic Water Supply Network
In October 2025, 31 samples were collected at domestic and community supply points (household taps, purification plants, schools, and public buildings) in seven localities: 11 supplied by La Boquilla reservoir, 11 by the Río Conchos, 6 by springs (El Ojito, n = 4; El Pozito, n = 2), 2 at the outlet of purification plants, and 1 from a well. Samples were taken directly from the tap, not from household storage tanks, so the unit of analysis is the water at the point of use and not the source. Taps were cleaned, disinfected, and flushed for 1 min; at each point, a 1.5-L polyethylene bottle was filled for physicochemical analysis and a sterile 100-mL flask for microbiological analysis, both kept at 4 °C. Coordinates were recorded with a handheld GPS. Figure 1 shows the location of the sampling sites.
2.2.2. La Boquilla Reservoir
The reservoir was sampled at eight sites (B1–B8; Figure 1; Table 1) between 06:00 and 14:00 h, in order from B1 to B8, from the reservoir tail to the dam, using non-probabilistic convenience sampling. At each site, samples were taken at 0.30, 5, 10, and 15 m with a stainless-steel sampler (31 samples; the 15-m sample at B1 could not be taken because of weather conditions), in 1.5-L polyethylene bottles kept at 4 °C; the BOD₅ test was started within 24 h, as required by Mexican standard NMX-AA-028-SCFI-2001, and the aliquots for multi-element analysis were acidified and analyzed by ICP-OES at the University of the Balearic Islands (Palma, Spain).
Dissolved oxygen (DO) and temperature were measured in situ at 0.30, 3, and 5 m with a Milwaukee MW605 MAX DO meter (MA860 galvanic probe, 5-m cable), so the 10- and 15-m samples lack their own DO and temperature, and DO saturation was not measured.
The pH, electrical conductivity (EC), hardness, NH₄⁺, NO₃⁻, Cl⁻, Ca²⁺, Mg²⁺, Na⁺, and K⁺ were measured on board, in each freshly collected sample, with an IMACIMUS multi-ion probe (NT Sensors, Mexico). Because sampling was sequential on a single day, the temperature gradient (and, in part, the DO gradient) is confounded with the time of day, which we account for in the interpretation.
2.2.3. Analytical Methods
Table 2 summarizes parameters, methods, and instruments; procedures, ranges, and detection limits (LOD) are given in Supplementary Materials, Tables S1 to S3. BOD₅, COD, total dissolved solids (TDS), turbidity, fluoride, and total and fecal coliforms were determined at the Sanitary Engineering Laboratory of the Autonomous University of Chihuahua (UACH) according to the Mexican NMX-AA standards; coliforms were determined only in the domestic network.
Twenty-five elements (Ca, Mg, Na, K, P, S, and 19 trace elements) were quantified by ICP-OES at the Laboratory of Environmental Analytical Chemistry of the University of the Balearic Islands, in samples acidified to 2% with HNO₃, with external calibration, blanks, and check standards in each batch (LOD and censoring in Table S2). The IMACIMUS probe was calibrated with the manufacturer's standard solutions before each campaign; its analytical parameters were established with three calibration curves on three different days (R² ≥ 0.984), with LOD and LOQ (three and ten standard deviations of eight blank readings) from 0.011 to 0.34 and from 0.038 to 1.12 mg/L, and between-day reproducibility (%RSD) from 1.3% for Cl⁻ to 27.9% for NH₄⁺ (Table S3).
2.3. Data Processing and Quality Control
ICP-OES was the primary source of Ca²⁺, Mg²⁺, Na⁺, and K⁺; total hardness was calculated as 2.497·[Ca²⁺] + 4.118·[Mg²⁺], sulfate as 2.996·S, and the limits expressed as nitrogen were converted to the measured ionic forms (48.7 mg/L NO₃⁻; 0.644 mg/L NH₄⁺). Probe EC and hardness are values the instrument derives from its ion readings and are reported as derived values; Cl⁻, NO₃⁻, NH₄⁺, and pH (probe). The F⁻, turbidity, TDS, BOD₅, and COD (laboratory) lack cross-verification.
For all values below the LOD were handled with a graded criterion [29,30,31]: LOD/√2 with less than 15% censoring, LOD/2 between 15 and 50%, and exclusion from the indices above 50% (Table S2); when the LOD exceeded the criterion for a use, compliance is reported as not verifiable and, in the CCME-WQI, the LOD was used as the objective [32].
BOD₅ and COD, below their practical quantification limits (< 2 and < 10 mg/L) [33] in 30 of 31 reservoir samples, were thus excluded from the indices; the TDS of B1-10 m and B8-10 m, inconsistent with the ionic composition, were excluded only from the mean and standard deviation (n = 29); and molybdenum, imputed with different criteria in the two databases (LOD/2 in the reservoir, LOD/√2 in the network), does not enter the source-to-tap comparison (Section 2.5).
Without alkalinity, the charge-balance error was not calculated; analytical consistency was verified by comparing gravimetric TDS with the sum of the measured ions plus 0.49 × the bicarbonate implied by the charge deficit, an estimate used only for that verification, the Piper diagram, and the irrigation index of Mammeri et al. (2023) [1]. For an instrument sensitivity analysis of the irrigation indices, EC was re-estimated using the ICP-OES cations and SAR using the probe cations (Section 2.4.3). DO saturation was calculated with the equation of Benson and Krause (1984) [34] at the altitude of the reservoir (1,293 m a.s.l.) (Text S1).
2.4. Water Quality Assessment by Use
Water quality was assessed by use (Table S4) against NOM-127-SSA1-2021 [35] and the WHO guidelines [36] for drinking water; the Mexican Ecological Water Quality Criteria CE-CCA-001/89 [37], which set criteria by use, for the raw water of the reservoir as a supply source, for irrigation, and for aquatic life; FAO 29 [38] and the USSL and Wilcox diagrams for irrigation; and the chronic criteria of the U.S. EPA [39], in parallel with CE-CCA, for aquatic life. Recreational use was not assessed because no microbiological indicators were determined in the reservoir. Table 3 summarizes the indices, their formulas, and their scales, which run in opposite directions: in the WQI and EWQI (Brown et al. (1970) scale) [40], lower values indicate better quality; in the CCME-WQI, higher values do.
2.4.1. Drinking Water: WQI, EWQI, and CCME-WQI
The network water (n = 31) was assessed with the weighted arithmetic WQI [40], the entropy-weighted WQI (EWQI) [11], and the CCME index (CCME-WQI) [32]; the same indices, with identical parameters, limits, weights, and constants, were applied to the 31 reservoir samples, so that source and network were comparable. Microbiological quality was assessed separately as a binary criterion (suitable/unsuitable by fecal coliforms), because NOM-127-SSA1-2021 [35] requires the absence of Escherichia coli or of thermotolerant (fecal) coliforms, and here fecal coliforms were determined by the most probable number method (NMX-AA-042-SCFI-2015) [27], whose lower limit of 3 MPN/100 mL defines "not detectable" in this study; total coliforms, which the current standard no longer regulates, are reported as a complementary indicator of network integrity. The primary limits were those of NOM-127 in force for localities of fewer than 50,000 inhabitants and, as a comparison scenario, the WHO guideline values (Table S17). The WQI and EWQI use nine parameters with a regulatory limit and < 15% censoring, without the very-low-limit trace metals, which would have concentrated the weight (cadmium alone, 93.5%). Following Marouf et al. (2025) [10] and Patel et al. (2023) [9], with Sᵢ the standard, Cᵢ the measured concentration, and Iᵢ the ideal value (0, except pH = 7),
In the EWQI, the weight of each parameter is derived from the Shannon entropy of the normalized data matrix (pH as |pH − 7|) and EWQI = Σⱼ wⱼ·qⱼ (Text S2). Because NOM-127 regulates already-treated water and its turbidity limit (3 NTU) presupposes clarification, we also calculated the reservoir WQI-NOM without turbidity (eight parameters, K = 0.319), and used the contribution of each parameter (qᵢ·Wᵢ) for sensitivity analysis (Table S5). The CCME-WQI combines scope F1 (percentage of parameters that fail their objective at least once), frequency F2 (percentage of individual tests that fail), and amplitude F3 (excursions of the failed tests, rescaled to 0–100):
CCME-WQI = 100 − √(F1² + F2² + F3²) / 1.732
It was applied with the 31 samples of each dataset as a single water body, as the CCME manual allows, with non-detects at the LOD and the LOD as the objective when it exceeds the criterion, so that only confirmed exceedances count: in the network, with 17 parameters and the NOM-127 limits, plus sensitivity runs without hardness and without TDS (Table S6); in the reservoir, with one supply-source run and three aquatic-life runs (Table S7; DO only at 0.30 and 5 m, the depths with an associated water sample, 16 tests; the 3-m readings do not enter the indices; details in Text S2).
2.4.2. Water Supply Source
The suitability of the reservoir as a water supply source was judged with the raw-water criteria of CE-CCA-001/89 (Table 1a of the Agreement) [37], which treat turbidity as a natural condition and set limits for Ni, B, Ba, and V. Compliance was evaluated per sample and summarized with the CCME-WQI (17 parameters, 512 tests; LOD as the objective for Ni and Se); the NOM-127 WQI is kept only as a common scale with the network.
2.4.3. Irrigation
Suitability for irrigation was assessed with six indices, with the equations and classes of Alrowais et al. (2023) (Table 3) [5]: probe EC and, calculated in meq/L with the ICP-OES cations, probe chloride, and sulfur-derived sulfate, sodium percentage (Na %), sodium adsorption ratio (SAR), magnesium hazard (MH), potential salinity (PS), and Kelly ratio (KR); the USSL diagram [41], which combines the salinity class by EC with the sodicity class by SAR, whose thresholds decrease with the logarithm of EC (Table 3, note); the Wilcox classification (Na % versus EC, with the sodium classes as Na % bands); and the FAO 29 degrees of restriction [38] for salinity, infiltration (SAR with EC), specific ion toxicity (Na, Cl⁻, B), and N-NO₃, and its normal pH range, together with the irrigation criteria of CE-CCA-001/89 and the maximum trace-element concentrations of both (Table S4).
Instrument sensitivity is described in Section 2.3; residual sodium carbonate was not calculated for lack of alkalinity. The ionic composition was represented in a Piper diagram (Piper, 1944) with the estimated bicarbonate (Section 2.3) [42], declared in the figure, and the major-ion irrigation index of Mammeri et al. (2023) [1] was calculated as a complement (Table 3).
2.4.4. Aquatic Life and Fisheries
Samples were compared with the freshwater criteria of CE-CCA-001/89 (Table 2 of the Agreement) and, in parallel, with the chronic criteria (CCC) of the U.S. EPA in the dissolved phase [39], with the hardness-dependent criteria calculated per sample from ICP-OES hardness and the EPA conversion factors to dissolved phase for Cr(III), Ni, Pb, and Zn (Table S4). In CE-CCA, total ammonia nitrogen (0.06 mg N/L) is a eutrophication criterion, and pH (±0.2 from the natural condition) was replaced in the CCME-WQI by the EPA range of 6.5 to 9.0; the EPA versions used were cadmium 2001, lentic selenium 2016, ammonia 2013 as a function of pH and temperature, and copper 1996 and aluminum 1988, since the more recent versions require dissolved organic carbon [43,44,45]; total chromium was compared with Cr(VI) (CE-CCA) [37] and Cr(III) (EPA) [39], and the remaining particulars are given in Text S2. Un-ionized ammonia was calculated with the equation of Emerson et al. (1975) [46], with the 5-m temperature for the 10- and 15-m samples:
pKₐ = 0.09018 + 2729.92 / (T + 273.15);
NH₃ fraction = 1 / [1 + 10^(pKₐ − pH)]
NH₃ fraction = 1 / [1 + 10^(pKₐ − pH)]
Each framework was summarized with the CCME-WQI in three runs: CE-CCA (18 criteria, 543 tests), EPA (14; 419), and, as a sensitivity run, CE-CCA without barium and total ammonia nitrogen, the two criteria that fail because of background conditions (16; 481). For fisheries, DO was compared with the CE-CCA minimum (5 mg/L) and with the EPA criteria of 5.0 mg/L for early life stages and 3.0 mg/L for the other life stages of warm-water species, to which the species of fishery interest in the reservoir belong [47,48]. Biological and trophic-state indices could not be calculated (no macroinvertebrates, chlorophyll a, or Secchi depth; phosphorus < LOD).
2.5. Statistical Analysis
Data were analyzed by sample (n = 31), site (n = 8), and depth stratum (0.30, 5, 10, and 15 m); site and stratum medians are medians of the per-sample values or indices, not indices calculated from median concentrations. Descriptive statistics were the median and range; non-parametric tests were used at α = 0.05, with Holm correction within each family of tests [49]; details of every test are given in Supplementary Materials, Text S3. We assessed agreement between the probe and ICP-OES (Ca²⁺, Mg²⁺, Na⁺, K⁺; 31 pairs) using the mean difference and its 95% confidence interval, Spearman correlation, and the Wilcoxon signed-rank test. The central tendency of each network parameter was compared with its NOM-127 and WHO limits with a two-sided one-sample test (Student's t or Wilcoxon signed-rank according to Shapiro–Wilk); parameters without a regulatory limit were not tested. In the network, Spearman's ρ among 15 parameters (105 pairs) was corrected by Benjamini–Hochberg [50], excluding derived variables, metals with > 50% censoring, and coliforms; the association of fecal coliforms with turbidity, nitrate, and ammonium was tested with Fisher's exact and Mann–Whitney U tests.
In the reservoir, the effect of depth on the parameters and indices was tested with the Skillings–Mack test for incomplete blocks (site as block, depth as factor; the B1 sample at 15 m is missing), with permutation p-values (10,000 iterations) and Holm adjustment [51,52], verified with the Friedman test and Kendall's W at the sites with complete data; surface-versus-5 m differences in temperature and dissolved oxygen were tested with the Wilcoxon signed-rank test.
The longitudinal gradient was described with Spearman's ρ between each variable or index and the site order (B1 to B8), with the 31 samples and with the eight site medians, to avoid pseudoreplication; no correlation matrix or principal component analysis was calculated for the reservoir, because its only structure of variation is that gradient (Section 3.2.2). The source-to-tap comparison (reservoir, n = 31, versus the 11 taps supplied by the reservoir) used the Mann–Whitney U test for 16 physicochemical parameters and the WQI-NOM and WQI-WHO, with the Hodges-Lehmann median difference and its 95% confidence interval, Cliff's δ as effect size, and Holm adjustment; Mo was excluded because of differences in the imputation criteria between the two databases, and the taps were also compared with the samples of the site closest to the intake (B8) and with the site medians as sensitivity analyses.
Index sensitivity (WQI without turbidity; CCME-WQI without hardness or TDS in the network and without Ba or total ammonia nitrogen in the reservoir; EC and irrigation indices with the other instrument, Section 2.3) is reported alongside each result. Calculations were performed in spreadsheets with visible formulas (File S1) and in Python 3.13 (SciPy 1.18.1); figures were produced with Matplotlib 3.11.2 and the map with ArcGIS Pro 3.2.
2.6. Population Survey
To document the water sources and consumption practices declared by the population, four items of the Multidimensional Instrument for Social Perception of Water Scarcity (IMPSEH) [53], validated by expert judgment and internal consistency (Cronbach's α of 0.70 to 0.86), were used: main household source, origin of water for drinking and cooking, treatment before consumption, and perceptible alterations, plus age, gender, and locality. It was administered from 7 to 9 October 2025 to 351 adults from nine localities in the municipality, using simple random sampling and written informed consent (registration UACH2025/PE/025; Bioethics Committee CBUACH-2-2026). Responses are summarized as relative frequencies for the municipality and for La Boquilla; because the survey was not administered in the sampled households, they are linked to measured quality by locality and water source. The full results of the instrument are reported elsewhere.
2.7. Geospatial Analysis
The reservoir sites (Table 1) and the 31 taps were georeferenced with a handheld GPS (WGS 84) and projected to UTM zone 13 N in ArcGIS Pro 3.2 (ESRI, Redlands, CA, USA), with which the location map (Figure 1) and the distribution maps were produced. The spatial distribution of fluoride, turbidity, total hardness, coliforms, and the WQI-NOM and WQI-WHO indices was represented with inverse distance weighted (IDW) interpolation (Geostatistical Analyst), which estimates each unsampled cell as the average of the neighboring observations weighted by the inverse of their distance, from the site values in the reservoir (n = 8) and the tap values in the network (n = 31), with natural breaks as classes. The surfaces are illustrative and were not clipped to the reservoir polygon or to the urban area: in the reservoir, with eight aligned sites, they describe the longitudinal gradient that is tested statistically (Section 2.5); in the network, where taps of different sources are interspersed, they should not be read as a continuum, so the taps are always represented as points.
3. Results and Discussion
The domestic water supply network is described first against NOM-127-SSA1-2021 and the WHO, the drinking-water frameworks (Section 3.1). La Boquilla reservoir is then evaluated in two layers: with the same indices, limits, and weights as the network, not to judge raw water by treated-water criteria, but to have a common scale that allows water quality to be tracked from the reservoir to the tap, and with the ecological criteria for water supply sources (CE-CCA-001/89), which are the ones that decide its suitability as a source (Section 3.2). On that common scale, the source and the taps it supplies are compared (Section 3.3), and finally irrigation and aquatic life are evaluated with their own criteria (Section 3.4 and Section 3.5).
3.1. Domestic Water Supply Network
3.1.1. Physicochemical Characteristics and Regulatory Compliance
The 31 network samples were taken directly at the tap and describe the water at the point of use from the five sources of Section 2.2.1; the two purification-plant taps (M20 and M22) are practically demineralized water (hardness 0.7 mg/L CaCO₃; total dissolved solids 65.3 and 18.7 mg/L), consistent with reverse osmosis. Fluoride was the only parameter whose central tendency exceeded its reference value (Table 4): median of 1.80 mg/L against the 1.5 mg/L limit of NOM-127-SSA1-2021 and the WHO (p = 0.007), with 21 of the 31 taps (67.7%) above it. Exceedance followed the water source (Figure 2a; Figure 3a): all river, spring, and well taps were above the limit, compared with 3 of the 11 reservoir taps and none of the purification-plant taps, fluoride-enriched groundwater and river water alongside dilute reservoir water, the pattern of a geogenic background in a semi-arid basin, not of a point source, as in other observatories in northern Mexico where fluoride was the only parameter exceeded [4].
Turbidity exceeded the 3 NTU limit of NOM-127 in 48.4% of the samples although the median was 0.80 NTU (p = 0.17), because the problem is concentrated in the reservoir-supplied taps: 10 of these 11 taps exceeded the limit (median 14.7 NTU), compared with 5 of 11 river taps and none of the other sources (Figure 2b; Figure 3b). Sulfate (median 199 mg/L) exceeded NOM-127 in 7 taps (the well tap and six river taps) and the WHO value in 9; the former are the same taps that account for the only exceedances of total dissolved solids, hardness, and sodium, so mineralization follows the ordering by source seen for fluoride (Figure 2c,d; Figure 3c). The remaining parameters complied, except for molybdenum against the WHO in one tap (Table 4); after the Holm correction, only sulfate against the WHO is no longer significant (p = 0.144; Table S8).
Microbiological quality was the second adverse finding: total coliforms were present in 74.2% of the samples and fecal coliforms, whose absence NOM-127 requires, in 51.6%, distributed across all sources; only the two purification-plant taps were free of them (classified as microbiologically suitable), which points to contamination distributed in the network or at the points of use (Figure S1).
The correlation structure confirms the geogenic origin of fluoride and the complementarity of the two problems (Supplementary Materials, Figure S2 and Table S10): a single mineralization block of major ions, sulfate, boron, and TDS (ρ from 0.82 to 0.99) includes fluoride (ρ from 0.76 to 0.86; q < 0.001), quantitative evidence of water–rock interaction as opposed to a point input, while turbidity defines the opposite axis (ρ from −0.44 to −0.60 with the block): the most turbid points are the least mineralized. Ammonium did not correlate with any parameter and barium only with turbidity, the two that concentrate 67% of the WQI weight, so the ammonium signal, when it appears, comes from a point source, organic matter, or the network itself, not from the geogenic background, which argues for monitoring it separately from the index (Section 3.1.2).
3.1.2. Water Quality Indices
The four indices agree that the network does not deliver satisfactory water, but they differ in severity (Table 5). The WQI-NOM had a median of 69.81 and classified 26 of the 31 taps (83.9%) as "poor" or worse (14 poor, 9 very poor, and 3 unsuitable); the WQI-WHO dropped to 58.43 because of its more lenient limits for ammonium and turbidity; the EWQI (median 68.11) classified 12 taps as "unsuitable" compared with 3 for the WQI-NOM; and the CCME-WQI, a single value for the system, gave 65.357, "fair", barely 0.357 units above the "marginal" threshold, a reading that the sensitivity analysis does not change (Table S6).
The discrepancy is a consequence of the distribution of weight (Figure S3b): in the WQI, where the weight is inversely proportional to the standard (Wᵢ = K/Sᵢ), ammonium carried 44.8% of the weight and barium 22.2% (two-thirds of the total) without ever exceeding their limits, fluoride contributed a median of 47.3% of the index, and hardness, total dissolved solids, and sulfate, with the most extreme exceedances, less than 0.2%; in the EWQI, which distributes weight according to the observed dispersion, turbidity contributed 29.4% and sulfate 16.5%, compared with 7.8% for fluoride, so it identifies four times as many taps as "unsuitable" even though it is highly correlated with the WQI-NOM (ρ = 0.900): it ranks the taps in the same order but stretches the scale. The breakdown by source inverts the fluoride ordering (Table 5; Figure S3a): the reservoir taps, those with the lowest fluoride, were the worst rated (WQI-NOM 83.95, "very poor"; EWQI 114.81, "unsuitable") because turbidity carries weight in both indices. Since fluoride and turbidity are distributed almost complementarily, no aggregate index captures both problems of the network at once and none should be reported alone; the values far exceed those of temperate water bodies (WQI from 17.62 to 32.39) [6,7] and confirm that the chosen index conditions the diagnosis [8].
3.1.3. Water Supply Sources and Reported Consumption Practices
The responses of the 351 adults surveyed place the preceding results in the context of how the water is used. In La Boquilla (n = 122), 65.6% reported the reservoir as the household's main source, 13.1% the river, and 4.1% the springs; 9.8% attributed the service to the Junta Municipal de Agua y Saneamiento, an agency that does not operate in the locality, a sign that part of the population is unaware that the water arrives from the reservoir without an operator or treatment; altogether, 92.6% are supplied from sources linked to the reservoir (Section 2.1). However, 84.6% of SFC households drink and cook with 20-L jug or bottled water, and 55.3% identified that purchase as their only "treatment"; boiling (3.4%), filtering (8.5%), and chlorinating (12.5%) are minority practices. Jug water includes the water of the two local purification plants (taps M20 and M22, the only ones without non-compliances; Section 3.1.1), although the instrument does not distinguish it from commercial bottled water, whose quality was not verified.
Exposure by ingestion to fluoride and coliforms from the tap is therefore concentrated in the 14.8% of respondents (52 people) who drink water from the tap, the river, wells, springs, or household storage tanks, 25 of them without any treatment; the rest remain exposed through the routes that jug water does not avoid, oral hygiene, personal hygiene, and food washing, and bear the cost of replacing a service that should deliver potable water. Perception of water quality coincides only partly with the measurements: 58.4% noticed no alteration at all, a proportion that rises to 68.8% among those supplied by the reservoir, whose taps are the most turbid (median 14.7 NTU; Section 3.1.1), and falls to 48.6% among river users, with odor (22%) as the main complaint.
3.1.4. Implications for Human Health
For fluoride, the 1.5 mg/L guideline value protects against dental fluorosis, which the WHO documents even at 0.9 to 1.2 mg/L [36]. The 21 taps above the guideline value place the water reaching most of the supplied households in the range where the review of 58 studies by Zohoori et al. (2025) locates systemic effects (neurodevelopment and thyroid function in children; blood pressure, thyroid, and bone structure in adults) [54], in addition to dental effects; four taps (12.9%; M9, M21, M24, and M32, from 3.38 to 4.20 mg/L) also fall within the 3 to 6 mg/L range of skeletal fluorosis [36], a pertinent warning in a semi-arid region. The remaining chemical non-compliances support a more limited reading: sulfate reaches the 1,000 to 1,200 mg/L range of laxative effect in three taps (M21, 1,723 mg/L; M25, 1,049; M24, 1,030), and hardness (median 254 mg/L) is a matter of acceptability and scaling, not a demonstrated health risk [36].
Fecal coliforms in 16 taps indicate an exposure route with immediate effect: drinking-water interventions reduce childhood diarrhea by 31% [55]. Turbidity above 1–2 NTU reduces the effectiveness of chlorination, but here it was not associated with fecal coliforms (Fisher, p = 0.29), a result consistent with predominantly mineral turbidity, which barely affects chlorination [56]; nitrate (median 2.96 mg/L, 6.1% of the limit) and ammonium were not associated with them either (p = 0.71 and 0.43), which points to contamination introduced in the network, not at the source. Verifying this requires characterizing the turbidity and measuring residual chlorine (Section 3.6).
In summary, the combined reading is the least favorable: 12 taps (38.7%) combine fluoride above 1.5 mg/L and fecal coliforms, a chronic geogenic risk and an acute public health risk, and 29 (93.5%) fail at least one of the three main criteria. Only the two purification-plant taps (M20 and M22) comply with everything: the problem is treatable with technology already present in the locality. These data establish the magnitude of potential exposure at the tap; actual exposure depends on drinking that water, which most households avoid by buying jug water (Section 3.1.3), and the harm that has occurred was not assessed (Section 3.6).
3.2. La Boquilla Reservoir
3.2.1. Physicochemical Characteristics, Facies, and Regulatory Compliance
The 31 samples taken in the reservoir describe a raw water of low and homogeneous mineralization (Table 6): hardness from 77.9 to 105 mg/L CaCO₃, with calcium as the dominant cation. All are of calcium-bicarbonate (Ca–HCO₃) facies, in a narrow field of the Piper diagram (Figure 4), with bicarbonate estimated by charge deficit (Section 2.3) and fluoride (median of 2.1% of the anions) not represented.
Except for turbidity and fluoride, no parameter exceeded NOM-127 or the WHO in any sample, and their central tendency remained below the limit (p < 0.001); pH (maximum 8.46) approached its upper bound, and ammonium complied in all 31 (Section 3.5). The results agree with Rubio Arias et al. (2014), who recorded in this reservoir a conductivity of 173 to 219 µS/cm, TDS of 153 to 187 mg/L, and chloride of 2.9 to 10.4 mg/L over a year, with the chloride maximum in the winter dry season [2]; the chloride measured here (2.2 to 3.1 mg/L), after the 2025 rains, lies at the lower end of that range, and the hardness those authors reported (295 to 360 mg/L CaCO₃) is incompatible with that conductivity, so the difference from the 78 to 105 mg/L calculated here from calcium and magnesium points to a difference in method. The calcium-bicarbonate facies, as in the Algerian reservoir of Mammeri et al. (2023), is expected from the dissolution of the basin's carbonates, whose adjacent formations are Cretaceous limestones and shales (Section 2.1) [1].
Turbidity was the only parameter exceeded in all 31 samples (median 37.6 NTU, range 11–400; limits of 3 NTU in NOM-127 and 5 in the WHO; p < 0.001). Both limits, however, apply to delivered water, already clarified, not to the raw water of a reservoir: the criterion for water supply sources (CE-CCA-001/89) sets no numerical value and refers turbidity to the natural conditions of the water body, a distinction that governs the reading of the indices (Section 3.2.3) and of the tap (Section 3.3); in the participatory observatories of northern Mexico, analogously, all the surface sources evaluated required treatment [4].
Fluoride remained overall below the 1.5 mg/L limit common to the three frameworks (mean 1.07 ± 0.48 mg/L; p < 0.001), but 6 samples (19.4%) exceeded it, up to 2.17 mg/L, all in the final reach: the four depths of B8 (La Cortina), where the intake is located, one from B6 and one from B7 (Section 3.2.2). Fluoride above 1.5 mg/L near the intake thus reproduces the network pattern (Section 3.1.1) and that of sites in northern Mexico where fluoride was the only parameter exceeded [4], and requires specific removal before distribution, because neither clarification nor disinfection removes it (Section 3.3). Against CE-CCA-001/89, the framework for raw water, the parameters in Table 6 complied in all samples except fluoride, with one caveat: nickel, excluded from Table 6 because of censoring above 50%, exceeded the 10 µg/L criterion in the eight samples in which it was detected (up to 181 µg/L), which also had detectable molybdenum and, seven of them, detectable chromium (complementary information, since molybdenum is censored; Section 2.3); in the other samples, as with selenium and phosphates, compliance is not verifiable (Table S2).
3.2.2. Vertical and Longitudinal Structure
The in situ profiles (0.30, 3, and 5 m) showed a weakly stratified surface layer (Figure 5a,b): temperature at 0.30 m exceeded that at 5 m at all eight sites, but only by 0.2 to 1.0 °C (p = 0.008), and dissolved oxygen was higher at the surface at six (p = 0.039). Oxygen (6.1 to 8.5 mg/L) exceeded the 5 mg/L minimum of CE-CCA-001/89 for aquatic life at all sites and depths measured, and its saturation, calculated at the atmospheric pressure corresponding to the altitude of the reservoir (Section 2.3), was 75 to 107% (median: 87%; site means: 79.5% at B7 and 101.8% at B8). Only B8 reached or exceeded saturation (97 to 107%), with the highest temperature and pH of the campaign, a reading consistent with photosynthetic production, though also with the sampling time, the last of the day (Section 3.6); the probe did not reach 10 and 15 m (Section 3.6).
The dissolved composition was vertically homogeneous: with site as block, no dissolved parameter and no index differed among the four depths (Skillings–Mack; Section 2.5; Table S12): the water column is mixed at least down to 15 m. Only turbidity depended on depth (p = 0.016): the deepest sample was the most turbid at all eight sites (at B3, B4, and B6 tied with the 10-m sample), with extremes at B1, B2, and B7 (up to 400 NTU), a sign of sediment resuspension (Figure 5d); the only vertical signal of the WQI-NOM comes from it.
The dominant spatial pattern was a longitudinal gradient from the river inflow (B1) to the dam (B8) (Figure 5c): sulfate (ρ = 0.93), sodium (0.88) and boron (0.81) increased toward the dam, together with fluoride (0.52), while turbidity (−0.79) and nitrate (−0.65) decreased. This is the pattern expected in a river reservoir, settling, nutrient uptake, and evaporative concentration of conservative ions toward the dam, and it explains why the final reach, near the intake, receives clearer but fluoride-richer water than the inflow (medians of 13 versus 80 NTU and of 1.92 versus 1.13 mg/L at B8 and B1; Section 3.2.1 and Section 3.3). The increase in temperature from B1 to B8 is confounded with the sampling time and is not interpreted (Section 3.6).
The vertical homogeneity of dissolved solutes agrees with Rubio Arias et al. (2014), who reported uniform behavior in most physicochemical parameters between the surface and 15 m in this reservoir, except for pH, oxygen, and temperature; the increase in turbidity in the deepest sample, by contrast, points to resuspension of bottom sediment, a mechanism that the earlier studies do not document, since Rubio Arias et al. (2014) attributed the increase in solids with depth to sedimentation and rain-driven inputs [2] and Chigor et al. (2012) linked turbidity to storms and subsequent settling [3]. The longitudinal gradient is the one expected in a river reservoir, where the loss of current velocity promotes settling and the biological uptake of nitrate toward the dam, while the longer residence time and the evaporation of the semi-arid climate concentrate the conservative solutes (sulfate, sodium, boron, and fluoride) toward the storage zone, as Rubio Arias et al. (2014) observed in this reservoir at the low water level of February, Kükrer and Mutlu (2019) in the Saraydüzü reservoir in summer [7], and Aydin et al. (2021) for fluoride [6]; none of those studies sampled along that axis, and the local precedent, which did not measure fluoride, had not documented that the intake receives clearer but fluoride-richer water. Turbidity weighs heavily in aggregate indices (correlations of −0.76 to −0.91 with the WQI of the Citarum River) [8], which explains why the only vertical signal of the WQI-NOM comes from it, without any change in the major-ion signature.
3.2.3. Water Quality Indices for Supply
On the common scale of the network (Section 3.1.2), and only in that sense, the raw water of the reservoir obtained a WQI-NOM with a median of 143.69, "unsuitable" in 25 of the 31 samples and "very poor" in the remaining 6, all from B6 to B8 (Table S18); by site, the median decreased, though not monotonically, from 289.41 at B1 to 80.37 at B8, the only site outside "unsuitable", a gradient that Figure 6a,b shows in space with both sets of limits. The classification is almost entirely one of turbidity (Section 3.2.1): it contributed a median of 81% of the index, and without it the median fell to 33.02 and all 31 samples were "good" (27) or "excellent" (4); the ordering, moreover, is inverted, because the contribution of turbidity falls from 88.6% at B1 to 52.1% at B8 as the water clarifies, and when it is removed B8 goes from the best site to the worst (46.45, still "good") because of the fluoride that concentrates in that reach: the index pushes the only exceeded chemical parameter into the background.
The framework for judging the reservoir as a source is CE-CCA-001/89, which, summarized with the CCME-WQI (Section 2.4), gave 91.63, "good" (Table S18); only fluoride (6 tests, four of them at B8) and nickel (the 8 in which it was detected; Section 3.2.1) failed. The two layers answer different questions: the WQI-NOM says that, without clarification, the water is far from potable (common scale with the network, Section 3.3); the CE-CCA says that the reservoir is a suitable source, with two management issues: fluoride near the intake and the origin of nickel. Since fluoride concentrates toward the dam (median of 1.92 mg/L at B8 versus 1.13 at B1; Section 3.2.2), the intake location at La Cortina maximizes natural clarification, but also fluoride exposure, and any future treatment must be sized to the B8 values, not the reservoir median. The EWQI and the major-ion WQI of Mammeri et al. (2023) confirm [1], respectively, the dominance of turbidity and the low mineralization (Table S13).
3.3. Source-to-Tap
The comparison was restricted to the 11 taps supplied by the reservoir, all in the locality of La Boquilla, against the 31 reservoir samples, and was repeated against the four samples from B8 (La Cortina), where the intake is located, and against the site medians (Section 2.5; Table 7). Two caveats qualify it: the sampling campaigns were not simultaneous (the household taps over several days in October 2025; the reservoir on a single day of the same month), so part of the differences may be temporal, and three taps (M2, M5, and M11) had calcium, magnesium, barium, and hardness below the reservoir minimum, a pattern compatible in M2 (0.08 NTU) with a household filter, with no equivalent explanation in M5 and M11 and without field verification. They were retained because they describe the water consumed (Supplementary Materials, Figure S4c).
Turbidity was the parameter that decreased the most from source to tap, from 37.6 to 14.7 NTU (p = 0.001), and with it the two indices, which in the reservoir depend almost entirely on turbidity (Section 3.2.3): the WQI-NOM fell from 143.69 ("unsuitable") to 83.95 ("very poor") and the WQI-WHO from 82.76 to 57.23 ("poor") (Table 7). That improvement is not produced by the supply chain but by the reservoir: the intake is at B8, in the reach that settling along the B1 to B8 axis has clarified (Section 3.2.2), and against the four B8 samples the taps did not differ in either turbidity or WQI-NOM. The water reaches the tap with the turbidity of La Cortina, without appreciable clarification: 10 of the 11 taps remain above the 3 NTU of NOM-127 (Supplementary Materials, Figure S4a; the exception is M2) and their WQI-NOM is still a turbidity classification, now in the delivered water, to which that limit does apply (Section 3.2.1). Figure 6 shows this spatially: the La Boquilla taps (Figure 6c,d) reproduce the class of the dam reach (Figure 6a,b).
Fluoride did not change (p = 0.61; 1.000 after Holm), as a dissolved ion that neither settling nor distribution removes; three taps (M2, M7, and M11) exceeded 1.5 mg/L, up to 1.68 mg/L. Chloride (all 11 taps above the reservoir maximum of 3.12 mg/L), electrical conductivity, and ammonium increased at the tap with differences that hold against the site medians (p < 0.001); sodium, sulfate, and pH changed in the main comparison but not against the site medians, and the rest did not differ after correction (Table 7). The water is chlorinated with an undocumented reagent; the joint increase in chloride and sodium is compatible with sodium hypochlorite, but the increase in ammonium points in the opposite direction, since a chlorine-based disinfectant at a sufficient dose oxidizes it: its accumulation at the tap, together with fecal coliforms in 4 of the 11 taps and total coliforms in 9, not determined in the reservoir, suggests insufficient disinfection in dose or contact time and an input of nitrogen in the network or in the household storage tanks. Nitrate adds a pattern that deserves field verification: taps M26 to M30 had 2.15 to 4.26 mg/L, above the reservoir median (0.43 mg/L) and four of them above its maximum (2.38 mg/L), together with the highest chloride and, in three of the four, fecal coliforms, which suggests a sector of the network with its own nitrogen source (Figure S4d; Figure 1c).
Precedents from reservoir–network systems did not follow the water to the tap: in Zaria, Nigeria, the reservoir was the least contaminated compartment [3], and in Algeria it had the best WQI of four stations [1], but neither study measured the reach downstream of the intake. On that reach, the review by Wright et al. (2004) found that microbiological contamination between the source and the point of use is widespread, with a larger relative increase where the source has low counts, as in a reservoir [57]; it dealt with water stored in households, whereas here the tap was sampled (Section 3.1.1): the deterioration occurs after the intake, in the network or in the household plumbing. A possible input of wastewater from the surroundings, as documented in Zaria from domestic discharges and deficient septic tanks [3], is a hypothesis to be verified in the field (Section 3.6).
In sum, the supply chain does not treat the reservoir water: the reduction in turbidity and in the indices is due to the location of the intake, and the water reaches the tap without appreciable clarification, with a median almost five times the NOM-127 limit; fluoride is not removed and exceeds the limit in 3 of 11 taps; distribution adds chloride, a difference that holds in all three comparisons, and, with less certainty, ammonium; and fecal coliforms appear in more than a third of the taps, not determined at the source. The quality at the point of use is the raw water of La Cortina plus what the distribution system adds (Section 4).
3.4. Suitability for Irrigation
3.4.1. Salinity and Sodicity Indices
By all conventional indices, the reservoir water is suitable for irrigation (Figure 7; Supplementary Materials, Table S19): electrical conductivity (230 to 353 µS/cm) remained below the 700 µS/cm of the "excellent" class in all 31 samples, and the sodium adsorption ratio (SAR), magnesium hazard (MH), potential salinity (PS), and Kelly ratio (KR) were in the best class of each scale; only Na % was of "good" quality, because sodium is the second most abundant cation of the reservoir (Section 3.2.1). In the Wilcox diagram, all 31 were of "good" quality (Figure 7b). Residual sodium carbonate could not be calculated because alkalinity was not determined (Section 3.6).
The C1S1 and C2S1 classes (low to medium salinity, low sodicity hazard) agree with the general agricultural suitability that Rubio Arias et al. (2014) attributed to this reservoir with their ICA, although that study did not measure sodium, calcium, magnesium, or boron or calculate sodicity indices [2]. The result matters for the crops of greatest socioeconomic weight in the Irrigation District, above all pecan (Carya illinoinensis), whose orchards require large irrigation depths and which is sensitive to salts, chloride, and, especially, boron [58]: a water with SAR < 1 and boron of 0.026 to 0.051 mg/L (Table 6) poses no risk of clay dispersion or specific ion toxicity [38].
The sodicity indices followed the longitudinal gradient of Section 3.2.2 without changing class: SAR, MH, PS, KR, and Na % increased from B1 to B8 (Spearman's ρ with site order from 0.64 to 0.94, p < 0.001 in all five; Table S15(e)), with the median SAR rising from 0.62 at B1 to 0.74 at B8, and conductivity only weakly (ρ = 0.44, p = 0.013), a correlation that does not hold with the site medians. No index depended on depth (Holm-adjusted p = 1.000 in all six; Section 2.5; Table S15) or on the instrument: with conductivity estimated from the cations or with the probe cations, the 31 samples remain in the best class of each index (Section 2.3).
The gradient reflects evaporative concentration and the longer residence time toward the dam, characteristic of reservoirs in semi-arid regions [2,7], but it does not change any class: the low mineralization leaves a wide margin relative to the thresholds, and the vertical uniformity of the indices and their independence from the instrument mean that water withdrawn at any depth is of homogeneous quality for the gravity or pressurized irrigation systems of the district. By comparison, KR exceeded 1 in 51% of the wells of the Al-Jouf aquifer and PS was injurious in 21% [5], an MH of 57% renders one of the basins of Aydin et al. (2021) unsuitable, and the six main dams of Jordan have SAR from 1.14 to 5.15 [6], mostly in C3S1 [59]: La Boquilla is a low-salinity extreme.
3.4.2. FAO 29 Guidelines, Ecological Criteria, and Trace Elements
The FAO 29 guidelines [38] evaluate irrigation water by its effect on the soil and the crop, with three degrees of restriction on use (none, slight to moderate, severe) for salinity, infiltration, specific ion toxicity, and nitrogen (Table S4). The reservoir water had no restriction due to salinity (0.23 to 0.35 dS/m against the 0.7 threshold), nor due to sodium, chloride, or boron toxicity, nor due to nitrate; pH exceeded the normal range (6.5 to 8.4) in two samples, which the guideline treats as a signal to review the analysis, not as a restriction; the only restriction, of slight to moderate degree, was for infiltration in all 31 samples. The risk, therefore, is not soil sodification or salinization but a loss of permeability in fine-textured soils, managed with agricultural gypsum amendments or by choosing well-structured soils. Against the ecological criteria for irrigation of CE-CCA-001/89, all 31 samples complied in conductivity, total dissolved solids, chloride, sulfate, boron, nitrate, and pH.
All 31 samples also complied with the FAO recommended maximum concentrations of trace elements for continuous irrigation, which CE-CCA-001/89 adopts and which are set so that the element does not accumulate in the soil to the point of harming the crop or those who consume the harvest (Table S4) [38], with detection limits that make compliance verifiable for the non-detected elements except selenium (Table S2), and with two exceptions that do not restrict irrigation. Molybdenum exceeded 10 µg/L in six samples (15.9 to 61.5 µg/L), all with detected nickel, within the Cr–Ni–Mo pattern of Section 3.2.1; that limit protects not the plant, which tolerates much more, but livestock, because forage irrigated with molybdenum-rich water can induce molybdenosis and copper deficiency in ruminants [38], which matters for the alfalfa of the district. Fluoride exceeded the attention threshold of 1.0 mg/L in 16 samples (up to 2.17 mg/L), following the evaporative enrichment toward the dam (Section 3.2.2; Aydin et al. 2021 [6]), but FAO considers it tolerable up to 15 mg/L for most crops, and in neutral and alkaline soils it is immobilized as poorly soluble calcium fluoride. Overall, the water is free of metal contamination, unlike the Saraydüzü reservoir, where copper, zinc, and iron exceeded the limits [7], and the wells of the pecan-growing area of Chihuahua, with exceedances of arsenic and boron [58]; the local precedent did not measure metals [2].
3.5. Aquatic Life and Fisheries
3.5.1. Compliance with Aquatic Life Protection Criteria
The suitability of the reservoir for aquatic life was assessed against the Mexican ecological criteria for freshwater (CE-CCA-001/89) [37] and, in parallel, against the U.S. EPA chronic criteria [39], with those dependent on hardness, pH, and temperature calculated for each sample (Section 2.4; Supplementary Materials, Table S20). Of the 18 CE-CCA criteria, 12 were met in all 31 samples (for lead, selenium, and phosphates without compliance being verifiable, because the detection limit exceeds the criterion; Table S2), and of the 14 EPA criteria, 12; total chromium was compared with the CE-CCA criterion for Cr(VI) and with the EPA criterion for Cr(III), a conservative comparison against the former. Two CE-CCA criteria failed in all 31 samples and are interpreted as background conditions, not contamination. Barium (50.5 to 79.5 µg/L versus 10) is lithogenic, homogeneous over depth, increases gently toward the dam (Section 3.2.2), remains more than 12-fold below the CE-CCA criterion for water supply sources, and has no EPA criterion. Total ammonia nitrogen (0.132 to 0.230 mg N/L) met the EPA toxicity criterion, which depends on pH and temperature (0.41 to 1.29 mg N/L), in all samples, by a factor of almost three to eight, but exceeded the 0.06 mg N/L of the CE-CCA, which is a eutrophication criterion: the two frameworks do not disagree about the risk to organisms; the Mexican one aims to limit nutrient inputs, an objective that the water does not meet and that cannot be assessed with phosphates either, whose criterion lies ten times below the detection limit for phosphorus.
The other four criteria were exceeded locally. Fluoride exceeded 1.0 mg/L in 16 of the 31 samples, at all sites except B3 and at the four depths of B8 (Section 3.2.2); it is the only one of the four measured without censoring and, as in the previous uses, the only persistent chemical problem of the reservoir. The three metals are censored in more than 70% of the samples, and their exceedances depend on a few detections: cadmium exceeded the CE-CCA in 6 of 9 detections and counts as an exceedance against the EPA in all 9, because that criterion lies below the detection limit; total chromium exceeded the 10 µg/L for Cr(VI) in 4, without exceeding that for Cr(III); nickel exceeded the CE-CCA only at B6-15 m and the EPA criterion in the same four samples as chromium. These are isolated detections, with no clustering by site or depth.
3.5.2. Un-Ionized Ammonia, Dissolved Oxygen, and CCME-WQI
Un-ionized ammonia, the toxic fraction of ammonium, calculated for each sample from pH and temperature (Section 2.4), represented 1.9% to 9.3% of total ammonium and reached a maximum of 0.014 mg N/L at B8-0.30 m, the sample with the highest temperature (19.1 °C) and a pH of 8.44, without exceeding any threshold: the EPA criterion, which already incorporates un-ionized ammonia, was met by a factor of almost three to eight.
Dissolved oxygen in the 16 samples from 0.30 and 5 m (6.13 to 8.48 mg/L) met the 5 mg/L minimum of CE-CCA-001/89 in all of them, and no measurement fell below 75% saturation (Section 3.2.2), the EPA criterion for the early life stages of warm-water species, to which all the species of fishery interest in the reservoir belong [47]. BOD₅ and COD were below their quantification limits in 30 of the 31 samples (Section 2.3), so the assessment of aquatic life rests on the chemical toxicity criteria and the oxygen of the surface layer, both of which were met; trophic state and the hypolimnion remain unassessed (Section 3.6).
Summarized as a single water body with the CCME-WQI (Section 2.4), the two frameworks produced different categories for the same water: 72.99 (fair) with the 18 CE-CCA-001/89 criteria and 91.45 (good) with the 14 EPA criteria (Table S16). The discrepancy is explained almost entirely by barium and total ammonia nitrogen, which fail the Mexican criterion in all 31 samples and with wide excursions (62 of the 89 failed tests and 93% of the cumulative amplitude); when they are excluded, as a geochemical background criterion and a eutrophication criterion, the CE-CCA index rises to 85.10 (good), with fluoride, cadmium, chromium, and nickel as the only parameters failing their criteria.
3.6. Limitations, Strengths, and Perspectives
The results come from a single sampling campaign and do not describe the seasonal variation presupposed by chronic exposure thresholds; the reservoir was sampled on a single day in October, from B1 to B8, so that the thermal gradient and part of the oxygen pattern are confounded with time of day, and the vertical structure is that of that day, not that of summer; oxygen was measured only down to 5 m, so the hypolimnion remains unassessed and the un-ionized ammonia at 10 and 15 m was calculated with the temperature at 5 m. Without alkalinity, bicarbonate is an estimate by charge deficit and residual sodium carbonate was not calculated; without chlorophyll a, transparency, macroinvertebrates, or detectable phosphorus, trophic state was not assessed, so the reading of total ammonia nitrogen as a background condition does not rest on a trophic measurement; and the pH criterion of CE-CCA-001/89 requires more than one sampling.
The study is, to our knowledge, the first comparison of the source with the domestic network in this system, whereas published reservoir–network studies stop at the intake; the reservoir is the most important water system in Chihuahua, the largest state in Mexico [2], and the evidence can be used in health policy and in water management. The limitations define the agenda: seasonal and simultaneous campaigns in the reservoir and at the taps, the next one in the warm season, when stratification reduces hypolimnetic oxygen; in the reservoir, lower detection limits for nickel, selenium, lead, and cadmium, alkalinity, oxygen and temperature profiles down to the bottom, nutrients, chlorophyll a, transparency, macroinvertebrates, and raw-water microbiology; in the network, more taps, residual chlorine with reagent and dose, the nature of the turbidity, and ammonium surveillance. Quantifying the harm requires an epidemiological study in the supplied population, and the remaining IMPSEH dimensions will make it possible to contrast perception and willingness to pay with the indices obtained and the cost of the proposed clarification and disinfection.
4. Conclusions
The study assessed the SFC domestic network for human consumption and La Boquilla reservoir, which supplies it, as a source and for irrigation, aquatic life, and fisheries, using the same index scale for the source and network (objective i). The network presents two distinct problems that demand distinct solutions: the geogenic fluoride of the river, spring, and well taps, which requires removal, and fecal coliforms, independent of the physicochemical indices, which require verifiable disinfection and network integrity; no aggregate index captures both at once, so the microbiological criterion must always accompany the index. The purification-plant taps, the only ones without non-compliance, show that the problem is treatable with technology already present in the locality, while most households in La Boquilla replace tap water with jug or bottled water and bear the cost of a service that does not purify. The reservoir is a suitable water supply source: calcium-bicarbonate water of low mineralization, in a mixed water column, with a longitudinal gradient that clarifies the water toward the dam and concentrates fluoride there, the only persistent chemical problem for consumption, source, and aquatic life, with nickel pending confirmation; the IDW maps locate the exceedances by water source and confirm the gradient toward the dam (objective ii). For irrigation, it is suitable in all indices and samples, with the sole caveat, contrary to the usual one in arid zones, of a salinity so low that it may reduce infiltration in fine-textured soils; for aquatic life, it is a habitat of good quality by toxicity criteria, and fair under the Mexican framework. The supply chain does not treat the water (objective iii): the improvement relative to the reservoir is due to settling up to the intake at La Cortina, not to treatment; the tap receives the turbidity and fluoride of that reach, distribution adds chloride and, with less certainty, ammonium, and the delivered water presents fecal coliforms, not determined at the source. The interventions with the greatest effect in La Boquilla are clarification and verifiable disinfection, with documented reagents and doses and measured residual chlorine, along with fluoride removal, which is essential for the river, spring, and well taps and a minor but real problem in the reservoir-supplied taps. Following the water from the source to the point of use on the same scale made it possible to distinguish what the reservoir resolves on its own from what the distribution system introduces, the distinction that guides management and public health decisions in a locality that depends entirely on the most important reservoir of the largest state in northern Mexico.
Supplementary Materials
The following supporting information can be downloaded at the website of this paper posted on Preprints.org, Text S1: Data processing and quality control in detail; Text S2: Water quality indices in detail (CCME-WQI terms, LOD as objective, exclusion of coliforms, CE-CCA-001/89 irrigation criteria, FAO 29 infiltration grades, ICA of Rubio Arias with K = 1.0 and 0.75); Text S3: Statistical analysis in detail; Table S1: Analytical procedures and working ranges; Table S2: Detection limits and censoring by parameter and dataset; Table S3: Analytical parameters of the IMACIMUS multi-ion probe; Table S4: Criteria by use (NOM-127-SSA1-2021, WHO, CE-CCA-001/89, FAO 29, U.S. EPA); Table S5: WQI-NOM of the reservoir without turbidity and contribution of each parameter; Table S6: Parameters, objectives, and runs of the CCME-WQI for the network; Table S7: Parameters and objectives of the CCME-WQI runs for the reservoir; Table S8: One-sample tests of the network parameters against NOM-127 and WHO; Table S9: Water quality indices per tap for the network; Table S10: Spearman correlation matrix of the network; Table S11: One-sample tests of the reservoir parameters; Table S12: Depth tests (Skillings–Mack) for the reservoir; Table S13: Indices per sample for the reservoir (WQI-NOM, WQI-WHO, EWQI, major-ion WQI, ICA); Table S14: Source-to-tap comparison: tests, sensitivities and rank-biserial coefficient; Table S15: Irrigation indices per sample, FAO 29 degrees of restriction and CE-CCA-001/89 irrigation criteria; Table S16: Aquatic life criteria per sample and CCME-WQI runs; Table S17: Parameters, limits, and weights of the WQI and EWQI (NOM-127 and WHO scenarios); Table S18: Water quality indices for supply of La Boquilla reservoir, by site and for the reservoir; Table S19: Irrigation indices of La Boquilla reservoir by site; Table S20: Compliance with freshwater aquatic life protection criteria (CE-CCA-001/89 and U.S. EPA); Figure S1: Spatial distribution of total and fecal coliforms in the network; Figure S2: Spearman correlation matrix of the network parameters; Figure S3: Water quality indices of the network by water source and weight of each parameter in the WQI and EWQI; Figure S4: Source-to-tap comparison of turbidity, fluoride, hardness, and nitrate (reservoir, B8, and taps); File S1: Spreadsheets with visible formulas.
Author Contributions
Conceptualization, B.G.B.P.; methodology, B.G.B.P., C.D.M., A.C.C. and E.P.B.; software, B.G.B.P., and M.C.V.A.; validation, B.G.B.P.; formal analysis, B.G.B.P.; investigation, B.G.B.P., M.G.R.S., A.C.C., and C.D.M.; resources, B.G.B.P. and E.P.B.; data curation, B.G.B.P. and M.C.V.A.; writing—original draft preparation, B.G.B.P.; writing—review and editing, B.G.B.P.; visualization, B.G.B.P. and M.C.V.A.; supervision, B.G.B.P.; project administration, B.G.B.P.; funding acquisition, B.G.B.P. All authors have read and agreed to the published version of the manuscript.
Funding
This research was funded by the Universidad Autónoma de Chihuahua through its internal research program "Más Ciencia Más UACH, 2025", grant number UACH2025/PE/025, within the project "Percepción social sobre escasez hídrica, prácticas de conservación e impacto ambiental en el entorno de la presa La Boquilla: consecuencias para la salud pública" (Social perception of water scarcity, conservation practices, and environmental impact around La Boquilla reservoir: implications for public health).
Institutional Review Board Statement
The study was conducted in accordance with the Declaration of Helsinki and approved by the Bioethics Committee of the Universidad Autónoma de Chihuahua (protocol code CBUACH-2-2026, approved on 18 February 2026; research registration UACH2025/PE/025).
Informed Consent Statement
Written informed consent was obtained from all survey respondents involved in the study.
Data Availability Statement
The data supporting the reported results are contained within the article and its Supplementary Materials (File S1, spreadsheets with visible formulas).
Acknowledgments
The authors thank the Municipal Government (Presidencia Municipal) of San Francisco de Conchos for the permits, logistical support, and facilities that made the fieldwork possible, and the residents of San Francisco de Conchos who voluntarily participated in this study. During the preparation of this manuscript, the authors used Claude (Anthropic, San Francisco, CA, USA) to improve the language, grammar, and readability of the text. The authors have reviewed and edited the output and take full responsibility for the content of this publication.
Conflicts of Interest
The authors declare no conflicts of interest. The funder had no role in the design of the study; in the collection, analyses, or interpretation of data; in the writing of the manuscript; or in the decision to publish the results.
Abbreviations
The following abbreviations are used in this manuscript:
| BOD₅ | Five-day biochemical oxygen demand |
| CCC | Criterion continuous concentration (U.S. EPA chronic criterion) |
| CCME-WQI | Water quality index of the Canadian Council of Ministers of the Environment |
| CE-CCA-001/89 | Mexican Ecological Water Quality Criteria (Criterios Ecológicos de Calidad del Agua) |
| COD | Chemical oxygen demand |
| CONAGUA | Comisión Nacional del Agua (National Water Commission, Mexico) |
| DO | Dissolved oxygen |
| EC | Electrical conductivity |
| EPA | United States Environmental Protection Agency |
| EWQI | Entropy-weighted water quality index |
| FAO | Food and Agriculture Organization of the United Nations |
| GIS | Geographic information system |
| ICA | Índice de calidad del agua (water quality index of Rubio Arias et al., 2014) |
| ICP-OES | Inductively coupled plasma optical emission spectrometry |
| IDW | Inverse distance weighting |
| IMPSEH | Multidimensional Instrument for Social Perception of Water Scarcity |
| INEGI | Instituto Nacional de Estadística y Geografía |
| JCAS | Junta Central de Agua y Saneamiento del Estado de Chihuahua |
| KR | Kelly ratio |
| LOD | Limit of detection |
| LOQ | Limit of quantification |
| MH | Magnesium hazard |
| MPN | Most probable number |
| NAMO | Maximum ordinary water level (Nivel de Aguas Máximas Ordinarias) |
| NOM | Norma Oficial Mexicana (Mexican Official Standard) |
| NMX | Norma Mexicana (Mexican Standard) |
| NTU | Nephelometric turbidity unit |
| PS | Potential salinity |
| RSD | Relative standard deviation |
| SAR | Sodium adsorption ratio |
| SFC | San Francisco de Conchos |
| TDS | Total dissolved solids |
| TSS | Total suspended solids |
| UACH | Universidad Autónoma de Chihuahua |
| USSL | United States Salinity Laboratory |
| WHO | World Health Organization |
| WQI | Water quality index |
References
- Mammeri, A.; Tiri, A.; Belkhiri, L.; Salhi, H.; Brella, D.; Lakouas, E.; Tahraoui, H.; Amrane, A.; Mouni, L. Assessment of Surface Water Quality Using Water Quality Index and Discriminant Analysis Method. Water 2023, 15, 680. [Google Scholar] [CrossRef]
- Rubio Arias, H.O.; Ortiz Delgado, R.C.; Quintana Martínez, R.M.; Saucedo Terán, R.A.; Ochoa Rivero, J.M.; Rey Burciaga, N.I. Índice de Calidad de Agua (ICA) En La Presa La Boquilla En Chihuahua, México. Ecosistemas Recur. Agropecu. 2014, 1, 139–150. [Google Scholar]
- Chigor, V.N.; Umoh, V.J.; Okuofu, C.A.; Ameh, J.B.; Igbinosa, E.O.; Okoh, A.I. Water Quality Assessment: Surface Water Sources Used for Drinking and Irrigation in Zaria, Nigeria Are a Public Health Hazard. Environ. Monit. Assess. 2012, 184, 3389–3400. [Google Scholar] [CrossRef] [PubMed]
- Puente Miranda, D.G.; Valenzuela Garcia, L.I.; Alarcón Herrera, M.T. Determinación Histórica de Índices de Calidad Del Agua En Observatorios Participativos En El Norte de México. Rev. Int. Contam. Ambient. 2023, 39, 127–137. [Google Scholar] [CrossRef]
- Alrowais, R.; Abdel Daiem, M.M.; Li, R.; Maklad, M.A.; Helmi, A.M.; Nasef, B.M.; Said, N. Groundwater Quality Assessment for Drinking and Irrigation Purposes at Al-Jouf Area in KSA Using Artificial Neural Network, GIS, and Multivariate Statistical Techniques. Water 2023, 15, 2982. [Google Scholar] [CrossRef]
- Aydin, H.; Ustaoğlu, F.; Tepe, Y.; Soylu, E.N. Assessment of Water Quality of Streams in Northeast Turkey by Water Quality Index and Multiple Statistical Methods. Environ. Forensics 2021, 22, 270–287. [Google Scholar] [CrossRef]
- Kükrer, S.; Mutlu, E. Assessment of Surface Water Quality Using Water Quality Index and Multivariate Statistical Analyses in Saraydüzü Dam Lake, Turkey. Environ. Monit. Assess. 2019, 191, 71. [Google Scholar] [CrossRef] [PubMed]
- Marselina, M.; Wibowo, F.; Mushfiroh, A. Water Quality Index Assessment Methods for Surface Water: A Case Study of the Citarum River in Indonesia. Heliyon 2022, 8, e09848. [Google Scholar] [CrossRef] [PubMed]
- Patel, D.D.; Mehta, D.J.; Azamathulla, H.M.; Shaikh, M.M.; Jha, S.; Rathnayake, U. Application of the Weighted Arithmetic Water Quality Index in Assessing Groundwater Quality: A Case Study of the South Gujarat Region. Water 2023, 15, 3512. [Google Scholar] [CrossRef]
- Marouf, A.A.; Ameen, H.A.; Qasim, M.J. Water Quality Index Utilization for Groundwater Quality Assessment for Wells in Zakho District, Kurdistan Region-Iraq. Water Sci. 2025, 39, 325–335. [Google Scholar] [CrossRef]
- Zhang, Y.; Li, X.; Luo, M.; Wei, C.; Huang, X.; Xiao, Y.; Qin, L.; Pei, Q. Hydrochemistry and Entropy-Based Groundwater Quality Assessment in the Suining Area, Southwestern China. J. Chem. 2021, 2021, 1–11. [Google Scholar] [CrossRef]
- Hussein, A.K.; Kadhim, N.A.; Jaber, A.S.; Abojassim, A.A. Water Quality Index for Surface Water Assessment by Using Gis Techniques, Alnajaf, Kufa, Iraq. IOP Conf. Ser. Mater. Sci. Eng. 2020, 928, 072023. [Google Scholar] [CrossRef]
- González-Horta, C.; Ballinas-Casarrubias, L.; Sánchez-Ramírez, B.; Ishida, M.; Barrera-Hernández, A.; Gutiérrez-Torres, D.; Zacarias, O.; Saunders, R.; Drobná, Z.; Mendez, M.; et al. A Concurrent Exposure to Arsenic and Fluoride from Drinking Water in Chihuahua, Mexico. Int. J. Environ. Res. Public. Health 2015, 12, 4587–4601. [Google Scholar] [CrossRef] [PubMed]
- Instituto Nacional de Estadística y Geografía. Estudio Hidrológico Del Estado de Chihuahua; Instituto Nacional de Estadística y Geografía: Aguascalientes, 1999. [Google Scholar]
- Comisión Nacional del Agua. Acuerdo Por El Que Se Da a Conocer El Resultado de Los Estudios Técnicos de La Región Hidrológica Número 24 Bravo-Conchos; Diario Oficial de la Federación, 2011. [Google Scholar]
- López Porras, G.; De Los Ríos, G.S.-A.; Cortés-Palacios, L.; Espino Enríquez, L.M. Assessing Water-Governance Fragility in a Water-Scarce Agricultural Area of Northern Mexico. Water 2026, 18, 2051. [Google Scholar] [CrossRef]
- Junta Central de Agua y Saneamiento del Estado de Chihuahua. Plan Estatal Hídrico 2040 de Chihuahua; Gobierno del Estado de Chihuahua: Chihuahua, México, 2018. [Google Scholar]
- La Cuenca Del Río Conchos: Una Mirada Desde Las Ciencias Ante El Cambio Climático; Ibáñez Hernández, O.F., Montero Martínez, M.J., Eds.; Instituto Mexicano de Tecnología del Agua: Jiutepec, Morelos, 2017; ISBN 978-607-9368-77-7. [Google Scholar]
- World Wildlife Fund. Propuesta de Caudal Ecológico En La Cuenca Del Río Conchos y Su Consideración En El Estudio de Disponibilidad de Aguas Superficiales; WWF México: Mexico City, Mexico, 2009. [Google Scholar]
- Comisión Nacional del Agua Sistema Nacional de Información Del Agua (SNIARN): Monitoreo Del Almacenamiento En Las Principales Presas de México (Presa La Boquilla, Chihuahua). 2024.
- Rodríguez-Pineda, J.A.; Carreón, E.; Lafon, A.; Santos, J.; Ruíz, R. Cambio de Uso de Suelo En La Cuenca Del Río Conchos, Chihuahua, México. In La cuenca del río Conchos: Una mirada desde las ciencias ante el cambio climático; Ibáñez Hernández, O.F., Montero Martínez, M.J., Eds.; Instituto Mexicano de Tecnología del Agua, 2017; pp. 157–204. [Google Scholar]
- Puga, D. Reseña Histórica y Socioambiental de La Construcción de La Presa La Boquilla y El Desarrollo Local En San Francisco de Conchos 2010.
- Secretaría de Economía. Norma Mexicana NMX-AA-028-SCFI-2001, Análisis de agua – Determinación de la demanda bioquímica de oxígeno en aguas naturales, residuales (DBO₅) y residuales tratadas – Método de prueba; Diario Oficial de la Federación: Mexico City, Mexico, 2001. [Google Scholar]
- Secretaría de Economía. Norma Mexicana NMX-AA-030/1-SCFI-2012, Análisis de Agua – Medición de La Demanda Química de Oxígeno En Aguas Naturales, Residuales y Residuales Tratadas – Método de Prueba – Parte 1 – Método de Reflujo Abierto; Diario Oficial de la Federación: Mexico City, Mexico, 2016. [Google Scholar]
- Secretaría de Economía. Norma Mexicana NMX-AA-034-SCFI-2015, Análisis de Agua – Medición de Sólidos y Sales Disueltas En Aguas Naturales, Residuales y Residuales Tratadas – Método de Prueba; Diario Oficial de la Federación: Mexico City, Mexico, 2016. [Google Scholar]
- Secretaría de Economía. Norma Mexicana NMX-AA-038-SCFI-2001, Análisis de Agua – Determinación de Turbiedad En Aguas Naturales, Residuales y Residuales Tratadas – Método de Prueba; Diario Oficial de la Federación: Mexico City, Mexico, 2001. [Google Scholar]
- Secretaría de Economía. Norma Mexicana NMX-AA-042-SCFI-2015, Análisis de Agua – Enumeración de Organismos Coliformes Totales, Organismos Coliformes Fecales (Termotolerantes) y Escherichia Coli – Método Del Número Más Probable En Tubos Múltiples; Diario Oficial de la Federación: Mexico City, Mexico, 2016. [Google Scholar]
- Secretaría de Economía. Norma Mexicana NMX-AA-077-SCFI-2001, Análisis de Aguas – Determinación de Fluoruros En Aguas Naturales, Residuales y Residuales Tratadas; Diario Oficial de la Federación: Mexico City, Mexico, 2001. [Google Scholar]
- U.S. Environmental Protection Agency. Guidance for Data Quality Assessment: Practical Methods for Data Analysis, EPA QA/G-9, QA00 Update; Office of Environmental Information: Washington, DC, USA, 2000. [Google Scholar]
- Hornung, R.W.; Reed, L.D. Estimation of Average Concentration in the Presence of Nondetectable Values. Appl. Occup. Environ. Hyg. 1990, 5, 46–51. [Google Scholar] [CrossRef]
- Helsel, D.R. Statistics for Censored Environmental Data Using Minitab® and R: Helsel/Statistics for Environmental Data 2E; John Wiley & Sons, Inc.: Hoboken, NJ, USA, 2011; ISBN 978-1-118-16272-9. [Google Scholar]
- Canadian Council of Ministers of the Environment. Canadian Water Quality Guidelines for the Protection of Aquatic Life: CCME Water Quality Index, User’s Manual 2017 Update; Canadian Council of Ministers of the Environment, 2017. [Google Scholar]
- American Public Health Association; American Water Works Association. Water Environment Federation Standard Methods for the Examination of Water and Wastewater, 23rd ed.; Rice, E.W., Baird, R.B., Eaton, A.D., Eds.; American Public Health Association: Washington, D.C., 2017; ISBN 978-0-87553-287-5. [Google Scholar]
- Benson, B.B.; Krause, D. The Concentration and Isotopic Fractionation of Oxygen Dissolved in Freshwater and Seawater in Equilibrium with the Atmosphere. Limnol. Oceanogr. 1984, 29, 620–632. [Google Scholar] [CrossRef]
- Secretaría de Salud. Norma Oficial Mexicana NOM-127-SSA1-2021, Agua Para Uso y Consumo Humano. Límites Permisibles de La Calidad Del Agua. Diario Oficial de la Federación: Mexico City, Mexico, 2022.
- World Health Organization. Guidelines for Drinking-Water Quality: Fourth Edition Incorporating the First and Second Addenda, 4th ed.; World Health Organization, 2022. [Google Scholar]
- Secretaría de Desarrollo Urbano y Ecología. Acuerdo Por El Que Se Establecen Los Criterios Ecológicos de Calidad Del Agua CE-CCA-001/89; Diario Oficial de la Federación, 1989. [Google Scholar]
- Ayers, R.S.; Westcot, D.W. Water Quality for Agriculture; Food and Agriculture Organization of the United Nations: Rome, 1985. [Google Scholar]
- U.S. Environmental Protection Agency National Recommended Water Quality Criteria – Aquatic Life Criteria Table. Available online: https://www.epa.gov/wqc/national-recommended-water-quality-criteria-aquatic-life-criteria-table (accessed on 11 November 2026).
- Brown, R.M.; McClelland, N.I.; Deininger, R.A.; Tozer, R.G. A Water Quality Index: Do We Dare? Water Sew. Work. 1970, 117, 339–343. [Google Scholar]
- Diagnosis and Improvement of Saline and Alkali Soils; Richards, L.A., Ed.; Agriculture Handbook; U.S. Department of Agriculture: Washington, D.C., 1954. [Google Scholar]
- Piper, A.M. A Graphic Procedure in the Geochemical Interpretation of Water-analyses. Eos Trans. Am. Geophys. Union 1944, 25, 914–928. [Google Scholar] [CrossRef]
- U.S. Environmental Protection Agency. 2001 Update of Ambient Water Quality Criteria for Cadmium; Office of Water: Washington, DC, USA, 2001. [Google Scholar]
- U.S. Environmental Protection Agency. Aquatic Life Ambient Water Quality Criterion for Selenium – Freshwater 2016; Office of Water: Washington, DC, USA, 2016. [Google Scholar]
- U.S. Environmental Protection Agency. Aquatic Life Ambient Water Quality Criteria for Ammonia – Freshwater 2013; Office of Water: Washington, DC, USA, 2013. [Google Scholar]
- Emerson, K.; Russo, R.C.; Lund, R.E.; Thurston, R.V. Aqueous Ammonia Equilibrium Calculations: Effect of pH and Temperature. J. Fish. Res. Board Can. 1975, 32, 2379–2383. [Google Scholar] [CrossRef]
- Secretaría de Agricultura, Ganadería, Desarrollo Rural, Pesca y Alimentación. Norma Oficial Mexicana NOM-044-SAG/PESC-2017, Pesca Responsable En El Embalse de La Presa La Boquilla En El Estado de Chihuahua. Especificaciones Para El Aprovechamiento de Los Recursos Pesqueros; Diario Oficial de la Federación: Mexico City, Mexico, 2017. [Google Scholar]
- U.S. Environmental Protection Agency. Ambient Water Quality Criteria for Dissolved Oxygen; Office of Water: Washington, DC, USA, 1986. [Google Scholar]
- Holm, S. A Simple Sequentially Rejective Multiple Test Procedure. Scand. J. Stat. 1979, 6, 65–70. [Google Scholar]
- Benjamini, Y.; Hochberg, Y. Controlling the False Discovery Rate: A Practical and Powerful Approach to Multiple Testing. J. R. Stat. Soc. Ser. B Stat. Methodol. 1995, 57, 289–300. [Google Scholar] [CrossRef]
- Skillings, J.H.; Mack, G.A. On the Use of a Friedman-Type Statistic in Balanced and Unbalanced Block Designs. Technometrics 1981, 23, 171–177. [Google Scholar] [CrossRef]
- Chatfield, M.; Mander, A. The Skillings–Mack Test (Friedman Test When There Are Missing Data). Stata J. Promot. Commun. Stat. Stata 2009, 9, 299–305. [Google Scholar] [CrossRef]
- Beltrán Piña, B.G.; Ruacho Soto, M.G.; Valles-Aragón, M.C.; Nevarez Rodríguez, M.C.; Santellano-Estrada, E. Development and Validation of the Multidimensional Instrument for Social Perception of Water Scarcity (IMPSEH) in Rural Communities in Northern Mexico. Int. J. Aquat. Res. Environ. Stud. 2026, 6, 957–975. [Google Scholar]
- Zohoori, F.V.; Kumah, E.A.; Kronic, J.; Drinnan, M.; Morris, A.J. Public Health Impacts of Water Fluorides: Current Evidence from a Rapid Systematic Review. Adv. Nutr. 2025, 16, 100547. [Google Scholar] [CrossRef] [PubMed]
- Hubbard, S.; Wolf, J.; Oza, H.H.; Arnold, B.F.; Freeman, M.C.; Levy, K. Differential Effectiveness of Water, Sanitation, and Handwashing Interventions to Reduce Child Diarrhea in Dry and Rainy Seasons: A Systematic Review and Meta-Analysis of Intervention Trials. Environ. Health Perspect. 2025, 133, 026001. [Google Scholar] [CrossRef] [PubMed]
- Léziart, T.; Dutheil De La Rochere, P.-M.; Cheswick, R.; Jarvis, P.; Nocker, A. Effect of Turbidity on Water Disinfection by Chlorination with the Emphasis on Humic Acids and Chalk. Environ. Technol. 2019, 40, 1734–1743. [Google Scholar] [CrossRef] [PubMed]
- Wright, J.; Gundry, S.; Conroy, R. Household Drinking Water in Developing Countries: A Systematic Review of Microbiological Contamination between Source and Point-of-use. Trop. Med. Int. Health 2004, 9, 106–117. [Google Scholar] [CrossRef] [PubMed]
- Valles-Aragón, M.C.; Ojeda-Barrios, D.L.; Guerrero-Prieto, V.M.; Prieto-Amparan, J.A.; Sánchez-Chávez, E. Calidad Del Agua Para Riego En Una Zona Nogalera Del Estado de Chihuahua. Rev. Int. Contam. Ambient. 2017, 33, 85–97. [Google Scholar] [CrossRef]
- Gharaibeh, M.A.; Albalasmeh, A.A.; Obeidat, M.M. Assessment of Water Quality of Key Dams in Jordan for Irrigation Purposes with Insights on Parameter Thresholds. Water 2024, 16, 1726. [Google Scholar] [CrossRef]
Figure 1.
Location of the study area. (a) Mexico and Chihuahua, with the study area in red; (b) sampling sites B1–B8 in La Boquilla reservoir, from the tail (B1) to the dam (B8); (c) the 31 taps of the domestic water supply network, by water source and locality.
Figure 1.
Location of the study area. (a) Mexico and Chihuahua, with the study area in red; (b) sampling sites B1–B8 in La Boquilla reservoir, from the tail (B1) to the dam (B8); (c) the 31 taps of the domestic water supply network, by water source and locality.
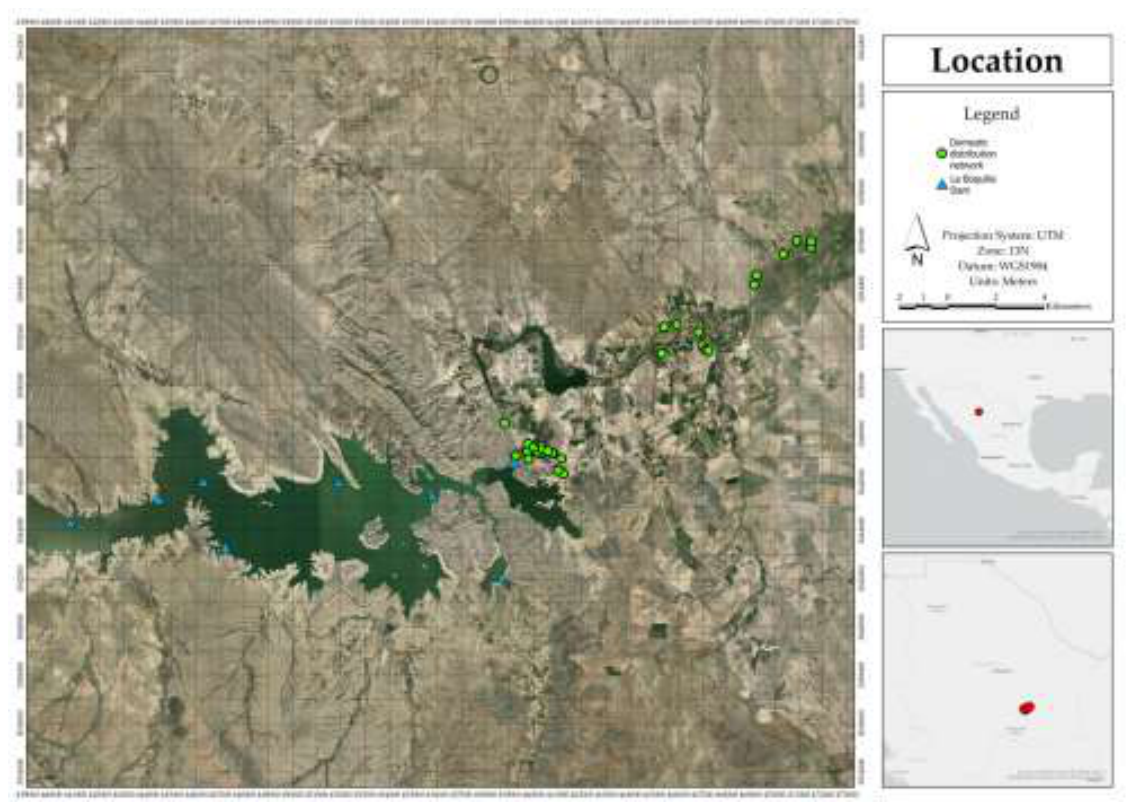
Figure 2.
Distribution of (a) fluoride, (b) turbidity, (c) sulfate, and (d) total hardness in the 31 network taps, by water source. Boxes represent the median and the interquartile range, with whiskers at 1.5 times that range; they are drawn only for groups with n ≥ 6. Points are individual observations. The red dashed line marks the NOM-127 limit and the gray dotted line, where it differs, the WHO guideline value. Panels (b) to (d) use a logarithmic scale.
Figure 2.
Distribution of (a) fluoride, (b) turbidity, (c) sulfate, and (d) total hardness in the 31 network taps, by water source. Boxes represent the median and the interquartile range, with whiskers at 1.5 times that range; they are drawn only for groups with n ≥ 6. Points are individual observations. The red dashed line marks the NOM-127 limit and the gray dotted line, where it differs, the WHO guideline value. Panels (b) to (d) use a logarithmic scale.
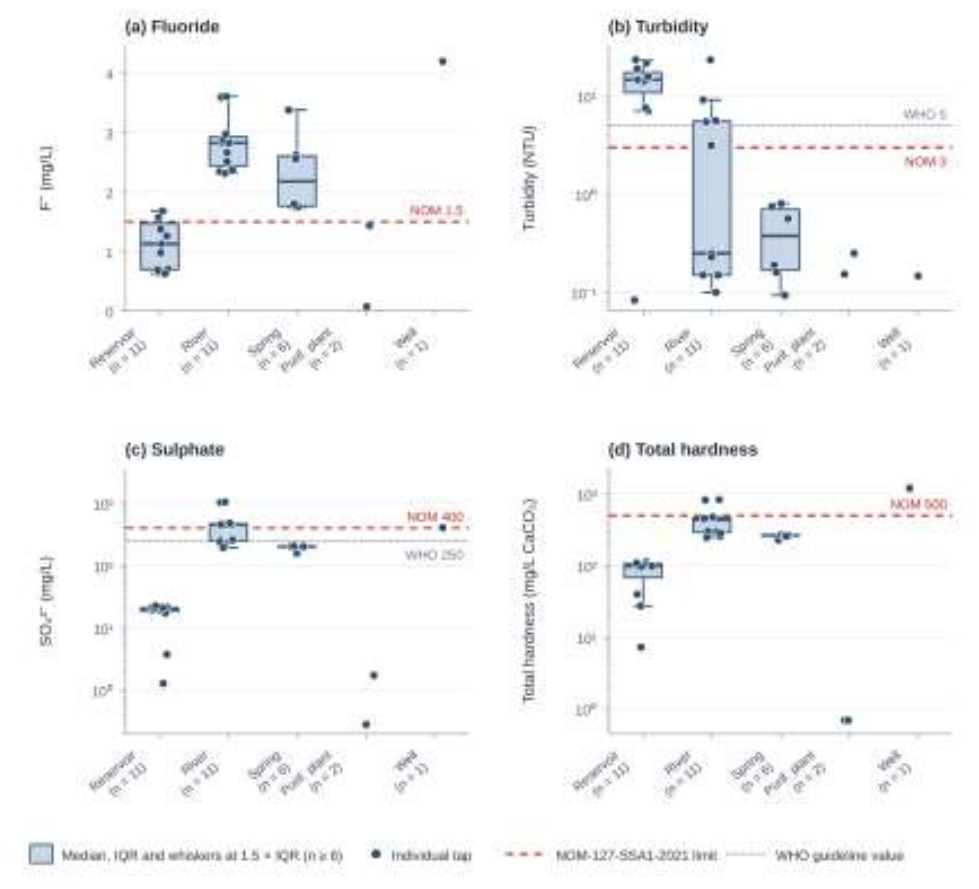
Figure 3.
Spatial distribution of (a) fluoride, (b) turbidity, and (c) total hardness in the 31 taps of the domestic water supply network, as illustrative IDW surfaces; the classes are natural breaks of the interpolated surface and the values per tap are given in File S1. White circles: taps.
Figure 3.
Spatial distribution of (a) fluoride, (b) turbidity, and (c) total hardness in the 31 taps of the domestic water supply network, as illustrative IDW surfaces; the classes are natural breaks of the interpolated surface and the values per tap are given in File S1. White circles: taps.
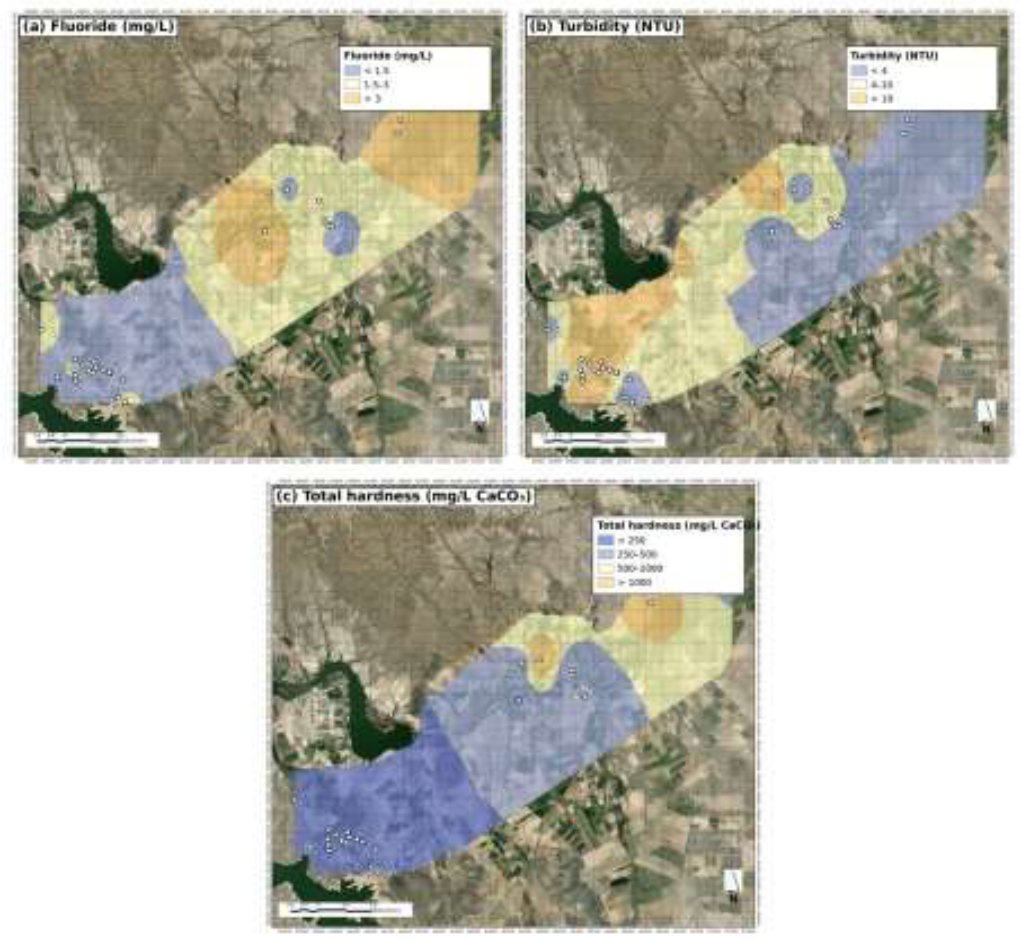
Figure 4.
Piper diagram of the 31 samples from La Boquilla reservoir, as percentage of meq/L. (a) Complete diagram; (b–d) enlarged views of the diamond, the cation triangle, and the anion triangle (dashed boxes in a; grid every 2%). Bicarbonate was estimated by charge deficit (Section 2.3); fluoride and ammonium are not represented. The color of each site darkens from B1 to B8, following the direction of flow, as in Figure 5, and the symbol shape indicates depth.
Figure 4.
Piper diagram of the 31 samples from La Boquilla reservoir, as percentage of meq/L. (a) Complete diagram; (b–d) enlarged views of the diamond, the cation triangle, and the anion triangle (dashed boxes in a; grid every 2%). Bicarbonate was estimated by charge deficit (Section 2.3); fluoride and ammonium are not represented. The color of each site darkens from B1 to B8, following the direction of flow, as in Figure 5, and the symbol shape indicates depth.
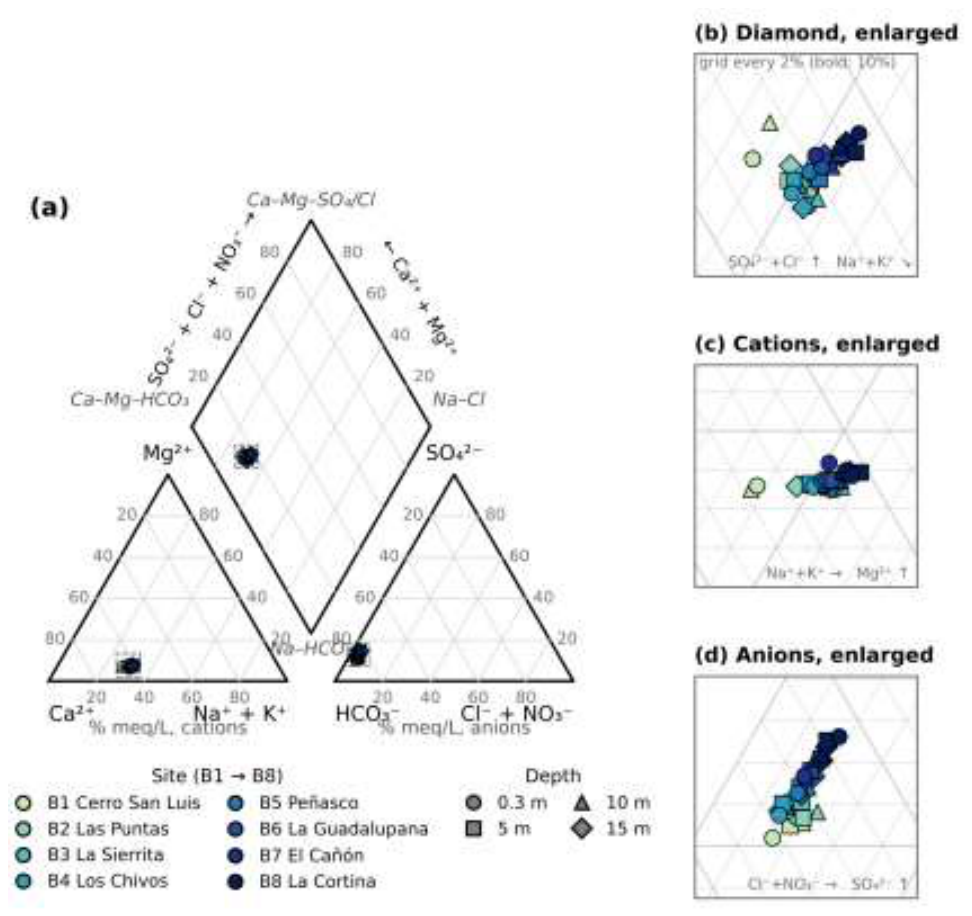
Figure 5.
Vertical and longitudinal structure of La Boquilla reservoir. (a) Temperature and (b) dissolved oxygen in situ at 0.30, 3, and 5 m; red line, 5 mg/L minimum of CE-CCA-001/89 for aquatic life. (c) Spearman correlation of each parameter with the site order B1 → B8 (n = 31; temperature and oxygen, n = 16): blue, increase toward the dam; orange, decrease (p < 0.05 uncorrected); gray, not significant. (d) Turbidity by depth at each site (logarithmic scale); red line, 3 NTU of NOM-127-SSA1-2021. The color of each site darkens from B1 to B8.
Figure 5.
Vertical and longitudinal structure of La Boquilla reservoir. (a) Temperature and (b) dissolved oxygen in situ at 0.30, 3, and 5 m; red line, 5 mg/L minimum of CE-CCA-001/89 for aquatic life. (c) Spearman correlation of each parameter with the site order B1 → B8 (n = 31; temperature and oxygen, n = 16): blue, increase toward the dam; orange, decrease (p < 0.05 uncorrected); gray, not significant. (d) Turbidity by depth at each site (logarithmic scale); red line, 3 NTU of NOM-127-SSA1-2021. The color of each site darkens from B1 to B8.
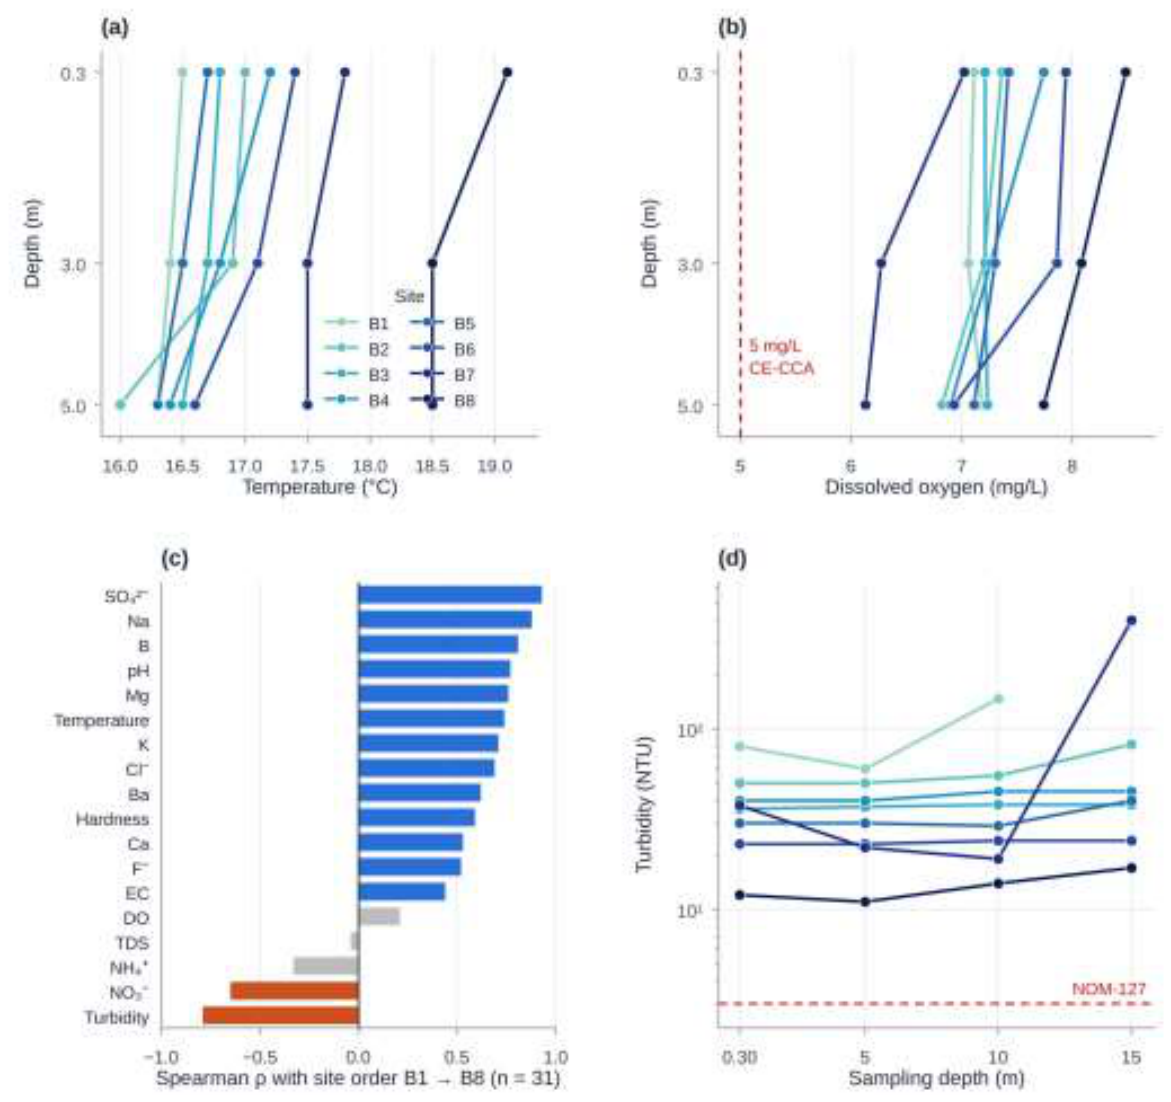
Figure 6.
Spatial distribution of the WQI-NOM and the WQI-WHO in La Boquilla reservoir (a, b; values per site, B1–B8) and in the domestic water supply network (c, d; 31 taps), as IDW surfaces with the Brown et al. (1970) classes; in the network the surface is illustrative and the taps are represented as points. Lower values indicate better quality.
Figure 6.
Spatial distribution of the WQI-NOM and the WQI-WHO in La Boquilla reservoir (a, b; values per site, B1–B8) and in the domestic water supply network (c, d; 31 taps), as IDW surfaces with the Brown et al. (1970) classes; in the network the surface is illustrative and the taps are represented as points. Lower values indicate better quality.
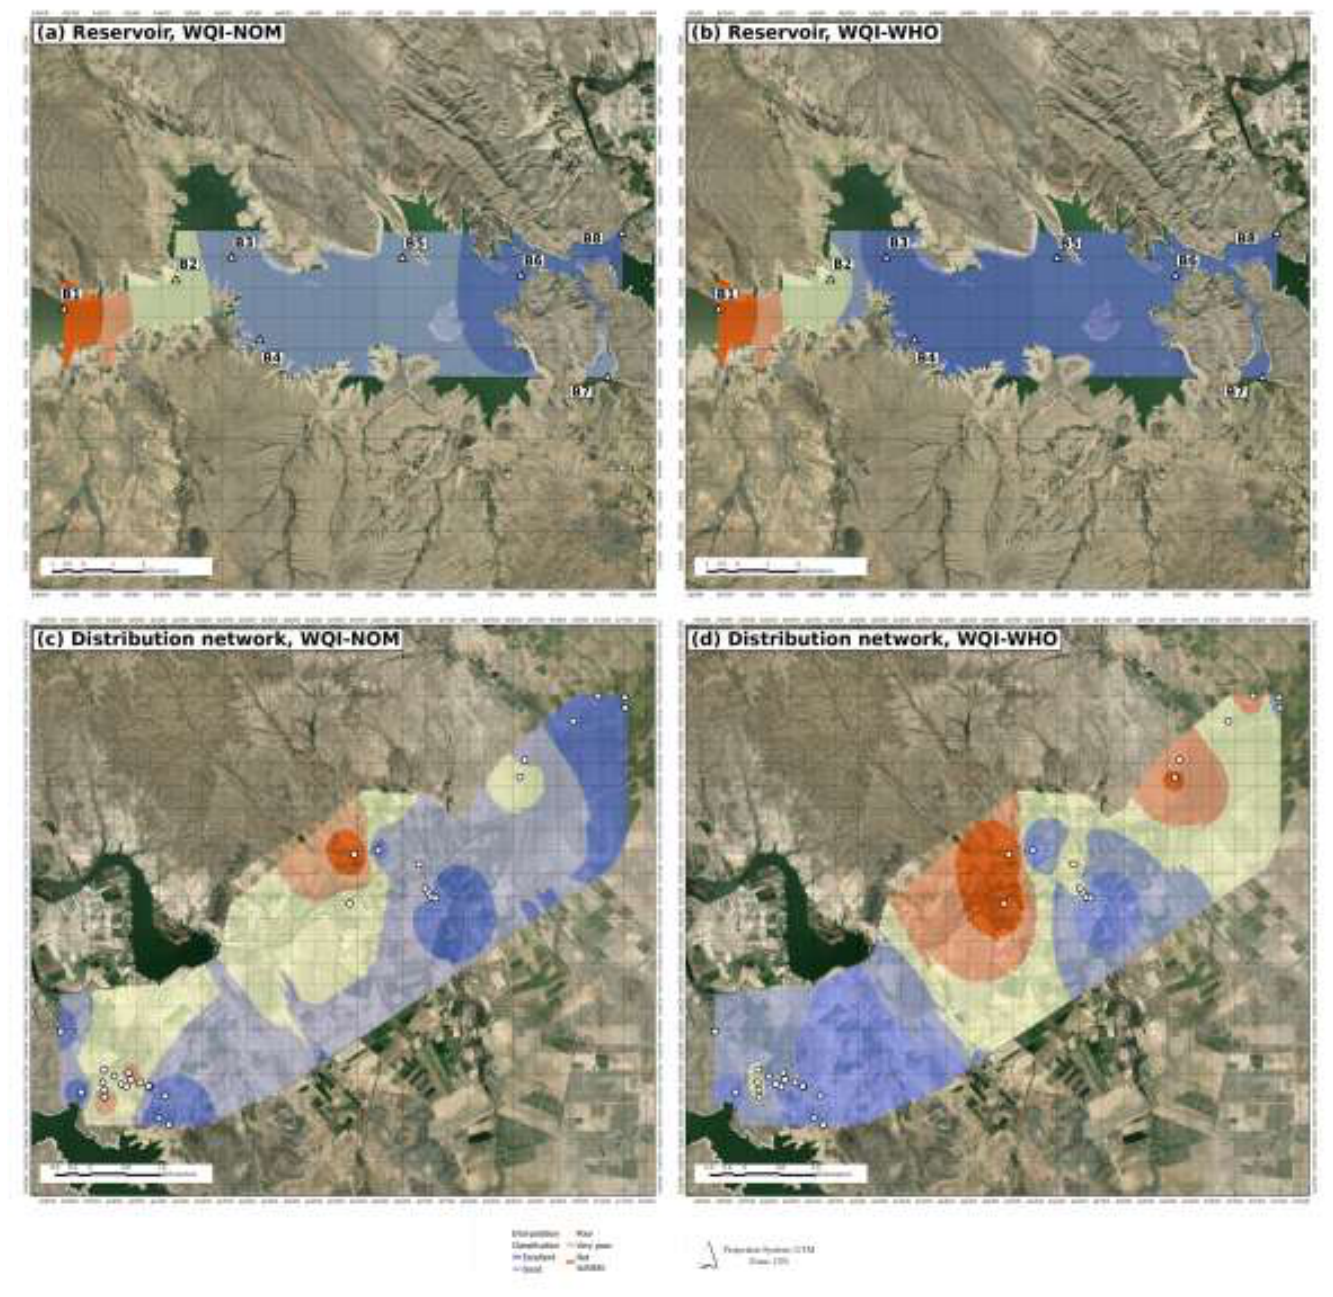
Figure 7.
Classification of La Boquilla reservoir water for irrigation. (a) USSL diagram: SAR versus electrical conductivity on a logarithmic scale, with salinity classes C1 to C4 and sodicity classes S1 to S4. (b) Na % versus electrical conductivity, with the bands of the Wilcox classification (excellent < 20%, good 20–40%, permissible 40–60%, doubtful 60–80%, unsuitable > 80%) and, as a dashed line, the USSL salinity boundaries. The inset enlarges the sample region; the color of each site darkens from B1 to B8, as in Figure 4 and Figure 5, and the symbol shape indicates depth.
Figure 7.
Classification of La Boquilla reservoir water for irrigation. (a) USSL diagram: SAR versus electrical conductivity on a logarithmic scale, with salinity classes C1 to C4 and sodicity classes S1 to S4. (b) Na % versus electrical conductivity, with the bands of the Wilcox classification (excellent < 20%, good 20–40%, permissible 40–60%, doubtful 60–80%, unsuitable > 80%) and, as a dashed line, the USSL salinity boundaries. The inset enlarges the sample region; the color of each site darkens from B1 to B8, as in Figure 4 and Figure 5, and the symbol shape indicates depth.
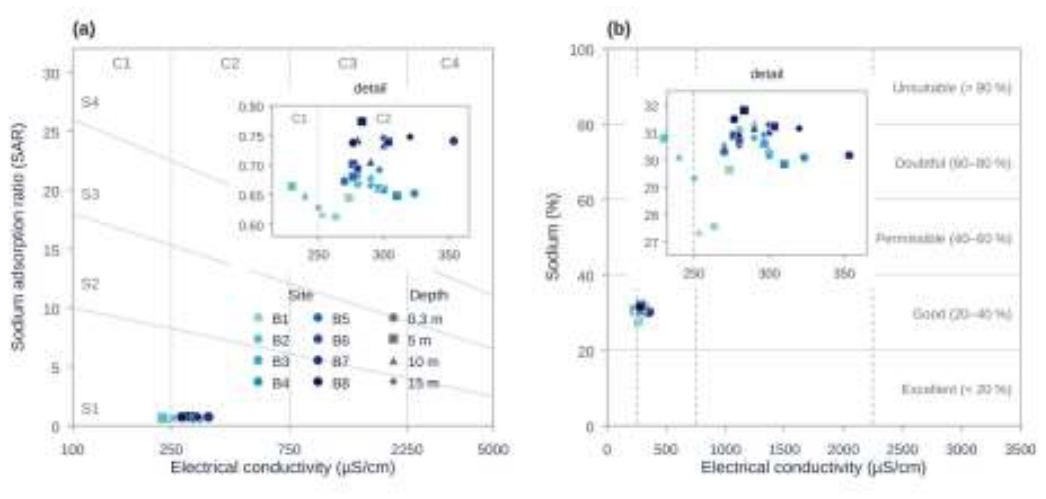

Table 1.
Sampling sites in La Boquilla reservoir, Chihuahua, Mexico.
| Site | Code | Latitude (N) | Longitude (W) | Depths (m) | n |
|---|---|---|---|---|---|
| Cerro de San Luis | B1 | 27°31′17.0″ | 105°35′59.0″ | 0.30, 5, 10 | 3 |
| Las Puntas | B2 | 27°31′49.0″ | 105°33′45.0″ | 0.30, 5, 10, 15 | 4 |
| La Sierrita | B3 | 27°32′13.0″ | 105°32′38.0″ | 0.30, 5, 10, 15 | 4 |
| Los Chivos | B4 | 27°30′45.0″ | 105°32′04.0″ | 0.30, 5, 10, 15 | 4 |
| Peñasco | B5 | 27°32′13.0″ | 105°29′13.0″ | 0.30, 5, 10, 15 | 4 |
| La Guadalupana | B6 | 27°31′55.0″ | 105°26′51.0″ | 0.30, 5, 10, 15 | 4 |
| El Cañón | B7 | 27°30′06.0″ | 105°25′06.0″ | 0.30, 5, 10, 15 | 4 |
| La Cortina (no-fishing zone) | B8 | 27°32′40.2″ | 105°24′49.4″ | 0.30, 5, 10, 15 | 4 |
Note. WGS 84 coordinates (handheld GPS). Sampling on 25 October 2025.
Table 2.
Parameters, analytical methods, and instruments.
| Parameter | Unit | Method / instrument | Reference |
|---|---|---|---|
| BOD₅ | mg/L | Dilution and 5-d incubation at 20 °C | NMX-AA-028-SCFI-2001 |
| COD | mg/L | Open reflux with dichromate | NMX-AA-030/1-SCFI-2012 |
| TDS | mg/L | Gravimetry, 103–105 °C | NMX-AA-034-SCFI-2015 |
| Turbidity | NTU | Nephelometry | NMX-AA-038-SCFI-2001 |
| Total and fecal coliforms ᵃ | MPN/100 mL | Multiple-tube fermentation (MPN) | NMX-AA-042-SCFI-2015 |
| Fluoride | mg/L | SPADNS spectrophotometry | NMX-AA-077-SCFI-2001 |
| DO and temperature (in situ) | mg/L; °C | Milwaukee MW605 MAX dissolved oxygen (DO) meter, MA860 galvanic probe | Manufacturer |
| pH, EC, hardness, NH₄⁺, NO₃⁻, Cl⁻, Ca²⁺, Mg²⁺, Na⁺, K⁺ (on board) | mS/cm; mg/L | IMACIMUS multi-ion probe, carbon-nanotube ion-selective electrodes | NT Sensors, Mexico |
| Ca, Mg, Na, K, P, S ᵇ; Al, As, B, Ba, Bi, Cd, Co, Cr, Cu, Fe, Mn, Mo, Ni, Pb, Sb, Se, Sn, V, Zn | mg/L; µg/L | ICP-OES Optima 5300 DV (radial / axial view) |
PerkinElmer Inc., Spain |
Note. ᵃ Domestic network only. ᵇ Ca, Mg, Na, and K were measured by both techniques; ICP-OES is the primary source (Section 2.3). SO₄²⁻ = 2.996 × S. Probe hardness and EC are values the instrument derives from its ion readings. Mexican NMX-AA standards (in Supplementary Materials) [23,24,25,26,27,28]. Full procedures, ranges, LODs, and analytical parameters in Supplementary Materials, Tables S1–S3.
Table 3.
Indices calculated: formula, classification scale, and source.
| Index (use) | Formula/Inputs | Scale | Source |
|---|---|---|---|
| WQI and EWQI (drinking; reservoir) |
Eqs. (1)–(3); EWQI with entropy weights (Text S2); 9 parameters, Table S17 | 0–25 excellent; 26–50 good; 51–75 poor; 76–100 very poor; > 100 unsuitable (lower is better) | Brown et al. (1970) |
| CCME-WQI (drinking; supply source; aquatic life) |
Eq. (4); F1, F2, F3; objectives in Tables S6 and S7 | 95–100 excellent; 80–94 good; 65–79 fair; 45–64 marginal; 0–44 poor (higher is better) | Canadian Council of Ministers of the Environment (2017) |
| EC (irrigation) | Probe (derived), µS/cm | < 700 excellent; 700–3000 good; > 3000 fair | Alrowais et al. (2023) |
| Na % (irrigation; Wilcox bands) |
(Na + K)/(Ca + Mg + Na + K) × 100 | < 20 excellent; 20–40 good; 40–60 permissible; 60–80 doubtful; > 80 unsuitable | Alrowais et al. (2023) |
| SAR (irrigation) | Na/√[(Ca + Mg)/2] | < 10 excellent; 10–18 good; 18–26 doubtful; > 26 unsuitable | Alrowais et al. (2023) |
| MH (irrigation) | Mg/(Ca + Mg) × 100 | < 50 suitable; > 50 unsuitable | Alrowais et al. (2023) |
| PS (irrigation) | Cl + ½ SO₄ | < 3 excellent to good; 3–5 good to injurious; > 5 injurious | Alrowais et al. (2023) |
| KR (irrigation) | Na/(Ca + Mg) | < 1 suitable; > 1 unsuitable | Alrowais et al. (2023) |
| USSL (irrigation) | EC × SAR | C1 < 250, C2 250–750, C3 750–2,250, C4 > 2,250 µS/cm; S1–S4 by SAR with thresholds decreasing with log EC (see note) | Richards (1954) |
| FAO 29 (irrigation) | EC, TDS, SAR × EC, Na, Cl, B, N-NO₃, pH | None / slight to moderate / severe restriction (Table S4) | Ayers and Westcot (1985) |
| Major-ion irrigation index | Σ Wᵢ·(Cᵢ/Sᵢ × 100); Ca, Mg, Na, K, Cl, SO₄, HCO₃ vs. FAO; weights 5, 3, 4, 2, 4, 3, 5 | < 150 class I; 150–300 II; 301–450 III; > 450 IV | Mammeri et al. (2023) |
Note. Concentrations in meq/L in the irrigation indices. In the major-ion irrigation index and in the Piper diagram, HCO₃⁻ is the value estimated from the charge deficit (Section 2.3). The Wilcox sodium classes coincide with those of Na %. USSL sodicity boundaries: S1/S2, SAR = 18.87 − 4.44 log₁₀ EC; S2/S3, SAR = 31.31 − 6.66 log₁₀ EC; S3/S4, SAR = 43.75 − 8.87 log₁₀ EC (EC in µS/cm).
Table 4.
Descriptive statistics of the physicochemical and microbiological parameters of the SFC domestic water supply network (n = 31 network taps), and compliance with the reference values of NOM-127-SSA1-2021 and the WHO.
Table 4.
Descriptive statistics of the physicochemical and microbiological parameters of the SFC domestic water supply network (n = 31 network taps), and compliance with the reference values of NOM-127-SSA1-2021 and the WHO.
| Parameter | Unit | Min–Max ᵃ | Median | Mean ± SD | NOM-127 | n (%) > ᵇ | p ᶜ | WHO | n (%) > ᵇ | p ᶜ |
|---|---|---|---|---|---|---|---|---|---|---|
| Turbidity | NTU | 0.08–23.4 | 0.80 | 6.56 ± 8.04 | 3 | 15 (48.4) | 0.170 | 5 | 14 (45.2) | 0.799 |
| pH | pH units | 7.41–8.10 | 7.80 | 7.78 ± 0.20 | 6.5–8.5 | 0 (0) | < 0.001 | 6.5–8.5 | 0 (0) | < 0.001 |
| Electrical conductivity | µS/cm | 300–2233 | 737 | 757 ± 508 | — | — | — | — | — | — |
| Total dissolved solids | mg/L | 18.7–2439 | 404 | 496 ± 506 | 1000 | 3 (9.7) | < 0.001 | 1000 | 3 (9.7) | < 0.001 |
| Total hardness | mg/L CaCO₃ | 0.69–1200 | 254 | 274 ± 269 | 500 | 3 (9.7) | < 0.001 | 500 | 3 (9.7) | < 0.001 |
| Fluoride (F⁻) | mg/L | 0.07–4.20 | 1.80 | 2.03 ± 1.02 | 1.5 | 21 (67.7) | 0.007 | 1.5 | 21 (67.7) | 0.007 |
| Nitrate (NO₃⁻) | mg/L | 0.19–33.7 | 2.96 | 5.59 ± 7.94 | 48.7 | 0 (0) | < 0.001 | 50 | 0 (0) | < 0.001 |
| Ammonium (NH₄⁺) | mg/L | 0.013–0.497 | 0.273 | 0.287 ± 0.108 | 0.644 | 0 (0) | < 0.001 | 1.5 | 0 (0) | < 0.001 |
| Chloride (Cl⁻) | mg/L | 1.71–59.3 | 7.89 | 14.9 ± 14.0 | 250 | 0 (0) | < 0.001 | 250 | 0 (0) | < 0.001 |
| Sulfate (SO₄²⁻) | mg/L | 0.28–1723 | 199 | 263 ± 380 | 400 | 7 (22.6) | 0.003 | 250 | 9 (29.0) | 0.048 |
| Calcium | mg/L | 0.24–297 | 79.8 | 83.4 ± 71.7 | — | — | — | — | — | — |
| Magnesium | mg/L | 0.021–111 | 14.0 | 16.0 ± 23.2 | — | — | — | — | — | — |
| Sodium | mg/L | 2.86–286 | 25.3 | 46.8 ± 54.8 | 200 | 1 (3.2) | < 0.001 | 200 | 1 (3.2) | < 0.001 |
| Potassium | mg/L | 1.78–10.6 | 5.39 | 5.65 ± 2.09 | — | — | — | — | — | — |
| Barium | mg/L | 0.0012–0.157 | 0.067 | 0.063 ± 0.037 | 1.3 | 0 (0) | < 0.001 | 1.3 | 0 (0) | < 0.001 |
| Boron | mg/L | 0.012–0.878 | 0.096 | 0.167 ± 0.180 | — | — | — | 2.4 | 0 (0) | < 0.001 |
| Molybdenum | mg/L | 0.0038–0.155 | 0.0092 | 0.015 ± 0.027 | — | — | — | 0.07 | 1 (3.2) | < 0.001 |
| Total coliforms | MPN/100 mL | < 3–≥ 2400 | 21 ᵈ | — | — ᵉ | 23 (74.2) | — | — ᵉ | 23 (74.2) | — |
| Fecal coliforms | MPN/100 mL | < 3–93 | 8 ᵈ | — | Absence | 16 (51.6) | — | Absence | 16 (51.6) | — |
ᵃ Determinations considered. ᵇ Taps (and percentage) exceeding the reference value; for pH, outside the 6.5–8.5 range. ᶜ Two-sided one-sample test against the reference value (t or Wilcoxon according to Shapiro–Wilk). ᵈ Median of the determinations with detection (23 and 16). ᵉ No limit in NOM-127 or in the WHO guidelines, which regulate Escherichia coli or thermotolerant (fecal) coliforms; the number of taps with detection is given as a complementary indicator of network integrity (Section 2.4.1). NOM-127 limits for localities of fewer than 50,000 inhabitants and WHO guideline values [36]. Nitrate and ammonium are expressed as the ion (11 mg/L of N-NO₃ × 4.427; 0.5 mg/L of N-NH₃ × 1.288); for hardness, the NOM limit is retained in the WHO scenario. The dash indicates that the parameter has no limit in that framework. Cu, Cd, Mn, and Fe were excluded because they were censored above 50%; As, Pb, and Sb are not verifiable because their LOD exceeds the regulatory value (Supplementary Materials, Table S2).
Table 5.
Water quality indices of the domestic water supply network, by water source and for the whole network (n = 31 network taps).
Table 5.
Water quality indices of the domestic water supply network, by water source and for the whole network (n = 31 network taps).
| Water source | n | WQI-NOM median | Class ᵃ | WQI-WHO median | Class ᵃ | EWQI median | Class ᵃ | Taps unsuitable due to fecal coliforms |
|---|---|---|---|---|---|---|---|---|
| La Boquilla reservoir | 11 | 83.95 | Very poor | 57.23 | Poor | 114.81 | Unsuitable | 4 of 11 |
| Río Conchos | 11 | 63.72 | Poor | 63.01 | Poor | 75.90 | Very poor | 7 of 11 |
| Spring ᵇ | 6 | 47.46 | Good | 48.82 | Good | 30.21 | Good | 4 of 6 |
| Purification plant | 2 | 41.09 | Good | 24.52 | Excellent | 11.06 | Excellent | 0 of 2 |
| Well | 1 | 80.85 | Very poor | 87.16 | Very poor | 162.87 | Unsuitable | 1 of 1 |
| Whole network | 31 | 69.81 | Poor | 58.43 | Poor | 68.11 | Poor | 16 of 31 |
| Network range | 26.70 to 136.79 | 10.83 to 101.34 | 6.08 to 199.45 | |||||
| Class distribution ᶜ | 0 / 5 / 14 / 9 / 3 | 1 / 8 / 19 / 2 / 1 | 3 / 6 / 7 / 3 / 12 |
WQI = weighted arithmetic index; EWQI = entropy-weighted index; in all three, lower values indicate better quality (Section 2.4). Nine parameters in all three cases, with the standards of NOM-127 (WQI-NOM, EWQI) or the WHO guideline values (WQI-WHO). Details per tap in Supplementary Materials, Table S9, and CCME-WQI runs in Table S6. ᵃ Class of the median on the Brown et al. (1970) scale. ᵇ Four taps from El Ojito and two from El Pozito. ᶜ Network taps in the classes excellent / good / poor / very poor / unsuitable.
Table 6.
Descriptive statistics of the physicochemical parameters of La Boquilla reservoir, Chihuahua (n = 31 samples; 8 sites × 4 depths), and compliance with the reference values of NOM-127 and the ecological criteria for water supply sources (CE-CCA-001/89).
Table 6.
Descriptive statistics of the physicochemical parameters of La Boquilla reservoir, Chihuahua (n = 31 samples; 8 sites × 4 depths), and compliance with the reference values of NOM-127 and the ecological criteria for water supply sources (CE-CCA-001/89).
| Parameter | Unit | n ᵃ | Min–Max | Median | Mean ± SD | NOM-127 | n (%) > ᵇ | p ᶜ | CE-CCA ᵈ | n (%) > ᵇ |
|---|---|---|---|---|---|---|---|---|---|---|
| Turbidity | NTU | 31 | 11–400 | 37.6 | 51.6 ± 69.8 | 3 | 31 (100) | < 0.001 | NC | — |
| pH | pH units | 31 | 7.80–8.46 | 8.09 | 8.08 ± 0.16 | 6.5–8.5 | 0 (0) | < 0.001 | 5–9 | 0 (0) |
| Electrical conductivity ᵉ | µS/cm | 31 | 230–353 | 280 | 285 ± 25 | — | — | — | — | — |
| Total dissolved solids | mg/L | 31 | 80.0–313 | 165 | 161 ± 28 ᵃ | 1000 | 0 (0) | < 0.001 | 500 | 0 (0) |
| Total hardness ᵉ | mg/L CaCO₃ | 31 | 77.9–105 | 85.5 | 87.2 ± 6.6 | 500 | 0 (0) | < 0.001 | — | — |
| Fluoride (F⁻) | mg/L | 31 | 0.25–2.17 | 1.05 | 1.07 ± 0.48 | 1.5 | 6 (19.4) | < 0.001 | 1.5 | 6 (19.4) |
| Nitrate (NO₃⁻) | mg/L | 31 | 0.28–2.38 | 0.43 | 0.64 ± 0.53 | 48.7 | 0 (0) | < 0.001 | 22.1 | 0 (0) |
| Ammonium (NH₄⁺) | mg/L | 31 | 0.170–0.297 | 0.190 | 0.196 ± 0.028 | 0.644 | 0 (0) | < 0.001 | — | — |
| Chloride (Cl⁻) | mg/L | 31 | 2.15–3.12 | 2.53 | 2.57 ± 0.30 | 250 | 0 (0) | < 0.001 | 250 | 0 (0) |
| Sulfate (SO₄²⁻) | mg/L | 31 | 12.4–19.4 | 14.2 | 15.1 ± 2.4 | 400 | 0 (0) | < 0.001 | 500 | 0 (0) |
| Calcium | mg/L | 31 | 28.0–37.1 | 30.6 | 31.2 ± 2.2 | — | — | — | — | — |
| Magnesium | mg/L | 31 | 1.92–3.06 | 2.19 | 2.26 ± 0.27 | — | — | — | — | — |
| Sodium | mg/L | 31 | 13.2–17.5 | 14.3 | 14.7 ± 1.3 | 200 | 0 (0) | < 0.001 | — | — |
| Potassium | mg/L | 31 | 4.40–5.82 | 4.72 | 4.79 ± 0.31 | — | — | — | — | — |
| Barium | mg/L | 31 | 0.051–0.080 | 0.056 | 0.059 ± 0.008 | 1.3 | 0 (0) | < 0.001 | 1.0 | 0 (0) |
| Boron | mg/L | 31 | 0.026–0.051 | 0.035 | 0.035 ± 0.006 | — | — | — | 1.0 | 0 (0) |
| Molybdenum ᶠ | mg/L | 31 | 0.0027–0.062 | 0.0060 | 0.011 ± 0.014 | — | — | — | — | — |
| Vanadium ᶠ | mg/L | 31 | 0.0018–0.0066 | 0.0041 | 0.0042 ± 0.0010 | — | — | — | 0.1 | 0 (0) |
ᵃ Determinations; for total dissolved solids, mean and SD with n = 29, without B1-10 m and B8-10 m (Section 2.3). ᵇ Samples (and percentage) exceeding the reference value; for pH, outside the range. ᶜ Two-sided one-sample test (t or Wilcoxon; Section 2.5); all 24 tests (NOM-127 and WHO) remain significant after Holm. Details in Table S11. ᵈ CE-CCA-001/89 (Table 1a of the Agreement), exceedance count only; NC = natural conditions; nitrate = 5 mg/L of N-NO₃ × 4.427. ᵉ Hardness calculated from calcium and magnesium (ICP-OES); conductivity derived by the probe (Section 2.3). ᶠ Censoring of 38.7% (molybdenum) and 6.5% (vanadium), substituted according to Section 2.3; the substitute is the table minimum. Trace metals with censoring above 50%, BOD₅, and COD were excluded (Supplementary Materials, Table S2); coliforms and alkalinity were not determined.
Table 7.
Comparison of the source (La Boquilla reservoir) with the tap (11 network taps supplied by the reservoir): medians, source-to-tap change, and Mann–Whitney U test.
Table 7.
Comparison of the source (La Boquilla reservoir) with the tap (11 network taps supplied by the reservoir): medians, source-to-tap change, and Mann–Whitney U test.
| Parameter | Unit | Reservoir (n = 31) |
B8 La Cortina (n = 4) |
Taps (n = 11) | Δ taps − reservoir (95% CI) | Holm-adjusted p |
|---|---|---|---|---|---|---|
| Turbidity | NTU | 37.6 | 13.0 | 14.7 | −22.4 (−31.6 to −12.6) |
0.001 |
| pH | pH units | 8.09 | 8.21 | 7.92 | −0.15 (−0.24 to −0.06) | 0.039 |
| Electrical conductivity | µS/cm | 280 | 282 | 350 | +60 (+43 to +80) |
< 0.001 |
| Total dissolved solids | mg/L | 165 | 120 | 160 | +5 (−28 to +39) |
1.000 |
| Total hardness | mg/L CaCO₃ | 85.5 | 94.9 | 97.8 | +12.5 (+0.6 to +17.7) |
0.338 |
| Fluoride (F⁻) | mg/L | 1.05 | 1.92 | 1.13 | +0.08 (−0.30 to +0.40) |
1.000 |
| Nitrate (NO₃⁻) | mg/L | 0.43 | 0.38 | 0.52 | +0.16 (−0.06 to +2.48) |
0.483 |
| Ammonium (NH₄⁺) | mg/L | 0.190 | 0.190 | 0.273 | +0.083 (+0.057 to +0.120) |
< 0.001 |
| Chloride (Cl⁻) | mg/L | 2.53 | 2.92 | 6.37 | +3.84 (+2.59 to +4.96) |
< 0.001 |
| Sulfate (SO₄²⁻) | mg/L | 14.2 | 18.8 | 20.4 | +4.8 (+2.0 to +6.9) |
0.039 |
| Calcium | mg/L | 30.6 | 33.7 | 34.5 | +4.0 (+0.04 to +5.9) |
0.338 |
| Magnesium | mg/L | 2.19 | 2.64 | 2.82 | +0.58 (+0.04 to +0.77) |
0.338 |
| Sodium | mg/L | 14.3 | 16.7 | 17.6 | +3.3 (+1.8 to +4.5) |
0.034 |
| Potassium | mg/L | 4.72 | 5.16 | 5.10 | +0.31 (−0.07 to +0.56) |
0.390 |
| Barium | mg/L | 0.056 | 0.067 | 0.070 | +0.014 (−0.002 to +0.019) |
0.338 |
| Boron | mg/L | 0.035 | 0.043 | 0.051 | +0.015 (+0.005 to +0.021) |
0.098 |
| Indices ᵃ | ||||||
| WQI-NOM | — | 143.69 | 80.37 | 83.95 | −60.2 (−90.4 to −31.0) |
< 0.001 |
| WQI-WHO | — | 82.76 | 63.00 | 57.23 | −31.4 (−44.8 to −18.4) |
< 0.001 |
Notes. Bold, significant differences after Holm. Against the medians of the eight sites, turbidity, conductivity, ammonium, chloride, and the two indices hold; against the four B8 samples, only pH and chloride: the taps did not differ from B8 in turbidity (p = 0.57) or in WQI-NOM (p = 0.75) and had less fluoride (1.13 versus 1.92 mg/L; p = 0.010 uncorrected, 0.133 after Holm). Details of the tests, sensitivities, and rank-biserial coefficient are in Supplementary Materials, Table S14. ᵃ Same nine parameters, limits, weights, and Brown et al. (1970) scale in the reservoir and in the network; lower values indicate better quality.
Disclaimer/Publisher’s Note: The statements, opinions and data contained in all publications are solely those of the individual author(s) and contributor(s) and not of MDPI and/or the editor(s). MDPI and/or the editor(s) disclaim responsibility for any injury to people or property resulting from any ideas, methods, instructions or products referred to in the content. |
© 2026 by the authors. Licensee MDPI, Basel, Switzerland. This article is an open access article distributed under the terms and conditions of the Creative Commons Attribution (CC BY) license (http://creativecommons.org/licenses/by/4.0/).
Copyright: This open access article is published under a Creative Commons CC BY 4.0 license, which permit the free download, distribution, and reuse, provided that the author and preprint are cited in any reuse.