
Submitted:
15 November 2026
Posted:
18 November 2026
You are already at the latest version
Abstract
The complex and harsh marine environment, combined with the synergistic effect of severe corrosion induced by high salinity and marine biofouling, readily causes corro-sion damage to metallic materials, thereby accelerating their failure process. This study adopted a two-step method via magnetic field‑assisted jet electrodeposition to fabri-cate nickel‑diamond composite coatings. In the first step, a longitudinal dendritic cluster structure was prepared by optimizing the magnetic field intensity and the nickel grain size during jet electrodeposition. Subsequently, the composite coating was obtained by electrodepositing nickel with diamond particles. Finally, superhydropho-bicity was achieved through low‑surface‑energy modification. Experimental results showed that with a nickel particle diameter of 2 μm and a magnetic field intensity of 150 mT, the coating exhibited favorable comprehensive performance, yielding a cluster structure with a water contact angle of 154.9°. The corrosion resistance was character-ized by a self‑corrosion current density of 1.301 × 10⁻⁷ A/cm² and a self‑corrosion po-tential of −0.193 V. Moreover, the incorporation of diamond particles significantly im-proved the wear resistance, as evidenced by a dry friction coefficient as low as 0.145 on the coating surface. This study provides an efficient and rapid laboratory-scale route for fabricating superhydrophobic surfaces with a low friction coefficient, offering a ba-sis for further evaluation toward marine engineering applications.
Keywords:
jet electrodeposition
; magnetic field
; composite coating
; superhydrophobicity
; wear resistance
1. Introduction
AH32 steel is widely used in marine engineering equipment and shipbuilding due to its high strength, good low-temperature toughness, and excellent weldability. However, bare AH32 steel lacks inherent corrosion resistance. When the steel is exposed to the marine environment for prolonged periods, the coupling effect of multiple detrimental factors-including electrochemical reactions, microbial adhesion, and chloride ion attack-can significantly aggravate its corrosion [1,2]. As corrosion progresses to a certain extent, various mechanical failures may occur in the equipment, rendering it unable to operate normally. In severe cases, this may further cause ships and marine engineering equipment to lose control at sea, rendering them incapable of emergency self-rescue, and ultimately leading to safety accidents. Therefore, developing protective coatings to prevent steel from corrosion in seawater is of great significance for extending the service life of marine equipment.
To mitigate the corrosion risk in the marine environment, commonly employed protection strategies include the development of corrosion-resistant materials [3], the use of organic coatings [4], cathodic protection [5], and the addition of corrosion inhibitors [6]. Nevertheless, these approaches are constrained by drawbacks including high costs, inadequate long-term durability, and environmental concerns [7,8]. In recent years, superhydrophobic surfaces have attracted growing interest for anti-corrosion and anti-fouling purposes [9]. Inspired by the microstructures of lotus leaves, crab shells, and starfish, such surfaces are constructed with rough micro/nanostructures and low surface energy. The trapped air layer between the surface and the liquid substantially reduces the actual contact area with seawater and simultaneously inhibits microbial attachment. The mainstream techniques for fabricating superhydrophobic coatings include laser patterning [10,11], chemical vapor deposition [12,13], spraying [14,15], sol-gel methods [16,17], and etching [18,19]. Alexandre et al. [11] employed laser patterning to modify the wettability of copper, achieving superhydrophobicity after exposure to air for a certain period. The as-prepared superhydrophobic copper exhibited an ability to retard copper corrosion and, compared with unmodified copper exposed to the same conditions, demonstrated higher electrical conductivity. Huang et al. [13] fabricated a superhydrophobic coating with a nanocone array structure using PFDA-EGDA copolymer via chemical vapor deposition, which exhibited favorable self-cleaning and anti-icing performance. He et al. [15] prepared an Al2O3-PAF composite coating via thermal spraying, which exhibited superhydrophobicity along with high wear resistance and satisfactory corrosion resistance. In a separate study, Yao et al. [17] extracted nanocellulose from bamboo powder waste and constructed a superhydrophobic coating on engineered wood surfaces using a sol-gel approach, achieving a water contact angle as high as 166.8° after modification. Zhang et al. [18] developed a corrosion-resistant superhydrophobic coating on AlSi10Mg alloy by etching a silica/epoxy composite with stearic acid and subsequent amino modification. The coated surface maintained its superhydrophobic state after 96 h of salt spray testing, which indicating favorable durability. However, these methods often face challenges in practical applications. For instance, laser patterning suffers from low processing efficiency and is unsuitable for large-area surface treatment, and also difficult to apply to metals with high reflectivity or transparent materials. Chemical vapor deposition relies on expensive equipment, requires vacuum conditions, and incurs high operating costs. Spraying results in poor coating uniformity, and the coating is only bonded to the substrate through mechanical interlocking and weak physical forces, leading to poor adhesion with the substrate. The sol-gel method involves a lengthy preparation process with multiple steps and high raw material costs. Etching faces difficulties in precisely controlling the etching rate, which may easily lead to over-etching or under-etching.
Electrodeposition technology offers advantages such as simple processing and low cost, and has been widely applied in coating preparation. With the rapid development of electrodeposition technology, the introduction of jet flow and magnetic fields has unique benefits, including improved deposition quality and enhanced deposition rate [20,21]. Furthermore, by incorporating ferromagnetic metal particles into the electrolyte and combining this with magnetic field-assisted jet electrodeposition, the magnetic particles can be arranged in an orderly manner under the magnetic field. By adjusting various parameters, specific micro/nano rough structures—such as coral-like, mountain-like, and micro/nano-pore arrays—can be fabricated [22,23,24]. The formation of such micro/nano rough structures constitutes the core mechanism for achieving superhydrophobic surfaces. Xu et al.[25] employed magnetic field-assisted jet electrodeposition with Ni-SiC composite powder added to the electrolyte. By adjusting the magnetic field intensity, they were able to control the distribution density of “spindle-shaped” clusters on the coating surface. These spindle-shaped features possess a hierarchical micro/nano structure, imparting superhydrophilicity to the coating. In a related study, Yu et al.[26] incorporated ZrO2 particles into the electrolyte and compared the effects with and without magnetic field assistance. Without the magnetic field, the water contact angle was merely 90.4°, whereas under a 100 mT magnetic field, the contact angle increased to 153.9°, achieving superhydrophobicity. Jiang et al.[27] applied magnetic field-assisted jet electrodeposition to a nickel-cobalt alloy bath containing MoS2/Ni particles, producing a coral-like raised microstructure on the coating surface. They also investigated the effect of particle concentration, and observed that the higher concentration resulted in denser coral-like protrusions and enhanced stable superhydrophobic performance. Shen et al. [28] employed magnetic field-assisted jet electrodeposition and systematically investigated the effects of different process parameters on cluster morphology by adjusting the magnetic field intensity and nickel particle concentration. However, the aforementioned studies have only focused on regulating particle concentration and magnetic field intensity, without addressing the influence of particle diameter on cluster morphology. In addition, diamond, as the hardest material in nature, possesses excellent wear resistance and chemical inertness. Studies have demonstrated that diamond particles can be co-deposited with metal ions via electrodeposition, yielding composite coatings with superior wear resistance [29].
This study aims to design and fabricate a high-performance cluster structure via electrodeposition, to achieve stable superhydrophobicity and corrosion resistance. The effects of nickel particle diameter and magnetic field intensity on the cluster morphology and protective performance of the coatings were investigated. To further balance the functional properties of the coatings, diamond particles with high hardness, wear resistance, and chemical stability were introduced, and their co-deposition behavior with metal ions was utilized to enhance the wear resistance of the coatings. This work thereby provides a novel two-step electrodeposition strategy and experimental basis for multifunctional nickel-diamond composite coatings.
2. Experimental
2.1. Experimental Setup
In this experiment, a magnetic field-assisted scanning jet electrodeposition apparatus was used, as shown in Figure 1(a). The apparatus mainly consisted of an electrodeposition module, an electrolyte circulation module, a heating module, a magnetic field generation module, and a motion control module. An active nickel rod and nickel pellets were used as the anode. An AH32 steel plate of 25 mm × 20 mm × 3 mm was used as the cathode. The nozzle had a rectangular outlet with dimensions of 10 mm × 2 mm. The magnetic field generation system consisted of a waterproof cover and two stacked permanent magnets measuring 50 mm × 50 mm × 20 mm, which were fixed beneath the cathode specimen. The magnetic field intensity was controlled by adjusting the distance between the permanent magnets and the cathode. For each magnetic field intensity (50 mT, 100 mT, and 150 mT), the corresponding distance from the upper surface of the permanent magnets to the upper surface of the cathode specimen was 31.5 mm, 21.5 mm, and 12 mm, respectively. A direct current (DC) power supply was used, and the motion control system drove the three-axis motion platform to move the nozzle in a reciprocating scanning pattern over the cathode workpiece, thereby enabling the deposition of the coating onto the cathode surface, as shown in Figure 1(b).
2.2. Experimental Procedures ·
As illustrated in Figure 2, the overall fabrication procedure consisted of three stages: (1) a pre-treatment stage, including substrate preparation and pre-deposition of a dense nickel bonding layer; (2) a two-step electrodeposition stage, comprising Step 1, magnetic field-assisted jet electrodeposition to construct the rough cluster skeleton that provides superhydrophobicity, and Step 2, conventional bath composite electrodeposition to incorporate diamond particles as a hard reinforcing phase that enhances wear resistance; and (3) a post-treatment stage of low-surface-energy modification with PFDTES.
The substrate used in this work was AH32 steel, with its chemical composition listed in Table 1. The nickel particles employed in this experiment had nominal diameters of 0.2 μm, 2 μm, and 20 μm, respectively, and were purchased from Nangong Lijia Metal Materials Co., Ltd. The micron-sized diamond particles with a diameter of 2 μm were obtained from Zhechang Zhongyuan Superhard Abrasives Co., Ltd. The base electrolyte was a Watts-type bath, the composition of which is presented in Table 2. All chemical reagents were purchased from Shanghai Aladdin Biochemical Technology Co., Ltd. The low-surface-energy modifier used was 1H,1H,2H,2H-perfluorodecyltriethoxysilane (PFDTES), which was obtained from Shanghai Macklin Biochemical Technology Co., Ltd.
Three types of electrolytes were prepared: a basic Watts-type bath (designated as Watts), a Watts-type bath with nickel particles of different diameters (designated as Watts-N), and a Watts-type bath with diamond particles (designated as Watts-D). The formulation of the basic Watts-type bath was given in Table 2.
The Watts-N electrolyte was prepared as follows. First, nickel particles were dispersed in deionized water under mechanical stirring for 1 h to obtain a dispersion. Then, the dispersion was slowly added to the Watts-type bath, and the stirring was continued for another 1 h to promote uniform dispersion of the nickel particles. The preparation procedure for the Watts-D electrolyte was similar: diamond particles were dispersed in deionized water under mechanical stirring for 1 h, and the resulting dispersion was slowly introduced into the Watts-type bath, followed by an additional 1 h of stirring to ensure homogeneous dispersion of the diamond particles.
First, the AH32 steel substrate (25 × 20 × 3 mm) was pretreated by grinding with SiC abrasive papers of 400, 600, and 800 grit to remove surface impurities, followed by ultrasonic cleaning in ethanol for degreasing, and finally ultrasonic cleaning in deionized water, then blown dry for later use. The sample was ultrasonically cleaned in deionized water for 10 min after each step of the preparation procedure. As part of the pre-treatment stage, a flat and dense nickel bonding layer was then pre-deposited on the pretreated substrate from the Watts bath by jet electrodeposition for 10 min, as illustrated in Figure 2, which enhanced the adhesion between the substrate and the subsequent coatings and also served as the primary protective barrier. The jet electrodeposition parameters are listed in Table 3.
In the first deposition step (Step 1), the Watts-N electrolyte was used in combination with the magnetic field-assisted jet electrodeposition process (with process parameters listed in Table 3) for a deposition time of 30 min to construct the rough superhydrophobic cluster skeleton.To investigate the regulatory effects of nickel particle diameter and magnetic field intensity on the surface morphology of the coatings, a gradient experimental approach was adopted. The selected nickel particle diameters were 0.2 μm, 2 μm, and 20 μm, and the magnetic field intensities were 50 mT, 100 mT, and 150 mT, The concentration of nickel particles added in all experiments was 4 g/L. The final sample designations and corresponding process parameters are presented in Table 4.
In the second deposition step (Step 2), the electrodeposition configuration was switched to conventional bath composite electrodeposition using the Watts-D electrolyte for 10 min to co-deposit diamond particles as a hard reinforcing phase onto the cluster skeleton. In our previous study, it was found that the maximum co-deposition of diamond particles in the coating was achieved at a diamond particle concentration of 10 g/L, the current density was 5 A/dm2, an electrode spacing of 50 mm, a stirring speed of 200 r/min, and a bath temperature of 50 °C; therefore, these parameters were also adopted in the present work.
Finally, in the post-treatment stage, the samples after the two-step deposition were subjected to surface modification by immersion in a 1H,1H,2H,2H-perfluorodecyltriethoxysilane-ethanol solution (mass ratio 1:50) at room temperature for 3 h, enabling the surface microstructure to adsorb fluorinated molecules. After natural drying, a large amount of air was trapped in the gaps of the cluster structure, forming an air cushion that lifted the droplets, thereby achieving superhydrophobicity.
To quantitatively decouple the contributions of the magnetic field, Ni particles, diamond particles, and low-surface-energy modification to the coating performance, a series of single-variable control samples were prepared based on the optimal 2N-150 process, as summarized in Table 5. For C1, the Step 2 conventional bath deposition was carried out in a diamond-free Watts bath, i.e., the same deposition time (10 min), current density (5 A/dm2), and bath conditions were used but without adding diamond particles, so that the cluster skeleton formed in Step 1 was retained while the diamond reinforcing phase was removed. For C2, both Step 1 and Step 2 were identical to 2N-150, but the final PFDTES modification was omitted. For C3, the magnetic field was removed (0 mT) during Step 1 while all other parameters remained identical to 2N-150. For C4, no Ni particles were added to the Step 1 electrolyte (i.e., a pure Watts bath was used in the jet electrodeposition step) while the magnetic field was maintained at 150 mT. All control samples shared the same substrate pretreatment and the same 10-min pre-deposition of a dense Ni bonding layer as the 2N-150 baseline.
2.3. Surface Characterization and Testing Methods ·
The surface and cross-sectional morphologies and elemental distribution of the coatings were analyzed using a high-resolution field-emission scanning electron microscope (SEM, Thermo Fisher Scientific, Apreo 2S) equipped with an energy-dispersive X-ray spectrometer (EDS, Oxford Instruments, Ultim Max 65).
To evaluate the hydrophobicity of the sample surfaces, the water contact angles were measured using a contact angle goniometer (Changzhou Taylor Instrument Technology Co., Ltd., JY-PHb). The droplet volume was 5 μL, and the test liquid was deionized water. The contact angle was determined using the height-width method. Measurements were taken at five different positions on each sample surface,and the results were reported as mean ± standard deviation.
The friction and wear tests were conducted under unlubricated conditions using a pin-on-disc tribometer (Lanzhou Zhongke Kaihua Technology Development Co., Ltd., SFT-2M). The counterpart was a 304 stainless steel ball with a diameter of 6 mm and a hardness of HRC 20–HRC 30. The tests were performed at a load of 3 N, a rotational speed of 300 r/min, a wear track diameter of 8 mm, and a sliding duration of 240 s. Before and after each test, the specimen was ultrasonically cleaned to remove wear debris and dried, and its mass was weighed on an electronic analytical balance (resolution 0.1 mg). he mass loss Δm (mg) was calculated as the difference between the pre- and post-test specimen masses, as given by Eq. (1):
where m0 and m1 denote the mass of the whole specimen (coating plus substrate) before the wear test and the mass after the test (after cleaning and drying), respectively; for each set of experimental parameters, three replicate specimens were tested, and the mass loss is reported as the mean ± standard deviation.
Electrochemical tests were carried out using an electrochemical workstation (Bio-Logic Science Instruments, SP-300). The tests were performed in a three-electrode system, with a saturated calomel electrode as the reference electrode, a platinum electrode as the counter electrode, and the sample as the working electrode. The exposed area of each sample was 1 cm2, and the test temperature was 25 °C. Prior to the electrochemical impedance spectroscopy (EIS) and potentiodynamic polarization measurements, each sample was immersed in a 3.5 wt% NaCl solution for 0.5 h to allow the open circuit potential (OCP) to reach a stable state.
EIS measurements were performed at the open-circuit potential (OCP) using an alternating-current (AC) perturbation with an amplitude of 5 mV over a frequency range from 105 to 10−2 Hz. The impedance spectra were fitted by complex non-linear least-squares (CNLS) regression using ZView software with Calc-Modulus weighting (1/|Z|2); the goodness of fit (χ2) and parameter uncertainties are reported in Table 6 and the statistics paragraph below. After the OCP stabilized, potentiodynamic polarization curves were recorded by sweeping the potential from −0.4 V to +0.4 V relative to the OCP at a constant scan rate of 5 mV/s. The corrosion potential (Ecorr) and corrosion current density (Icorr) were obtained by Tafel extrapolation, by linearly fitting the anodic and cathodic branches within ±0.06 V around the Ecorr; the protection efficiency (η) was calculated using Eq. (2).
The protection efficiency η (%) of the coating was calculated according to Eq. (2), where ibare and icoating are the corrosion current densities of the bare substrate and the coated sample, respectively [30].
3. Results and Discussion
3.1. Surface and Cross-Sectional Morphologies and Elemental Analysis
Both the nickel particle size and the magnetic field intensity significantly influenced the surface morphology of the cluster layer. Figure 3 showed the effect of different nickel particle sizes on the coating surface morphology under a magnetic field of 150 mT. The surface of coating 0.2N-150 exhibited a hemispherical cauliflower-like cluster structure (Figure 3(a)). Examination of the elemental distribution (Figure 3(b)) revealed numerous black vacant regions in the nickel elemental mapping. This is attributed to the fact that these regions correspond to the valleys between peaks, where the signal was blocked, resulting in the black vacant areas in the mapping. The carbon element originated from the diamond particles co-deposited in the second step, and it was found that carbon was preferentially distributed over the cauliflower-like cluster regions. The surface of coating 2N-150 exhibited spindle-shaped dendritic clusters (Figure 3(c)), which were densely packed and uniformly distributed on the surface, and the gap width between adjacent clusters being approximately 10 μm. This observation is similar to the experimental results reported by Shen et al.[28]. Examination of the elemental distribution (Figure 3 (d)) revealed that both carbon and nickel were distributed more uniformly, and the black vacant regions were also regularly distributed. Coating 20N-150 also displayed a dendritic cluster structure (Figure 3 (e)); however, the inter-cluster spacing was relatively large and less-uniform, with the gap width ranging from approximately 10 to 50 μm.
Combined with the statistical analysis of the cross-sectional morphology dimensions, the longitudinal growth thickness of the cluster structures exhibited a significant nonlinear increasing trend with increasing nickel particle diameter. For the sample with a nickel particle diameter of 0.2 μm (0.2N-150), the cluster extension thickness was approximately 104 μm (Figure 4(b)). When the nickel particle diameter was increased to 2 μm (2N-150), the coating thickness slightly increased to approximately 140 μm (Figure 4(e)). In contrast, for the sample with large nickel particles (20N-150), the longitudinal growth height of the clusters increased sharply to approximately 472 μm (Figure 4(h)), representing a thickness enhancement substantially greater than that of the two small-particle systems. This phenomenon can be attributed to the localized tip effect introduced by nickel particles attached to the cathode substrate surface under the electric field during jet electrodeposition. The larger the nickel particle size, the more intense the electric field concentration at the particle edges and corners, leading to a significant increase in the local electric field intensity at the cathode/particle interface. This greatly accelerates the reduction and deposition kinetics of Ni2+, inducing explosive directional growth of the deposited clusters along the direction perpendicular to the substrate, ultimately forming towering dendritic structures with substantial longitudinal dimensions. Under the regulation of the vertical concentrated electric field, the dendrites exhibited preferential longitudinal growth, while lateral growth was suppressed. From the perspective of the overall structure, the clusters were widely spaced with sparse and non-uniform distribution, and the coating interface exhibited much more pronounced fluctuations than those of the two small-particle samples.
When the nickel particle diameter was 2 μm, the surface morphologies and elemental distributions of the coatings under varying magnetic field intensities were shown in Figure 5. Compared with sample 2N-150 (Figure 5(e)), sample 2N-50 exhibited a denser cluster structure with smaller inter-cluster spacing and the most uniform cluster height (Figure 5(a)). Sample 2N-100 displayed a cluster distribution similar to that of sample 2N-150, with comparable inter-cluster spacing (Figure 5(c)). Observation of the cross-sections (Figure 6) revealed that as the magnetic field intensity increased, the cluster height first increased and then decreased, with the thicknesses of samples 2N-50, 2N-100, and 2N-150 being approximately 128 μm, 181 μm, and 140 μm, respectively. The geometrical features of the clusters also varied. In Figure 6(b) and 6(e), samples 2N-50 and 2N-100 exhibited relatively slender clusters with higher aspect ratios, and the cluster growth was accompanied by the formation of cavities and discontinuities. In contrast, sample 2N-150 (Figure 6 (h)) showed thicker and more robust clusters with fewer internal cavities. The compactness of the cluster interiors, with increasing magnetic field intensity, first decreased and then increased: sample 2N-150 was the most compact, followed by sample 2N-50, while sample 2N-100 exhibited the loosest structure.
The tip details of the clusters on different samples observed at high magnification were shown in Figure 7. It was found that the cluster tips exhibited similar structures, with numerous small black particles widely distributed on the coating surface, particularly concentrated at the cluster tips. Under 2000× magnification, the tip details of sample 2N-150 (Figure 7(e)) revealed that the small black particles were comparable in size to the diamond particles added in the second-step process. Combined with the carbon signal provided by EDS in Figure 7(f), it was concluded that these small black particles were diamond particles. The diamond particles were closely integrated with the cluster structure, with some particles partially exposed and others embedded within the clusters. In addition, hierarchical structures were observed at the cluster tips, where some diamond particles were encapsulated by reduced nickel grains, and the nickel grains developed cauliflower-like structures above the diamond particles. The grain size within these cauliflower-like structures reached the nanoscale, which provided favorable conditions for surface superhydrophobicity. Based on the above analysis, it was evident that diamond particles could be widely distributed on the coating surface, indicating that switching from jet electrodeposition to bath electrodeposition was highly effective for the co-deposition of diamond particles.
To further decouple the contributions of the magnetic field, Ni particles, diamond particles, and low-surface-energy modification to the surface architecture, the morphologies of the control samples (Table 5) were compared with that of the optimal 2N-150 coating. As shown in Figure 8, the surface morphology of C1 (fabricated without diamond particles in Step 2) was essentially identical to that of 2N-150: the longitudinal dendritic cluster skeleton constructed by Step 1 remained intact, indicating that the cluster architecture was independent of the Step 2 diamond co-deposition. Because PFDTES modification proceeded by molecular adsorption and did not alter the surface architecture, C2 (without PFDTES) exhibited a morphology indistinguishable from that of 2N-150 and was therefore not shown. In contrast, when the magnetic field was removed (C3, 0 mT), the ordered dendritic cluster skeleton disappeared completely and the surface became comparatively flat and dense (Figure 8(e, f)); similarly, in C4 (without Ni particles in Step 1), no cluster protrusions developed and the surface consisted of a flat nickel layer (Figure 8(g, h)).
The corresponding high-magnification SEM images and EDS mappings (Figure 9) further clarified the distribution state of diamond particles. For 2N-150, abundant carbon signals were concentrated on the cluster tips (Figure 9(b)), consistent with the black particles observed in Figure 7. For C1, the carbon signal was markedly weakened (Figure 9(d)), confirming that the black features observed in the full coating were diamond particles and that the cluster skeleton itself was free of diamond. For C3 and C4, diamond particles were directly exposed on the flat nickel surface (Figure 9(f, h)), because the absence of the cluster skeleton prevented the particles from being embedded within raised protrusions. These observations confirmed that the longitudinal cluster skeleton was jointly governed by the magnetic field and the Ni particles, whereas diamond particles did not participate in the formation of the rough architecture and were merely embedded within it during Step 2.
3.2. Formation Mechanism
The mechanism of cluster formation during magnetic field-assisted jet electrodeposition is as follows. The electrolyte, driven by a pump, impinges onto the cathode at high velocity, carrying Ni2+ ions and nickel particles to the surface. Under an externally applied parallel magnetic field, the ferromagnetic nickel particles become magnetized, giving rise to magnetic dipole interactions among the particles, which tend to align in chains or orient along the magnetic flux lines [31]. Subsequently, a portion of the particles are adsorbed and retained on the cathode surface under the combined influence of the magnetic field and the electrodeposition process. The trapped nickel particles act as local micro-protrusions, inducing electric field concentration and creating a microscopic tip effect that elevates the local current density around them. Consequently, Ni2+ ions are rapidly reduced at the contact points between these nickel particles and the cathode as well as on the particle surfaces; the deposited nickel atoms “spot-weld” and embed the particles, firmly anchoring them in place. Meanwhile, the high-speed jet generates intense turbulent shear forces that tend to disturb and wash away particles that are not yet firmly fixed. Moreover, the jet effectively breaks up agglomerates of nickel particles, exposing more discrete individual particles to the magnetic field, thereby facilitating their capture by magnetic forces and alignment along the field direction. Hence, only those nickel particles with sufficiently strong magnetic adhesion to withstand fluid drag forces survive the process. Once immobilized, these particles further accentuate the surface micro-protrusions, and the reduced metallic nickel continues to grow epitaxially on the nickel particles, bridging newly supplied particles from the electrolyte. This cyclical process ultimately results in the formation of a robust hierarchical micro–nano cluster structure, with the nickel particles serving as nuclei and the reduced nickel acting as the interconnecting phase.
When the magnetic field intensity is fixed and the nickel particle diameter is gradually increased (0.2 μm, 2 μm, 20 μm), the coating clusters exhibit distinctly different growth patterns. For ferromagnetic nickel particles, their transport and capture behavior during the magnetic field-assisted jet electrodeposition process is primarily governed by the combined effects of the magnetic field and fluid drag forces. The particle capture model generally attributes particle motion to the competition between the magnetic force Fm and the fluid force Fd [32,33], Fm originates from the force experienced by the magnetized particles in a gradient field, as given by Eq. (3).
Where χeff is the effective magnetic susceptibility of the particles, μ0 is the permeability of free space, B is the magnetic flux density, and ∇B is the magnetic field gradient. The nickel particles can be approximated as spheres with a volume Vp = π/6 d3, from which it follows that Fm ∝ d3.
The drag force exerted on the nickel particles by the high-speed jet is given by Eq(4).
Where CD is the drag coefficient (which can be regarded as a constant in a turbulent jet), ρf is the density of the electrolyte, v is the outlet flow velocity of the electrolyte, and A is the cross-sectional area perpendicular to the flow. Since the nickel particles can be approximated as spheres, the projected area is A = π/4 d2, from which it follows that Fd ∝ d2.
To intuitively quantify the competition between the two forces, a dimensionless parameter Ψ is defined, as shown in Eq. (5).
When Ψ is relatively small, fluid disturbance and jet scouring effects dominate, making it difficult for particles to be stably captured and orderly arranged on the cathode surface. When Ψ falls within an intermediate range, the magnetic capture effect and the jet dispersion effect can reach a relative balance, particles can be effectively captured by the magnetic field without excessive agglomeration, which favors the formation of uniformly aligned cluster templates. When Ψ is too large, the magnetic capture and interparticle magnetic dipole attraction become excessively strong, causing large particles or particle agglomerates to readily form local intensive deposition centers, which in turn induce excessively strong tip effects and non-uniform vertical growth. Given fixed experimental parameters, K remains constant; therefore, there exists a particle size range that favors uniform cluster growth, within which Ψ lies in the intermediate regime.
When the nickel particle diameter is 0.2 μm, the particle size is relatively small, the magnetic field effect is comparatively weak, and Ψ remains at a low level. In this case, the disturbance and scouring effects of the high-speed jet on the particles become more pronounced, making it difficult for the particles to form stable chain-like arrangements or regular templates on the cathode surface. A large number of small particles participate in the deposition via random transport, random adsorption, and localized aggregation, resulting in dispersed and irregular micro-protrusions. Although these micro-protrusions can provide numerous nucleation sites, the tip effect of each individual protrusion is weak, and the degree of local electric field concentration is limited, rendering it incapable of inducing pronounced preferential directional growth. Consequently, the 0.2N-150 coating ultimately exhibits cauliflower-like disordered clusters with low height and non-uniform dimensions, and its cross-sectional height is approximately 104 μm. When the nickel particle diameter increases to 2 μm, the magnetic responsiveness of the particles is markedly enhanced, and the magnetic capture effect becomes more dominant relative to the jet disturbance effect. At this size, the particles are neither simply swept away randomly by the flow field nor subject to excessively strong localized aggregation as in the case of larger particles; instead, they lie within a particle size range where magnetic capture and jet dispersion are relatively well coordinated. On one hand, the magnetic field promotes the oriented capture and ordered accumulation of nickel particles near the cathode surface. On the other hand, the high-speed jet still exerts a certain dispersive effect on particle agglomerates, preventing excessive concentration of particles at a few specific sites. The combined action of these two factors enables the nickel particles to form a relatively uniform array of micro-protrusions on the cathode surface. Subsequently, Ni2+ ions are preferentially reduced and deposited at these micro-protrusions, giving rise to a relatively regular array of local tip sites, which further induces vertical cluster growth. Ultimately, the 2N-150 coating develops a dendritic cluster structure with uniform distribution and relatively regular spacing, where the adjacent cluster spacing is about 10 μm and the cross-sectional height is approximately 140 μm. It is evident, therefore, that when the nickel particles are 2 μm in size, Ψ falls within an intermediate range, corresponding to a favorable regime for uniform and dense cluster growth.When the nickel particle diameter further increases to 20 μm, the particle volume increases substantially, and both the magnetic field effect and the local tip effect of the particles are distinctly enhanced. At this stage, Ψ reaches a relatively high level. Once large particles approach and are retained on the cathode surface, they readily form large-sized local protrusions. These oversized protrusions induce stronger local electric field concentration, significantly accelerating the reduction and deposition rate of Ni2+ in their vicinity, thus leading to rapid localized vertical growth. Meanwhile, the excessively strong local deposition consumes metallic ions from the surrounding regions and suppresses nucleation and growth in adjacent areas, i.e., a certain local shielding effect arises. Because the deposition current and mass transport are preferentially occupied by a few strong tip regions, the spacing between clusters becomes larger and non-uniform, eventually forming towering, sparse, and irregularly spaced dendritic structures. The cluster height of the 20N-150 coating reaches approximately 475 μm, and the adjacent cluster spacing ranges from about 10 to 50 μm, indicating that although excessively large nickel particles enhance magnetic capture and tip effects, they are detrimental to the formation of a uniform and dense cluster layer.
When the nickel particle diameter is 2 μm, varying the magnetic field intensity also affects particle capture, cluster density, and coating compactness. When the magnetic field intensity is 50 mT, the magnetic capture capability is relatively weak, and the particles remain notably influenced by jet disturbance. Under this condition, individual particles or small agglomerates tend to deposit over a wider area in a dispersed manner, giving rise to a higher density of nucleation sites. Because the local tip effect is not pronounced, the deposition current does not become excessively concentrated in a few regions; consequently, the overall cluster height is relatively low, approximately 128 μm, yet the clusters are densely distributed and relatively uniform in height. When the magnetic field intensity is increased to 100 mT, particle magnetization and magnetic capture are enhanced. However, since the magnetic field distribution, local particle concentration, and jet disturbance in the actual deposition zone are not perfectly homogeneous, some regions may develop larger particle agglomerates or locally enhanced capture zones. Such zones induce stronger local tip effects, attracting more deposition current and Ni2+ reduction, thereby forming locally taller clusters; the coating thickness increases to about 181.37 μm. Nevertheless, in other regions, particle capture and deposition growth remain relatively insufficient, resulting in a coating that exhibits local protrusions, overall loose structure, and increased porosity. This non-uniform structure reduces the overall compactness of the coating and also provides pathways for subsequent electrolyte penetration; accordingly, the 2N-100 coating exhibits poor performance in corrosion tests, with a protection efficiency of only 50.61%. When the magnetic field intensity is further raised to 150 mT, the magnetic capture capability of the nickel particles is further enhanced, allowing more particles to participate in ordered accumulation and co-deposition near the cathode surface. In contrast to the local agglomeration and localized rapid growth observed at 100 mT, at 150 mT the retention and distribution of particles on the deposition surface are more adequate, the cluster skeleton becomes denser, and the local current concentration is shared among more nucleation sites. As a result, the cluster height declines to about 139.51 μm. Although the coating is not the tallest, the clusters are more uniformly arranged and internally denser, which more effectively impedes the penetration of corrosive media. Therefore, the 2N-150 coating exhibits the best corrosion resistance in subsequent electrochemical tests, achieving a protection efficiency of 99.46%.
The control experiments provided direct experimental verification of this mechanism. For C3 (0 mT), no ordered cluster skeleton was observed and the surface was flat (Figure 8(e, f)); For C4 (no Ni particles), there were no particles to be magnetically captured, no micro-protrusions to induce the tip effect, and no clusters developed either (Figure 8(g, h)). These observations confirmed that both the magnetic field and the Ni particles were indispensable for cluster formation, consistent with the Eq. (5).
3.3. Surface Hydrophobicity
The water droplet contact angles of the samples prepared under different process conditions were shown in Figure 10. The unmodified AH32 steel substrate exhibited a water contact angle of 89.4°. After low-surface-energy modification, the contact angle of the AH32 steel increased to 110.1°, yet it remains far lower than that of the samples fabricated by magnetic field-assisted jet electrodeposition. Except for sample 0.2N-150, all other coating samples exhibited water contact angles exceeding 150°, thus achieving superhydrophobic surfaces. The reason for this phenomenon is that, even after modification, the AH32 steel surface lacks a rough structure, thereby limiting its contact angle. In contrast, the samples prepared by the magnetic field-assisted electrodeposition develop cluster morphologies due to the incorporation of nickel particles, which render the surface rough and create numerous inter-cluster gaps capable of trapping air. When the added nickel particles are small (0.2 μm), their magnetic adsorption is relatively weak, and the high-speed jet strongly perturbs the particles, preventing them from forming stable magnetically aligned arrangements; instead, they deposit on the cathode surface as random agglomerates. This leads to cauliflower-like clusters of varying sizes and non-uniform distribution, which directly compromises the overall hydrophobic performance and prevents the surface from reaching the superhydrophobic level. The remaining samples all generate similar cluster shapes, namely fusiform dendritic clusters, with analogous tip structures and hierarchical features: the diamond particles are encapsulated by the reduced nickel crystallites, and the nickel crystallites develop micro-/nano-cauliflower structures on top of the diamond, thereby providing the conditions for surface superhydrophobicity. Among these samples, the only differences lie in cluster height, cluster distribution density, and internal compactness, which account for the relatively small variations in water contact angles among the subsequent samples. The corresponding sliding angles (Figure 10(b)) were all below 12°, with 2N-50 exhibiting the largest value (11.19°) and 2N-150 the smallest (7.52°), indicating that all superhydrophobic samples possessed low adhesion to water.
The control experiments further identified the essential elements for superhydrophobicity (Figure 11). The C1 sample (no diamond particles) maintained a contact angle of 154.2° and a sliding angle of 6.52°, nearly identical to those of 2N-150 (154.9°, SA = 7.51°), confirming that diamond particles do not contribute to the superhydrophobic state. In contrast, the C2 sample (no PFDTES modification) became completely hydrophilic (CA = 8.7°), demonstrating that the low-surface-energy modification was indispensable. When the cluster skeleton was removed in C3 (0 mT) or C4 (no Ni particles), the contact angles dropped to 108.1° and 108.7°, respectively—similar to that of the modified flat AH32 substrate (110.1°). These results indicated that superhydrophobicity required the synergistic combination of the magnetic-field/Ni-particle-induced cluster roughness and PFDTES modification; neither the rough architecture alone nor the low-surface-energy chemistry alone was sufficient.
3.4. Wear Test Results
To investigate the wear resistance and friction-reduction performance of different samples, friction and wear tests were conducted using a pin-on-disk tribometer, and the friction and wear properties of the coatings were evaluated under dry friction conditions. Figure 12(a) showed the friction coefficient versus time curves for the surfaces under different parameter conditions. Comparing samples 0.2N-150, 2N-150, and 20N-150, as the nickel particle diameter gradually increased, the friction coefficient exhibited a trend of first decreasing and then increasing. Under a fixed magnetic field intensity of 150 mT, sample 2N-150 had the lowest friction coefficient, with an average value of 0.145. With the nickel particle diameter fixed at 2 μm, comparing samples 2N-50, 2N-100, and 2N-150 as the magnetic field intensity was progressively increased, the friction coefficient showed a trend of first increasing and then decreasing, among which sample 2N-50 exhibited the lowest friction coefficient, with an average value of 0.100. This phenomenon was related to the uniformity of cluster growth: samples 2N-50 and 2N-150 both exhibited the most uniform cluster heights and distributions, and consequently their friction coefficients remained at relatively low levels.
Figure 12(b) presents the histogram of mass loss(mg). When the magnetic field intensity was fixed at 150 mT and the nickel particle diameter was gradually increased, the mass loss exhibited a trend of first decreasing and then increasing. When the particle diameter was fixed and the magnetic field intensity was gradually increased, the mass loss showed a trend of first increasing and then decreasing. Among all samples, sample 2N-150 had the lowest mass loss of only 0.70 mg, while sample 20N-150 showed the highest mass loss of 8.93 mg. The reason for this phenomenon was that, when the nickel particle diameter was 20 μm and the magnetic field was 150 mT, the magnetic capture of particles was far stronger than the dispersive effect of the flow field, leading to explosive growth in cluster height and non-uniform distribution. After the tall clusters were worn or fractured, a large amount of coating mass was lost, thus resulting in the highest mass loss. The factor contributing to the lowest mass loss of sample 2N-150 was that, under this process condition, the magnetic capture effect and the flow-field dispersive effect reached a relative balance. In this case, the clusters exhibited a structure with relatively low heights and a uniform distribution; even if some clusters underwent wear or fracture, they did not remove excessive mass, while the uniformly distributed clusters shared the normal load of the friction counterpart. On the other hand, sample 2N-150 possessed a surface microstructure with suitable cluster heights and inter-cluster gaps, which could trigger a self-reinforcing wear mechanism: under frictional shearing, the cluster tips fractured, and the resulting tip debris was captured and retained in the adjacent inter-cluster gaps [24], This wear mechanism is schematically illustrated in Figure 13.
The control experiments further quantified the respective roles of diamond particles and PFDTES modification in friction and wear. As shown in Figure 14, compared to sample 2N-150, C1 increased the mass loss from 0.70 mg to 2.77 mg (nearly fourfold) and raised the steady-state friction coefficient from 0.14 to 0.39, directly demonstrating that diamond particles were the dominant reinforcing phase responsible for wear resistance. Without the hard diamond phase embedded in the cluster tips, the exposed nickel matrix was rapidly ploughed by the counterpart, leading to severe adhesive and abrasive wear, and the cluster tips were worn flat rather than retained. In contrast, omitting PFDTES modification (C2) only marginally increased the mass loss (0.87 mg versus 0.70 mg) but substantially raised the friction coefficient from 0.14 to 0.31, indicating that the low-surface-energy fluorinated layer acted primarily as a chemical lubricant that lowered shear resistance at the contact interface rather than as a load-bearing phase [34]. Because the diamond reinforcing phase and the nickel matrix were identical to those in 2N-150, the wear volume was only slightly affected by the absence of PFDTES, while the frictional shear stress increased markedly once the low-energy fluorinated chains were removed. C3 and C4 were not subjected to wear tests because they lack the magnetic-field/Ni-particle cluster skeleton; their purpose was to decouple the roughness-related contributions to hydrophobicity and corrosion resistance.
Figure 15 presented the surface morphologies of the different coatings after wear testing. As shown in Figure 15 (a), (d), (g), (j), and (m) , morphological analysis revealed that abrasive wear was the dominant mechanism for all coatings. Under the condition of fixed magnetic field intensity of 150 mT and varying particle size(0.2 μm, 2 μm, and 20 μm), samples 0.2N-150 (Figure 15(b)) and 20N-150 (Figure 15(h)) both suffered severe damage. The taller clusters were first worn away under the combined action of transverse shear force and abrasion, leaving only coarse roots. From the C-element distribution in the EDS maps (Figure 15(c) and Figure 15(i)), only a small amount of C element was observed to be concentrated at the cluster roots, indicating that a small quantity of diamond had been crushed into the interior of the clusters. The reason for this phenomenon was that, owing to the non-uniform distribution of clusters in these two coatings, the actual contact area between the pin and the coating changed continuously, leading to large fluctuations and relatively high values of the friction coefficient. Sample 20N-150 possessed the tallest clusters and the most sparse distribution; during the wear process, the strong transverse shear force caused the tall and sparse dendritic clusters to break off successively, which was the main reason for the sharp increase in the mass loss of sample 20N-150. Sample 2N-150 exhibited the lowest mass loss and the best wear resistance. After wear, the surface still clearly displayed the hierarchical structure; the cluster tips were worn but did not fracture, and a large number of clusters were widely distributed across the field of view. Figure 15(f) showed that the C element exhibited a widespread distribution trend and was mainly concentrated on the cluster surfaces. Since the clusters were broadly distributed, the C element formed local enrichments at the cluster locations. From the elemental mapping, it was evident that a large amount of diamond was tightly combined on the cluster surfaces. The reason for this phenomenon was that the coating prepared under this parameter had the densest skeleton and the highest strength, so the clusters were not prone to fracture; meanwhile, the diamond distributed on the surface acted as a hard reinforcing phase, further reducing the wear of the clusters by the pin. This allowed the hierarchical structure of the coating to remain after wear.
As Figure 12(a) illustrated, 2N-50 exhibited the lowest friction coefficient, and its fluctuation over time was relatively stable. This was because the pin first contacted and wore the tips of the coating clusters. Since the clusters of sample 2N-50 grew most uniformly with a small height variation, the actual contact area between the pin and the coating fluctuated within a small range, and correspondingly, the measured friction coefficient values showed the most stable fluctuation. It could also be observed from Figure 15(k) that the worn surface was very flat. In addition, the solid particles detached by wear transformed sliding friction into rolling friction, producing a lubricating effect between the layers, which further reduced the friction coefficient. In the EDS map (Figure 15 (l)), the C element was observed to be uniformly distributed across the field of view, indicating that a large amount of diamond had been crushed into the interior of the clusters. During the subsequent wear process, these embedded diamond particles acted as a hard reinforcing phase, improving wear resistance, so that the mass loss of 2N-50 was only higher than that of 2N-150. For sample 2N-100, the friction coefficient fluctuated greatly, which confirmed the previous analysis that under such conditions, in some local areas, a few clusters of larger size and higher density were formed. At these locations, the contact area of the friction pair was very small, leading to extremely high contact stress, which consumed a large amount of energy and caused a sharp increase in friction force. In other areas, the clusters were porous and loose, and under load they were quickly compacted and smoothed, causing a sudden drop in friction force. Consequently, large fluctuations in friction coefficient occurred. From Figure 15(n), it could be seen that the clusters had lost their hierarchical structure; after wear, only coarse roots remained. Observing the distribution of C element in the EDS map (Figure 15(o)), a small amount of C element was found to be distributed at the cluster roots, indicating that a small portion of diamond was embedded in the cluster roots. When the diamond-enriched cluster tips were broken off, the friction-reduction performance of the coating decreased substantially, and the mass loss increased accordingly.
3.5. Corrosion Resistance Analysis
To systematically evaluate the corrosion resistance of each sample, electrochemical potentiodynamic polarization tests were conducted in 3.5 wt% NaCl solution. The test results of the AH32 substrate and the samples prepared under different parameters were shown in Figure 16(a). The corrosion current densities and corrosion potentials of all samples were calculated by the extrapolation method [35], and the protection efficiencies of the coatings were calculated according to Eq. (2); the calculated results were presented in Table 6. Generally, a lower corrosion current density (Icorr) implies a slower corrosion rate, and a higher corrosion potential (Ecorr) indicates a lower corrosion tendency [36]. As shown in Figure 16(a), all coatings exhibited higher corrosion resistance than the substrate. Among the parameter-optimized samples, the best corrosion resistance was achieved by sample 2N-150, with a self-corrosion current density of 1.301 × 10⁻⁷ A/cm2, while sample 0.2N-150 showed slightly inferior performance. The polarization curves of these two samples exhibited similar trends, with an anodic branch where the corrosion current density did not increase rapidly with increasing voltage but tended to flatten out, indicating that the coating corrosion transitioned from the active region to the passive region [37]. The passive region was approximately in the range of –0.2 to 0.1 V, whereas such a phenomenon was not observed for the other samples. This phenomenon was attributed to the fact that the coatings prepared under these conditions maintained the most stable hydrophobic state, which hindered electrolyte penetration and reduced the contact area for corrosion. which hindered electrolyte penetration and reduced the contact area for corrosion. Compared with sample 0.2N-150, sample 2N-150 had more densely and uniformly grown clusters with fewer internal voids, which stabilized the Cassie air layer and more effectively hindered electrolyte penetration. The Tafel curves of the remaining coatings exhibited similar trends, with no obvious passive region in the anodic branch; the current continuously increased with increasing potential, indicating that the corrosion type of these coatings was active dissolution. Among them, sample 2N-100 showed the worst corrosion resistance, with a corrosion current density of only 1.187 × 10⁻⁵ A/cm2. This phenomenon was ascribed to the fact that under this parameter condition, the cluster structure grew most irregularly and had the most voids, which made the superhydrophobic property of the coating highly unstable. When the sample was immersed in the electrolyte for a prolonged period, the air trapped by the unstable hydrophobic surface was gradually expelled, and the coating began to transform from the Cassie state to the Wenzel state. The rough and porous cluster structure increased the contact area with the electrolyte, which instead facilitated electrolyte penetration and rendered the underlying pure nickel bonding layer most susceptible to damage, allowing corrosive ions to further permeate into the substrate.
The Tafel results of the control samples (Table 7, Figure 17(a)) further clarified the origin of corrosion protection. Omitting PFDTES modification (C2) increased icorr from 1.30×10⁻⁷ to 3.86×10⁻⁷ A/cm2 and reduced the protection efficiency from 99.46% to 98.39%, demonstrating that the low-surface-energy modification was essential for maintaining a stable barrier against electrolyte ingress. In contrast, no diamond particles (C1), no the magnetic field (C3), or no Ni particles (C4) did not markedly change icorr (1.09×10⁻⁷, 1.22×10⁻⁷, and 1.00×10⁻⁷ A/cm2, respectively), with protection efficiencies all above 99.4%, indicating that neither diamond particles nor the cluster architecture significantly affected the corrosion current in the short-term Tafel test.
To cross-validate the above conclusions, electrochemical impedance spectroscopy (EIS) tests were performed on all samples. According to the previous hydrophobicity test results, all coatings were hydrophobic. When the water-repellent property of a hydrophobic surface was stable, it could serve as an effective barrier against the penetration of corrosive ions [38]. On the other hand, in the present study, a pure nickel layer was first deposited on the substrate. From the cross-sectional morphology, it could be seen that the pure nickel bottom layer was relatively thick (20 μm–30 μm) and dense. Therefore, under the dual influence of the superhydrophobic surface and the pure nickel underlayer, the electrolyte could hardly penetrate through the coating to the substrate within a short time. Consequently, on the phase-frequency characteristic curves of the Bode plots, only one peak appeared in the intermediate-frequency region, corresponding to a single time constant. Meanwhile, only one complete capacitive arc was observed in the Nyquist plots, which further confirmed that the system exhibited a single time-constant response. Thus, the equivalent circuit model Rs(Rct(CPEct)), as shown in Figure 16(d), was selected to fit the coating impedance data. Here, Rs, Rct, and CPEct represent the solution resistance, the charge-transfer resistance, and the constant phase element of the coating, respectively. Table 8 presents the quantitative fitting results for the substrate and each coating. In the Nyquist plots, a larger capacitive arc radius indicated better corrosion resistance. Among the parameter-optimized samples, Sample 2N-150 exhibited the largest capacitive arc radius, indicating the strongest corrosion resistance, followed by sample 0.2N-150, while the smallest arc radius was observed for the AH32 substrate, which showed the poorest corrosion resistance. In the Bode plots, the impedance modulus at low frequency (|Z| at 0.01 Hz) is generally used to evaluate the anti-corrosion performance of a coating; a higher (|Z| at 0.01 Hz) value corresponds to better protective performance [39]. Among the parameter-optimized samples, Sample 2N-150 showed the highest |Z| value at low frequency, implying the best anti-corrosion performance. in the Bode phase-angle plots, a phase angle closer to −90° indicates a more pronounced capacitive behavior and a more intact, protective coating, whereas a phase angle approaching 0° indicates resistive behavior and poor protection. As shown, samples 2N-150 and 0.2N-150 exhibited similar phase angles that were closest to −90° in the intermediate-frequency region, indicating the strongest capacitive character and the best coating integrity. The core reason for 2N-150 and 0.2N-150 exhibited higher corrosion resistance than the other parameter-optimized coatings was that their hydrophobic state was more stable in the electrolyte, which prolonged the retention of the Cassie air layer and more effectively hindered electrolyte penetration.which further hindered the penetration of corrosive ions.
The EIS results (Table 9, Figure 17(b, c)) provided further insight into the long-term barrier properties. Sample C2 drastically reduced Rct from 248,280 to 63,903 Ω·cm2, confirming that the fluorinated Cassie layer was the dominant factor for corrosion protection. Sample C1 did not reduce Rct (317,720 Ω·cm2), confirming that diamond particles do not contribute to corrosion resistance. When the magnetic field was removed (C3), Rct reached 392,560 Ω·cm2—higher than that of 2N-150—because the flat, dense nickel surface without cluster voids provided fewer pathways for electrolyte penetration. C4 exhibited an Rct (236,420 Ω·cm2) comparable to that of 2N-150, indicating that the cluster skeleton itself was not the main origin of corrosion protection. The 2N-150 coating was therefore the comprehensive optimum that balanced superhydrophobicity, wear resistance, and corrosion resistance, rather than the single-best sample in any individual property.
4. Conclusions
Following a pre-treatment stage in which a dense nickel bonding layer was pre-deposited on the substrate, a nickel-diamond composite coating was fabricated by a two-step electrodeposition route combining magnetic field-assisted jet electrodeposition (Step 1, construction of the rough cluster skeleton that provides superhydrophobicity) with conventional bath composite electrodeposition (Step 2, incorporation of diamond particles as a hard reinforcing phase that enhances wear resistance), after which a low-surface-energy modification was applied as a post-treatment. The effects of nickel particle size and magnetic field intensity on the surface morphology, hydrophobicity, wear resistance, and corrosion resistance of the coatings were systematically investigated. The following conclusions can be drawn:
(1) Both nickel particle size and magnetic field intensity exhibited significant regulatory effects on the cluster morphology. When the nickel particle diameter was 2 μm and the magnetic field intensity was 150 mT, the coating surface developed a uniformly distributed, regularly spaced fusiform dendritic cluster structure, with dense clusters well bonded to the substrate. A particle size that was too small (0.2 μm) resulted in cauliflower-like disordered clusters, while an overly large size (20 μm) led to sparse and tall dendritic structures with internal porosity. As the magnetic field intensity increased from 50 mT to 150 mT, the cluster density first decreased and then increased, with the optimal density achieved at 150 mT.
(2) Based on the competitive relationship between magnetic force and fluid drag force, a cluster growth mechanism model Ψ=Fm/Fd was established. When Ψ was relatively small, fluid disturbance and jet scouring effects dominated, making it difficult for particles to be stably captured and orderly arranged on the cathode surface. When Ψ fell within an intermediate range, the magnetic capture effect and the jet dispersion effect reached a relative balance, allowing particles to be effectively captured without excessive agglomeration, which favored the formation of uniformly aligned and internally dense clusters. When Ψ was too large, magnetic capture and interparticle magnetic dipole attraction became excessively strong, inducing overly strong tip effects and non-uniform vertical growth.
(3) After low-surface-energy modification, all coatings except 0.2N-150 achieved superhydrophobic states with water contact angles exceeding 150°. The 2N-150 coating exhibited a contact angle of 154.9° and a sliding angle of 7.51°. Control experiments confirmed that superhydrophobicity required the synergistic combination of the magnetic-field/Ni-particle-induced cluster roughness and PFDTES modification; omitting either element reduced the contact angle below 110°. Diamond particles did not affect the wettability (C1 maintained 154.2°).
(4) Wear tests demonstrated that the 2N-150 coating had the lowest mass loss (0.70 mg) and retained its hierarchical structure after wear. Among the parameter-optimized samples, 2N-50 exhibited the lowest steady-state friction coefficient (0.100) due to its highly uniform cluster height, while 2N-150 exhibited a friction coefficient of 0.145. Control experiments revealed that diamond particles were the dominant reinforcing phase responsible for wear resistance (C1 without diamond showed a nearly 4-fold higher mass loss of 2.77 mg), whereas PFDTES primarily reduced friction via chemical lubrication (C2 without PFDTES showed a similar mass loss of 0.87 mg but a higher friction coefficient of 0.31).
(5) Electrochemical tests showed that the 2N-150 coating achieved a self-corrosion current density of 1.301 × 10⁻⁷ A/cm2, a corrosion potential of −0.193 V, and a protection efficiency of 99.46%. The control experiments revealed that the corrosion protection originates primarily from the PFDTES-stabilized Cassie layer and the dense nickel bonding layer rather than from the diamond particles or the cluster skeleton: omitting PFDTES (C2) reduced Rct to 63,903 Ω·cm2, whereas removing diamond (C1, Rct = 317,720 Ω·cm2) or the cluster skeleton (C3, Rct = 392,560 Ω·cm2) did not reduce the charge-transfer resistance. The 2N-150 coating is therefore the comprehensive optimum balancing superhydrophobicity, wear resistance, and corrosion resistance, while the loose and porous 2N-100 coating gave the lowest protection efficiency of 50.61%.
In summary, when the nickel particle diameter was 2 μm and the magnetic field intensity was 150 mT, the prepared nickel-diamond composite coating simultaneously achieved superhydrophobicity (CA = 154.9%), low dry-friction coefficient (0.145), and high corrosion protection efficiency (99.46%). This study provided an efficient and controllable two-step electrodeposition approach for designing multifunctional nickel-based composite coatings.
Author Contributions
Xiaoli Wang: writing-review and editing, writing-original draft, visualization, validation, supervision, software, resources, project administration, methodology, investigation, funding acquisition, formal analysis, data management, conceptualization; Huaben Chen: writing-original draft, software, investigation, formal analysis, data curation; Rui Qi: investigation, formal analysis, data curation.
Funding
This research was funded by the Graduate Research Innovation Program of Jiangsu Ocean University (Grant No. KYCX2025-02).
Institutional Review Board Statement
Not applicable.
Informed Consent Statement
Not applicable.
Data Availability Statement
Not applicable.
Conflicts of Interest
The authors declare that they have no known competing financial interests or personal relationships that could have appeared to influence the work reported in this paper.
References
- Li, Y.; Ning, C. Latest research progress of marine microbiological corrosion and bio-fouling, and new approaches of marine anti-corrosion and anti-fouling [J]. Bioact. Mater. 2019, 4, 189–195. [Google Scholar] [CrossRef] [PubMed]
- Pei, W.; Pei, X.; Xie, Z.; et al. Research progress of marine anti-corrosion and wear-resistant coating [J]. Tribol. Int. 2024, 198. [Google Scholar] [CrossRef]
- Zhang, L.; Xu, X.; Zhang, Y.; et al. Simultaneously improving strength-ductility and corrosion resistance of high-Cr Ni-Cr alloys via Nb doping [J]. Mater. Charact. 2025, 230. [Google Scholar] [CrossRef]
- Gao, K.; Bai, X.; Gong, X.; et al. Ecofriendly solutions for marine fouling: Synthesis and performance evaluation of waterborne zinc acrylate self-polishing coatings [J]. Prog. Org. Coat. 2026, 210. [Google Scholar] [CrossRef]
- Li, Z.; Zhang, X.; Yang, X.; et al. Design of a dual-mode photoelectrochemical cathodic protection coating with an S-scheme heterojunction for steel in marine environments [J]. Constr. Build. Mater. 2026, 525. [Google Scholar] [CrossRef]
- Anadebe, V. C.; Martina Amadi, N.; Etim, I.-I. N.; et al. Interfacial bonding and synergistic effect of Ni-decorated S-g-C3N4/BiOBr nanohybrid as corrosion inhibitor for carbon steel in simulated marine environment [J]. Results Eng. 2026, 30. [Google Scholar] [CrossRef]
- Wang, X.; Jiang, Q.; Han, D.; et al. Progress in anti-biofouling materials and coatings for the marine environment [J]. J. Environ. Sci. 2026, 161, 494–510. [Google Scholar] [CrossRef] [PubMed]
- Firoozi, A.; Firoozi, A.; Oyejobi, D. O.; et al. Enhanced durability and environmental sustainability in marine infrastructure: Innovations in anti-corrosive coating technologies [J]. Results Eng. 2025, 26. [Google Scholar] [CrossRef]
- Rasitha, T. P.; Krishna, N. G.; Anandkumar, B.; et al. A comprehensive review on anticorrosive/antifouling superhydrophobic coatings: Fabrication, assessment, applications, challenges and future perspectives [J]. Adv. Colloid Interface Sci. 2024, 324, 103090. [Google Scholar] [CrossRef] [PubMed]
- Wang, W.; Fan, C.; He, M.; et al. Biomimetic multi-scale design: Robust superhydrophobic brass coatings via laser-textured armor and nano-silica hybridization [J]. Colloids Surf. A Physicochem. Eng. Asp. 2026, 731. [Google Scholar] [CrossRef]
- Botas, A. M. P.; Carvalho, A. F.; Fernandes, A. J. S.; et al. Laser patterning for fast production of superhydrophobic copper with delayed formation of patina and maintenance of surface electrical conductivity [J]. Appl. Surf. Sci. 2025, 686. [Google Scholar] [CrossRef]
- Fu, J.; Sun, Y.; Ji, Y.; et al. Fabrication of robust ceramic based superhydrophobic coating on aluminum substrate via plasma electrolytic oxidation and chemical vapor deposition methods [J]. J. Mater. Process. Technol. 2022, 306. [Google Scholar] [CrossRef]
- Huang, X.; Sun, M.; Shi, X.; et al. Chemical vapor deposition of transparent superhydrophobic anti-Icing coatings with tailored polymer nanoarray architecture [J]. Chem. Eng. J. 2023, 454. [Google Scholar] [CrossRef]
- Chen, X.; Gong, Y.; Suo, X.; et al. Construction of mechanically durable superhydrophobic surfaces by thermal spray deposition and further surface modification [J]. Appl. Surf. Sci. 2015, 356, 639–644. [Google Scholar] [CrossRef]
- He, C.; Hu, X.; Li, S.; et al. Development of durable and multifunctional superhydrophobic ceramic/fluoropolymer coatings by one-step thermal spraying methodology [J]. Surf. Interfaces 2025, 74. [Google Scholar] [CrossRef]
- Kavya, G.; Lakshmi, R. V.; Chakradhar, R. P. S.; et al. Mechanically robust and durable polyurethane-based superhydrophobic coating containing silica nanoparticles derived from hydrothermal assisted sol–gel method [J]. Appl. Surf. Sci. 2025, 682. [Google Scholar] [CrossRef]
- Yao, X.; Zhao, W.; Zhang, H.; et al. Performance study of a superhydrophobic nanocellulose membrane on the surface of a wood-based panel prepared via the sol-gel method [J]. Colloid Interface Sci. Commun. 2023, 57. [Google Scholar] [CrossRef]
- Zhang, Y.; Xiao, L.; Zhao, X.; et al. Superhydrophobic and corrosion-resistant coating on AlSi10Mg alloy via stearic acid etching and amino-modified SiO2/epoxy composite deposition [J]. Prog. Org. Coat. 2025, 208. [Google Scholar] [CrossRef]
- You, H.; Peng, Y.; Li, T.; et al. One-step etching fabrication of superhydrophobic CuO/Cu2O/CuCl hybrid films with integrated anti-corrosion, self-cleaning and long-term stability [J]. Prog. Surf. Sci. 2025, 100(2). [Google Scholar] [CrossRef]
- Jiang, W.; Li, H.; Lao, Y.; et al. Synthesis and characterization of amorphous NiCoP alloy films by magnetic assisted jet electrodeposition [J]. J. Alloys Compd. 2022, 910. [Google Scholar]
- Jiang, W.; Shen, L.; Xu, M.; et al. Mechanical properties and corrosion resistance of Ni-Co-SiC composite coatings by magnetic field-induced jet electrodeposition [J]. J. Alloys Compd. 2019, 791, 847–855. [Google Scholar] [CrossRef]
- Wang, J.; Liu, S.; Lou, G.; et al. High-performance Ni-SiC composite coatings with enhanced infrared emissivity via magnetic field-assisted jet electrodeposition [J]. Surf. Coat. Technol. 2025, 513. [Google Scholar] [CrossRef]
- Jiang, W.; Wang, F.; Li, J.; et al. Optimization of Ni-Co-MoS2 composite electrodes fabricated by magnetic field assisted jet electrodeposition based on response surface methodology [J]. Colloids Surf. A Physicochem. Eng. Asp. 2026, 737. [Google Scholar] [CrossRef]
- Ji, R.; Li, X.; Liu, Y.; et al. Efficient fabrication of Ni-Fe-MoS2 superamphiphobic microporous surface by magnetic field-assisted jet electrodeposition [J]. Tribol. Int. 2025, 210. [Google Scholar] [CrossRef]
- Xu, M.; Shen, L.; Jiang, W.; et al. Fabrication of Ni-SiC superhydrophilic surface by magnetic field-assisted scanning electrodeposition [J]. J. Alloys Compd. 2019, 799, 224–230. [Google Scholar] [CrossRef]
- Yu, Z.; Chen, Y.; Song, Y.; et al. Enhancing marine protection: Antibacterial, anti-corrosion, and wettability properties of smart coatings via magnet assisted jet electrodeposition [J]. Appl. Surf. Sci. 2025, 682. [Google Scholar] [CrossRef]
- Jiang, W.; Li, J.; Cheng, W.; et al. Fabrication of superhydrophobic self-cleaning Ni-Co-MoS2/Ni composite coating [J]. Surf. Interfaces 2023, 42. [Google Scholar] [CrossRef]
- Shen, L.; Xu, M.; Jiang, W.; et al. A novel superhydrophobic Ni/Nip coating fabricated by magnetic field induced selective scanning electrodeposition [J]. Appl. Surf. Sci. 2019, 489, 25–33. [Google Scholar] [CrossRef]
- Li, B.; Mei, T.; Chu, H.; et al. Ultrasonic-assisted electrodeposition of Ni/diamond composite coatings and its structure and electrochemical properties [J]. Ultrason. Sonochemistry 2021, 73. [Google Scholar] [CrossRef] [PubMed]
- Zhou, Z.; Ma, W.; Hong, M.; et al. Fluorine-free superhydrophobic Ni/Mn-TiO2 composite coatings on carbon steel via one-step electrodeposition for enhanced durability and corrosion resistance [J]. Ceram. Int. 2024, 50(24), 53922–53932. [Google Scholar] [CrossRef]
- Melle, S.; Calderón, O. G.; Fuller, G. G.; et al. Polarizable Particle Aggregation Under Rotating Magnetic Fields Using Scattering Dichroism [J]. J. Colloid Interface Sci. 2002, 247(1), 200–209. [Google Scholar] [CrossRef] [PubMed]
- Zhou, S.; Wang, Y.; Zheng, X.; et al. Study on capture behaviors of particles with different magnetic characteristics in axial high gradient magnetic separation coupling with magnetic fluid [J]. Miner. Eng. 2025, 227. [Google Scholar] [CrossRef]
- Furlani, E. P.; Sahoo, Y. Analytical model for the magnetic field and force in a magnetophoretic microsystem [J]. J. Phys. D. Appl. Phys. 2006, 39(9), 1724. [Google Scholar] [CrossRef]
- Cichomski, M.; Borkowska, E.; Prowizor, M.; et al. The Effect of Physicochemical Properties of Perfluoroalkylsilanes Solutions on Microtribological Features of Created Self-Assembled Monolayers [J]. Materials 2020, 13(15), 3357. [Google Scholar] [CrossRef] [PubMed]
- Holewinski, A.; Linic, S. Elementary Mechanisms in Electrocatalysis: Revisiting the ORR Tafel Slope [J]. J. Electrochem. Soc. 2012, 159(11), H864–H870. [Google Scholar] [CrossRef]
- Zhou, H.; Yan, S.; He, Y.; et al. Preparation of a superhydrophobic Ni/SH-SiO2 coating by one-step electrodeposition and an analysis of its anti-corrosion performance [J]. Colloids Surf. A Physicochem. Eng. Asp. 2023, 676. [Google Scholar] [CrossRef]
- Yan, M.; Ren, L.; Liu, L.; et al. Study on the mechanism of corrosion passivation of Ni-W-P-PTFE coatings in a dynamic chloride environment based on the Point Defect Model (PDM) [J]. Colloids Surf. A Physicochem. Eng. Asp. 2026, 737. [Google Scholar] [CrossRef]
- Bagheri, H.; Aliofkhazraei, M.; Forooshani, H. M.; et al. Facile fabrication of uniform hierarchical structured (UHS) nanocomposite surface with high water repellency and self-cleaning properties [J]. Appl. Surf. Sci. 2018, 436, 1134–1146. [Google Scholar] [CrossRef]
- Do, Q.; An, H.; Wang, G.; et al. Effect of cupric sulfate on the microstructure and corrosion behavior of nickel-copper nanostructure coatings synthesized by pulsed electrodeposition technique [J]. Corros. Sci. 2019, 147, 246–259. [Google Scholar] [CrossRef]
Figure 1.
Magnetic field-assisted jet electrodeposition apparatus: (a) schematic diagram of the apparatus configuration; (b) schematic illustration of the deposition process.
Figure 1.
Magnetic field-assisted jet electrodeposition apparatus: (a) schematic diagram of the apparatus configuration; (b) schematic illustration of the deposition process.
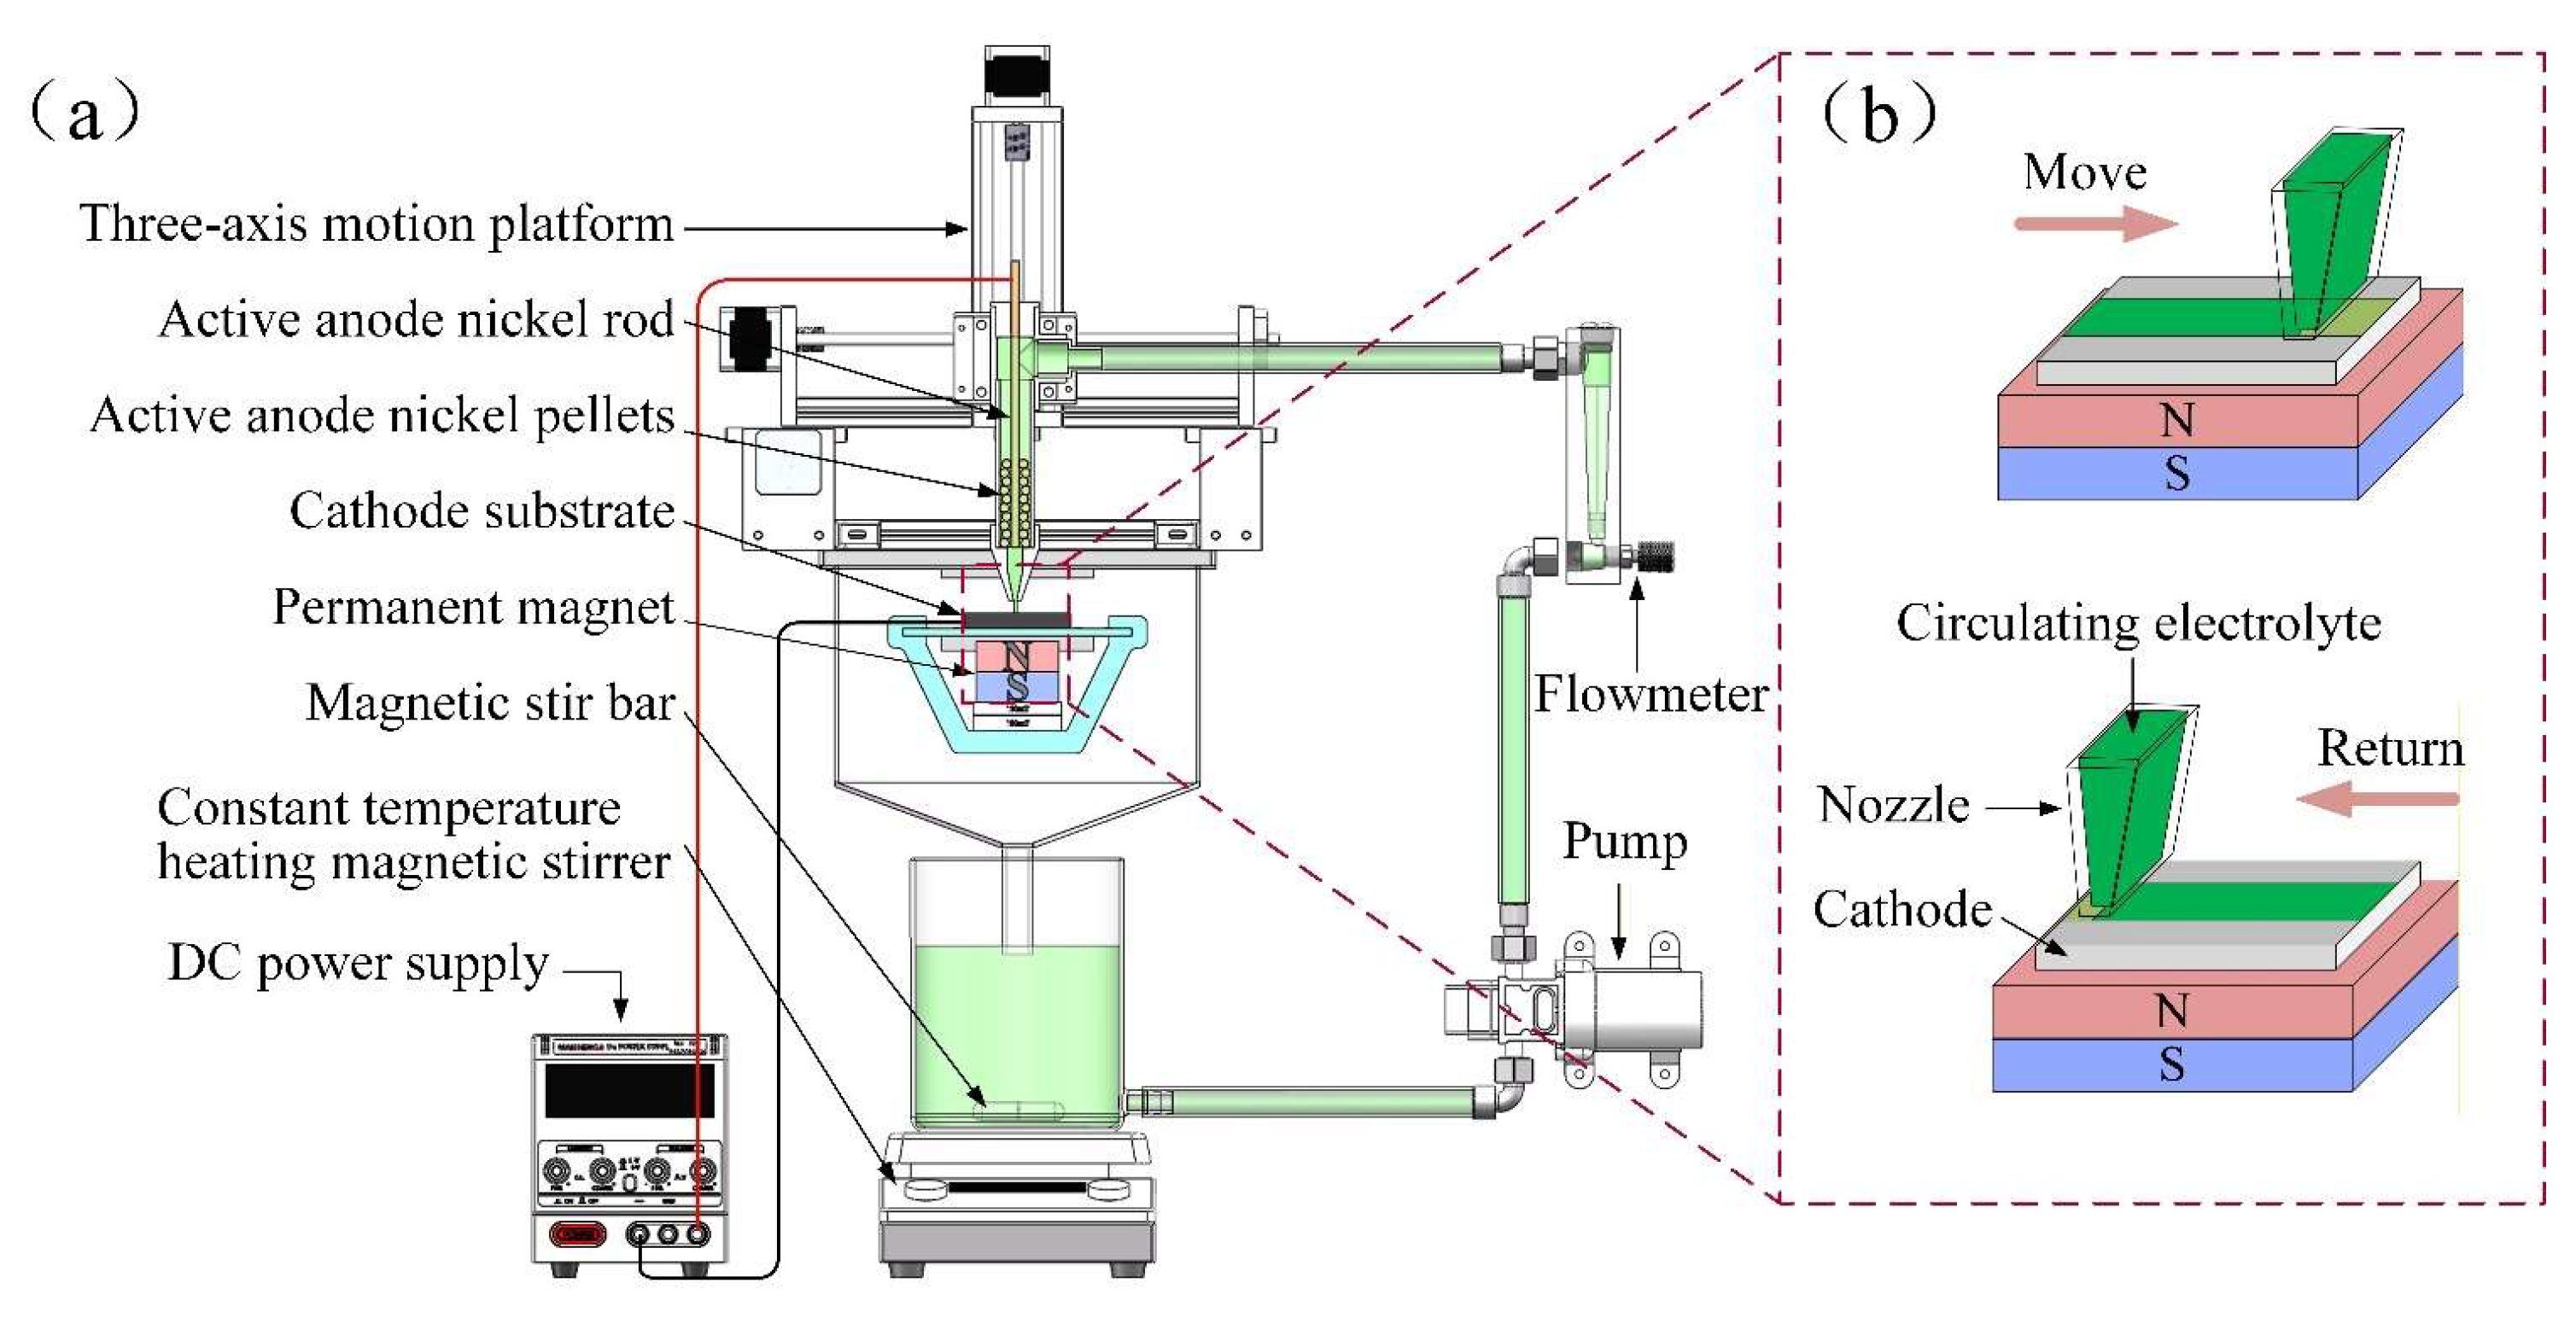
Figure 2.
Preparation flowchart: (a) reagent preparation; (b) sample preparation procedure.
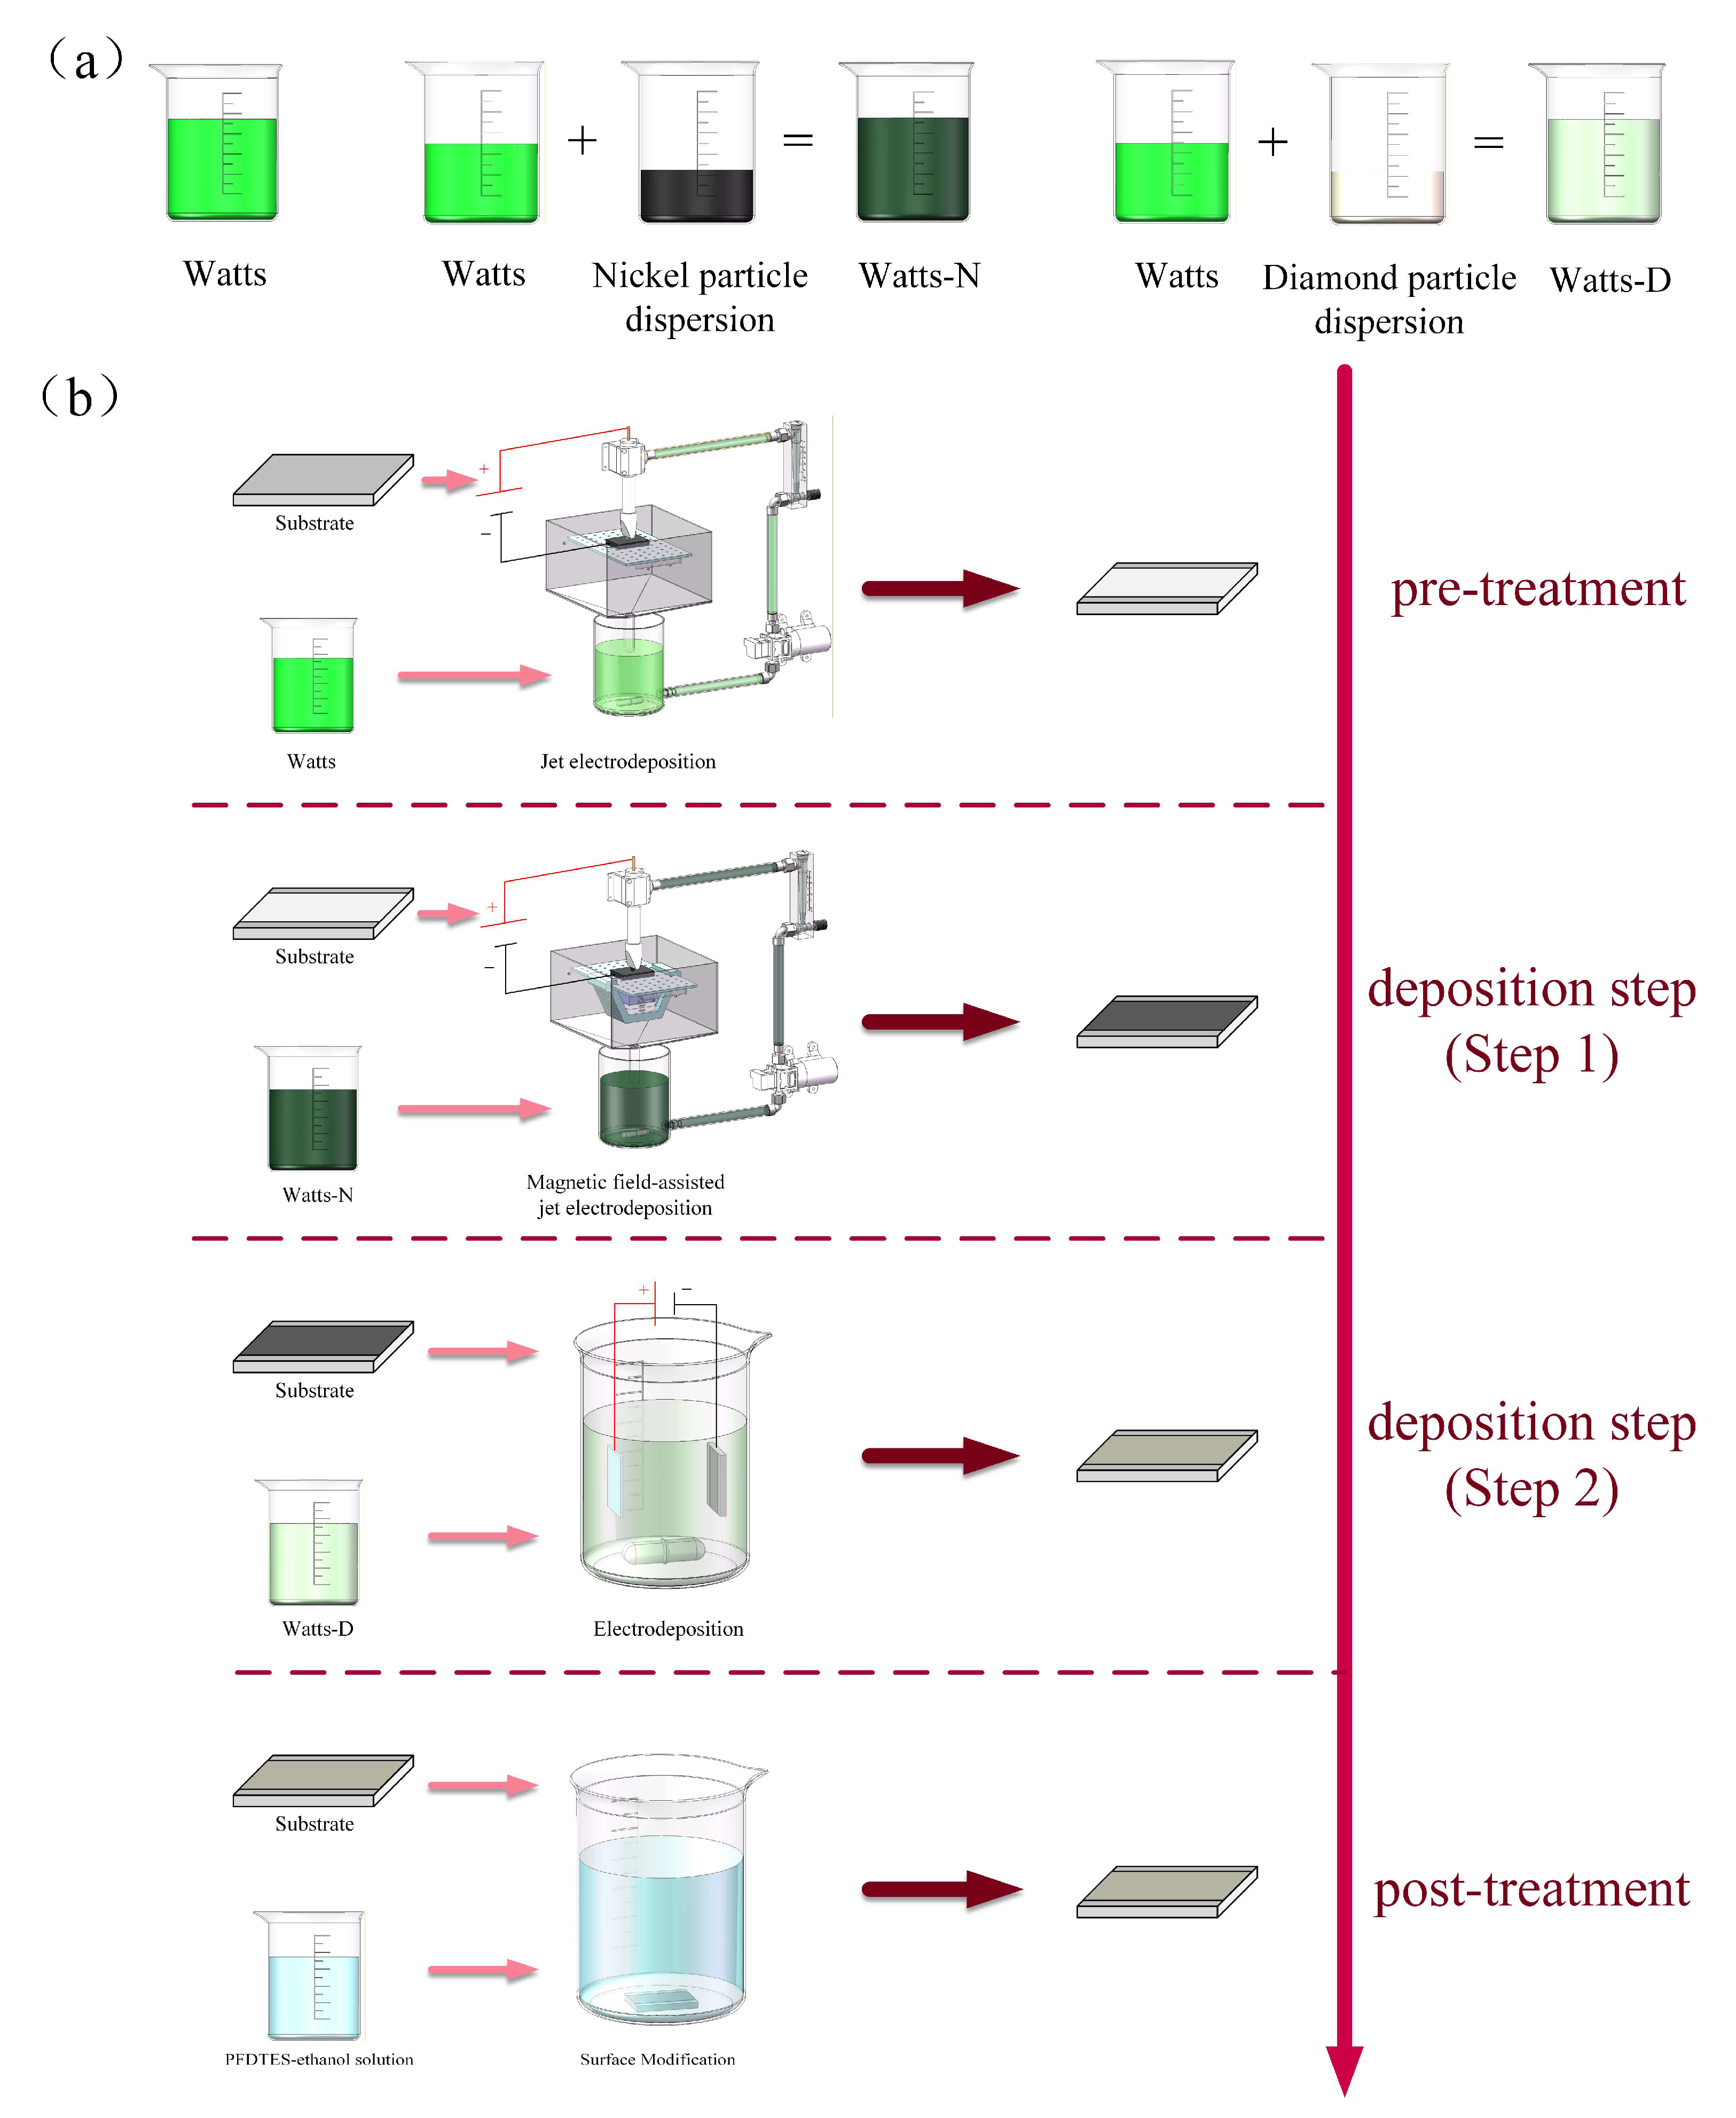
Figure 3.
SEM images and corresponding EDS elemental mappings of coatings deposited with different nickel particle sizes at 150 mT: (a, b) 0.2N-150; (c, d) 2N-150; (e, f) 20N-150.
Figure 3.
SEM images and corresponding EDS elemental mappings of coatings deposited with different nickel particle sizes at 150 mT: (a, b) 0.2N-150; (c, d) 2N-150; (e, f) 20N-150.
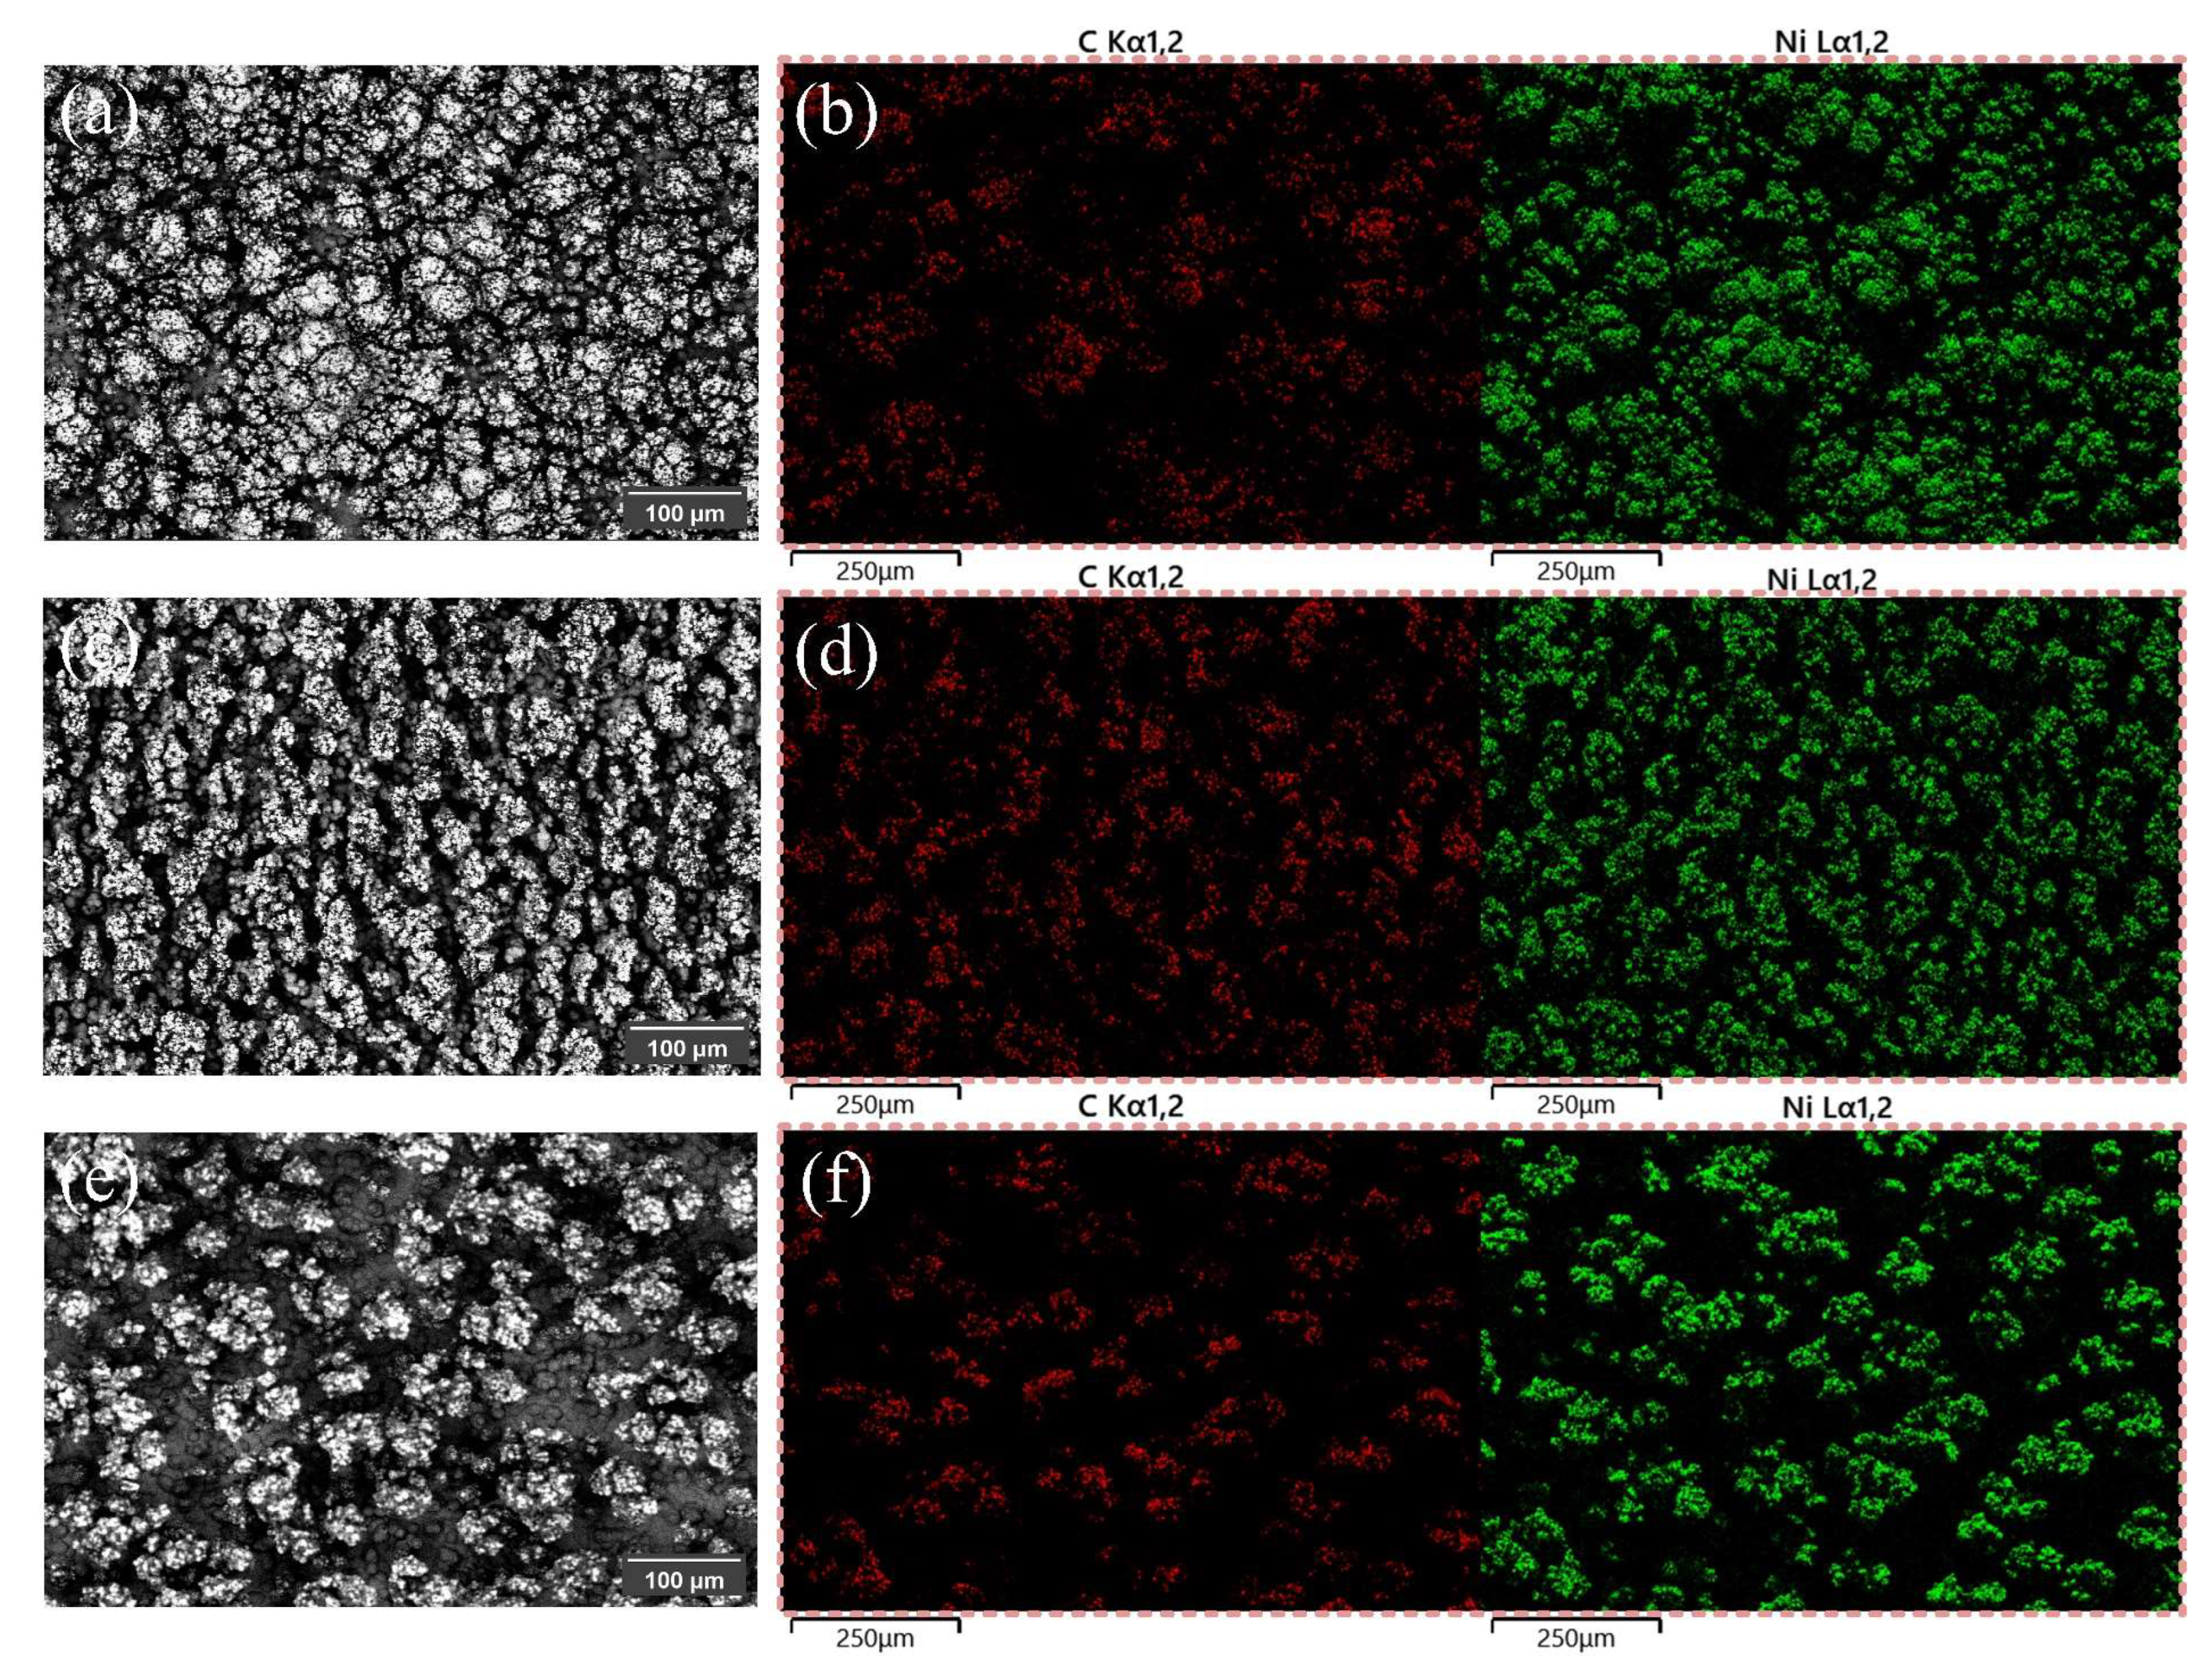
Figure 4.
Cross-sectional morphologies and elemental distributions of coatings with different nickel particle diameters at a magnetic field intensity of 150 mT: (a–c) 0.2N-150 at ×50 magnification, ×500 magnification, and corresponding EDS mapping; (d–f) 2N-150 at ×50 magnification, ×500 magnification, and corresponding EDS mapping; (g–i) 20N-150 at ×50 magnification, ×150 magnification, and corresponding EDS mapping.
Figure 4.
Cross-sectional morphologies and elemental distributions of coatings with different nickel particle diameters at a magnetic field intensity of 150 mT: (a–c) 0.2N-150 at ×50 magnification, ×500 magnification, and corresponding EDS mapping; (d–f) 2N-150 at ×50 magnification, ×500 magnification, and corresponding EDS mapping; (g–i) 20N-150 at ×50 magnification, ×150 magnification, and corresponding EDS mapping.
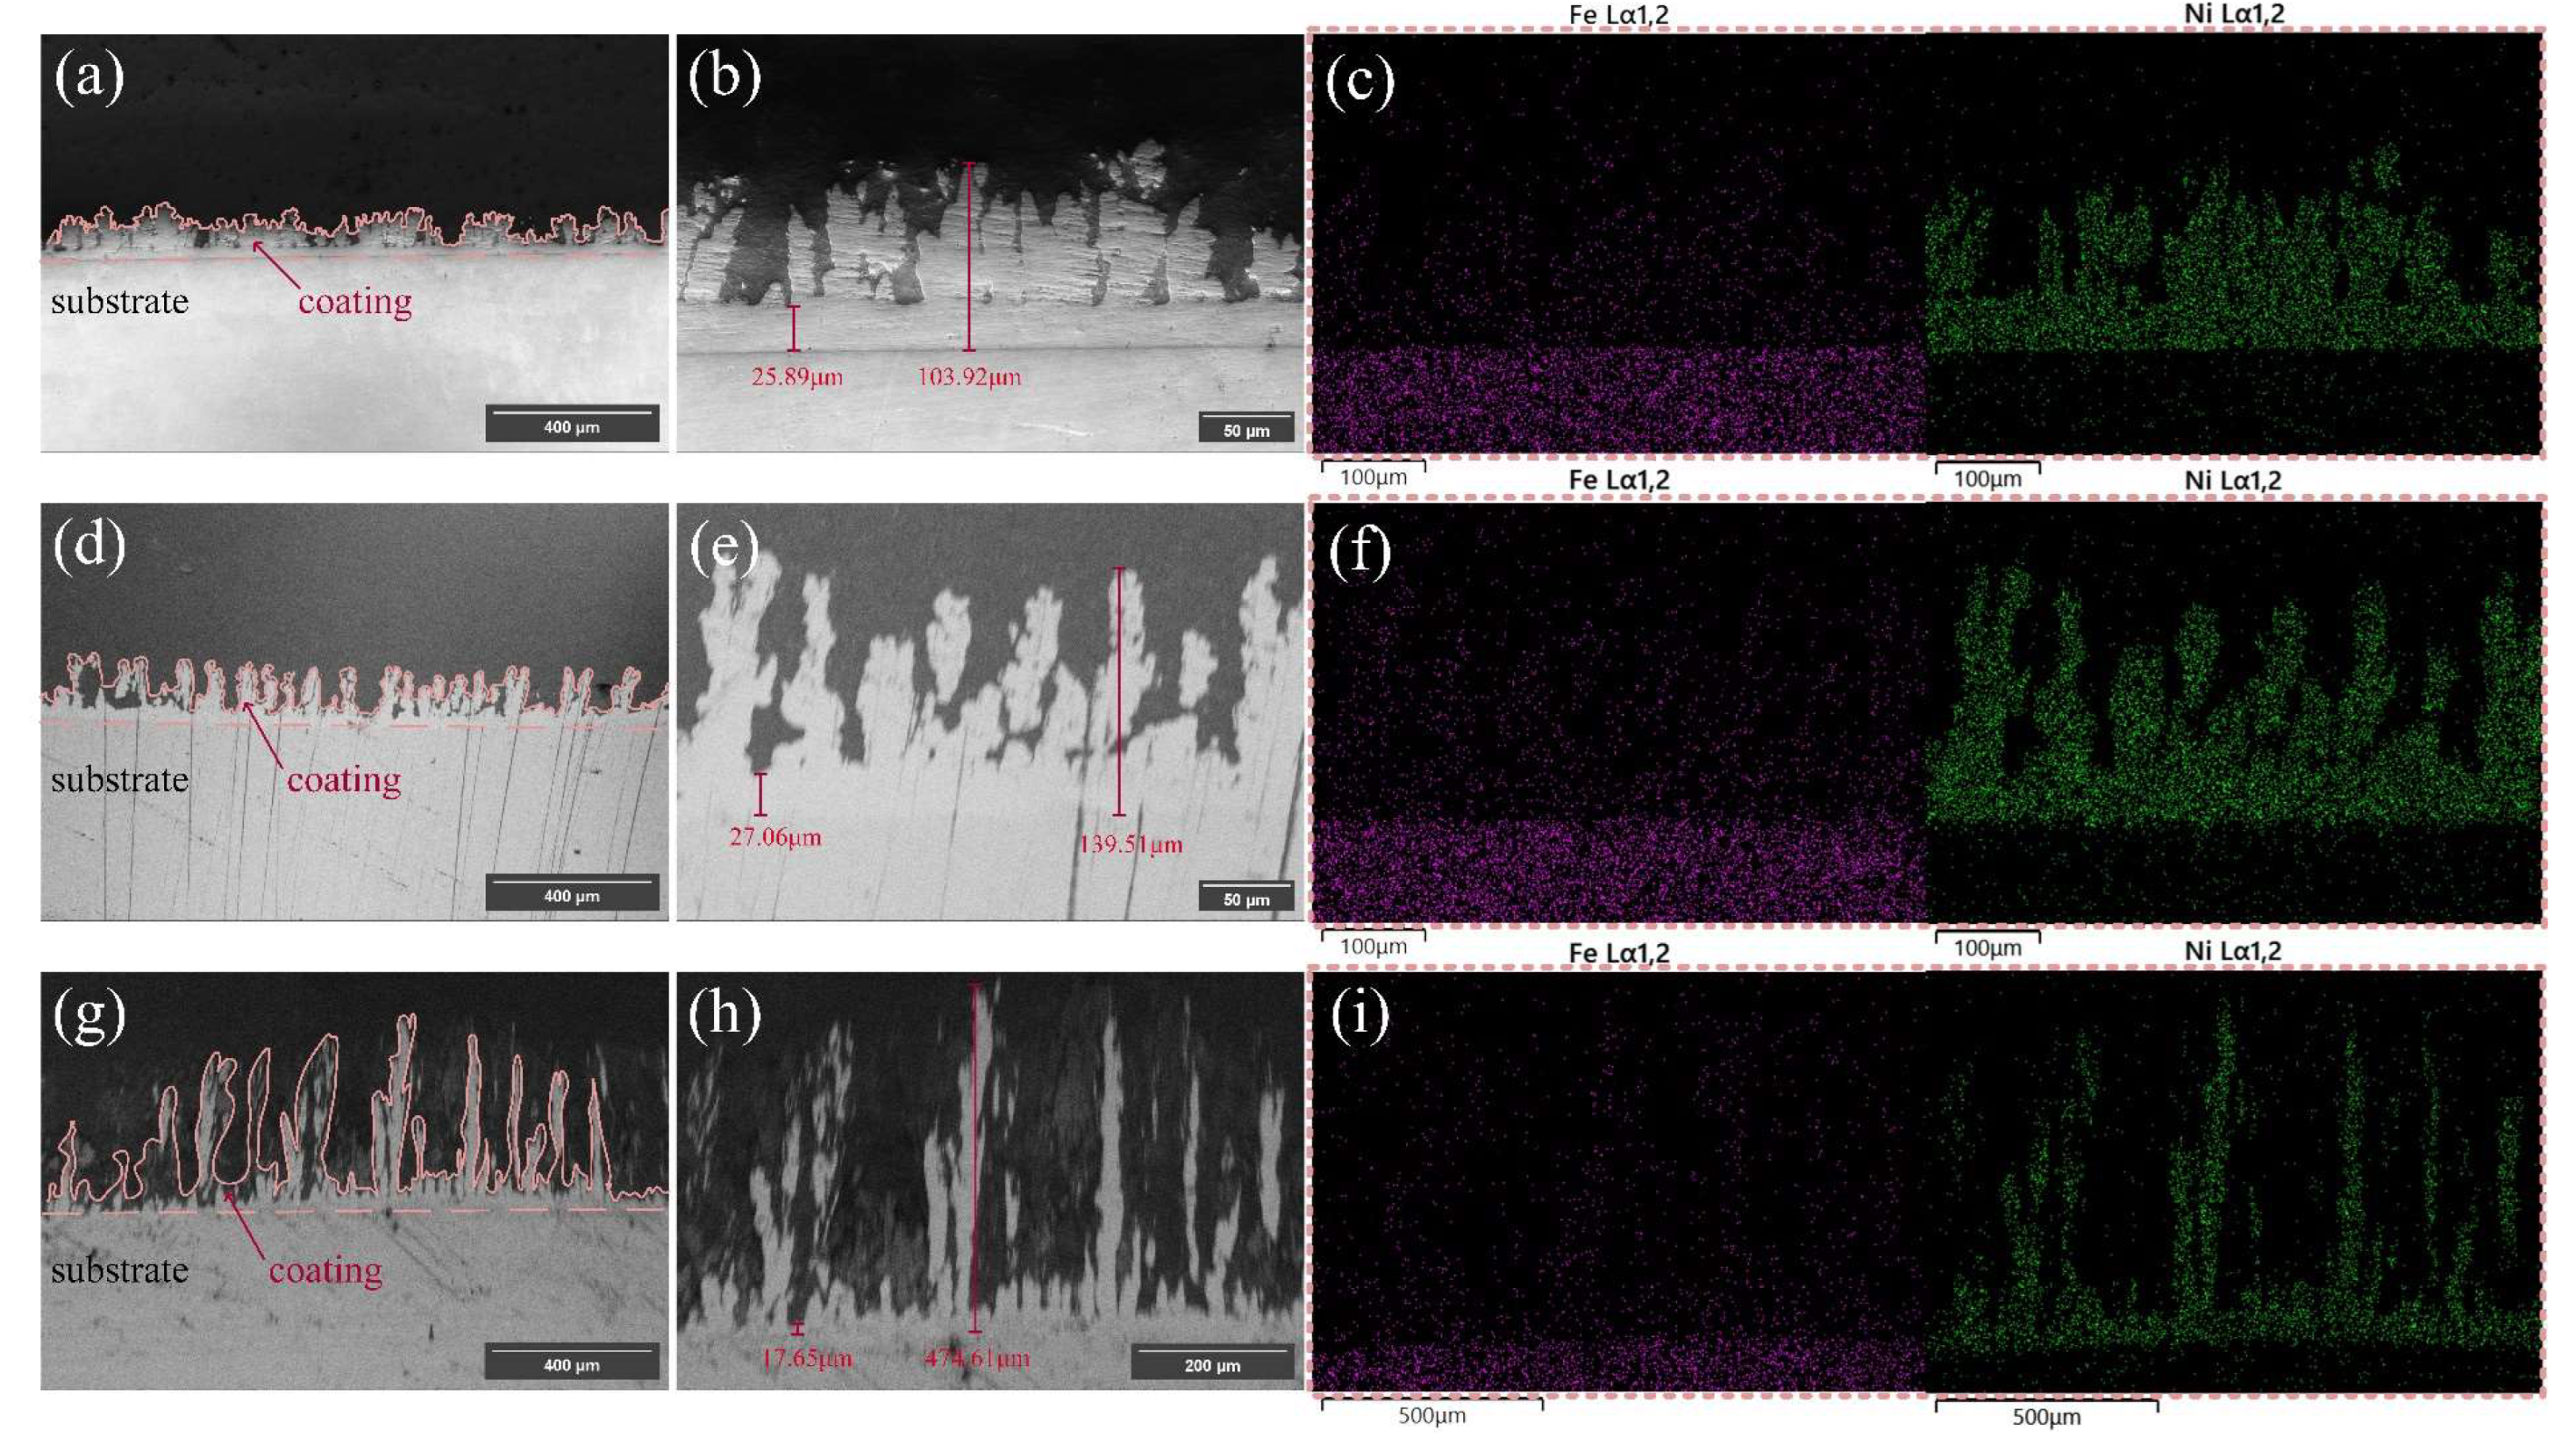
Figure 5.
Surface morphologies and elemental distributions of coatings deposited with 2 μm nickel particles under varying magnetic field intensities: (a, d) 2N-50; (b, e) 2N-100; (c, f) 2N-150 (with SEM images and corresponding EDS mappings for each sample).
Figure 5.
Surface morphologies and elemental distributions of coatings deposited with 2 μm nickel particles under varying magnetic field intensities: (a, d) 2N-50; (b, e) 2N-100; (c, f) 2N-150 (with SEM images and corresponding EDS mappings for each sample).
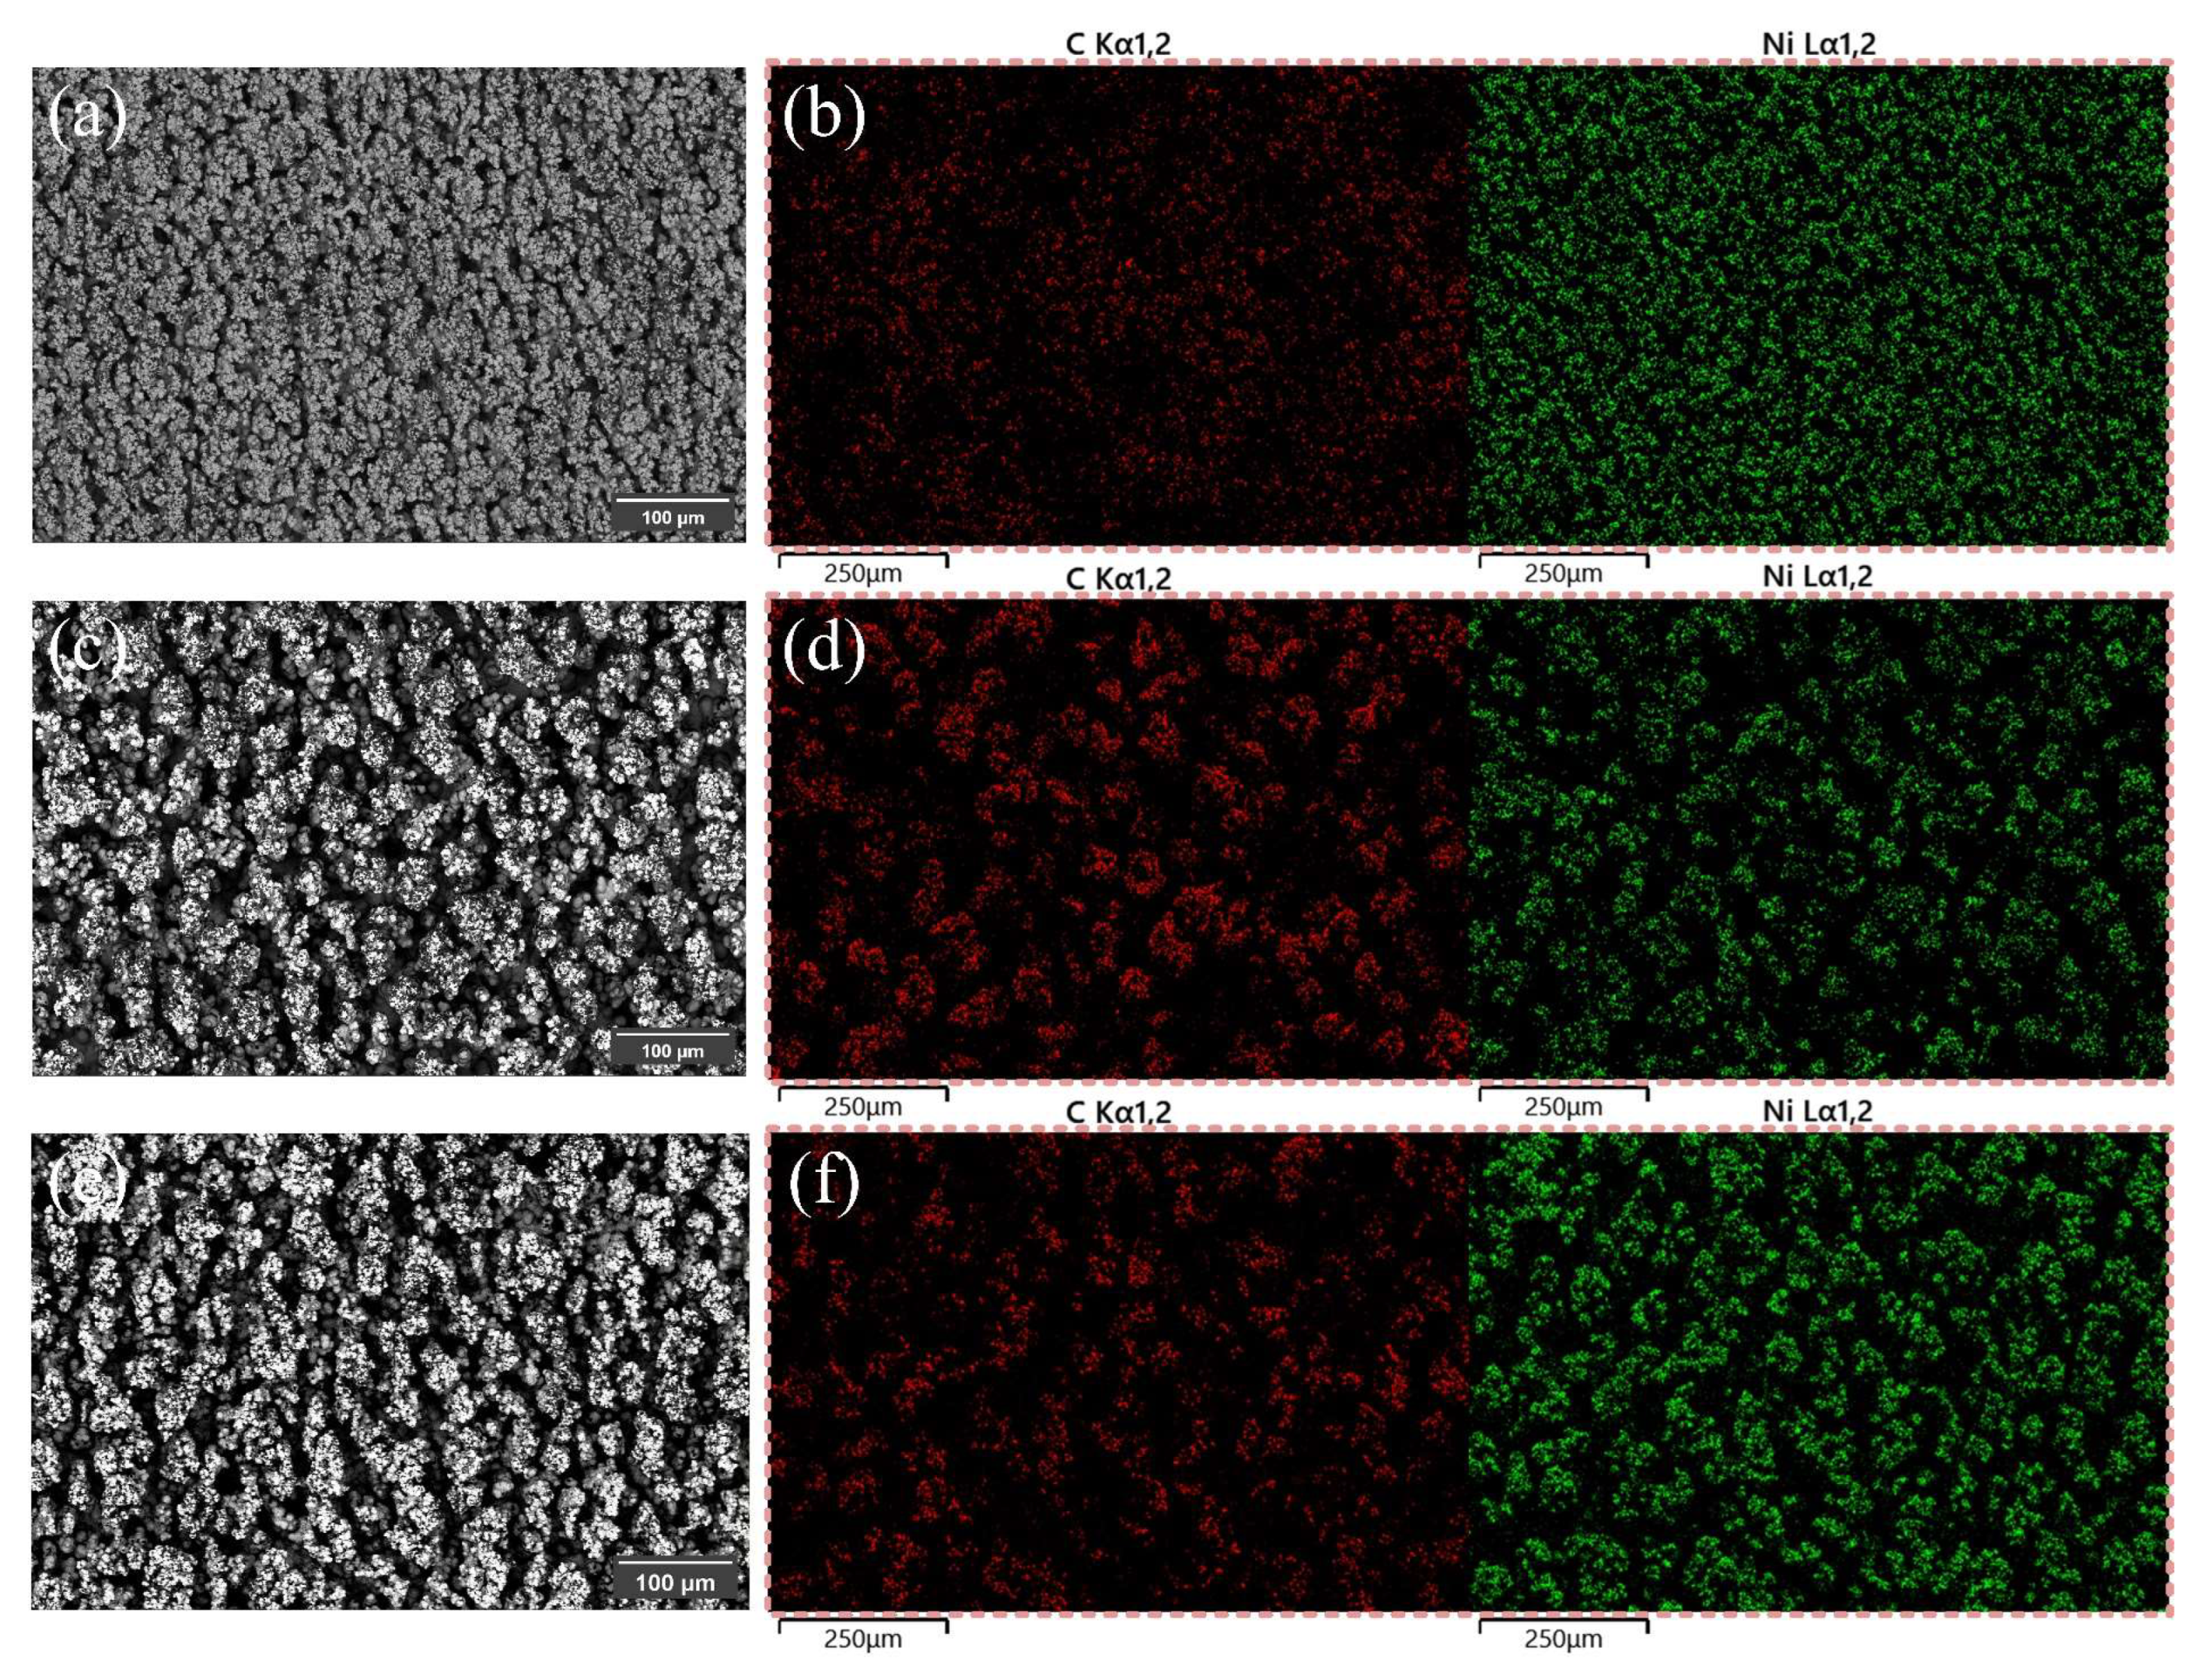
Figure 6.
Cross-sectional SEM images and EDS mappings of coatings deposited with 2 μm nickel particles under different magnetic field intensities: (a–c) 2N-50; (d–f) 2N-100; (g–i) 2N-150 (with ×50, ×500 magnifications, and EDS mapping for each sample).
Figure 6.
Cross-sectional SEM images and EDS mappings of coatings deposited with 2 μm nickel particles under different magnetic field intensities: (a–c) 2N-50; (d–f) 2N-100; (g–i) 2N-150 (with ×50, ×500 magnifications, and EDS mapping for each sample).
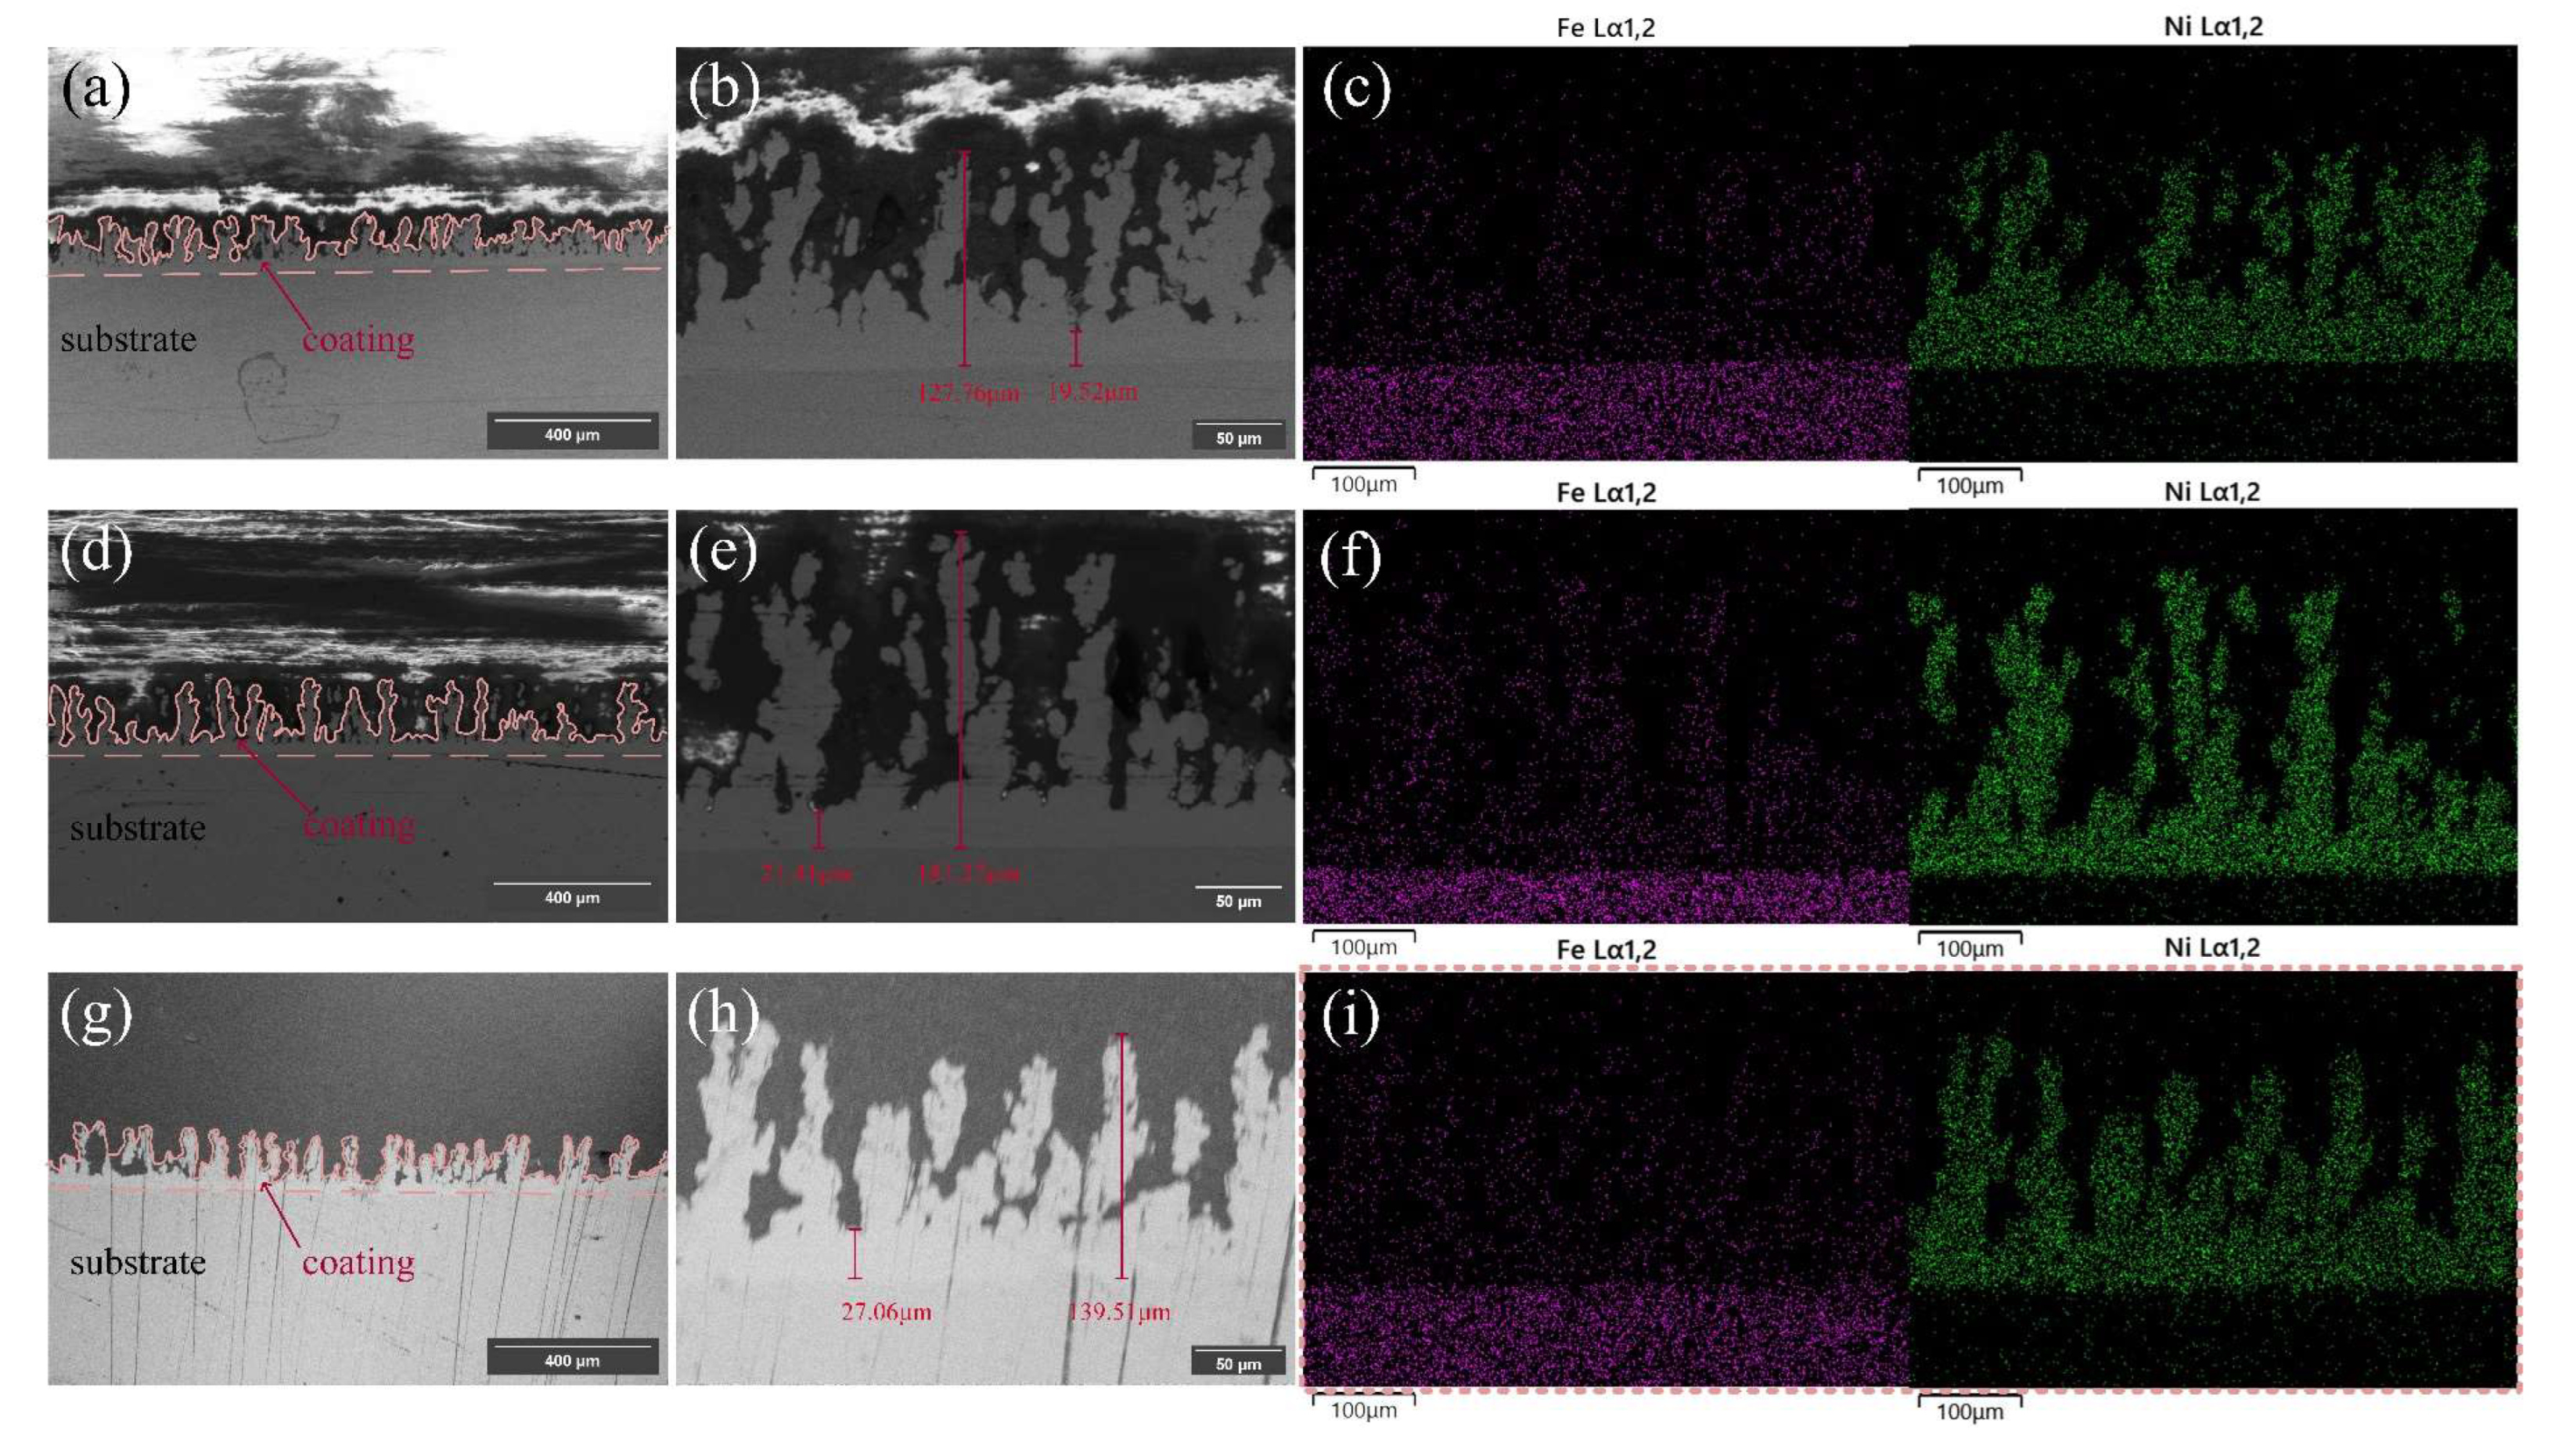
Figure 7.
High-magnification SEM images and EDS mappings of samples prepared under different parameters: (a–c) 0.2N-150; (d–f) 2N-150; (g–i) 20N-150; (j–l) 2N-50; (m–o) 2N-100 (at ×500 and ×2000 magnifications for each sample).
Figure 7.
High-magnification SEM images and EDS mappings of samples prepared under different parameters: (a–c) 0.2N-150; (d–f) 2N-150; (g–i) 20N-150; (j–l) 2N-50; (m–o) 2N-100 (at ×500 and ×2000 magnifications for each sample).
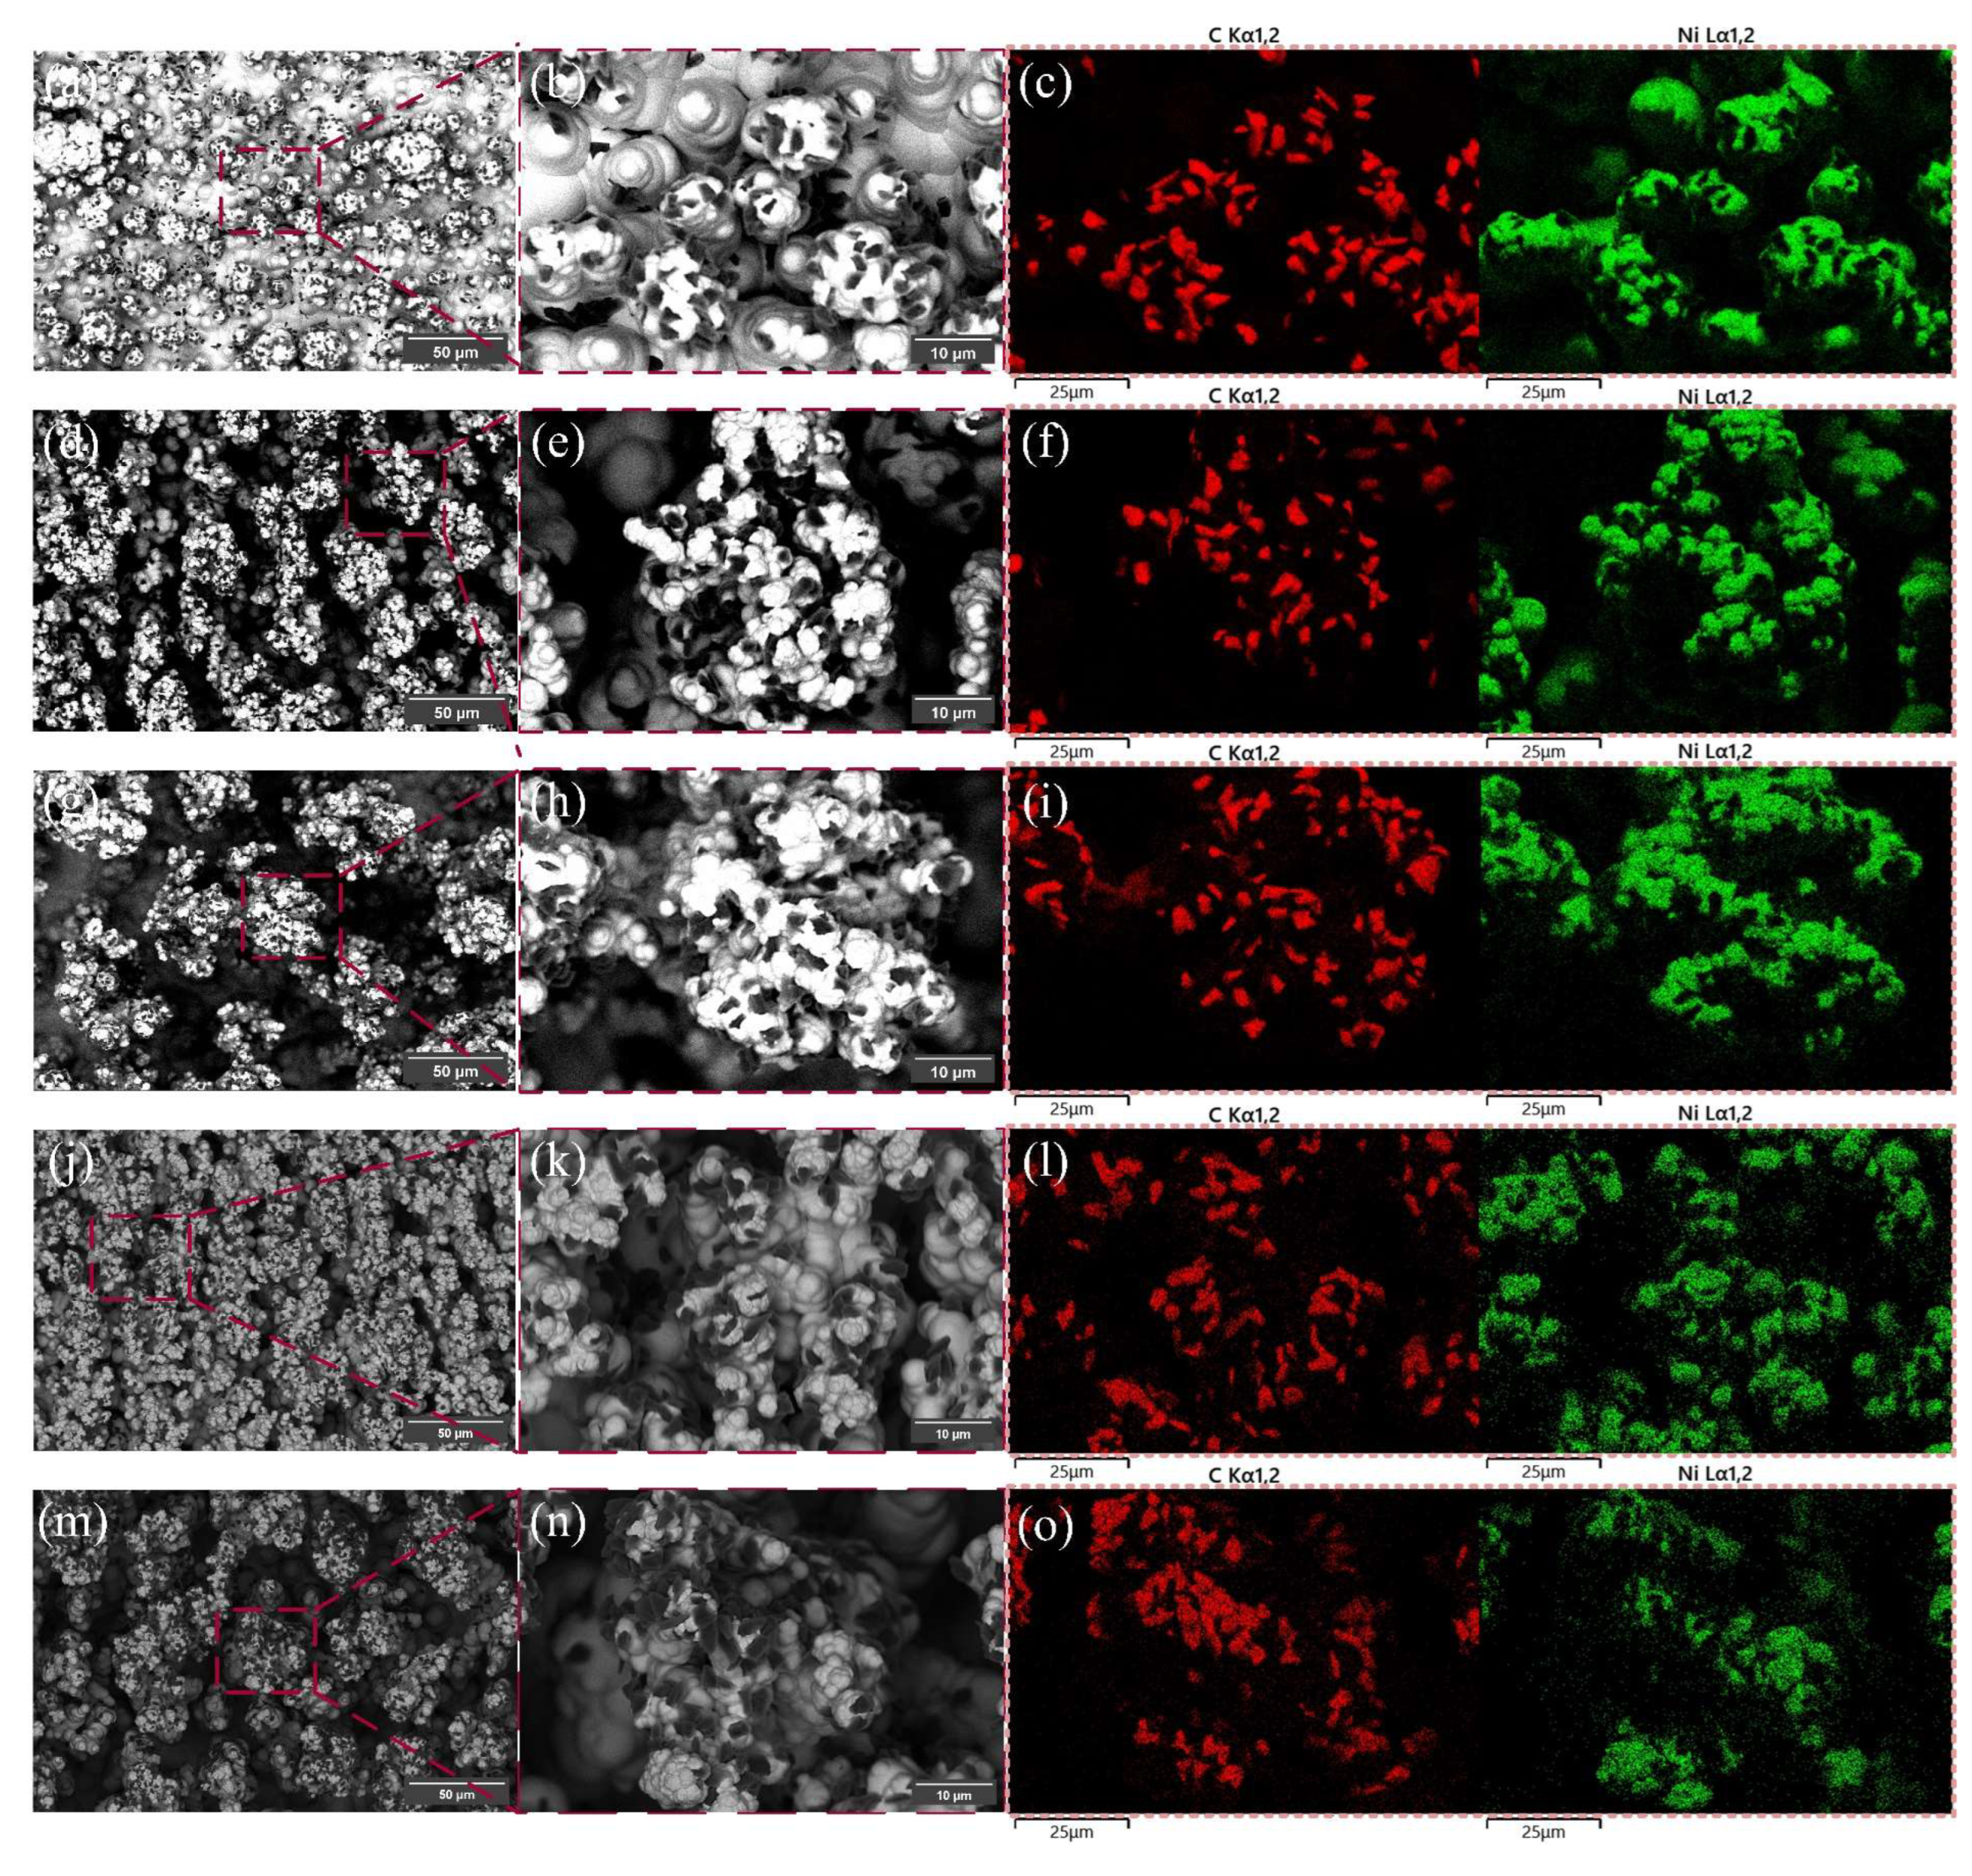
Figure 8.
SEM surface morphologies of the control samples at ×200 and ×500 magnifications: (a, b) 2N-150; (c, d) C1; (e, f) C3; (g, h) C4.
Figure 8.
SEM surface morphologies of the control samples at ×200 and ×500 magnifications: (a, b) 2N-150; (c, d) C1; (e, f) C3; (g, h) C4.
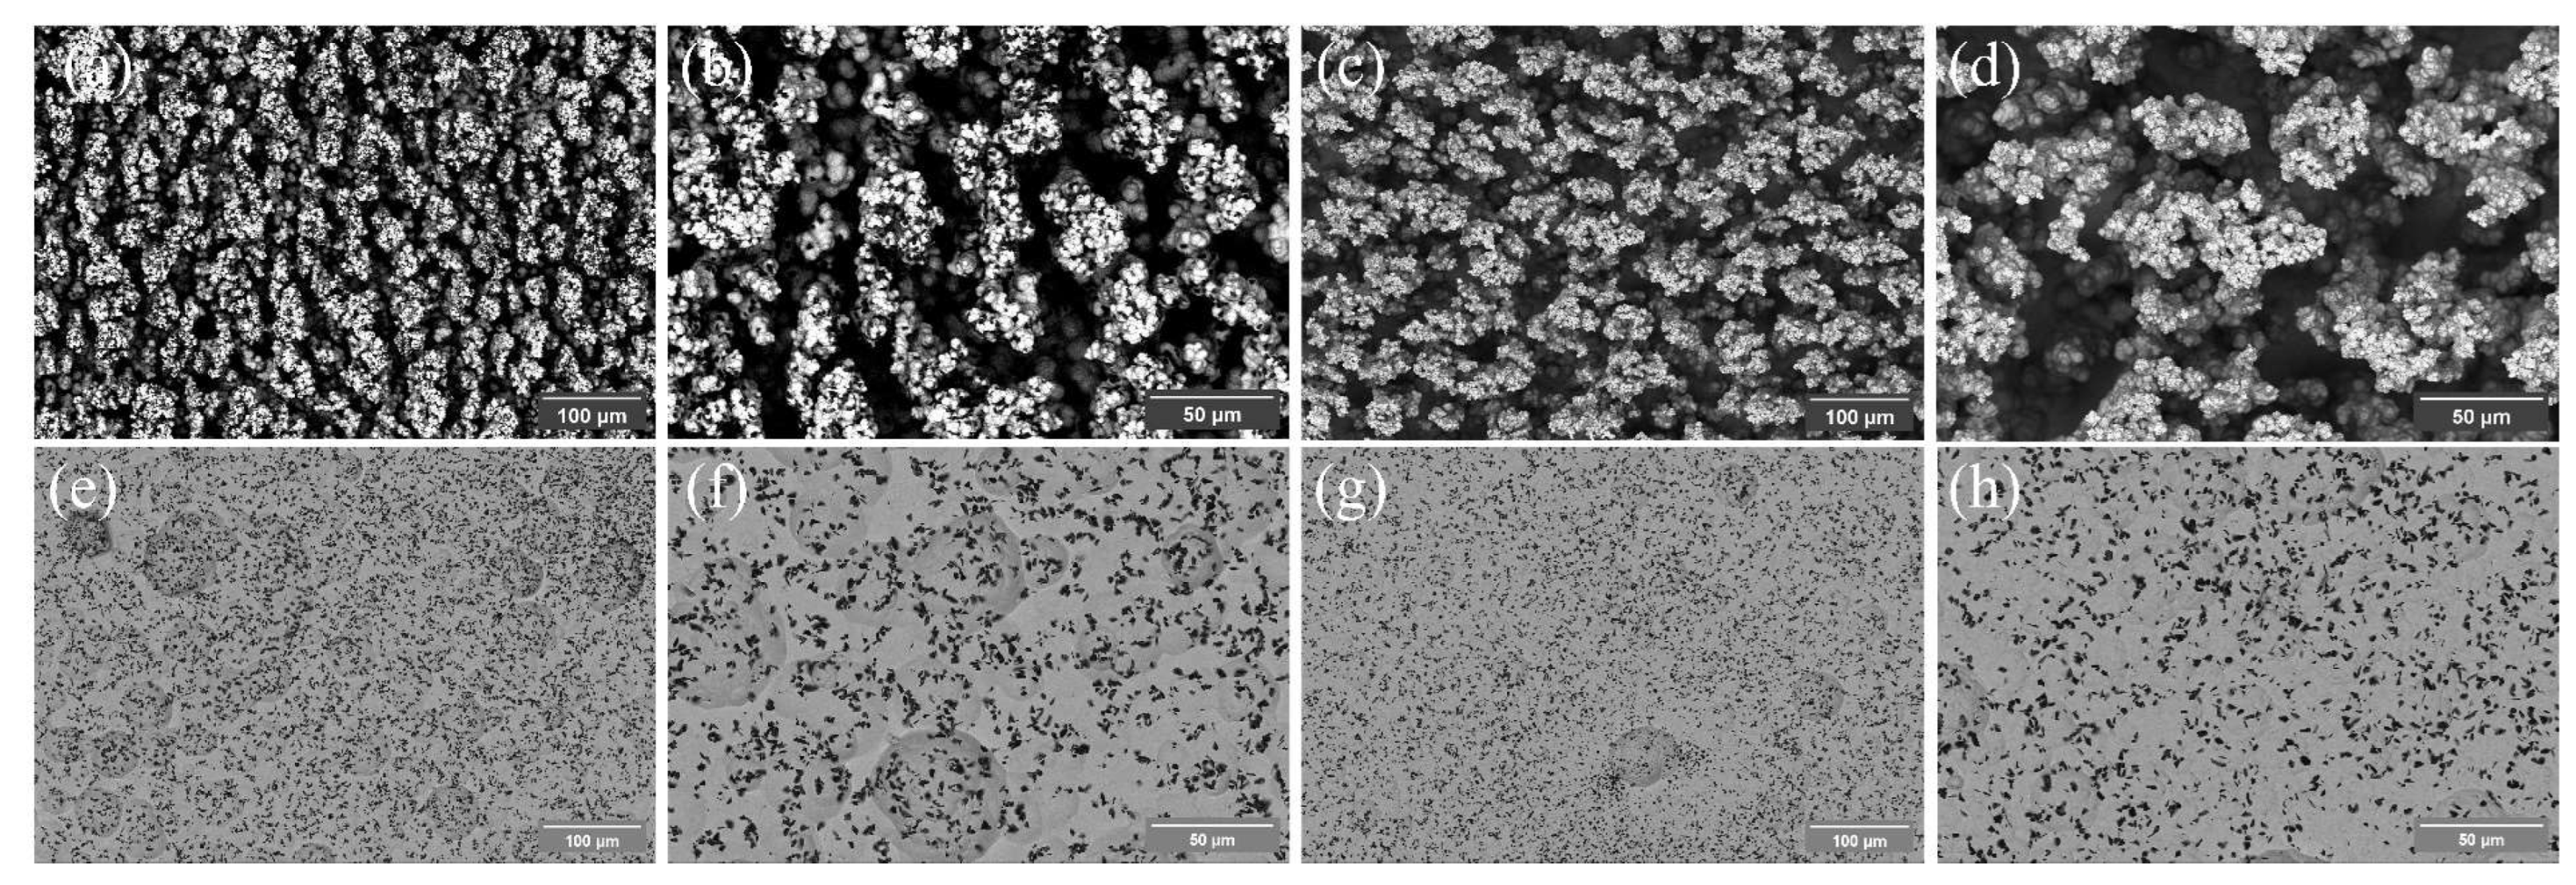
Figure 9.
High-magnification SEM images and EDS elemental mappings of the control samples: (a, b) 2N-150; (c, d) C1; (e, f) C3; (g, h) C4.
Figure 9.
High-magnification SEM images and EDS elemental mappings of the control samples: (a, b) 2N-150; (c, d) C1; (e, f) C3; (g, h) C4.
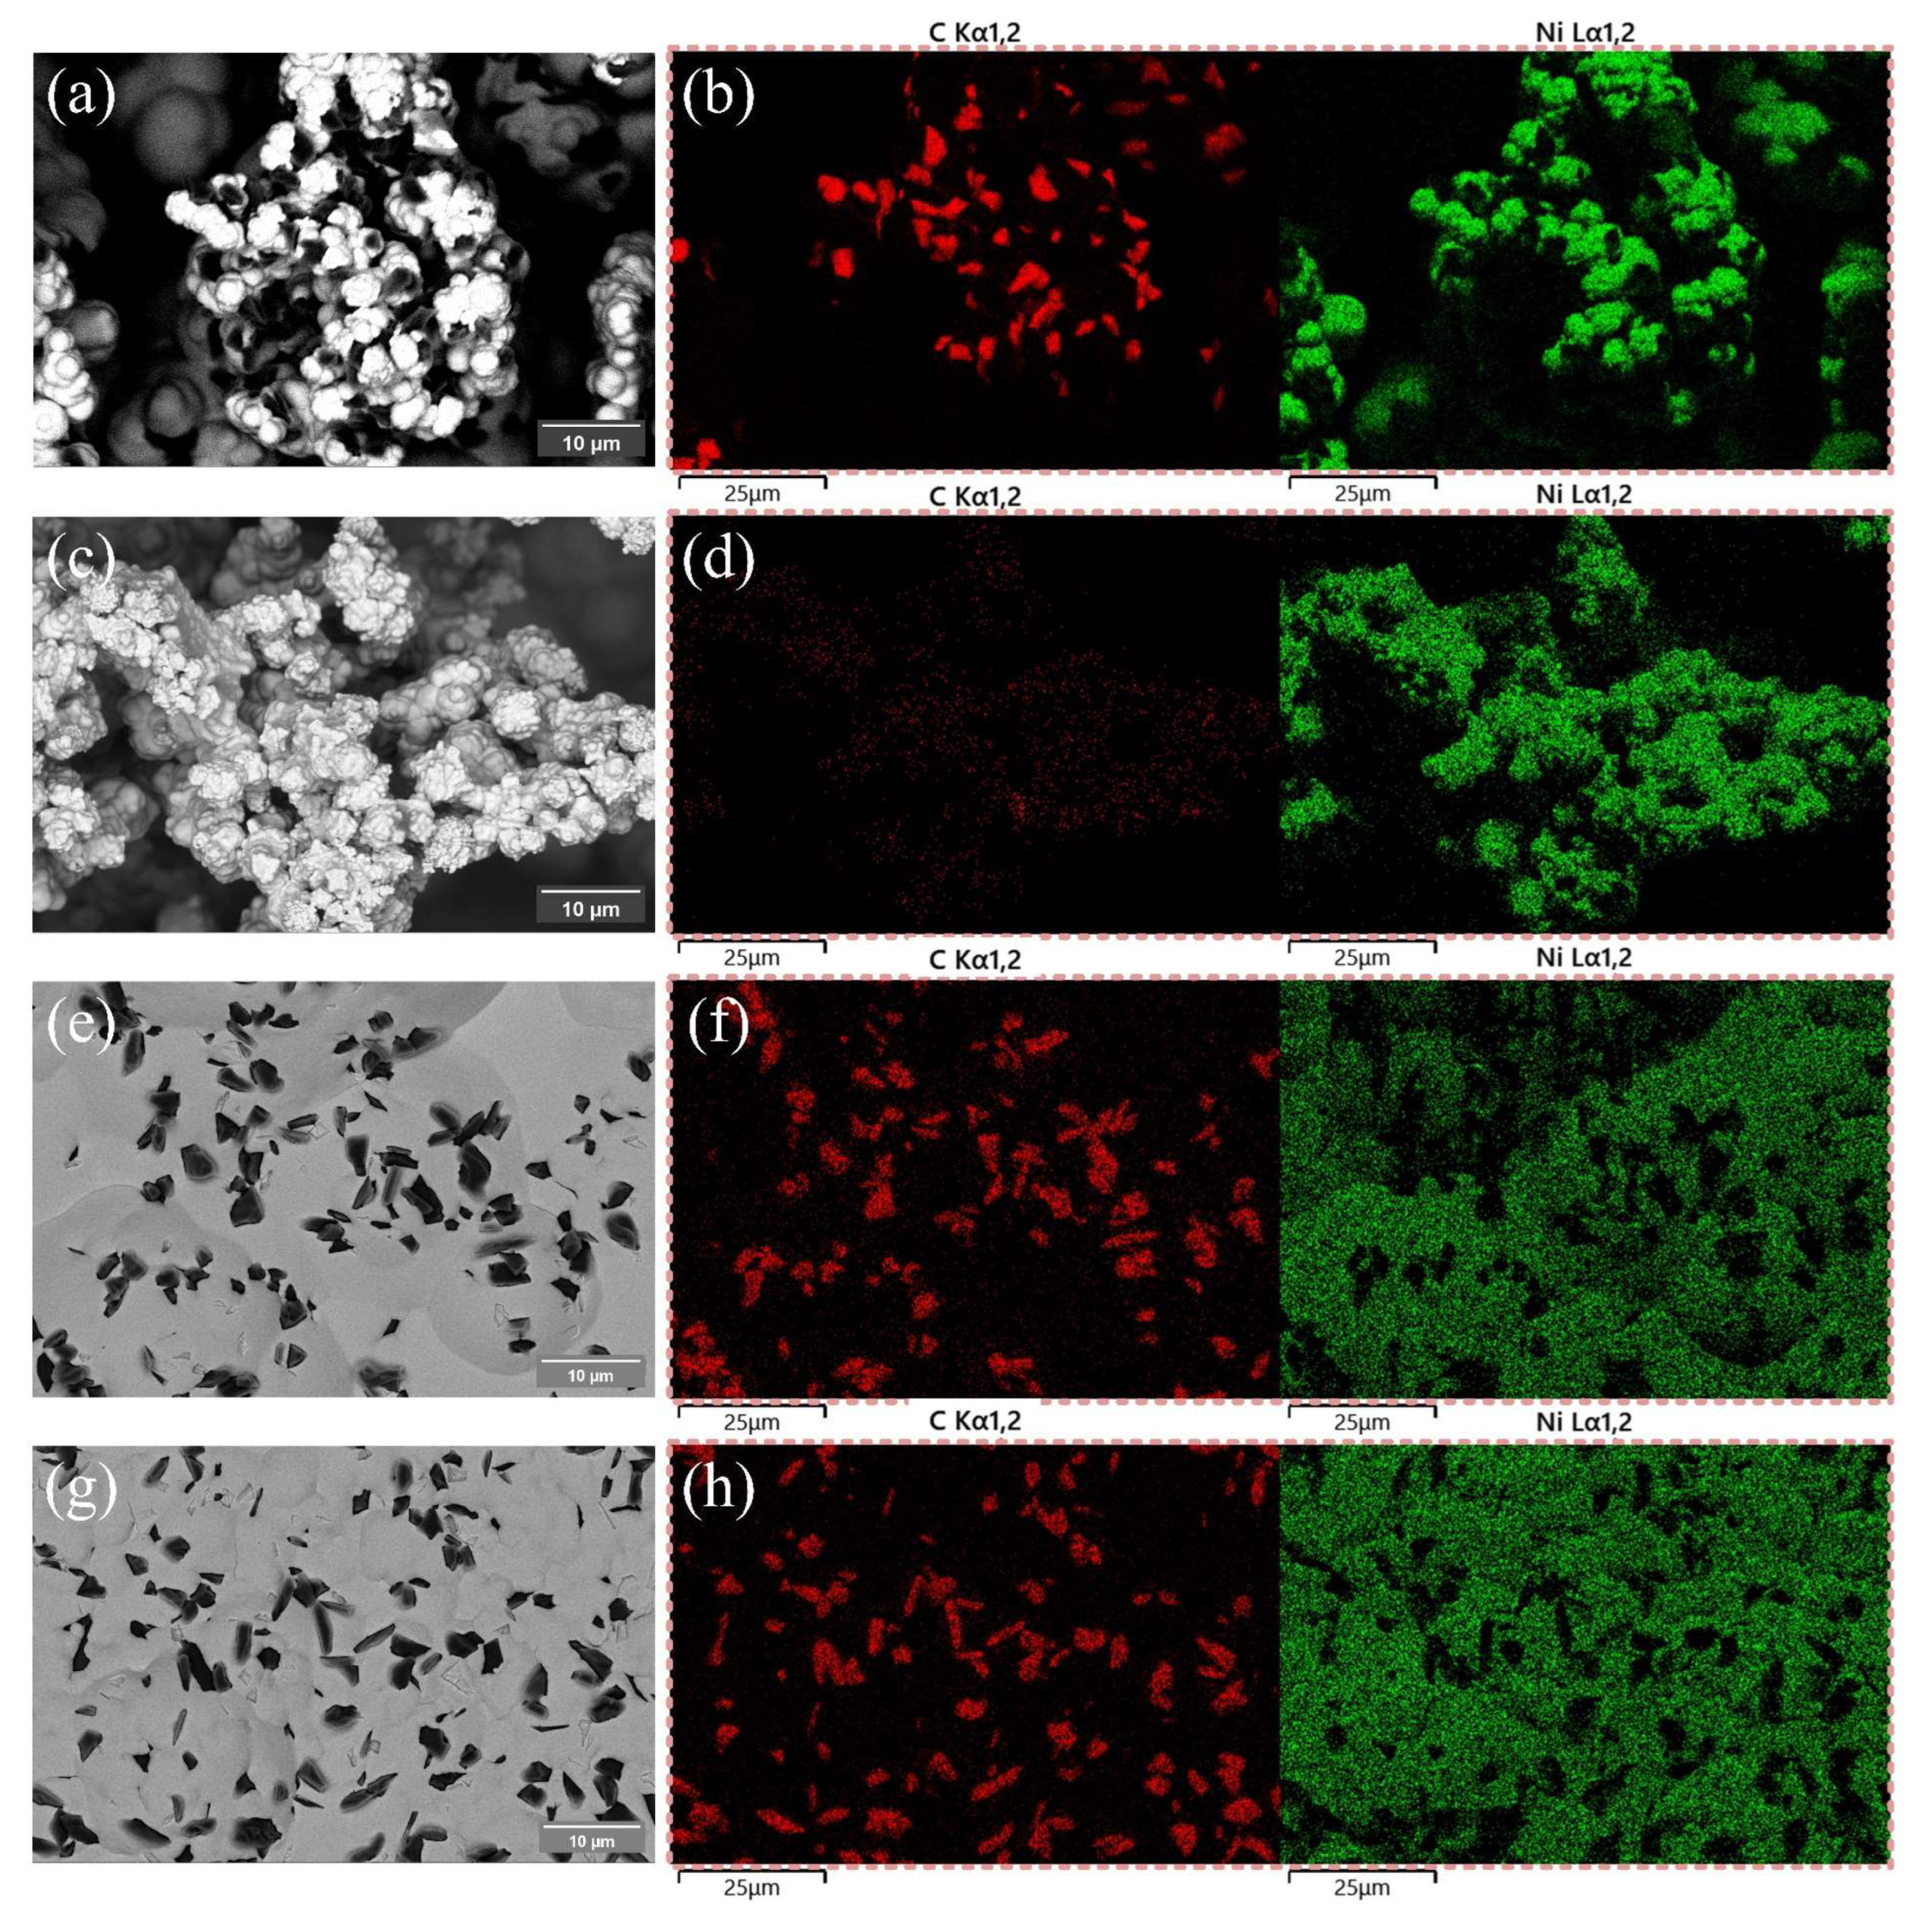
Figure 10.
(a) Static water contact angles and (b) sliding angles of the samples.
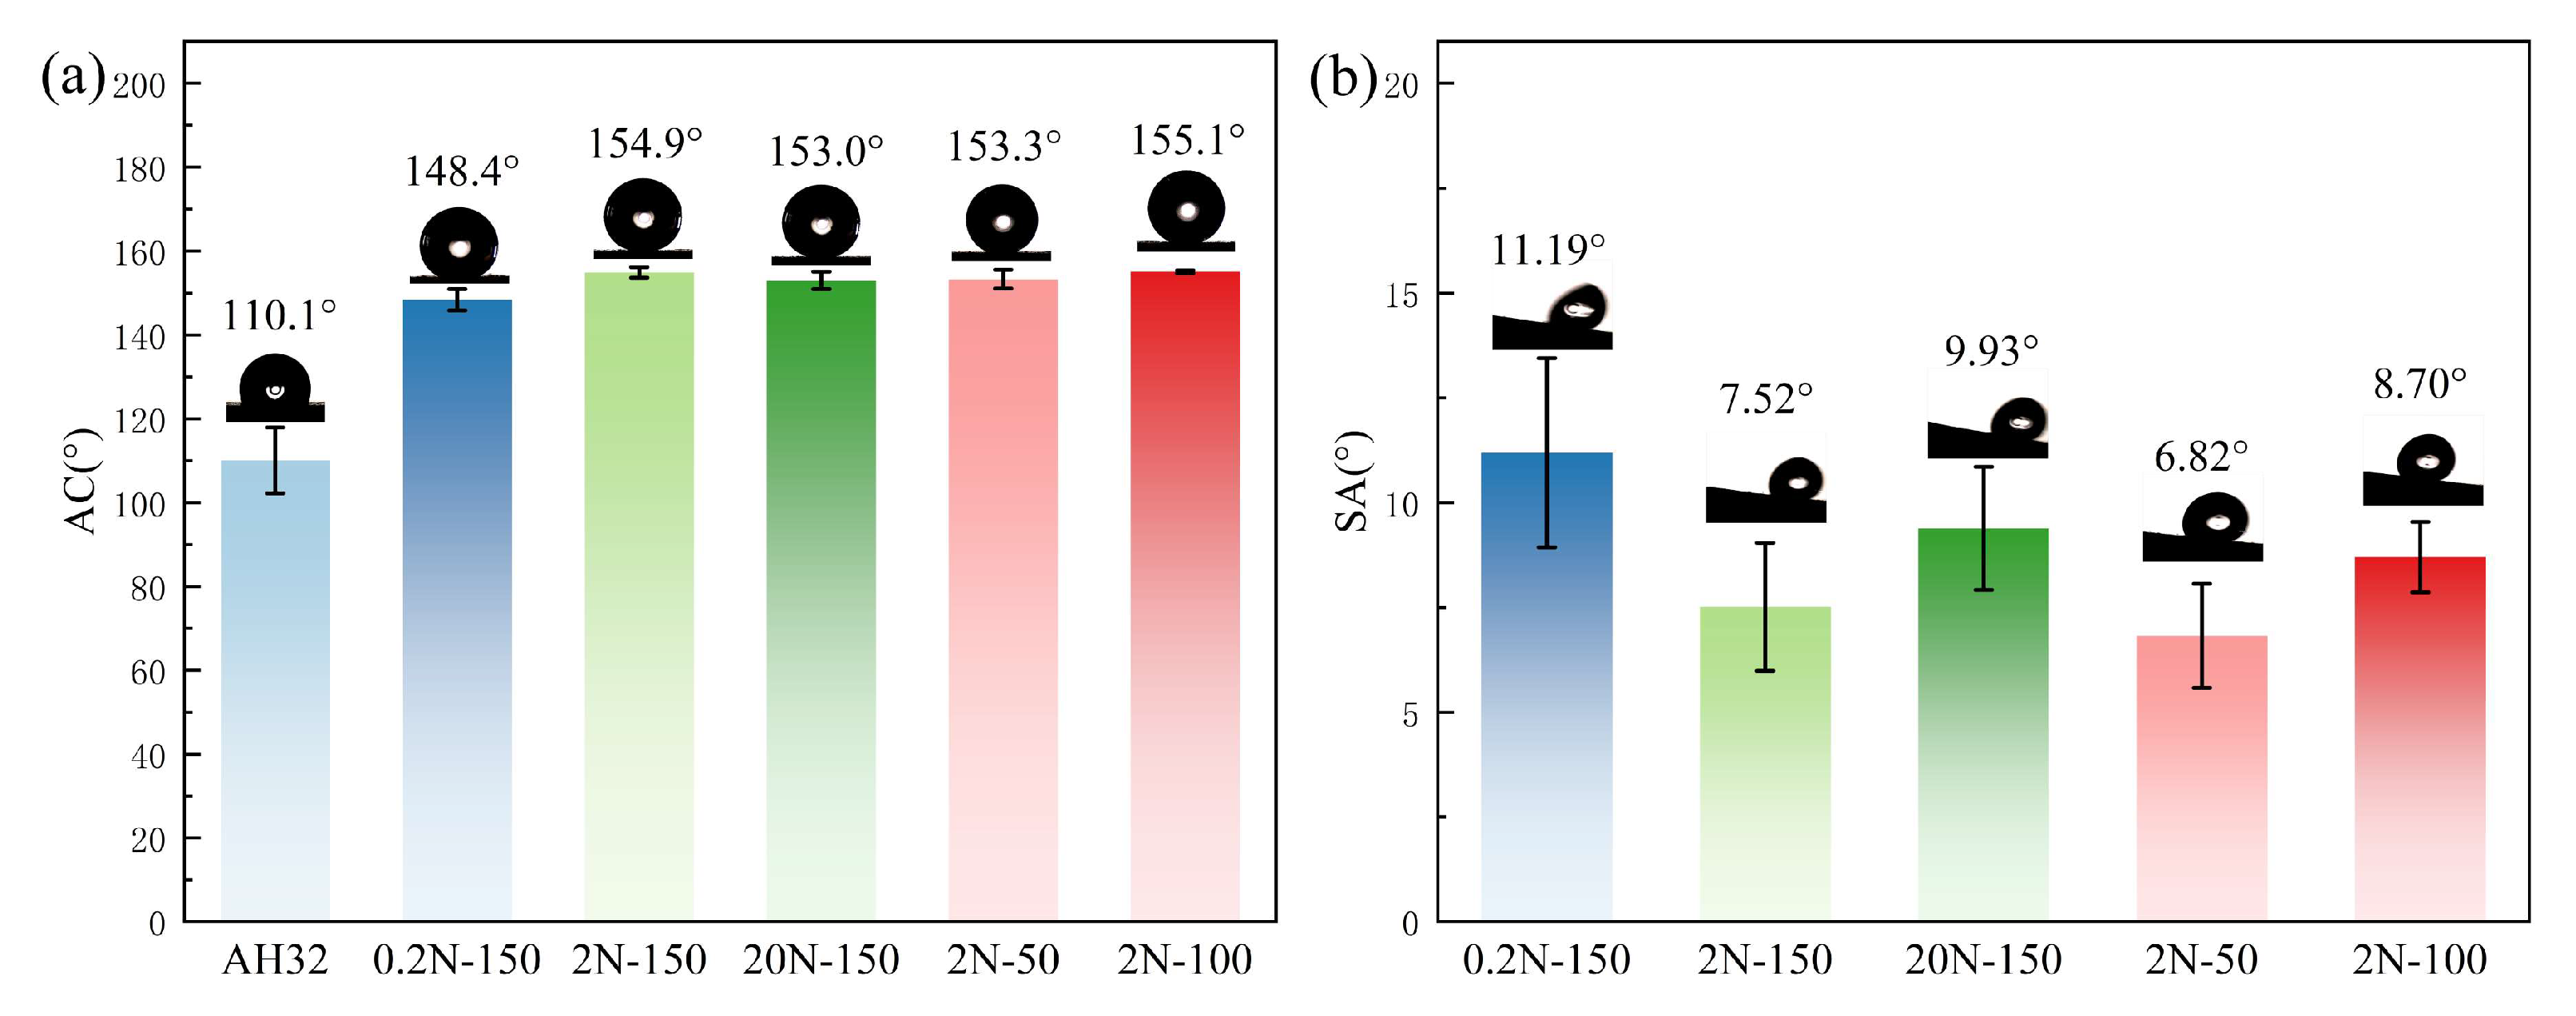
Figure 11.
(a) Static water contact angles and (b) sliding angles of the control samples.
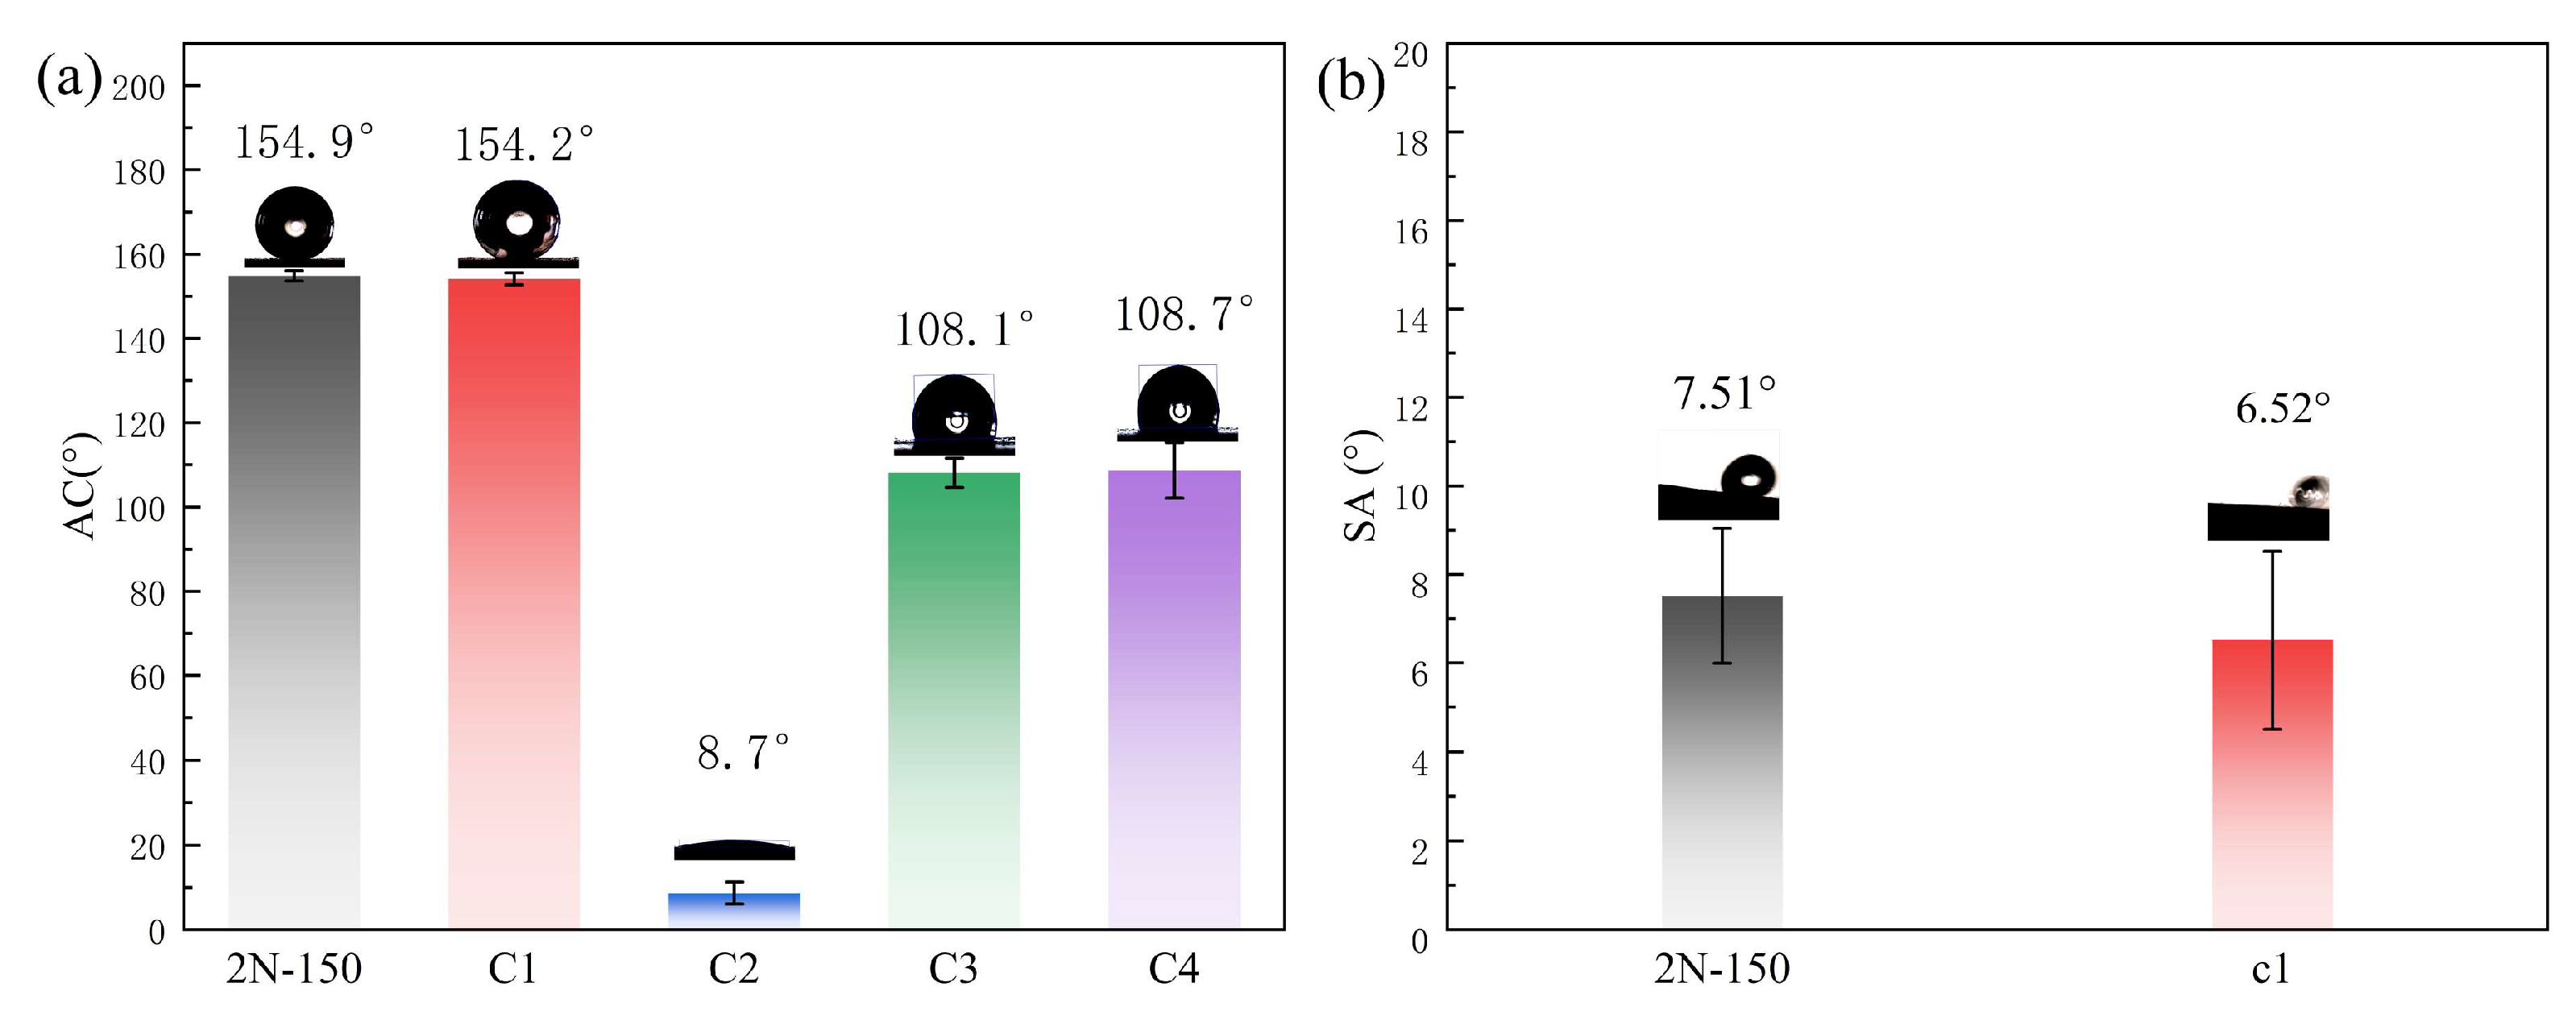
Figure 12.
Friction coefficient curves and mass loss of coatings prepared under various conditions: (a) friction coefficient curves; (b) mass loss (mg)histograms.
Figure 12.
Friction coefficient curves and mass loss of coatings prepared under various conditions: (a) friction coefficient curves; (b) mass loss (mg)histograms.
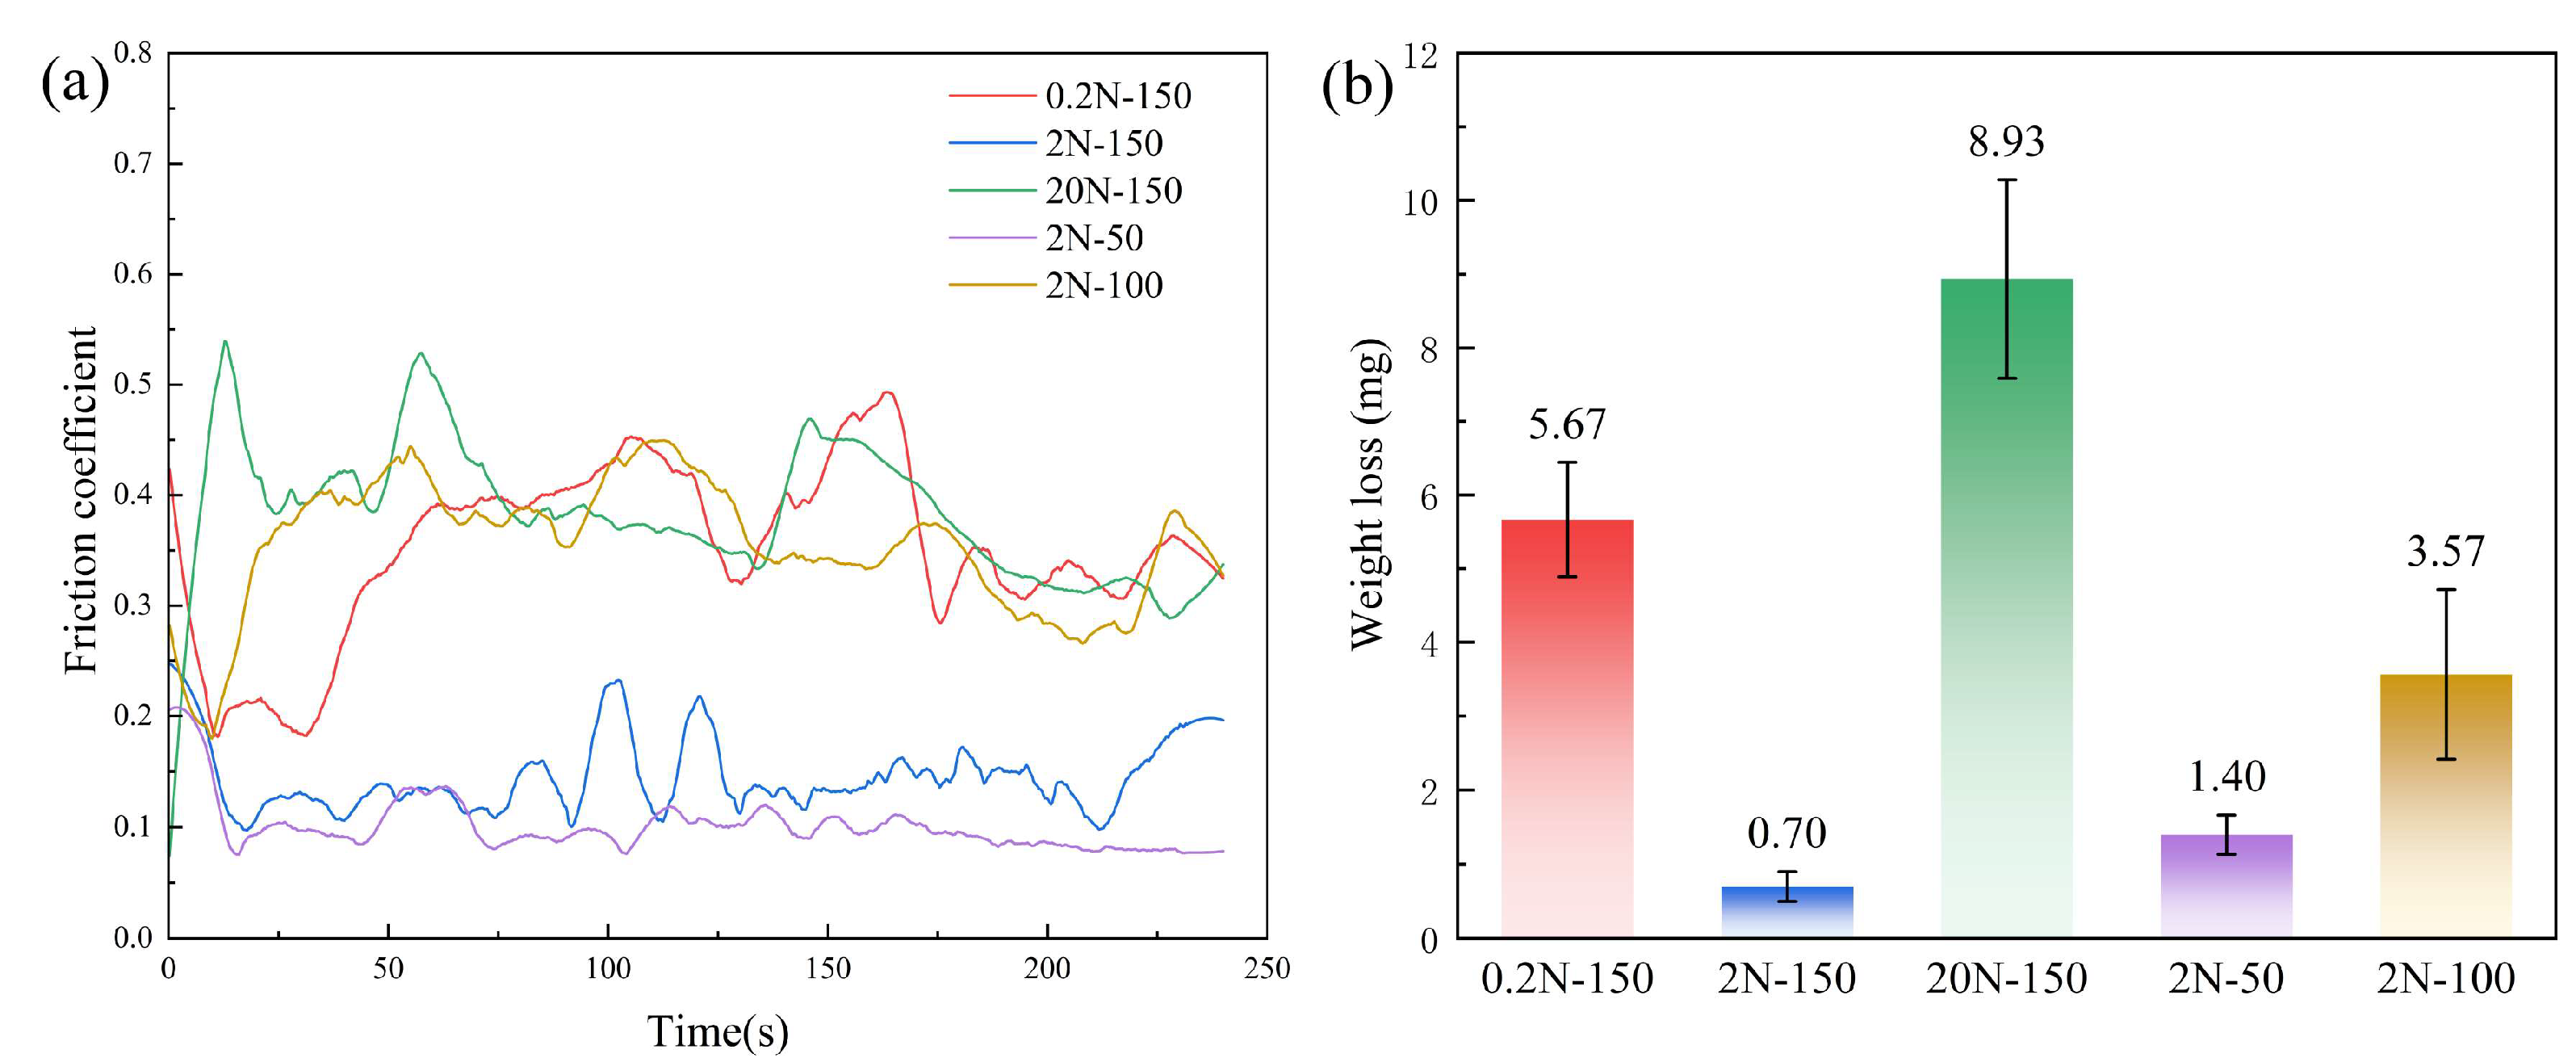
Figure 13.
(a) Sliding direction; (b) Schematic diagram before wear; (c) Schematic diagram of debris-filled surface after wear.
Figure 13.
(a) Sliding direction; (b) Schematic diagram before wear; (c) Schematic diagram of debris-filled surface after wear.
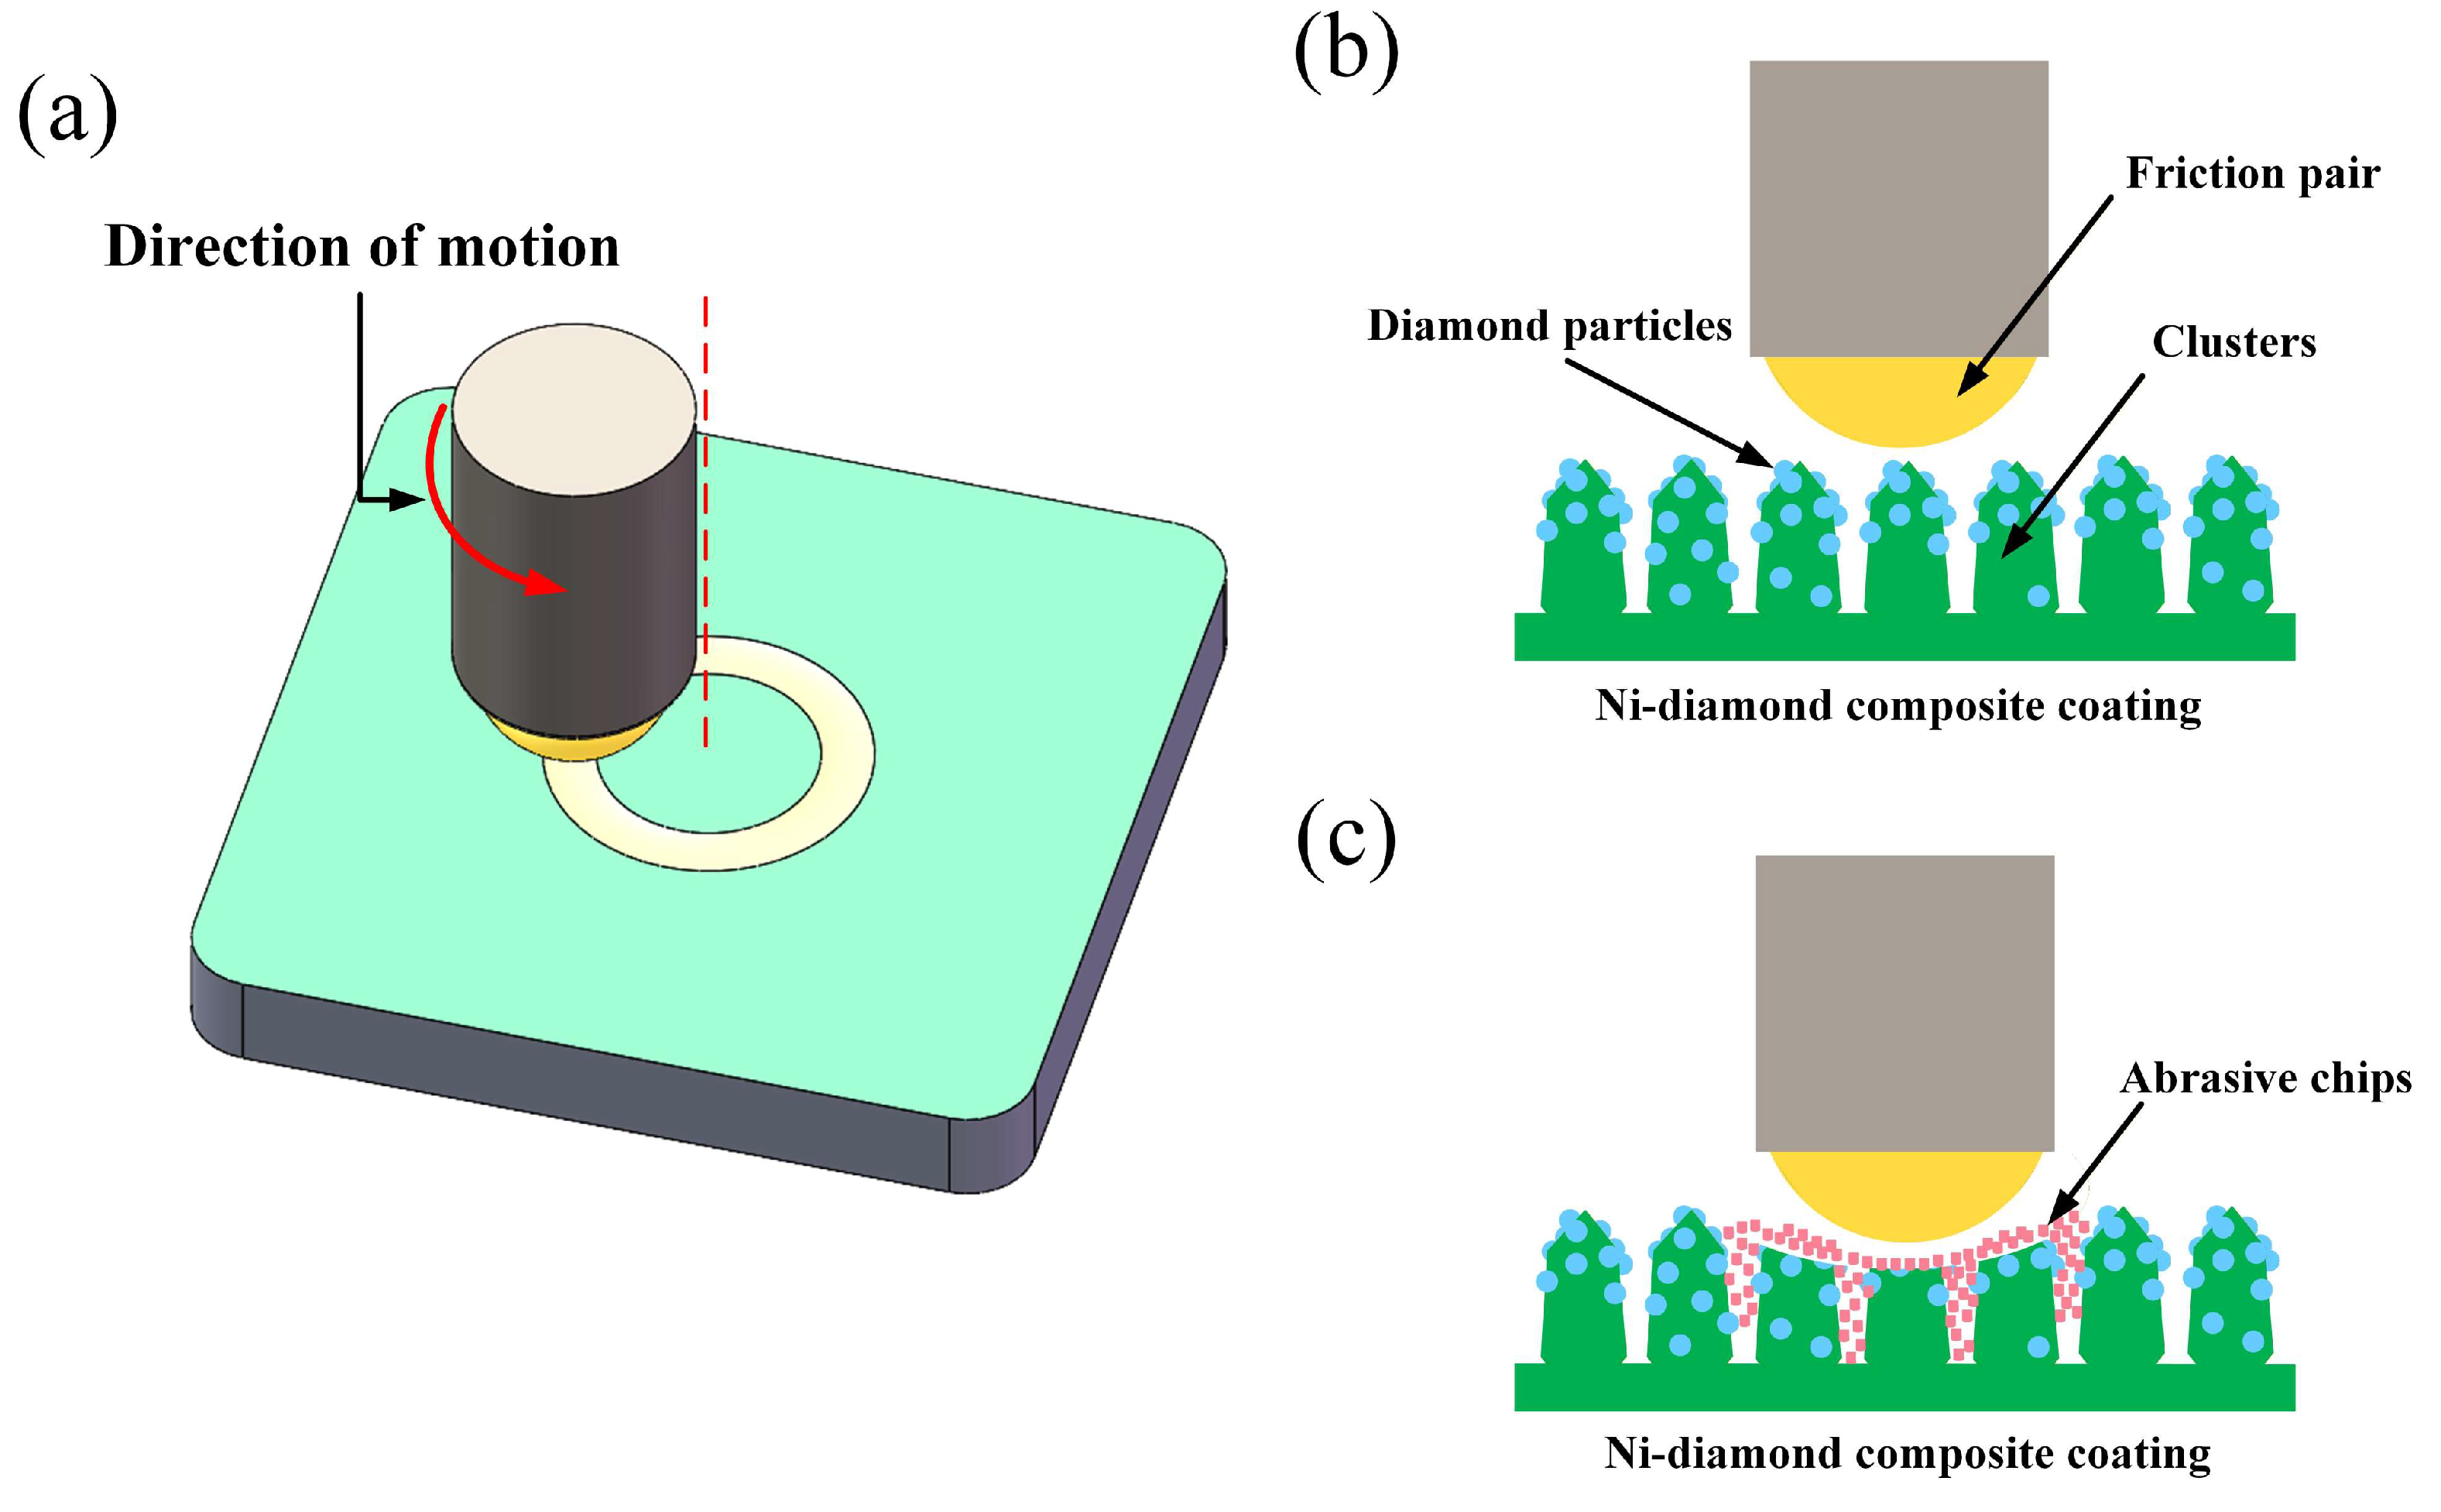
Figure 14.
Friction coefficient curves and mass loss of the control samples: (a) friction coefficient curves; (b) mass loss (mg) histograms.
Figure 14.
Friction coefficient curves and mass loss of the control samples: (a) friction coefficient curves; (b) mass loss (mg) histograms.
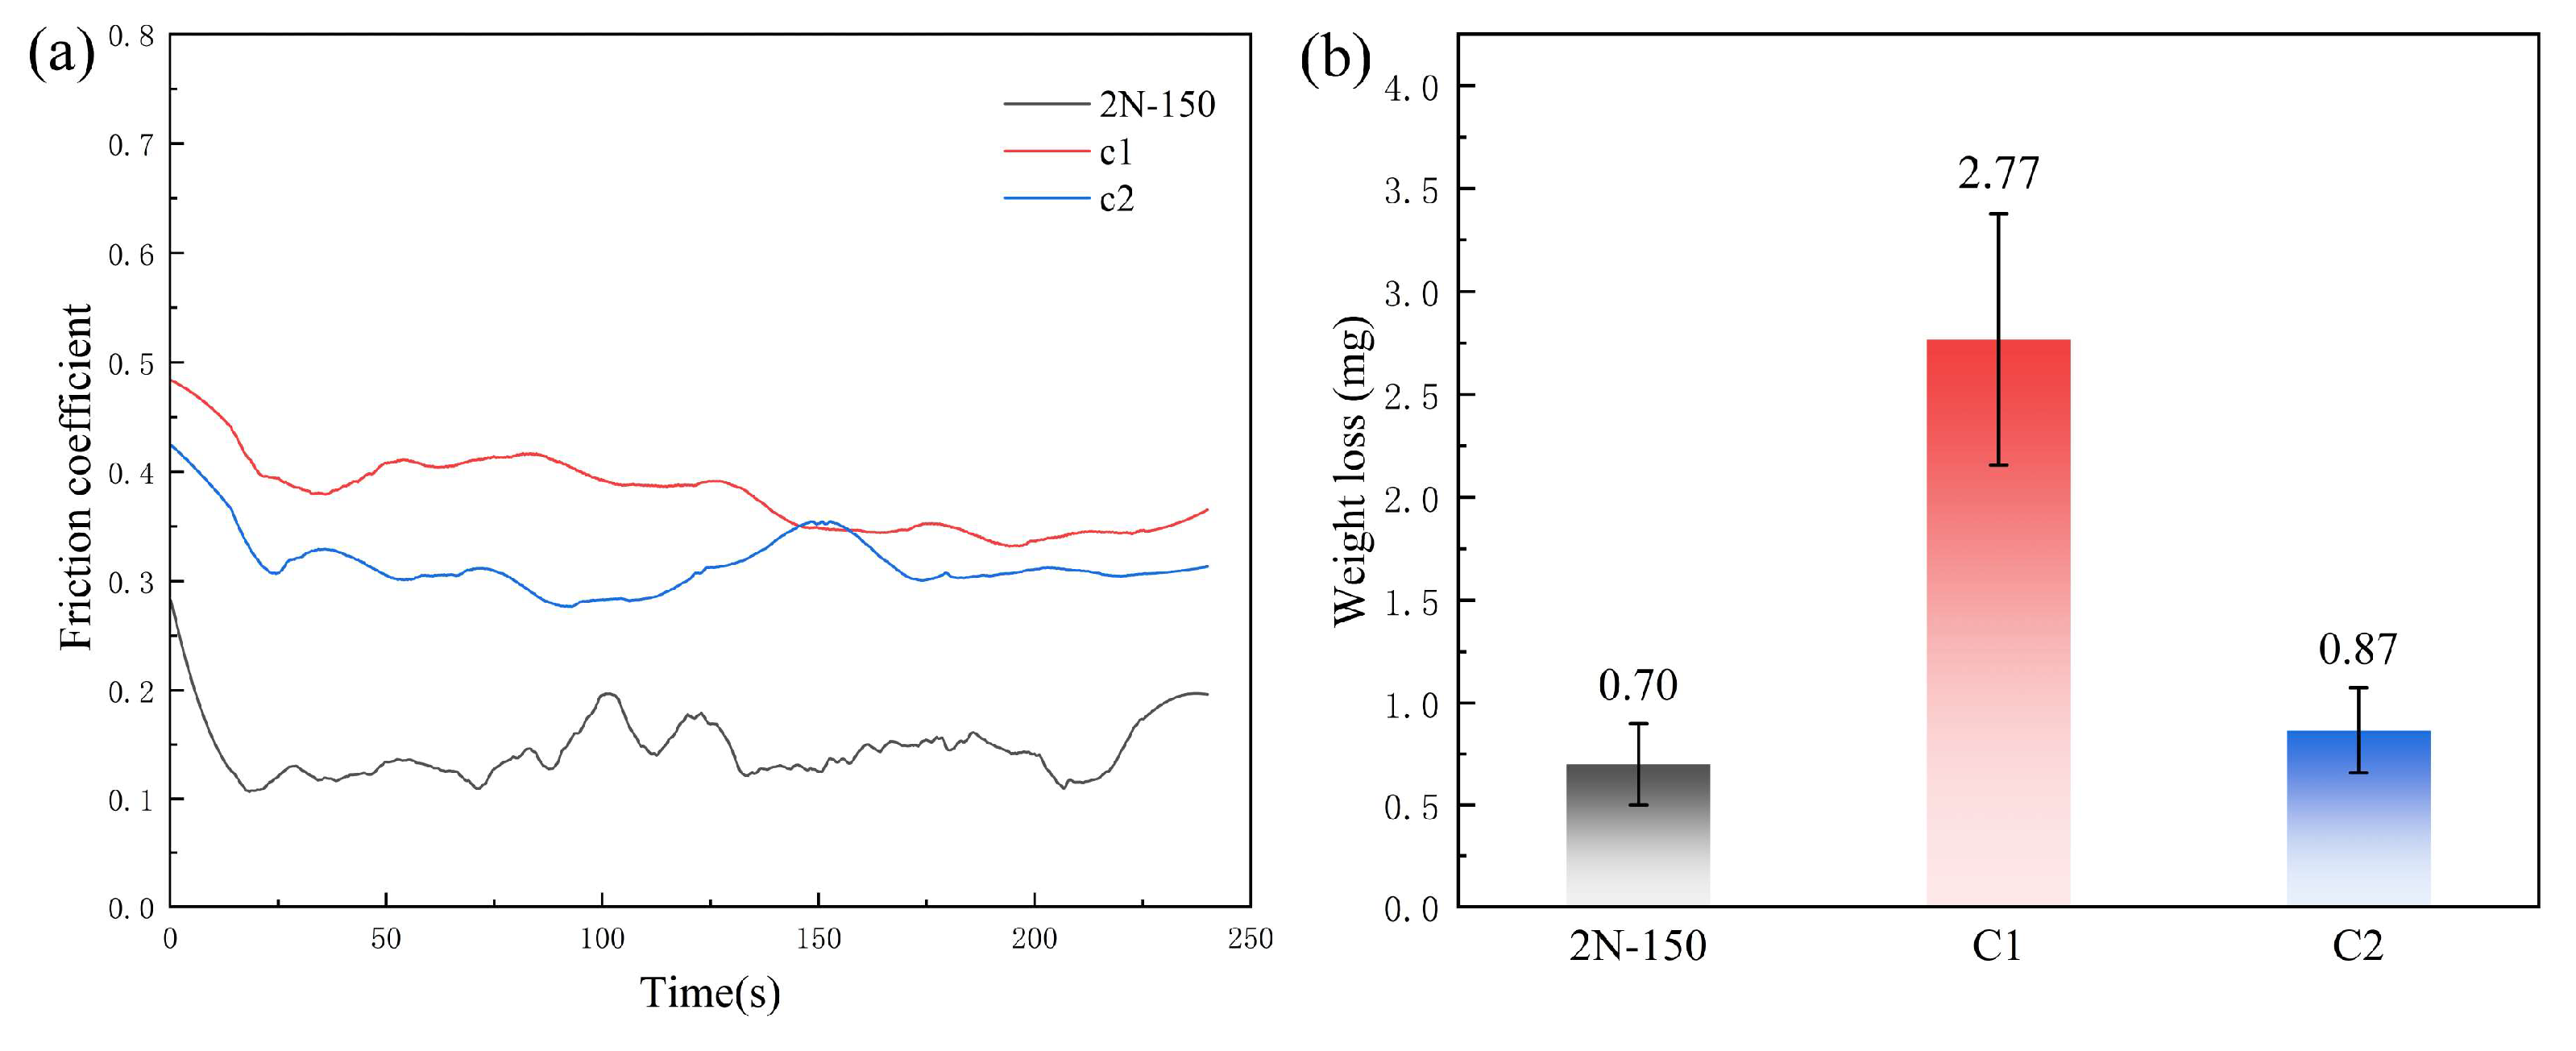
Figure 15.
Surface morphologies of different coatings after wear testing: (a–c) 0.2N-150; (d–f) 2N-150; (g–i) 20N-150; (j–l) 2N-50; (m–o) 2N-100 (with ×50 and ×500 magnifications, and EDS mapping for each sample).
Figure 15.
Surface morphologies of different coatings after wear testing: (a–c) 0.2N-150; (d–f) 2N-150; (g–i) 20N-150; (j–l) 2N-50; (m–o) 2N-100 (with ×50 and ×500 magnifications, and EDS mapping for each sample).
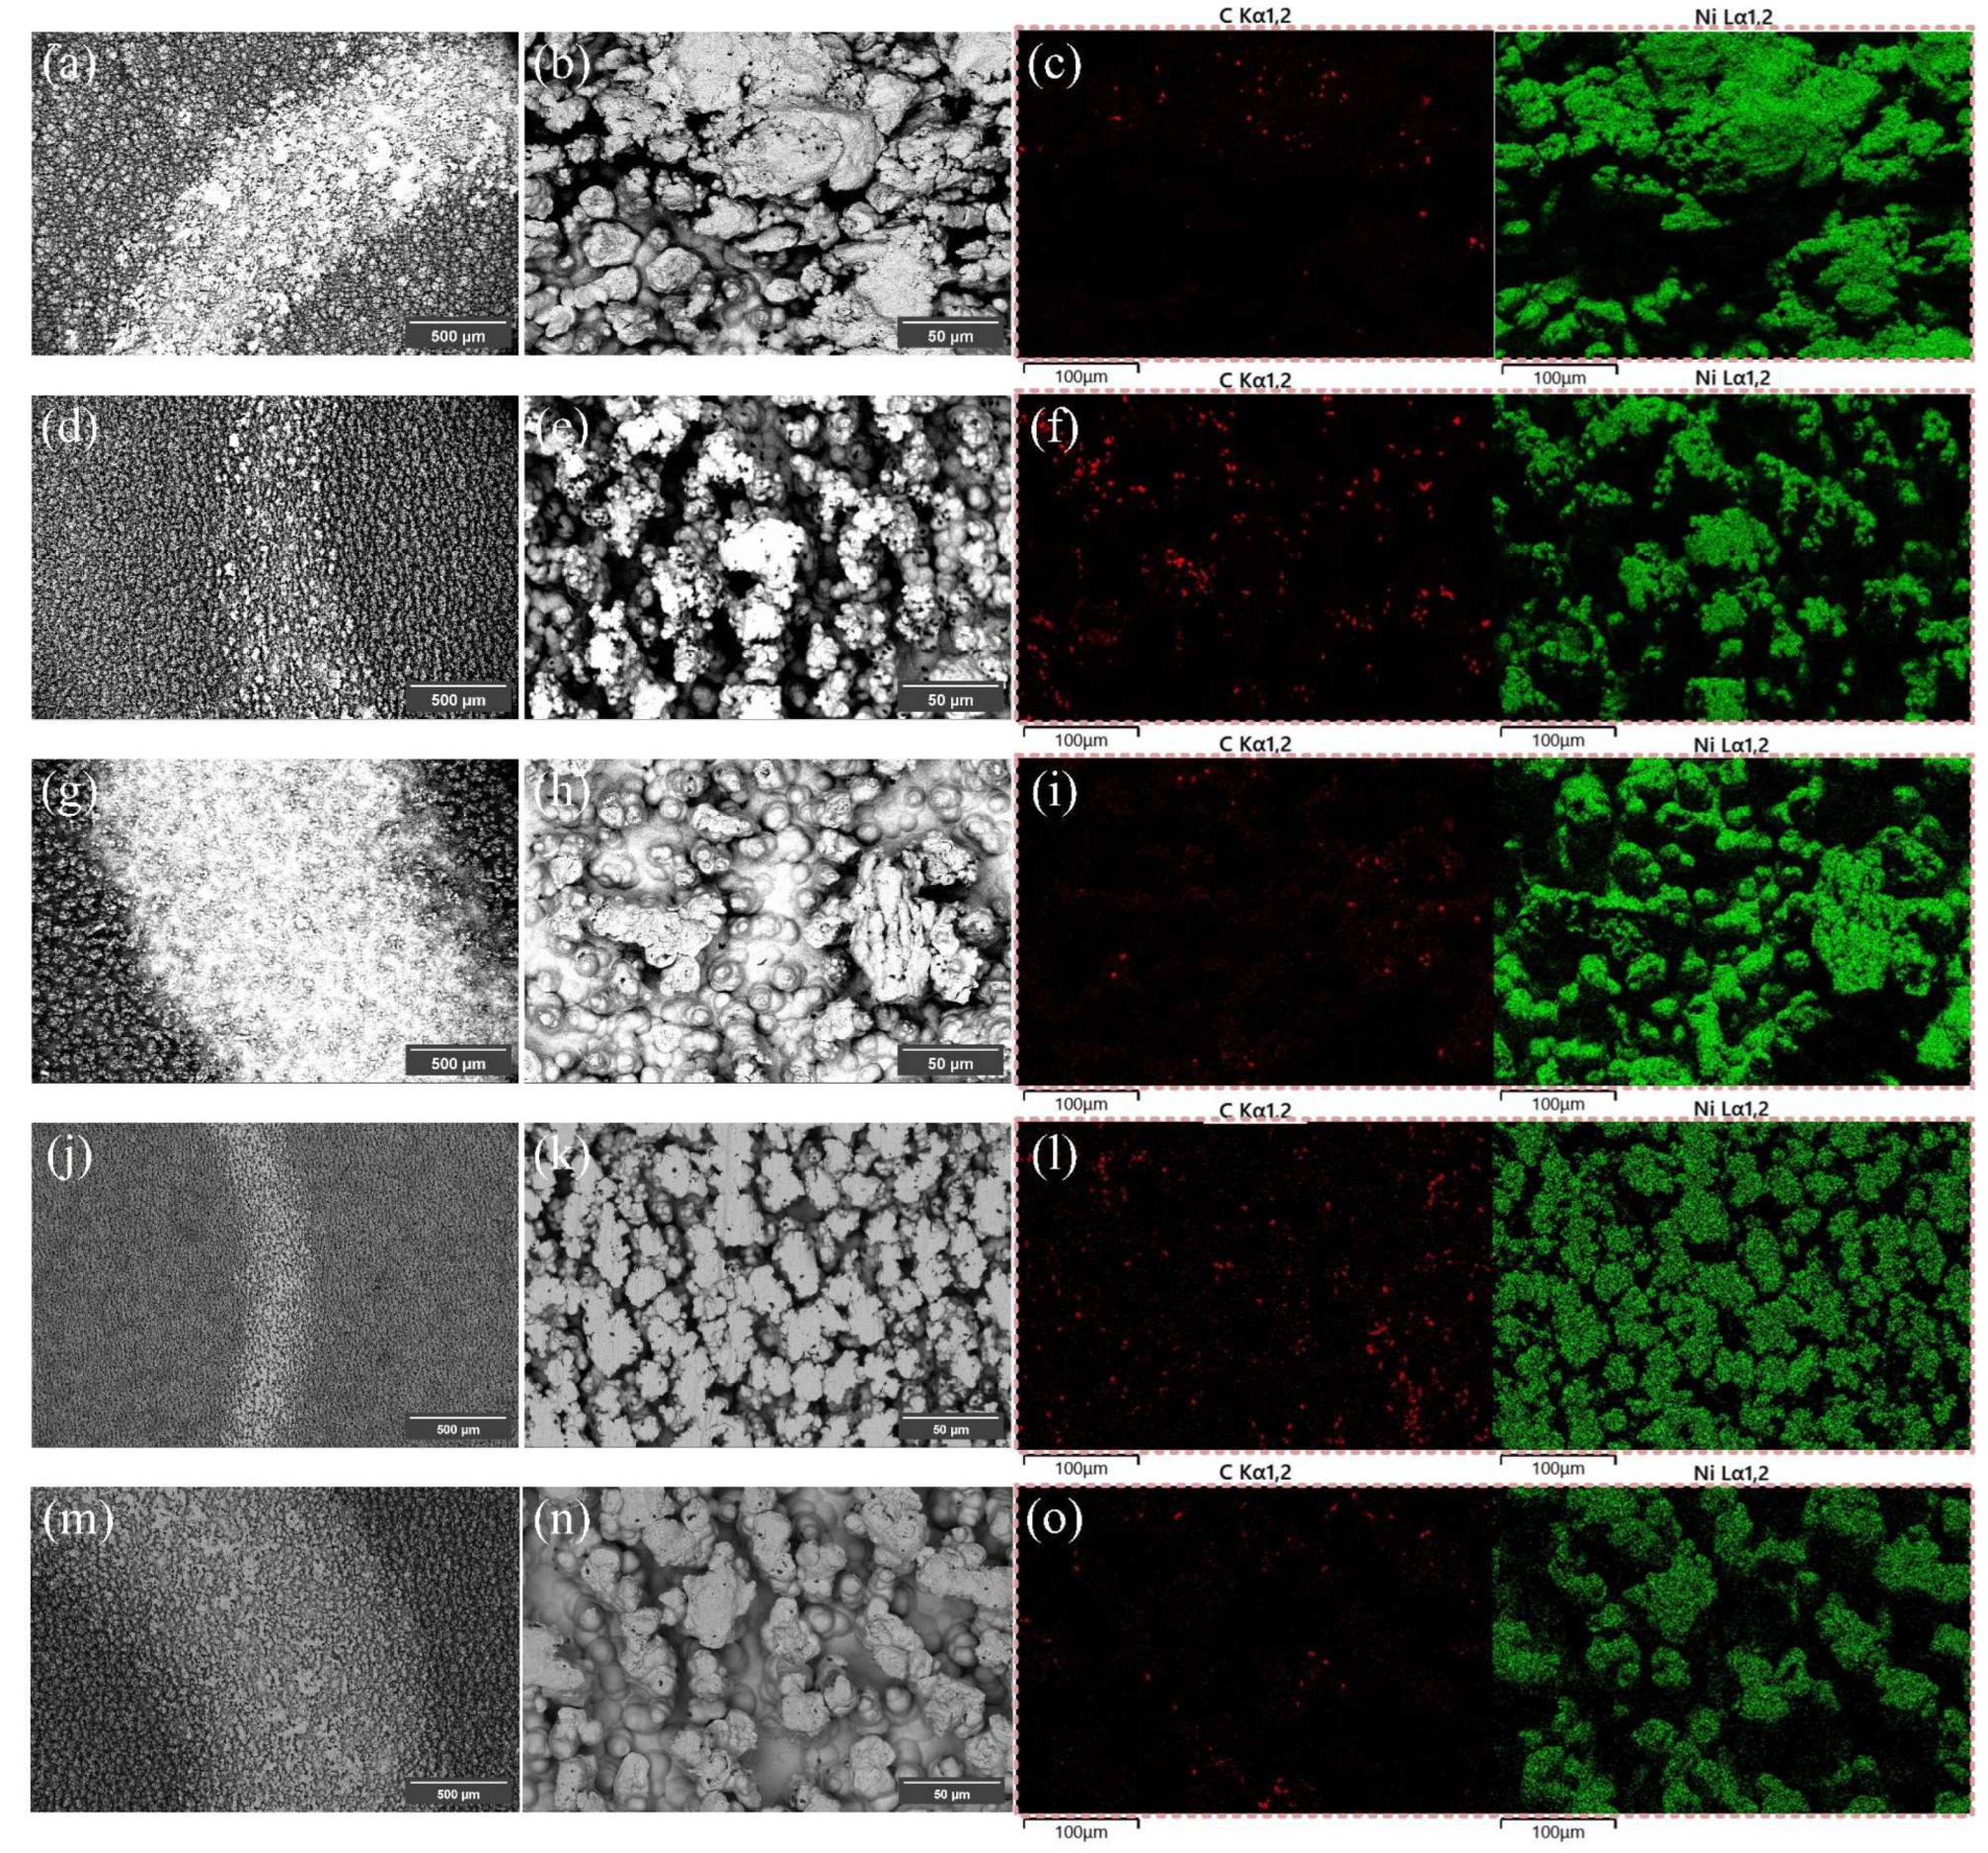
Figure 16.
Electrochemical corrosion analysis of the bare substrate and different coatings in 3.5 wt% NaCl solution: (a) Tafel polarization curves; (b) Nyquist plots; (c) Bode plots; (d) Equivalent circuit diagram of the coatings.
Figure 16.
Electrochemical corrosion analysis of the bare substrate and different coatings in 3.5 wt% NaCl solution: (a) Tafel polarization curves; (b) Nyquist plots; (c) Bode plots; (d) Equivalent circuit diagram of the coatings.
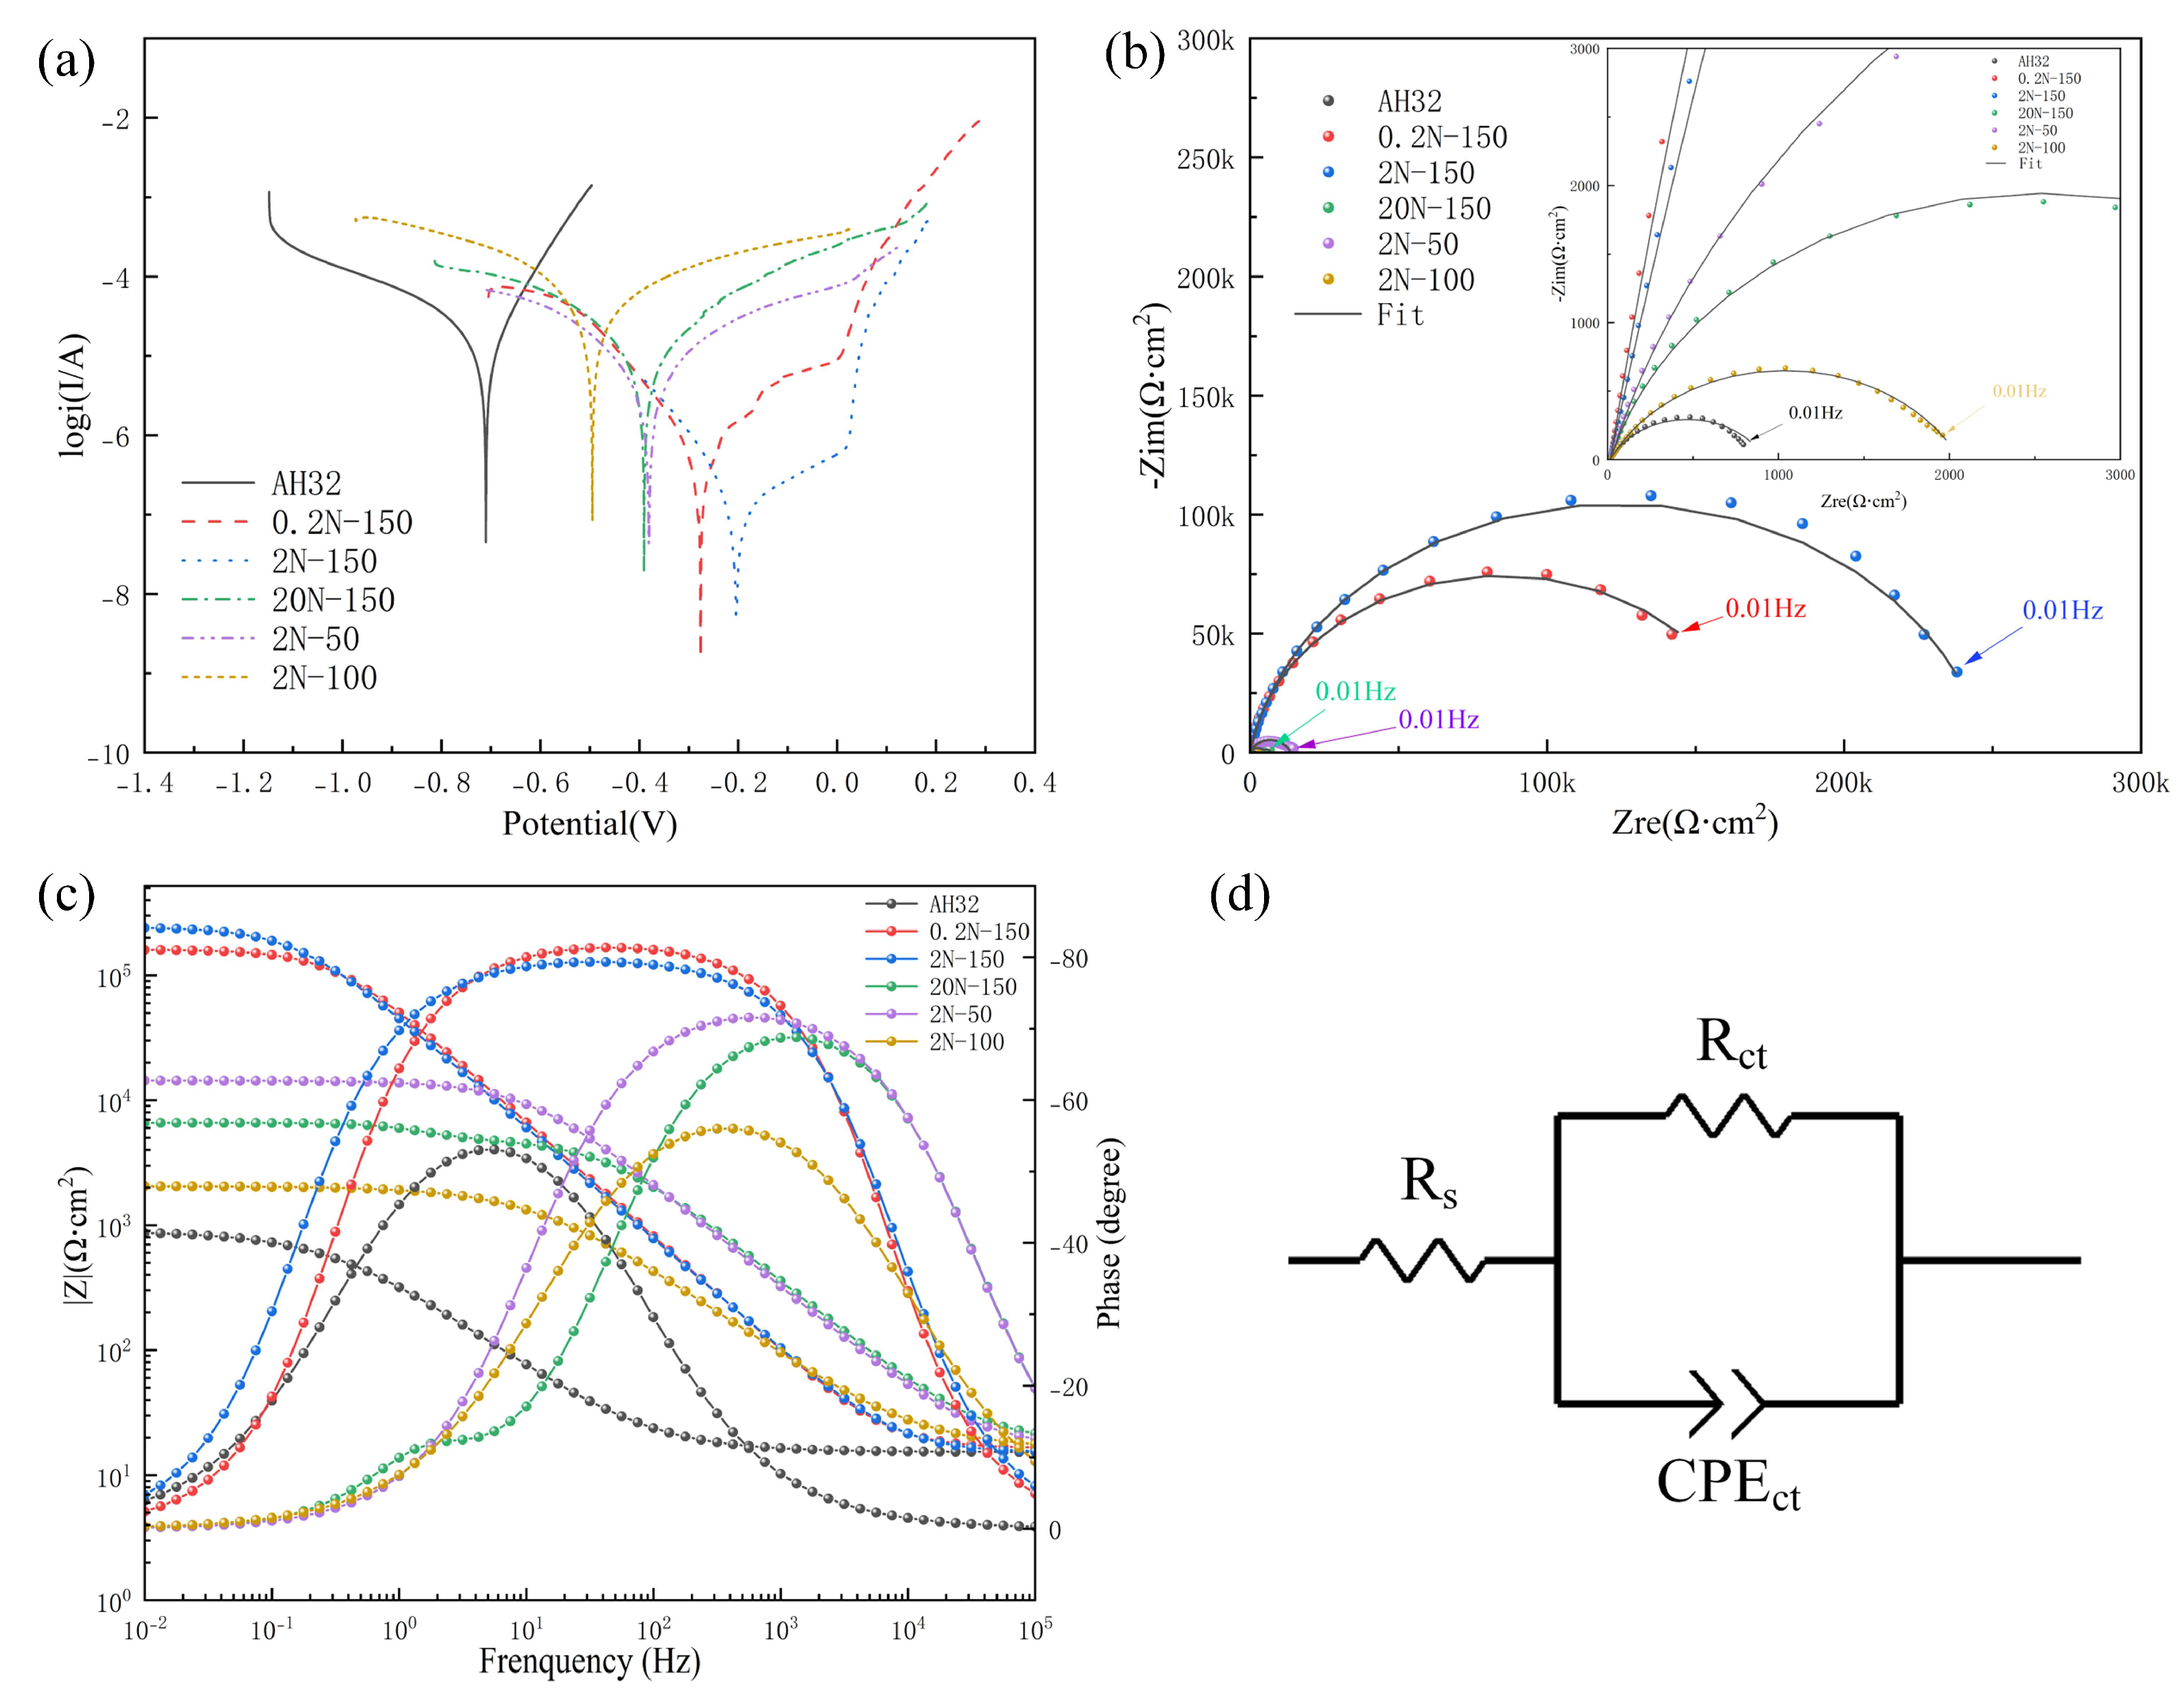
Figure 17.
Electrochemical corrosion analysis of the control samples in 3.5 wt% NaCl solution: (a) Tafel polarization curves; (b) Nyquist plots; (c) Bode plots; (d) Equivalent circuit diagram of the coatings.
Figure 17.
Electrochemical corrosion analysis of the control samples in 3.5 wt% NaCl solution: (a) Tafel polarization curves; (b) Nyquist plots; (c) Bode plots; (d) Equivalent circuit diagram of the coatings.
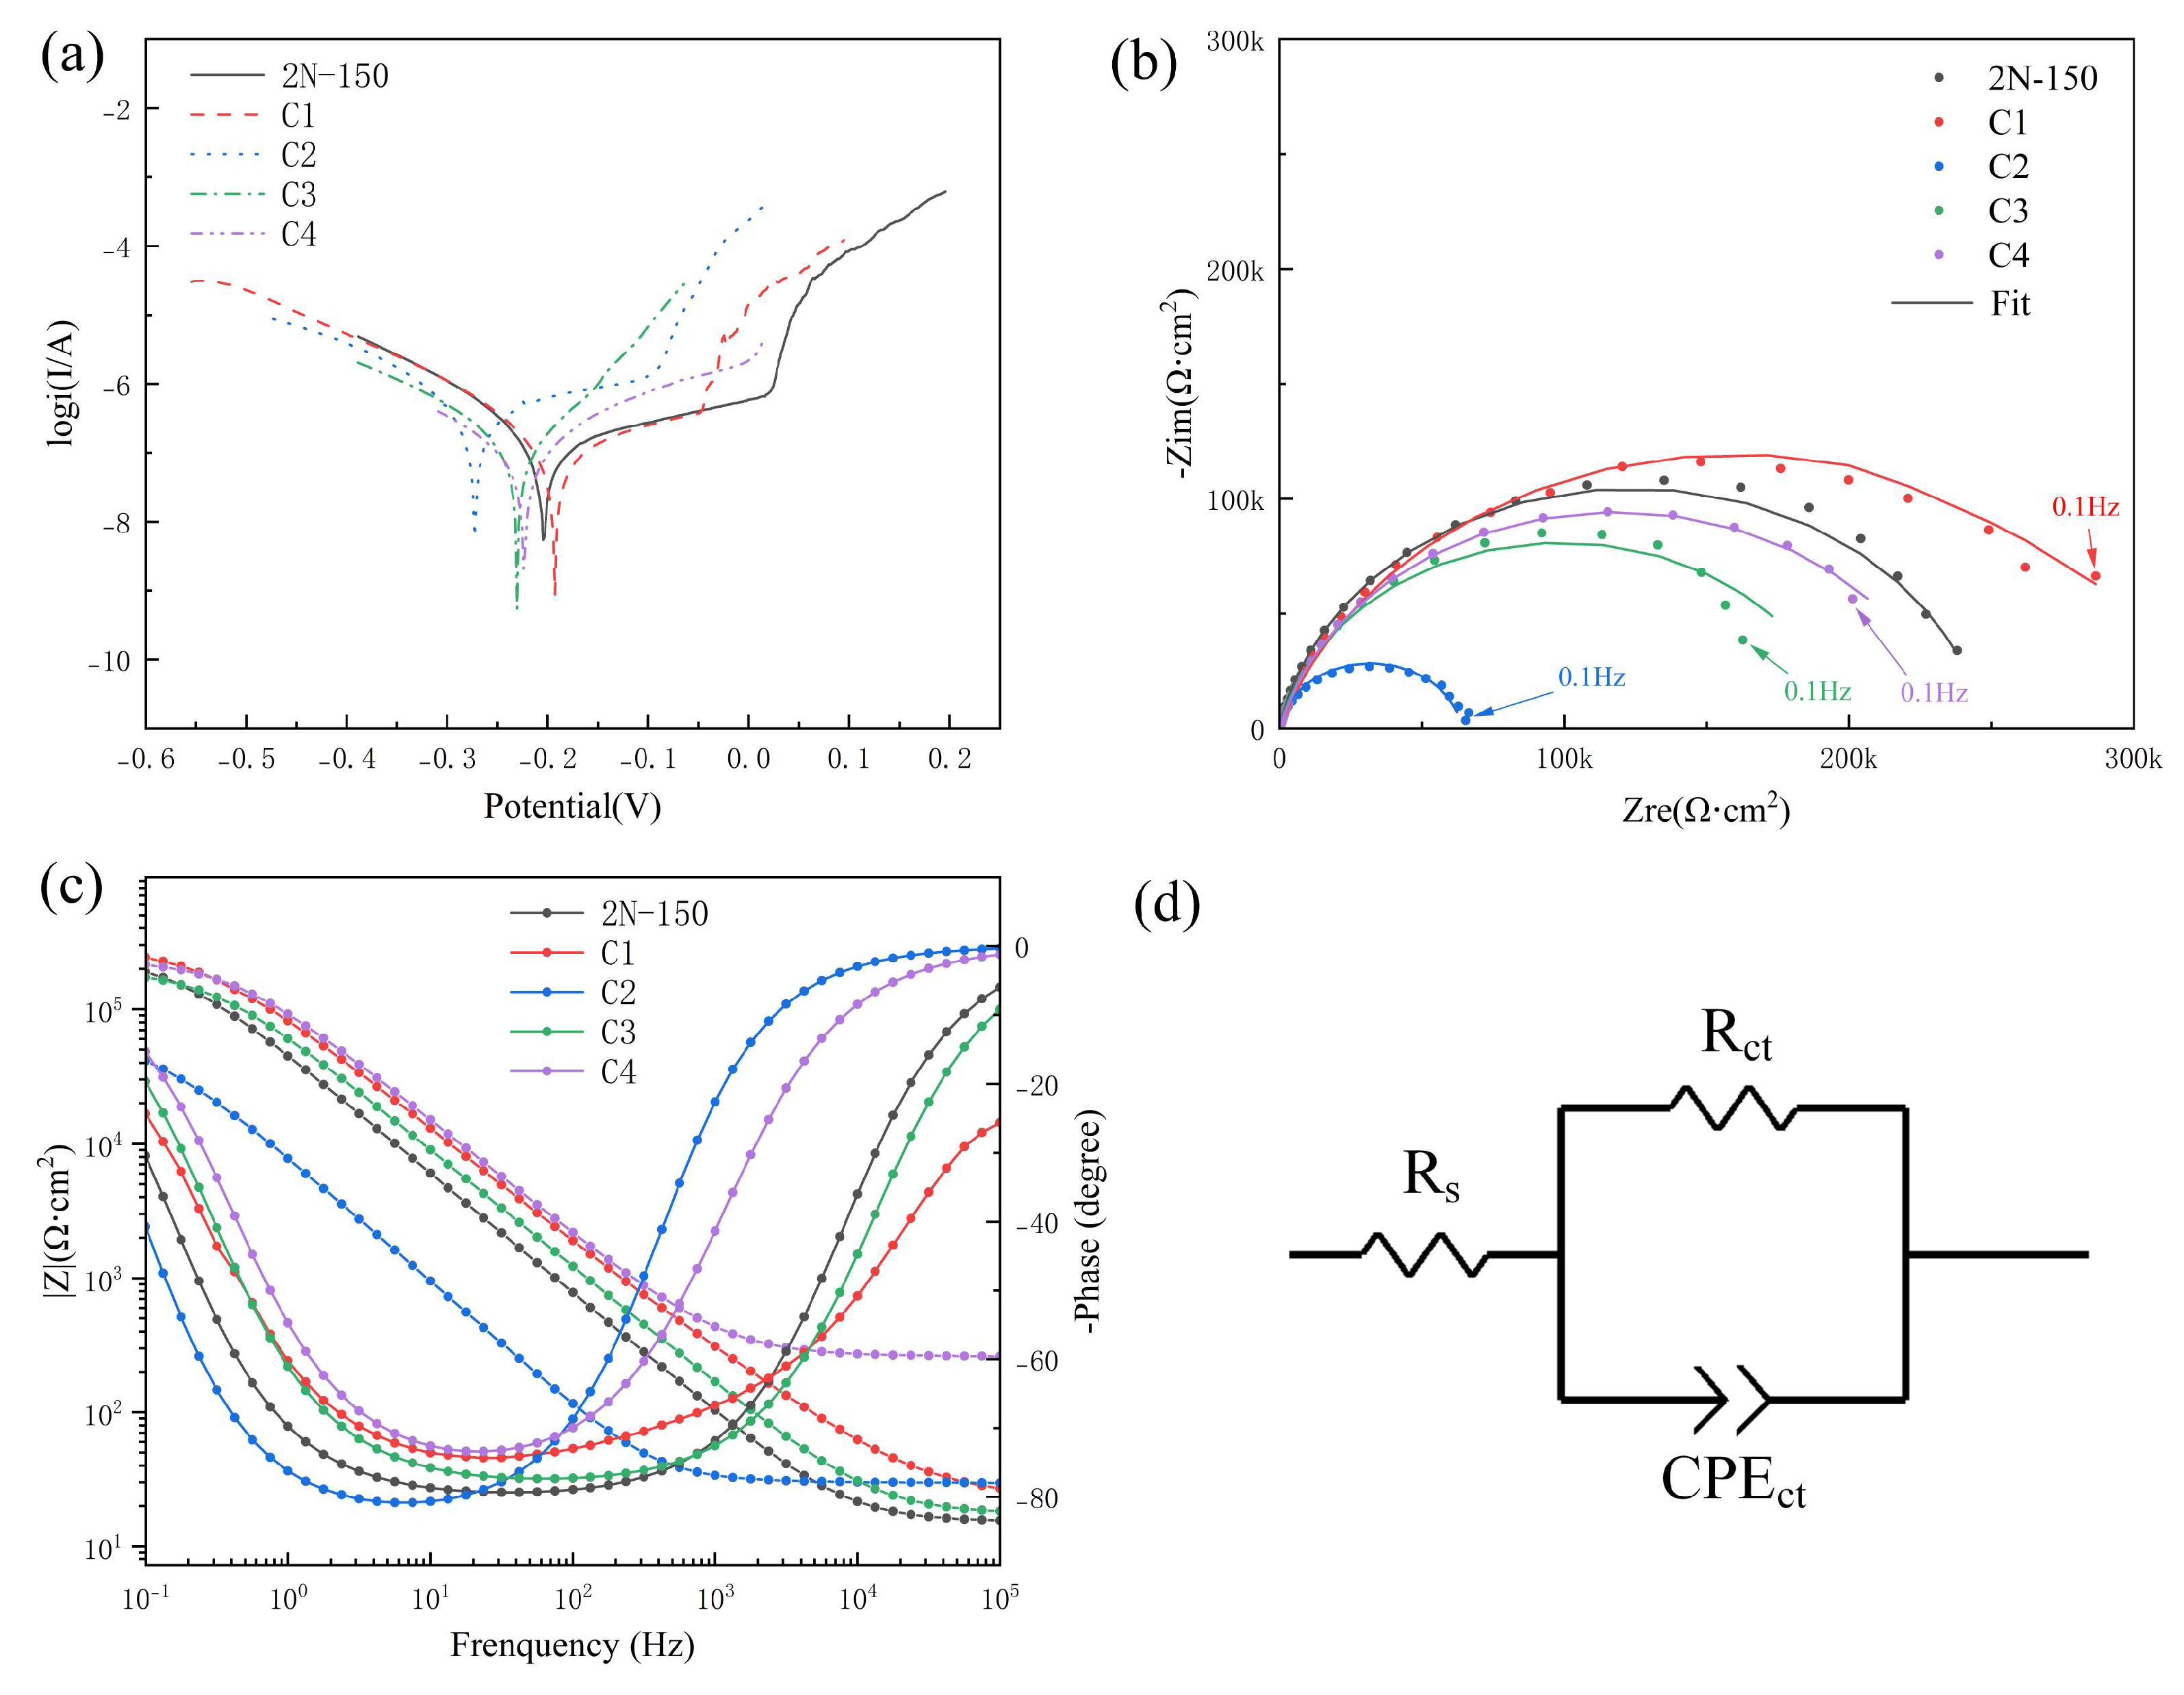

Table 1.
Chemical composition of AH32 steel.
| Compositions | Content (Mass Fraction in %) |
|---|---|
| C | ≤ 0.18 |
| Si | 0.10 ~ 0.50 |
| Mn | 0.70 ~ 1.60 |
| P | ≤ 0.04 |
| S | ≤ 0.04 |
| Al | ≥ 0.015 |
| Nb | 0.015 ~ 0.050 |
| V | 0.030 ~ 0.100 |
Table 2.
Chemical composition of the Watts-type plating bath.
| Component | Content (g/L) | Function | Grade |
|---|---|---|---|
| NiSO4·6H2O | 250 | Provides nickel ions | Analytical-grade |
| NiCl2·6H2O | 40 | Anodic activator | Analytical-grade |
| H3BO3 | 40 | Buffer agent | Analytical-grade |
| C7H5NO3S | 5 | Brightener | 98% |
Table 3.
Parameters for jet electrodeposition.
| Compositions | Value |
|---|---|
| Flow rate | 3 L/min |
| Scanning speed | 4 mm/s |
| Current density | 100 A/dm2 |
| Bath temperature | 50 °C |
Table 4.
Parameters for jet electrodeposition.
| Sample Name | Particle Diameter (μm) | Magnetic Field Intensity (mT) |
|---|---|---|
| 0.2N-150 | 0.2 | 150 |
| 2N-150 | 2 | 150 |
| 20N-150 | 20 | 150 |
| 2N-100 | 2 | 100 |
| 2N-50 | 2 | 50 |
Table 5.
Parameters for jet electrodeposition.
| Sample | Magnetic Field (Step 1) | Ni Particles (Step 1) | Diamond (Step 2) | PFDTES Modification |
|---|---|---|---|---|
| 2N-150 | 150 mT | 2 μm | Yes | Yes |
| C1 | 150 mT | 2 μm | No | Yes |
| C2 | 150 mT | 2 μm | Yes | No |
| C3 | 0 mT | 2 μm | Yes | Yes |
| C4 | 150 mT | No | Yes | Yes |
Table 6.
Self-corrosion potential, self-corrosion current density, and protection efficiency of the coatings.
Table 6.
Self-corrosion potential, self-corrosion current density, and protection efficiency of the coatings.
| Samples | Ecorr (V) | icorr(A/cm2) | Protection rate |
|---|---|---|---|
| AH32 | -0.705 | 2.403×10⁻⁵ | — |
| 0.2N-150 | -0.293 | 4.556×10⁻⁷ | 98.10% |
| 2N-150 | -0.193 | 1.301×10⁻⁷ | 99.46% |
| 20N-150 | -0.389 | 6.811×10⁻⁶ | 71.66% |
| 2N-50 | -0.386 | 3.395×10⁻⁶ | 85.03% |
| 2N-100 | -0.492 | 1.187×10⁻⁵ | 50.61% |
Table 7.
Self-corrosion potential, self-corrosion current density, and protection efficiency of the control samples.
Table 7.
Self-corrosion potential, self-corrosion current density, and protection efficiency of the control samples.
| Sample | Ecorr (V) | icorr(A/cm2) | Protection rate |
|---|---|---|---|
| 2N-150 | 0.1933 | 1.304×10⁻⁷ | 99.46% |
| C1 | -0.1558 | 1.087×10⁻⁷ | 99.55% |
| C2 | -0.2665 | 3.859×10⁻⁷ | 98.39% |
| C3 | -0.2117 | 1.219×10⁻⁷ | 99.49% |
| C4 | -0.2349 | 1.004×10⁻⁷ | 99.58% |
Table 8.
This is a table. Tables should be placed in the main text near to the first time they are cited.
Table 8.
This is a table. Tables should be placed in the main text near to the first time they are cited.
| Sample | Rs(Ω cm2) | CEPCT(Ω−1 cm−2 sn) | n | Rct(Ω cm2) | χ2 |
|---|---|---|---|---|---|
| AH32 | 15.38 | 6.873×10⁻⁴ | 0.73 | 907.5 | 6.6✕10−3 |
| 0.2N-150 | 16.92 | 3.362×10⁻⁶ | 0.92 | 160770 | 9.7✕10−3 |
| 2N-150 | 15.25 | 4.124×10⁻⁶ | 0.89 | 248280 | 1.9✕10−3 |
| 20N-150 | 18.58 | 1.822×10⁻⁶ | 0.83 | 4837 | 6.0✕10−2 |
| 2N-50 | 16.92 | 1.987×10⁻⁶ | 0.84 | 13558 | 6.0✕10−3 |
| 2N-100 | 16.17 | 2.052×10⁻⁵ | 0.72 | 2044 | 2.9✕10−3 |
1 EIS data were fitted by complex non-linear least-squares (CNLS) regression using ZView software with Calc weighting. χ2 is the chi-square goodness of fit (smaller values indicate better agreement between the measured and fitted impedance), and the relative standard errors of Rct were all 1.48% (observed for the bare AH32 substrate) , confirming reliable fitting.
Table 9.
Parameters obtained from EIS fitting for the control samples.
| Sample | Rs(Ω cm2) | CEPCT(Ω−1 cm−2 sn) | n | Rct(Ω cm2) | χ2 |
|---|---|---|---|---|---|
| 2N-150 | 15.25 | 4.124×10⁻⁶ | 0.89 | 248280 | 1.9✕10−3 |
| C1 | 23.92 | 2.597×10⁻⁶ | 0.81 | 317720 | 5.8✕10−3 |
| C2 | 29.77 | 2.322×10⁻⁵ | 0.92 | 63903 | 3.3✕10−3 |
| C3 | 17.44 | 2.974×10⁻⁶ | 0.87 | 392560 | 6.4✕10−3 |
| C4 | 26.02 | 1.891×10⁻⁶ | 0.86 | 236420 | 4.3✕10−3 |
Disclaimer/Publisher’s Note: The statements, opinions and data contained in all publications are solely those of the individual author(s) and contributor(s) and not of MDPI and/or the editor(s). MDPI and/or the editor(s) disclaim responsibility for any injury to people or property resulting from any ideas, methods, instructions or products referred to in the content. |
© 2026 by the authors. Licensee MDPI, Basel, Switzerland. This article is an open access article distributed under the terms and conditions of the Creative Commons Attribution (CC BY) license (http://creativecommons.org/licenses/by/4.0/).
Copyright: This open access article is published under a Creative Commons CC BY 4.0 license, which permit the free download, distribution, and reuse, provided that the author and preprint are cited in any reuse.