

Submitted:
16 November 2026
Posted:
17 November 2026
You are already at the latest version
Abstract
Purpose. About one in five patients with colorectal cancer presents with metastatic disease, and many receive no recorded anticancer treatment. We described treatment patterns and examined survival differences by race/ethnicity, county income and rurality among adults with Stage IV colorectal cancer. Methods. Retrospective cohort of adults aged 20 years or older diagnosed in 2018-2023 in the Surveillance, Epidemiology, and End Results (SEER) program (n = 44,507 analyzed). Treatment was grouped as surgery plus chemotherapy, chemotherapy without surgery, surgery without chemotherapy, radiation only, or no recorded treatment. We used logistic regression, Kaplan-Meier methods and sequentially adjusted Cox models (3-month landmark analysis for treatment). Results. Overall, 24.8% had no recorded treatment (crude median survival 1 month). Age 75 or older versus under 50 carried the highest odds of no recorded treatment (odds ratio 7.26, 95% CI 6.56-8.03); odds were also higher for Black patients (1.31, 1.22-1.41). Three-year survival was 18.6% for Black versus 23.1% for White patients. Adjustment for treatment group attenuated the Black-White hazard ratio from 1.18 to 1.13; income and rurality estimates were unchanged. The Black-White difference was largest under age 50 (hazard ratio 1.45, 1.31-1.60) and absent at 75 and older (1.01, 0.95-1.08). Conclusions. About one in four adults with Stage IV colorectal cancer had no recorded treatment, mostly older patients. Survival differences by race/ethnicity, county income and rurality persisted after adjustment, with only slight attenuation of the Black-White difference after adjustment for recorded treatment.
Keywords:
metastatic colorectal cancer
; SEER
; real-world evidence
; health disparities
; treatment patterns
; survival
Introduction
About 22% of patients with colorectal cancer are diagnosed with metastatic disease [1,2], and 5-year overall survival for Stage IV colon cancer is roughly 15% [1]. Systemic therapy is the mainstay of treatment for most of these patients, with surgery of the primary tumor or metastases reserved for selected patients with resectable disease or symptoms [1,3].
Despite these recommendations, many patients receive no recorded treatment. In the SEER Patterns of Care analysis of asymptomatic Stage IV colon cancer diagnosed in 2014, almost one quarter of patients had no treatment and their median survival was 1 month [1]. A National Cancer Database analysis of Stage IV colon cancer diagnosed in 2006-2012 found 28.6% received no therapy [4], and population-level management has been shown to vary widely [5]. Most of this work focused on colon cancer, on earlier diagnosis years, or on selected subgroups, and little is known about who goes untreated in more recent years across colon and rectal cancer.
Racial, ethnic and socioeconomic disparities in colorectal cancer outcomes are well documented, particularly for metastatic disease [6,7,8], and living in a lower-socioeconomic-status neighborhood is associated with higher colorectal cancer mortality [9]. A recent study of early-onset metastatic colorectal cancer found worse 3-year survival for Black patients and for patients in the lowest neighborhood-SES quintile, with only the SES association remaining significant after adjustment [10]; findings for Asian and Hispanic patients across the literature have been mixed [11]. Cancer registries cover whole populations but lack treatment detail and may over-represent urban populations [12]. The extent to which differences in treatment receipt are associated with survival disparities in Stage IV disease across all ages, and how county income and rurality contribute, remains unclear.
Using SEER data [13], this study therefore (1) described the use of chemotherapy, surgery and radiation among adults with Stage IV colorectal cancer diagnosed in 2018-2023 and the share with no recorded treatment; (2) identified factors associated with no recorded treatment; (3) examined survival by race/ethnicity, county income and rurality and how much the observed differences were attenuated after adjustment for recorded treatment; and (4) tested whether these associations differ by age, tumor site and race/ethnicity.
Methods
Data source and study population. This retrospective population-based cohort study used data from the Surveillance, Epidemiology, and End Results (SEER) Program of the National Cancer Institute [13]. Data were extracted using SEER*Stat from the Incidence – SEER Research Data, 17 Registries, November 2025 Submission (2000–2023), released in April 2026. The database was linked to time-dependent county-level attributes (1990–2024), including household income and rural–urban characteristics. The study population comprised adults aged 20 years or older diagnosed with stage IV colorectal cancer between 2018 and 2023 (Extent of Disease [EOD] 2018 stage group 4, 4A, 4B or 4C). The age-group variable cannot isolate ages 18-19, so patients under 20 were excluded. Patients were also excluded if stage was unknown or not applicable (324), the tumor was not a first primary by international rules (876), survival time was unknown (24), or the primary site was the appendix (2,097), leaving 44,707 patients. For the regression and survival analyses, a further 200 patients with unknown surgery status, unknown race/ethnicity, or unknown county income were excluded, giving a modeling cohort of 44,507 (30,151 deaths). Patients with unknown rurality (n = 103) were retained as a separate category (shown as Unknown in Table 1 and Table S1) and are not reported in the other tables.
Exposures. Race/ethnicity (non-Hispanic White, non-Hispanic Black, Hispanic, non-Hispanic Asian/Pacific Islander, non-Hispanic American Indian/Alaska Native), county median household income (inflation-adjusted to 2024; <$75k, $75-<$90k, $90-<$110k, ≥$110k) and rural-urban continuum code (large metro, other metro, nonmetro adjacent, nonmetro nonadjacent) were the main exposures. Income and rurality are county-level measures.
Treatment. Chemotherapy was recorded as yes versus no/unknown. Surgery of the primary site was classified according to Appendix C of the SEER Program Coding and Staging Manual [14,15], harmonizing the 2018-2022 numeric codes and the 2023 four-character codes: codes 10-29 and A100-A290 as local tumor destruction or excision; codes 30-80 and A300-A800 as resection (partial, subtotal or total colectomy, proctectomy, or resection with contiguous organs); codes 90 and A900 as surgery not otherwise specified; codes 99 and A990 as unknown (excluded from the modeling cohort); and codes 00 and A000 as no surgery. Radiation was any radiation recorded. Patients were placed in mutually exclusive groups: surgery plus chemotherapy, chemotherapy without surgery, surgery without chemotherapy, radiation only, and no recorded treatment (no chemotherapy, surgery or radiation recorded). The term no recorded treatment is used because registry data can miss treatment given outside the reporting facility.
Covariates. Age group, sex, year of diagnosis, tumor site (right colon, left colon, rectum, other/not otherwise specified), stage group (4, 4A, 4B, 4C), grade, histology, number of metastatic sites at diagnosis, and pretreatment CEA status.
Outcomes. Overall survival and cancer-specific survival, measured in completed months from diagnosis (0.5 months added so that deaths in month 0 contribute follow-up). Follow-up ends December 2023, so patients diagnosed in 2023 have under 12 months of follow-up.
Statistical analysis. Characteristics were compared across groups using column percentages and standardized differences (values above 0.10 considered notable). Trends in treatment use by year were tested with the Cochran-Armitage test. Factors associated with no recorded treatment were examined with logistic regression. Survival was estimated with Kaplan-Meier methods (curves with numbers at risk; 1-, 2- and 3-year survival with 95% confidence intervals; log-rank tests) and restricted mean survival time up to 36 months. Cox proportional hazards models were built sequentially: demographics and year (M1), plus tumor and disease characteristics (M2), plus county income and rurality (M3), plus treatment group (M4). Because treatment is determined after diagnosis, models including treatment were fit in a cohort of patients alive at 3 months (landmark analysis) with the clock restarted at 3 months, to limit immortal time bias. Cancer-specific survival was analyzed with Fine-Gray models treating death from other causes as a competing event. Interactions were tested with likelihood-ratio tests and followed by stratified models. Sensitivity analyses used 1- and 6-month landmarks, adenocarcinoma only, exclusion of 2023 diagnoses, age strata, and colon versus rectum. The proportional hazards assumption appeared violated for race/ethnicity on log-log plots, so hazard ratios are interpreted as average effects over follow-up and are presented alongside survival probabilities and restricted mean survival time. Treatment-group estimates, restricted mean survival time differences and changes in hazard ratios after adding treatment are reported as observational associations (observed attenuation) and not as causal or mediated effects; no formal mediation analysis was performed. Statistical models, Kaplan-Meier estimates and restricted mean survival time were computed in SAS OnDemand for Academics; descriptive tables and figures were produced in Python (pandas and matplotlib) from the same analytic dataset and checked against the SAS output.
Use of AI tools. Claude (Anthropic), a large language model, was used to assist with SAS code drafting and debugging, figure formatting and language editing. The author conceived the study, made the analytic decisions, and reviewed and interpreted the results. The statistical models were run on the study data in SAS, and descriptive tables and figures were produced and cross-checked in Python. The author reviewed and edited all content and takes full responsibility for it.
Results
Cohort and treatment patterns
Of 48,028 patients, 44,707 met the inclusion criteria and 44,507 were analyzed (Figure S1, Table 1). Overall, about 64% received chemotherapy and about one quarter (24.8%) had no recorded treatment (Table 2). Median survival was 1 month (interquartile range 0-4) in the no-recorded-treatment group in the crude analysis. Standardized differences showed that Black patients differed from White patients mainly in county income (0.25), age (0.22), rurality (0.21) and tumor site (0.18), and Hispanic patients differed in rurality (0.40), income (0.31) and age (0.29). Lowest-income and highest-income counties differed sharply in rurality (standardized difference 2.26): only 16% of patients in the lowest-income counties lived in large metro counties versus 91% in the highest-income counties, so income and rurality are closely related.
Percentages are column percentages. NH, non-Hispanic; PI, Pacific Islander; AI/AN, American Indian/Alaska Native. Rurality is unknown for 103 patients (shown as Unknown), almost all AI/AN. County income categories are time-dependent county attributes in 2024 dollars, so the distribution shifts across diagnosis years.
Treatment patterns
Treatment use changed over time (Table S2). No recorded treatment rose from 23.4% in 2018 to 26.9% in 2023 (Cochran-Armitage test for trend, P < .0001), while chemotherapy (P = .0002), primary tumor resection (P < .0001) and radiation (P = .035) all declined. The resection decline began before the 2023 change in surgery coding, but the 2023 step should still be read with care.
Factors associated with no recorded treatment
After adjustment (Table 3, Figure S2), age was by far the strongest factor. Black and Hispanic patients, patients in lower-income counties, and patients in the most rural counties had modestly higher odds of no recorded treatment, and the odds rose with each year of diagnosis. Sex was not associated. Other/NOS tumor site, other histology and undocumented CEA were strongly associated with no recorded treatment, which probably reflects less complete work-up and should not be read as causes. Whether a patient who refused or was not recommended surgery received other care is not captured here.
Survival
Survival differed by race/ethnicity, county income and rurality (log-rank P < .0001 for each; Table S3, Figure 1, Figure S3 and Figure S4). Black patients had the lowest 3-year survival (18.6%), and survival rose with county income and fell with increasing rurality.
Survival curves by treatment group are shown in Figure S5 and Table S4. Restricted mean survival time (RMST) up to 36 months by group (point estimates; difference from reference in months): Black -1.08 vs White (White 16.55; Hispanic +2.21; Asian/PI +2.36; AI/AN +0.58); income <$75k -2.04, $75-<$90k -1.18, $90-<$110k -0.92 vs ≥$110k (18.09); other metro -0.75, nonmetro adjacent -1.51, nonmetro nonadjacent -2.18 vs large metro (17.41). Compared with chemotherapy alone, unadjusted restricted mean survival time was 8.50 months longer for surgery plus chemotherapy and 7.32 months shorter for no recorded treatment; these are descriptive associations and not treatment effects.
Adjusted hazard ratios
The Black-White hazard ratio was attenuated from 1.18 to 1.13 after treatment group was added to the model (Table 4; a 22% reduction in the log hazard ratio). This is an observed attenuation and does not by itself establish mediation; most of the difference remained after this adjustment. The Hispanic and Asian/PI survival advantages seen in the crude curves disappeared after adjustment (hazard ratios close to 1).
Adding treatment did not attenuate the income or rurality hazard ratios (Table S5, Figure S6). Because income and rurality are closely related in these data, estimates for each are less stable when both are in the model.
Hazard ratios by treatment group are given in Table S6. These are associations. Patients who receive surgery plus chemotherapy are usually younger, fitter, and have resectable disease, and the treatment variable is assessed from first-course data.
Effect modification
Likelihood-ratio tests supported interactions of race/ethnicity with age (chi-square 47.4, 12 df, P < .0001), treatment with age (94.8, 12 df, P < .0001), treatment with tumor site (125.1, 12 df, P < .0001) and treatment with race/ethnicity (42.6, 16 df, P = .0003), and borderline evidence for race by rurality (21.5, 12 df, P = .044).
The survival disadvantage for Black patients was largest in patients under 50 and absent at 75 and older (Table 5). Surgery plus chemotherapy was associated with lower mortality in every age group, but the association weakened with age (hazard ratio 0.38 [95% CI 0.35-0.41] under 50, 0.44 at 50-64, 0.49 at 65-74 and 0.55 [0.51-0.60] at 75 and older).
Sensitivity analyses
The Black-White hazard ratio was stable: 1.18 (adenocarcinoma only), 1.16 (1-month landmark), 1.19 (6-month landmark), 1.14 (excluding 2023), 1.12 (rectum only) and 1.16 (colon only). It was 1.24 (1.18-1.30) under age 65 and 1.06 (1.01-1.11) at 65 and older.
Discussion
Principal findings. In this national registry cohort of 44,507 adults with Stage IV colorectal cancer diagnosed in 2018-2023, about one in four had no recorded chemotherapy, surgery or radiation, and their crude median survival was about 1 month. Age dominated treatment receipt, while race/ethnicity, county income and rurality showed smaller but consistent differences. Survival was worse for Black patients and for residents of lower-income and more rural counties. After additional adjustment for recorded treatment, the Black-White hazard ratio was attenuated by about one fifth (on the log scale), and the income and rurality hazard ratios were essentially unchanged. This attenuation is observational and does not establish that differences in treatment mediate the disparities.
Treatment patterns. The share with no recorded treatment (24.8%) is close to the 23% reported in the SEER Patterns of Care analysis of 2014 diagnoses [1] and the 28.6% in the National Cancer Database cohort of 2006-2012 diagnoses [4], and the 1-month median survival in this group matches the earlier SEER finding [1]. The gap has not closed: in the analyzed cohort, no recorded treatment rose from 23.4% in 2018 to 26.9% in 2023, and primary tumor resection fell from 40.1% to 32.8% (the surgery coding system changed in 2023, so the final step of that trend should be read with care). Among the 27,574 eligible patients without primary tumor surgery, 95% were coded as surgery not recommended and about 2% as refused. The strong age gradient (odds ratio 7.26 at 75 and older) probably reflects frailty, comorbidity and patient preference, none of which SEER records [1]. The strong associations of other tumor site, other histology and undocumented CEA with no recorded treatment are best read as markers of limited work-up and not as causes.
Disparities. The Black-White survival difference is consistent with earlier work in colorectal cancer, particularly in metastatic disease [6,7,8,10]. It was largest in patients under 50 (hazard ratio 1.45) and absent at 75 and older (1.01). The early-onset study in a community oncology database reported a Black hazard ratio of 1.08 that was not statistically significant after adjusting for insurance, tumor markers and regimen [10]. The present estimate is less adjusted and includes patients who never started treatment, so the two are not directly comparable, but both indicate a survival disadvantage that persisted after adjustment for the treatment data available. The Hispanic and Asian/Pacific Islander survival advantages in the crude curves disappeared after adjustment, which suggests they reflect age and tumor characteristics, and the aggregated categories may hide differences between subgroups [11]. Lower county income and greater rurality were associated with higher mortality (hazard ratios 1.14 and 1.08), in line with the neighborhood-SES literature [9,10]. Because county income and rurality are closely linked in these data, their effects cannot be separated.
Treatment and survival. Surgery plus chemotherapy was associated with much longer survival (adjusted hazard ratio 0.46; unadjusted restricted mean survival time 8.5 months longer at 36 months than chemotherapy alone), while no recorded treatment and radiation only were associated with worse survival. These associations are heavily confounded. Randomized trials in patients with unresectable metastases found no survival benefit from adding primary tumor resection to chemotherapy (JCOG1007: median 25.9 vs 26.7 months) [16] and a higher 60-day mortality with resection (11% vs 3% in CAIRO4) [17]. Registry-based propensity-matched studies have reported survival benefits for resecting both the primary tumor and liver metastases in colon cancer [18], but these cannot establish causation. The landmark analysis reduces immortal time bias but cannot remove selection of fitter patients with resectable disease into the surgery-plus-chemotherapy group.
Implications. Roughly one in four patients, mostly older adults, had no recorded treatment, and that proportion is not falling. Understanding whether this reflects patient choice, frailty, access or incomplete capture is a priority and needs linked data with comorbidity, insurance and regimen detail. For real-world evidence and drug development, the survival figures here (3-year survival of 18.6-27.7% by race/ethnicity, and about 10% at 3 years in the untreated group after the 3-month landmark) give registry benchmarks for comparator populations, and the untreated population may represent an unmet need.
Strengths. The cohort is large and national, includes colon and rectal cancer, all adult ages and recent years, adds county income and rurality, and accounts for metastatic burden. Landmark and competing-risk analyses were used, and the main findings were stable across sensitivity analyses.
Limitations
- SEER lacks drug regimens, biomarkers (KRAS, BRAF, MSI), comorbidity, performance status, insurance and patient choice.
- Chemotherapy is coded yes versus no/unknown, so no recorded treatment may include care that was not captured.
- Income and rurality are county-level and strongly related to each other.
- Follow-up ends December 2023, so recent diagnoses have short follow-up.
- The proportional hazards assumption was not met for race/ethnicity.
- Many subgroup comparisons were made; stratified results are exploratory.
- The 3-month landmark treats treatment as recorded at diagnosis, and some treatment begins later.
- Surgery coding changed in 2023; the classification was mapped between the two coding systems, but small differences in code definitions cannot be excluded.
Conclusions
About one in four adults with Stage IV colorectal cancer diagnosed in 2018-2023 had no recorded treatment, mostly older adults. Survival differences by race/ethnicity (largest under age 50), county income and rurality persisted after adjustment, with only slight attenuation of the Black-White difference after adjustment for recorded treatment. Linked data on insurance, comorbidity, biomarkers and drug regimens are needed to understand these gaps.
Declarations
Ethics Approval and Consent to Participate
This retrospective, population-based study used de-identified cancer registry data from the National Cancer Institute’s Surveillance, Epidemiology, and End Results (SEER) Program. Data were accessed through SEER*Stat following authorization under the SEER Research Data Agreement. The study involved secondary analysis of existing registry records, without direct participant contact or access to personally identifiable information. Because the data are de-identified, the author considered this analysis not human subjects research. Authorization to access SEER data was granted through the National Cancer Institute’s established data-access procedures. Individual informed consent was not obtained because the study used existing de-identified registry data without direct participant involvement. No institutional determination regarding exemption from review or waiver of informed consent has been obtained.
Consent for Publication
The manuscript contains no personally identifiable patient information. Individual consent for publication was therefore not applicable.
Data Availability
The data supporting this study were obtained from the National Cancer Institute’s Surveillance, Epidemiology, and End Results (SEER) Program. The analysis used the Incidence – SEER Research Data, 17 Registries, November 2025 Submission (2000–2023), together with associated county-level socioeconomic and rural–urban characteristics. The data are available to eligible researchers through the SEER data-access process, subject to the applicable SEER Research Data Agreement. Individual-level records cannot be redistributed by the author because access and use are governed by the SEER data agreement. Information on obtaining SEER data access is available at https://seer.cancer.gov/data/access.html. Statistical models were fitted using SAS OnDemand for Academics. Descriptive tables and figures were generated using Python (pandas and matplotlib) and checked against the SAS output. The corresponding SAS and Python analysis programs and supporting research documentation are available from the corresponding author upon reasonable request.
Competing Interests
The author declares no competing interests.
Research Registration
Not applicable. This study was a retrospective observational analysis of existing cancer registry data and did not involve a clinical trial or prospective participant recruitment.
Supplementary Materials
The following supporting information can be downloaded at the website of this paper posted on Preprints.org”
Author Contributions
Olakunle Olorunkemi: Conceptualization, methodology, data curation, formal analysis, investigation, visualization, writing—original draft preparation, and writing—review and editing. The author reviewed and approved the final manuscript and accepts full responsibility for its scientific content, accuracy, and integrity.
Funding
This research received no specific grant from any funding agency in the public, commercial, or not-for-profit sectors.
Acknowledgments
The author acknowledges the National Cancer Institute’s Surveillance, Epidemiology, and End Results (SEER) Program and the participating SEER cancer registries for collecting, maintaining, and making population-based cancer surveillance data available for scientific research.
References
- Weaver, L.; Tran, C.G.; Kahl, A.R.; et al. Patterns of care in patients with asymptomatic stage IV colon cancer: a population-based analysis. Surgery 2025, 184, 109408. [Google Scholar] [CrossRef] [PubMed]
- Siegel, R.L.; Wagle, N.S.; Cercek, A.; Smith, R.A.; Jemal, A. Colorectal cancer statistics, 2023. CA Cancer J. Clin. 2023, 73, 233–254. [Google Scholar] [CrossRef] [PubMed]
- Vogel, J.D.; Felder, S.I.; Bhama, A.R.; et al. The American Society of Colon and Rectal Surgeons clinical practice guidelines for the management of colon cancer. Dis. Colon Rectum 2022, 65, 148–177. [Google Scholar] [CrossRef] [PubMed]
- Xu, Z.; Becerra, A.Z.; Fleming, F.J.; et al. Treatments for stage IV colon cancer and overall survival. J. Surg. Res. 2019, 242, 47–54. [Google Scholar] [CrossRef] [PubMed]
- Gao, X.; Kahl, A.R.; Goffredo, P.; et al. Treatment of stage IV colon cancer in the United States: a patterns-of-care analysis. J. Natl. Compr. Canc Netw. 2020, 18, 689–699. [Google Scholar] [CrossRef] [PubMed]
- Murphy, C.C.; Wallace, K.; Sandler, R.S.; Baron, J.A. Racial disparities in incidence of young-onset colorectal cancer and patient survival. Gastroenterology 2019, 156, 958–965. [Google Scholar] [CrossRef] [PubMed]
- Holowatyj, A.N.; Ruterbusch, J.J.; Rozek, L.S.; Cote, M.L.; Stoffel, E.M. Racial/ethnic disparities in survival among patients with young-onset colorectal cancer. J. Clin. Oncol. 2016, 34, 2148–2156. [Google Scholar] [CrossRef] [PubMed]
- Robbins, A.S.; Siegel, R.L.; Jemal, A. Racial disparities in stage-specific colorectal cancer mortality rates from 1985 to 2008. J. Clin. Oncol. 2012, 30, 401–405. [Google Scholar] [CrossRef] [PubMed]
- Jalili, F.; Hajizadeh, M.; Mehrabani, S.; Ghoreishy, S.M.; MacIsaac, F. The association between neighborhood socioeconomic status and the risk of incidence and mortality of colorectal cancer: a systematic review and meta-analysis of 1,678,582 participants. Cancer Epidemiol. 2024, 91, 102598. [Google Scholar] [CrossRef] [PubMed]
- Wang, J.S.; Johnson, B.; Murphy, C.C. Racial, ethnic, and socioeconomic survival disparities in early-onset metastatic colorectal cancer. JAMA Netw. Open 2026, 9(1), e2553146. [Google Scholar] [CrossRef] [PubMed]
- Demb, J.; Gomez, S.L.; Canchola, A.J.; et al. Racial and ethnic variation in survival in early-onset colorectal cancer. JAMA Netw. Open 2024, 7(11), e2446820. [Google Scholar] [CrossRef] [PubMed]
- Kuo, T.M.; Mobley, L.R. How generalizable are the SEER registries to the cancer populations of the USA? Cancer Causes Control 2016, 27, 1117–1126. [Google Scholar] [CrossRef] [PubMed]
- Surveillance, Epidemiology, and End Results (SEER) Program. SEER*Stat Database: Incidence – SEER Research Data, 17 Registries, November 2025 Submission (2000–2023), linked to County Attributes – Time Dependent (1990–2024) Income/Rurality. National Cancer Institute, Division of Cancer Control and Population Sciences, Surveillance Research Program, April 2026. Available online: https://seer.cancer.gov/.
- SEER Program Coding and Staging Manual 2018. Appendix C: Surgery Codes (Colon, Rectosigmoid, Rectum). National Cancer Institute, Surveillance, Epidemiology, and End Results Program, 2018. Available online: https://seer.cancer.gov/archive/manuals/2018/AppendixC/Surgery_Codes_Colon_2018.pdf.
- SEER Program Coding and Staging Manual 2023. Appendix C: Surgery Codes (Colon, Rectosigmoid, Rectum). National Cancer Institute, Surveillance, Epidemiology, and End Results Program, 2023. Available online: https://seer.cancer.gov/archive/manuals/2023/AppendixC/Surgery_Codes_Colon_2023.pdf.
- Kanemitsu, Y.; Shitara, K.; Mizusawa, J.; et al. Primary tumor resection plus chemotherapy versus chemotherapy alone for colorectal cancer patients with asymptomatic, synchronous unresectable metastases (JCOG1007; iPACS): a randomized clinical trial. J. Clin. Oncol. 2021, 39, 1098–1107. [Google Scholar] [CrossRef] [PubMed]
- van der Kruijssen, D.E.W.; Elias, S.G.; Vink, G.R.; et al. Sixty-day mortality of patients with metastatic colorectal cancer randomized to systemic treatment vs primary tumor resection followed by systemic treatment: the CAIRO4 phase 3 randomized clinical trial. JAMA Surg. 2021, 156, 1093–1101. [Google Scholar] [CrossRef] [PubMed]
- Qiao, Y.; Qiao, Y.; Li, H.; Fu, J.; You, S. Survival benefit of primary and metastatic tumor resection for colon cancer with liver metastases: a population based, propensity score-matched study. Front Surg. 2022, 9, 959826. [Google Scholar] [CrossRef] [PubMed]
Figure 1.
Kaplan-Meier overall survival by race/ethnicity. Numbers at risk are shown below the plot. P value from the log-rank test. NH, non-Hispanic; PI, Pacific Islander; AI/AN, American Indian/Alaska Native.
Figure 1.
Kaplan-Meier overall survival by race/ethnicity. Numbers at risk are shown below the plot. P value from the log-rank test. NH, non-Hispanic; PI, Pacific Islander; AI/AN, American Indian/Alaska Native.
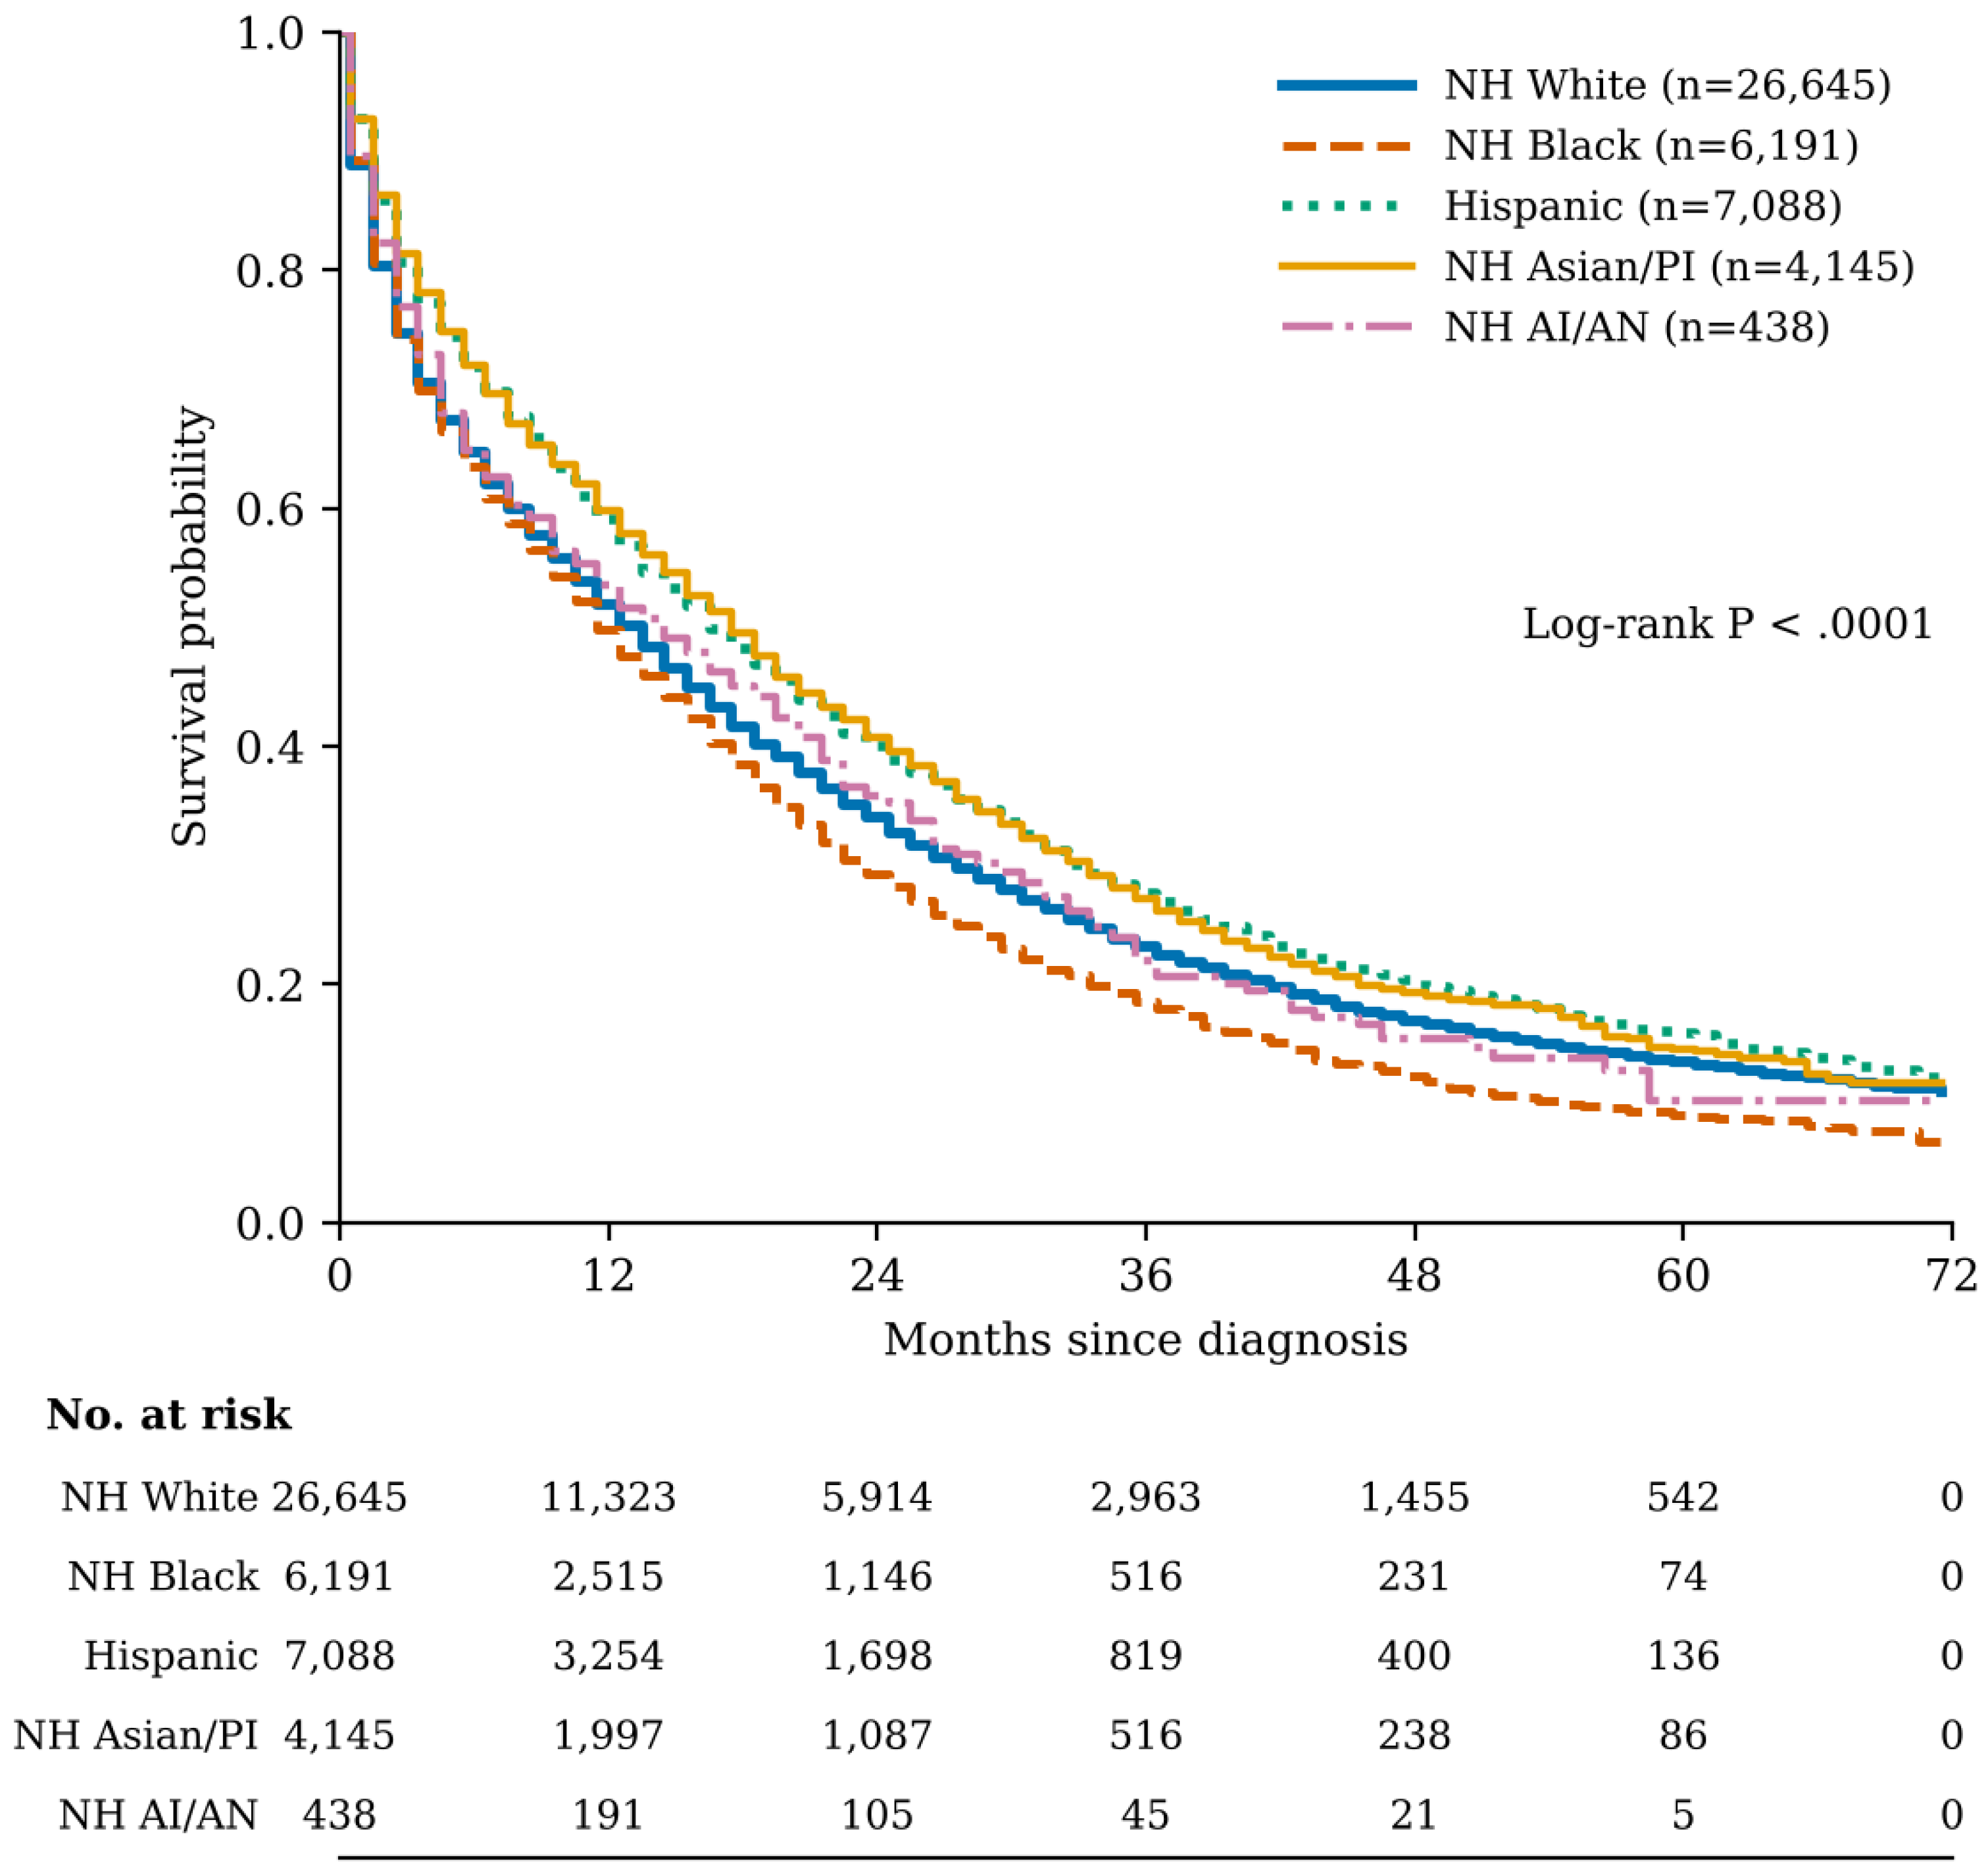

Table 1.
Characteristics of adults with Stage IV colorectal cancer by race/ethnicity, SEER 2018-2023, n (column %).
Table 1.
Characteristics of adults with Stage IV colorectal cancer by race/ethnicity, SEER 2018-2023, n (column %).
| Characteristic | Overall | NH White (n=26,645) | NH Black (n=6,191) | Hispanic (n=7,088) | NH Asian/PI (n=4,145) | NH AI/AN (n=438) |
|---|---|---|---|---|---|---|
| Age group, years | ||||||
| <50 | 6,570 (14.8) | 3,244 (12.2) | 905 (14.6) | 1,606 (22.7) | 739 (17.8) | 76 (17.4) |
| 50-64 | 14,997 (33.7) | 8,358 (31.4) | 2,312 (37.3) | 2,729 (38.5) | 1,442 (34.8) | 156 (35.6) |
| 65-74 | 11,253 (25.3) | 7,025 (26.4) | 1,697 (27.4) | 1,479 (20.9) | 936 (22.6) | 116 (26.5) |
| 75+ | 11,687 (26.3) | 8,018 (30.1) | 1,277 (20.6) | 1,274 (18.0) | 1,028 (24.8) | 90 (20.5) |
| Sex | ||||||
| Male | 24,714 (55.5) | 14,791 (55.5) | 3,327 (53.7) | 4,043 (57.0) | 2,304 (55.6) | 249 (56.8) |
| Female | 19,793 (44.5) | 11,854 (44.5) | 2,864 (46.3) | 3,045 (43.0) | 1,841 (44.4) | 189 (43.2) |
| County median household income | ||||||
| <$75k | 12,181 (27.4) | 8,171 (30.7) | 2,368 (38.2) | 1,253 (17.7) | 232 (5.6) | 157 (35.8) |
| $75-<$90k | 10,834 (24.3) | 6,213 (23.3) | 1,706 (27.6) | 2,045 (28.9) | 819 (19.8) | 51 (11.6) |
| $90-<$110k | 12,622 (28.4) | 6,928 (26.0) | 1,437 (23.2) | 2,513 (35.5) | 1,561 (37.7) | 183 (41.8) |
| >=$110k | 8,870 (19.9) | 5,333 (20.0) | 680 (11.0) | 1,277 (18.0) | 1,533 (37.0) | 47 (10.7) |
| Rurality | ||||||
| Metro >=1M | 26,669 (59.9) | 14,104 (52.9) | 3,840 (62.0) | 5,088 (71.8) | 3,506 (84.6) | 131 (29.9) |
| Other metro | 12,151 (27.3) | 8,116 (30.5) | 1,727 (27.9) | 1,665 (23.5) | 520 (12.5) | 123 (28.1) |
| Nonmetro adjacent | 3,370 (7.6) | 2,642 (9.9) | 482 (7.8) | 174 (2.5) | 35 (0.8) | 37 (8.4) |
| Nonmetro nonadjacent | 2,214 (5.0) | 1,783 (6.7) | 142 (2.3) | 160 (2.3) | 84 (2.0) | 45 (10.3) |
| Unknown | 103 (0.2) | 0 (0.0) | 0 (0.0) | 1 (0.0) | 0 (0.0) | 102 (23.3) |
| Tumor site | ||||||
| Right colon | 15,513 (34.9) | 9,567 (35.9) | 2,592 (41.9) | 2,175 (30.7) | 1,039 (25.1) | 140 (32.0) |
| Left colon | 11,358 (25.5) | 6,420 (24.1) | 1,512 (24.4) | 1,932 (27.3) | 1,383 (33.4) | 111 (25.3) |
| Rectum | 13,292 (29.9) | 8,055 (30.2) | 1,395 (22.5) | 2,301 (32.5) | 1,401 (33.8) | 140 (32.0) |
| Other/NOS | 4,344 (9.8) | 2,603 (9.8) | 692 (11.2) | 680 (9.6) | 322 (7.8) | 47 (10.7) |
| Stage group | ||||||
| 4 | 3,186 (7.2) | 1,843 (6.9) | 500 (8.1) | 543 (7.7) | 266 (6.4) | 34 (7.8) |
| 4A | 20,414 (45.9) | 12,218 (45.9) | 2,801 (45.2) | 3,290 (46.4) | 1,915 (46.2) | 190 (43.4) |
| 4B | 12,577 (28.3) | 7,543 (28.3) | 1,777 (28.7) | 1,971 (27.8) | 1,151 (27.8) | 135 (30.8) |
| 4C | 8,330 (18.7) | 5,041 (18.9) | 1,113 (18.0) | 1,284 (18.1) | 813 (19.6) | 79 (18.0) |
| Grade | ||||||
| Well | 1,724 (3.9) | 912 (3.4) | 210 (3.4) | 384 (5.4) | 190 (4.6) | 28 (6.4) |
| Moderate | 15,237 (34.2) | 8,851 (33.2) | 2,035 (32.9) | 2,664 (37.6) | 1,570 (37.9) | 117 (26.7) |
| Poor/undiff | 4,985 (11.2) | 3,194 (12.0) | 536 (8.7) | 764 (10.8) | 448 (10.8) | 43 (9.8) |
| Unknown | 22,561 (50.7) | 13,688 (51.4) | 3,410 (55.1) | 3,276 (46.2) | 1,937 (46.7) | 250 (57.1) |
| Histology | ||||||
| Adenocarcinoma NOS | 37,765 (84.9) | 22,320 (83.8) | 5,275 (85.2) | 6,149 (86.8) | 3,655 (88.2) | 366 (83.6) |
| Mucinous | 1,654 (3.7) | 966 (3.6) | 258 (4.2) | 294 (4.1) | 119 (2.9) | 17 (3.9) |
| Signet ring | 507 (1.1) | 312 (1.2) | 60 (1.0) | 77 (1.1) | 50 (1.2) | 8 (1.8) |
| Other | 4,581 (10.3) | 3,047 (11.4) | 598 (9.7) | 568 (8.0) | 321 (7.7) | 47 (10.7) |
| Metastatic sites at diagnosis | ||||||
| <=1 | 26,219 (58.9) | 15,847 (59.5) | 3,565 (57.6) | 4,138 (58.4) | 2,422 (58.4) | 247 (56.4) |
| 2 | 11,452 (25.7) | 6,868 (25.8) | 1,623 (26.2) | 1,777 (25.1) | 1,062 (25.6) | 122 (27.9) |
| 3+ | 5,738 (12.9) | 3,401 (12.8) | 827 (13.4) | 906 (12.8) | 550 (13.3) | 54 (12.3) |
| Unknown | 1,098 (2.5) | 529 (2.0) | 176 (2.8) | 267 (3.8) | 111 (2.7) | 15 (3.4) |
| Pretreatment CEA | ||||||
| Elevated | 27,024 (60.7) | 15,704 (58.9) | 3,991 (64.5) | 4,322 (61.0) | 2,738 (66.1) | 269 (61.4) |
| Normal/borderline | 5,487 (12.3) | 3,531 (13.3) | 590 (9.5) | 868 (12.2) | 445 (10.7) | 53 (12.1) |
| Not documented | 11,996 (27.0) | 7,410 (27.8) | 1,610 (26.0) | 1,898 (26.8) | 962 (23.2) | 116 (26.5) |
| Year of diagnosis | ||||||
| 2018 | 7,135 (16.0) | 4,437 (16.7) | 1,012 (16.3) | 1,025 (14.5) | 601 (14.5) | 60 (13.7) |
| 2019 | 7,425 (16.7) | 4,546 (17.1) | 1,036 (16.7) | 1,099 (15.5) | 676 (16.3) | 68 (15.5) |
| 2020 | 7,091 (15.9) | 4,315 (16.2) | 961 (15.5) | 1,062 (15.0) | 687 (16.6) | 66 (15.1) |
| 2021 | 7,511 (16.9) | 4,365 (16.4) | 1,066 (17.2) | 1,245 (17.6) | 754 (18.2) | 81 (18.5) |
| 2022 | 7,497 (16.8) | 4,382 (16.4) | 1,079 (17.4) | 1,273 (18.0) | 690 (16.6) | 73 (16.7) |
| 2023 | 7,848 (17.6) | 4,600 (17.3) | 1,037 (16.8) | 1,384 (19.5) | 737 (17.8) | 90 (20.5) |
| Treatment group | ||||||
| Surgery + chemo | 12,582 (28.3) | 7,516 (28.2) | 1,592 (25.7) | 2,077 (29.3) | 1,290 (31.1) | 107 (24.4) |
| Chemo, no surgery | 15,892 (35.7) | 9,307 (34.9) | 2,199 (35.5) | 2,682 (37.8) | 1,551 (37.4) | 153 (34.9) |
| Surgery, no chemo | 4,428 (9.9) | 2,739 (10.3) | 633 (10.2) | 646 (9.1) | 366 (8.8) | 44 (10.0) |
| Radiation only | 548 (1.2) | 333 (1.2) | 77 (1.2) | 71 (1.0) | 64 (1.5) | 3 (0.7) |
| None recorded | 11,057 (24.8) | 6,750 (25.3) | 1,690 (27.3) | 1,612 (22.7) | 874 (21.1) | 131 (29.9) |
Table 2.
Treatment received by race/ethnicity, county income, rurality and age (% of patients).
| Group | N | Chemotherapy | Primary tumor resection | Radiation | No recorded treatment |
|---|---|---|---|---|---|
| NH White | 26,645 | 63.1 | 37.1 | 12.1 | 25.3 |
| NH Black | 6,191 | 61.2 | 34.4 | 9.1 | 27.3 |
| Hispanic | 7,088 | 67.1 | 36.6 | 13.3 | 22.7 |
| NH Asian/PI | 4,145 | 68.5 | 38.3 | 14.0 | 21.1 |
| NH AI/AN | 438 | 59.4 | 34.0 | 11.0 | 29.9 |
| Income <$75k | 12,181 | 61.8 | 39.2 | 12.6 | 25.8 |
| Income $75-<$90k | 10,834 | 63.3 | 36.5 | 10.9 | 25.0 |
| Income $90-<$110k | 12,622 | 63.9 | 35.5 | 12.2 | 25.2 |
| Income ≥$110k | 8,870 | 67.8 | 35.5 | 12.5 | 22.8 |
| Large metro | 26,669 | 64.7 | 35.8 | 11.8 | 24.5 |
| Other metro | 12,151 | 64.0 | 38.3 | 12.8 | 24.2 |
| Nonmetro adjacent | 3,370 | 62.6 | 39.3 | 11.9 | 25.7 |
| Nonmetro nonadjacent | 2,214 | 58.2 | 36.1 | 10.8 | 30.1 |
| Age <50 | 6,570 | 86.5 | 46.3 | 17.9 | 8.3 |
| Age 50-64 | 14,997 | 75.1 | 39.4 | 14.7 | 16.7 |
| Age 65-74 | 11,253 | 62.9 | 35.8 | 10.3 | 25.3 |
| Age 75+ | 11,687 | 38.1 | 29.0 | 7.1 | 44.2 |
Table 3.
Adjusted odds ratios for no recorded treatment (model A2).
| Factor | OR (95% CI) |
|---|---|
| Black vs White | 1.31 (1.22-1.41) |
| Hispanic vs White | 1.15 (1.07-1.24) |
| Asian/PI vs White | 0.96 (0.87-1.05) |
| AI/AN vs White | 1.24 (0.94-1.64) |
| Age 50-64 vs <50 | 2.05 (1.85-2.27) |
| Age 65-74 vs <50 | 3.31 (2.99-3.67) |
| Age 75+ vs <50 | 7.26 (6.56-8.03) |
| Male vs female | 1.00 (0.95-1.05) |
| Income <$75k vs ≥$110k | 1.16 (1.06-1.27) |
| Income $75-<$90k vs ≥$110k | 1.16 (1.07-1.25) |
| Income $90-<$110k vs ≥$110k | 1.10 (1.02-1.18) |
| Other metro vs large metro | 0.93 (0.87-0.99) |
| Nonmetro adjacent vs large metro | 0.95 (0.85-1.06) |
| Nonmetro nonadjacent vs large metro | 1.23 (1.09-1.40) |
| Per year of diagnosis | 1.06 (1.04-1.08) |
| Rectum vs right colon | 1.14 (1.07-1.21) |
| Other/NOS site vs right colon | 3.11 (2.87-3.37) |
| 2 metastatic sites vs ≤1 | 1.40 (1.29-1.52) |
| 3+ metastatic sites vs ≤1 | 1.56 (1.42-1.71) |
| CEA elevated vs normal | 1.52 (1.39-1.66) |
| CEA not documented vs normal | 2.41 (2.19-2.64) |
| Other histology vs adenocarcinoma | 4.41 (4.09-4.76) |
Table 4.
Hazard ratios for death by race/ethnicity (reference NH White).
| Model | Black | Hispanic | Asian/PI | AI/AN |
|---|---|---|---|---|
| M1 full cohort | 1.19 (1.15-1.23) | 0.97 (0.94-1.00) | 0.89 (0.86-0.93) | 1.08 (0.96-1.21) |
| M2 + tumor characteristics | 1.14 (1.11-1.18) | 0.98 (0.94-1.01) | 0.92 (0.88-0.96) | 1.06 (0.95-1.19) |
| M3 + income and rurality | 1.14 (1.10-1.17) | 0.99 (0.95-1.02) | 0.95 (0.91-0.99) | 0.98 (0.86-1.11) |
| M3 landmark cohort | 1.18 (1.13-1.23) | 1.03 (0.98-1.07) | 1.01 (0.96-1.06) | 0.99 (0.85-1.16) |
| M4 landmark, + treatment | 1.13 (1.09-1.18) | 1.00 (0.96-1.04) | 1.01 (0.96-1.07) | 0.90 (0.77-1.06) |
| Cancer-specific, Fine-Gray M3 | 1.06 (1.03-1.10) | 0.99 (0.96-1.03) | 1.01 (0.97-1.05) | 0.97 (0.85-1.12) |
Table 5.
Hazard ratios for death by race/ethnicity within age groups (full cohort, fully adjusted; reference NH White).
Table 5.
Hazard ratios for death by race/ethnicity within age groups (full cohort, fully adjusted; reference NH White).
| Age group | Black | Hispanic | Asian/PI |
|---|---|---|---|
| <50 | 1.45 (1.31-1.60) | 1.06 (0.97-1.15) | 1.04 (0.93-1.16) |
| 50-64 | 1.18 (1.11-1.25) | 0.97 (0.92-1.03) | 0.96 (0.89-1.03) |
| 65-74 | 1.10 (1.03-1.17) | 0.92 (0.86-0.99) | 0.91 (0.83-0.99) |
| 75+ | 1.01 (0.95-1.08) | 1.03 (0.96-1.10) | 0.93 (0.86-1.00) |
Disclaimer/Publisher’s Note: The statements, opinions and data contained in all publications are solely those of the individual author(s) and contributor(s) and not of MDPI and/or the editor(s). MDPI and/or the editor(s) disclaim responsibility for any injury to people or property resulting from any ideas, methods, instructions or products referred to in the content. |
© 2026 by the authors. Licensee MDPI, Basel, Switzerland. This article is an open access article distributed under the terms and conditions of the Creative Commons Attribution (CC BY) license (http://creativecommons.org/licenses/by/4.0/).
Copyright: This open access article is published under a Creative Commons CC BY 4.0 license, which permit the free download, distribution, and reuse, provided that the author and preprint are cited in any reuse.