

Submitted:
14 November 2026
Posted:
17 November 2026
You are already at the latest version
Abstract
Efficient freight wagon utilization is important for the operational sustainability of railway transport, particularly under constrained operating conditions. This study compares the economic and operational characteristics of grain hoppers, gondola cars, and fitting platforms operated by JSC Ukrainian Railways during 2024–2026. The analysis combines 99 monthly wagon usage-rate observations for January 2024–September 2026 with reported empty-run coefficients and transportation speeds. Descriptive statistics are supplemented by productive mileage share (PMS) and relative transportation time saving (RTTS), which characterize loaded-mileage proportions and conditional transportation-time differences. Grain hoppers exhibited the highest usage-rate variability (coefficient of variation: 65.95%), followed by 40-ft fitting platforms (41.05%) and gondola cars (15.83%). The calculated PMS for grain hoppers was 47.39% in 2026, compared with 52.91% for gondola cars and 58.82% for the broader fitting-platform fleet. The largest speed-based difference was observed for grain hoppers in domestic/import transportation, corresponding to an RTTS of 63.67% over an identical distance. The findings reveal category-specific differences in economic conditions, mileage utilization, and transportation speeds. The proposed comparative framework supports rolling-stock resource assessment without implying causal relationships or directly measured environmental benefits.
Keywords:
rail freight transport
; freight wagon utilization
; resource efficiency
; operational sustainability
; wagon usage rates
; empty running
; productive mileage share
; Ukraine
1. Introduction
Rail freight transport plays an important role in the movement of agricultural products, raw materials, industrial commodities, and containerized cargo. Its contribution to sustainable transport development is associated not only with the potential advantages of rail over more energy-intensive transport modes but also with the efficient utilization of rolling stock, infrastructure capacity, and operational time. These resources are limited, and their inefficient use can increase the amount of equipment and capacity required to perform a given volume of transportation. Consequently, improving freight wagon utilization represents an important component of the broader effort to develop economically viable and operationally sustainable railway systems. Recent studies have examined sustainable transport management, the implementation of green logistics principles, and institutional measures supporting rail freight development [1,2,3].
The efficiency of freight wagon utilization is a multidimensional problem. It involves the economic conditions under which wagons are made available, the distribution of their mileage between loaded and empty movements, and the time required to complete transportation operations. These dimensions are interrelated in railway practice, but they cannot be regarded as interchangeable measures of efficiency. A relatively low wagon usage charge does not necessarily indicate productive rolling-stock utilization, while a higher transportation speed does not automatically imply lower operating costs or energy consumption. Similarly, a reduction in empty mileage may improve the use of wagon and infrastructure capacity without necessarily producing a proportional environmental benefit. A meaningful assessment of operational resource efficiency therefore requires the examination of several complementary indicators while preserving their different economic and physical interpretations.
The economic dimension is particularly relevant in freight markets where wagon usage charges vary over time and differ substantially among rolling-stock categories. Such charges influence the conditions under which transport operators and customers obtain access to freight wagons, although they represent only one component of the overall cost of transportation. Wilson and Lakkakula [4] examined secondary railcar markets in grain transportation, while Miller and Wilson [5] investigated changes in railway rates for commodity grain shipments. Zeng et al. [6] developed an evaluation approach to railway freight rates under competitive conditions, and Zajfert and Suchanek [7] examined price elasticity in the Polish rail freight market. These studies illustrate the importance of market structure, competition, and cargo-specific demand in the economic assessment of railway services. However, the distinction between freight transportation tariffs and charges for wagon use must be maintained, since variations in either measure cannot be interpreted directly as changes in the physical productivity of rolling stock.
A second dimension concerns the movement and allocation of empty freight wagons. Empty movements are necessary for repositioning rolling stock between unloading and subsequent loading locations, but they occupy infrastructure capacity and require wagon time without directly generating loaded transportation output. Their extent depends on the spatial distribution of freight demand, the specialization of wagons, network configuration, and the organization of transport operations. Milenković et al. [8] addressed freight wagon fleet size optimization, Ma and Bao [9] examined the distribution of empty railcars in heavy-haul railway operations, and Venes et al. [10] investigated the distribution of empty wagon batches to meet loading demand. These contributions demonstrate the operational importance of matching available rolling stock to freight demand. At the same time, empty running cannot be considered entirely avoidable, since repositioning wagons is an inherent characteristic of many freight transport systems.
From the perspective of resource utilization, the relationship between loaded and empty mileage provides a useful basis for comparing different categories of freight wagons. The empty-run coefficient characterizes one aspect of wagon circulation, but its interpretation can be made more intuitive by expressing the proportion of total mileage performed under load. Such an indicator can help distinguish rolling-stock categories with different mileage compositions and identify areas where additional investigation of wagon allocation may be justified. Nevertheless, loaded mileage alone does not establish the productive output of transportation, since it does not account for cargo mass, wagon capacity, or the amount of freight transported. Its use in sustainability-oriented analysis therefore requires a clear distinction between mileage utilization and broader measures of transport productivity or environmental performance.
Technical characteristics and the condition of freight wagons also influence the possibilities for improving their operational utilization. Stoilov and Purgic [11] investigated the optimization of technical parameters of universal freight wagons, illustrating the importance of rolling-stock design in operational performance. Moya et al. [12] examined freight wagon digitalization for condition monitoring and advanced operation, highlighting the potential contribution of monitoring technologies to the management of rolling-stock condition. At the network level, Barotov et al. [13] investigated the modelling of delivery infrastructure for different types of goods. These studies address different aspects of freight transport efficiency and demonstrate that the effective utilization of rolling stock depends on both wagon characteristics and the organization of transport infrastructure. The present study does not evaluate technical modifications or digital monitoring systems directly, but their consideration helps distinguish the operational indicators examined here from the wider set of factors influencing freight wagon performance.
Transportation speed and the organization of freight flows constitute another dimension of rolling-stock utilization. Freight wagons may be transported through individual dispatches or incorporated into route-based services, including block trains and container trains. These organizational arrangements can differ in their requirements for intermediate processing, classification, shunting, and waiting. Consequently, differences in reported average transportation speeds may have implications for the time during which rolling stock remains committed to the line-haul component of a transport operation. Song et al. [14] investigated container train planning in conjunction with empty-container dispatch, while Krauth and Haalboom [15] examined the economic implications of rerouting wagons within a single-wagonload network. Zhao and Jiang [16] addressed the optimization of railway traffic routing and train formation from a low-carbon perspective. Research on railway operations during infrastructure interruptions further demonstrates the importance of operational organization under network constraints [17].
However, the relationship between transportation speed and resource efficiency requires careful interpretation. A percentage increase in average speed is not equivalent to the same percentage reduction in transportation time. Moreover, transportation time represents only one component of the complete wagon operating cycle, which also includes loading, unloading, terminal handling, waiting, and empty repositioning. Differences between published average speeds for alternative transportation technologies may also reflect route characteristics, traffic composition, and operational priorities. Accordingly, speed-based comparisons can provide useful descriptive information, but they cannot independently establish causal effects on wagon turnover or overall fleet productivity.
These issues are particularly significant for the Ukrainian railway system. Rail freight transport in Ukraine serves agricultural exports, industrial production, domestic supply chains, and international trade. Since the beginning of the full-scale war, railway operations have taken place under changing logistical conditions and substantial constraints affecting transport infrastructure and freight flows. Previous studies have examined the development of Ukrainian railway transport, the economic conditions of international freight transportation, and the pricing of grain transportation under wartime conditions [18,19,20]. Previous research has also addressed the development of European-standard railway infrastructure in Ukraine, highlighting the importance of infrastructure modernization and international connectivity for the country’s railway system [21]. Although infrastructure modernization and network integration are not measured in the present analysis, they form part of the wider context in which the availability and utilization of freight rolling stock must be considered.
The historical evolution of railway technologies demonstrates the importance of technical innovation, infrastructure development, and operational organization in improving transport performance, as illustrated by previous research on the development of high-speed railways [22]. Although that study concerns a different segment of railway transport, it provides a broader perspective on the evolution of railway technologies and the conditions under which improvements in transport performance become possible. In the present research, the emphasis is placed on freight wagon utilization rather than technological development itself, with operational indicators used to characterize selected aspects of resource efficiency under contemporary Ukrainian conditions.
JSC Ukrainian Railways (Ukrzaliznytsia, UZ) publishes information on charges for the use of carrier-owned freight wagons and selected indicators of their operation. These data provide an opportunity to compare economically and functionally distinct categories of rolling stock within the same railway system. In particular, grain hoppers are associated primarily with specialized agricultural bulk transportation, gondola cars serve a broader range of mass commodities, and fitting platforms are used in containerized and intermodal freight operations. Their differences in specialization, freight demand, and operating patterns make them suitable for a comparative assessment of wagon usage conditions and selected aspects of resource utilization. The published information also has important limitations: wagon usage rates, empty-run coefficients, and transportation speeds are available at different temporal and operational levels of aggregation and cannot be treated as synchronized observations.
Existing research provides substantial knowledge concerning railway pricing, fleet optimization, empty-wagon distribution, transport organization, rolling-stock technologies, and sustainable freight operations. Nevertheless, these dimensions are frequently examined separately or within models developed to solve particular planning and optimization problems. There remains scope for empirical studies that combine the temporal variability of wagon usage charges with indicators of loaded and empty mileage and transportation speed across functionally different categories of rolling stock. Such an approach is especially relevant when the available data do not permit causal modelling but can support transparent comparisons of the economic and operational characteristics of freight wagon utilization.
The aim of this study is to compare the economic conditions and selected operational characteristics of three categories of freight wagons operated by JSC Ukrainian Railways—grain hoppers, gondola cars, and fitting platforms—during 2024–2026, with particular attention to their implications for rolling-stock resource utilization. The analysis addresses four research questions: (1) How did monthly wagon usage rates change between January 2024 and September 2026, and how did their variability differ among wagon categories? (2) What differences in empty-run coefficients can be identified, and what do they indicate about the proportion of wagon mileage performed under load? (3) How do reported average transportation speeds differ between single-dispatch and route-based operations across wagon categories and traffic conditions? (4) What can these combined indicators reveal about operational resource efficiency, and what limitations must be considered when interpreting their implications for sustainable rail freight transport?
To address these questions, the study combines descriptive statistics of monthly wagon usage rates with comparisons of reported empty-run coefficients and transportation speeds. In addition to the coefficient of variation (CV) and mean absolute monthly change, two complementary measures are employed: productive mileage share (PMS), which expresses the proportion of total wagon mileage performed under load, and relative transportation time saving (RTTS), which translates differences in reported average speeds into conditional transportation-time comparisons over an identical distance. The Route Effect on Transportation Speed (RETS) is also retained to characterize relative speed differences between transportation technologies.
The contribution of the study lies in integrating these economic and operational indicators into a comparative framework that distinguishes the resource-utilization characteristics of specialized bulk wagons, general-purpose wagons, and intermodal rolling stock. Rather than constructing a composite sustainability index or estimating environmental effects that cannot be substantiated by the available data, the analysis identifies category-specific patterns and examines their practical implications for freight wagon management. In this way, the study provides an empirical basis for discussing operational sustainability and resource efficiency in Ukrainian rail freight transport while identifying the additional data required for more comprehensive assessments of productivity, resilience, and environmental performance.
2. Materials and Methods
2.1. Data Sources and Study Period
This study employs a comparative descriptive approach to examine the economic and operational characteristics of freight wagon utilization within the Ukrainian railway system. The analysis focuses on three categories of rolling stock operated by JSC Ukrainian Railways: grain hoppers, gondola cars, and 40-ft fitting platforms. These categories represent different segments of rail freight transportation, namely specialized agricultural bulk transport, general-purpose freight operations, and containerized transport.
The empirical analysis combines three groups of publicly reported indicators: wagon usage rates, empty-run coefficients, and average transportation speeds. Two supplementary measures were introduced to interpret the operational indicators from the perspective of resource utilization: PMS and RTTS. The indicators were analysed separately because their temporal coverage and levels of aggregation differ.
The economic interpretation of wagon usage rates requires consideration of the regulatory framework governing railway freight transportation in Ukraine. The general legal basis for railway operations is established by the Law of Ukraine on Railway Transport [23]. Freight transportation tariffs and related services are addressed in the Collection of Tariffs approved by Order No. 317 of the Ministry of Transport and Communications of Ukraine [24]. The regulatory framework also includes provisions concerning applicable tariff coefficients [25] and procedures for revising freight transportation tariffs [26]. These documents provide the institutional context for railway freight pricing. However, the wagon usage rates examined in this study should be distinguished from the regulated freight transportation tariffs and their adjustment mechanisms. The analysis does not attempt to reconstruct the complete freight tariff or the total cost of an individual shipment.
Monthly wagon usage rates were collected for January 2024–September 2026, yielding 33 observations for each wagon category and 99 observations in total. The rates are expressed in Ukrainian hryvnias per wagon-day (UAH/wagon-day), excluding value-added tax. They represent the charges established by UZ for the use of carrier-owned freight wagons rather than the complete cost of freight transportation. The monthly observations were compiled from publicly available UZ rate information [27]. The analysis therefore characterizes the published economic conditions of wagon use without assuming that the observed changes directly reflect transport demand, wagon availability, operating costs, or changes in regulated freight tariffs.
Empty-run coefficients were examined using the annual values published by JSC Ukrainian Railways for 2024, 2025, and 2026 [28,29,30]. These coefficients are established for application during the respective calendar years and are associated with wagon-use charging arrangements. Although their documented calculation methodology relies on operational mileage statistics, the published values should not be treated as independently observed annual mileage ratios for the years in which they apply. The coefficients were analysed at the annual level and were not interpolated to monthly frequency. The published coefficients for fitting platforms refer to the platform fleet as a whole, without distinguishing between 40-ft, 60-ft, and 80-ft platforms. Accordingly, the empty-run analysis for fitting platforms is not restricted to the 40-ft category used in the rate analysis.
Average transportation speeds were obtained from the operational information published by UZ [31]. The available 2026 data distinguish between single/container dispatches and route/container-train transportation. Three traffic conditions were considered: domestic and import transportation, exports through land border crossings, and transportation to port stations. Average speeds are expressed in kilometres per day (km/day).
The different temporal resolutions of the source indicators were retained throughout the analysis. Monthly rates, annual empty-run coefficients, and transportation speeds reported for specific traffic and operational categories were not treated as synchronized observations. The study consequently employs descriptive comparisons rather than statistical models linking the three groups of indicators. This distinction is particularly important because the regulatory conditions governing freight transportation tariffs, the published charges for wagon use, and the operational characteristics of rolling stock represent different aspects of railway freight activity.
2.2. Analysis of Wagon Usage Rates
The monthly rate series were examined to identify differences in the level, variability, and short-term dynamics of wagon usage charges. For each wagon category, the arithmetic mean, median, minimum, maximum, range, standard deviation, and maximum-to-minimum ratio were calculated.
Relative variability was measured using the CV:
where s denotes the standard deviation of monthly wagon usage rates and R is their arithmetic mean.
CV = (s / R) × 100%
The CV provides a dimensionless measure of dispersion and allows the variability of wagon categories with different average rate levels to be compared.
Month-to-month changes were calculated as:
where Rₜ and Rt-1 represent the usage rates in the current and preceding months, respectively.
ΔRₜ = [(Rₜ − Rₜ₋₁) / Rₜ₋₁] × 100%
To characterize the magnitude of short-term fluctuations independently of their direction, the mean absolute monthly change (MAMC) was calculated as:
where n is the number of monthly observations.
The CV measures dispersion around the mean over a specified observation period, whereas MAMC characterizes the average absolute relative change between consecutive months. These measures therefore describe complementary aspects of rate variability.
The calculations were performed for the entire January 2024–September 2026 period and separately for 2024, 2025, and January–September 2026. Statistics for 2026 were interpreted as partial-period results rather than full-year estimates. For the complete 33-month series, the MAMC calculation included all consecutive monthly transitions, including those between calendar years.
2.3. Empty-Run Coefficients and PMS
Empty running was examined as an aspect of the operational utilization of freight wagons. Movements performed without a commercial load occupy rolling stock and infrastructure capacity but do not directly transport freight. Consequently, the relationship between loaded and empty mileage is relevant to assessing the use of available transport resources.
The empty-run coefficients published by JSC Ukrainian Railways for 2024–2026 were compared across the selected wagon categories. According to the documented methodology of Ukrainian Railways, these coefficients are derived from operational statistics describing the relationship between empty and loaded wagon mileage and are approved for application in wagon-use charging arrangements. The published coefficients are therefore treated as annual reference values rather than direct observations of mileage composition during the calendar years in which they apply.
Year-to-year relative changes in the published coefficients were calculated as:
where Ker,t and Ker,t−1 denote the published empty-run coefficients for two consecutive reference years.
ΔKₑᵣ,ₜ = [(Kₑᵣ,ₜ − Kₑᵣ,ₜ₋₁) / Kₑᵣ,ₜ₋₁] × 100%
To facilitate comparisons among wagon categories, the PMS was calculated as a coefficient-implied indicator. Under the documented definition, the empty-run coefficient represents the ratio of empty mileage to loaded mileage:
Kₑᵣ = Lₑₘₚₜᵧ / Lₗₒₐdₑd
Accordingly, the PMS is calculated as:
where Lempty and Lloaded denote empty and loaded wagon mileage, respectively, for the same reporting period and rolling-stock population. These mileage quantities explain the mathematical relationship underlying the coefficient; they were not directly observed in the present study.
PMS = [1 / (1 + Kₑᵣ)] × 100%
The calculated PMS expresses the proportion of loaded mileage implied by the published empty-run coefficient. A higher value corresponds to a larger implied share of loaded mileage, while a lower value corresponds to a larger implied contribution of empty movements. However, the resulting PMS values should not be interpreted as independently measured annual mileage shares or as direct indicators of freight output, fleet productivity, energy efficiency, or environmental performance.
The analysis retains the annual reference periods assigned to the coefficients by Ukrainian Railways. For fitting platforms, the published coefficients apply to the broader fitting-platform category and are not restricted to the 40-ft platforms considered in the wagon usage-rate analysis.
Because only three annual reference values are available for each wagon category, the analysis is limited to descriptive comparisons and year-to-year changes. No inferential statistical tests or time-series models were applied to the published coefficients or the derived PMS values.
2.4. Transportation Speed and Route-Based Operational Efficiency
The relationship between transportation technology and operational performance was assessed by comparing the average transportation speeds reported for single/container dispatches and route/container-train transportation.
Comparisons were conducted separately for the three traffic conditions: domestic/import transportation, exports through land border crossings, and transportation to port stations. This distinction was maintained to avoid treating different transport environments as operationally equivalent.
The relative difference between transportation technologies was quantified using the RETS indicator:
where Vᵣₒᵤₜₑ is the reported average speed for route/container-train transportation and Vₛᵢₙgₗₑ is the corresponding average speed for single/container dispatches.
RETS = [(Vᵣₒᵤₜₑ − Vₛᵢₙgₗₑ) / Vₛᵢₙgₗₑ] × 100%
A positive RETS value indicates that route-based transportation is associated with a higher reported average speed. A zero value indicates no difference between the reported speeds, while a negative value indicates a lower speed for route-based operations.
To express these speed differences in terms of the potential utilization of wagon time resources, the RTTS was introduced.
For an identical transportation distance D, the estimated transportation times under the two operational technologies are:
Tₛᵢₙgₗₑ = D / Vₛᵢₙgₗₑ; Tᵣₒᵤₜₑ = D / Vᵣₒᵤₜₑ
The relative time saving is therefore:
RTTS = [(Tₛᵢₙgₗₑ − Tᵣₒᵤₜₑ) / Tₛᵢₙgₗₑ] × 100% = [1 − (Vₛᵢₙgₗₑ / Vᵣₒᵤₜₑ)] × 100%
The RTTS indicator expresses the percentage reduction in calculated transportation time associated with the reported difference in average speeds, assuming an identical distance and comparable definitions of transportation time.
A positive RTTS value indicates a shorter estimated transportation time for route-based operations. The indicator is not a direct measurement of actual wagon-turnover reduction, since wagon turnover also depends on loading, unloading, waiting, and other operations outside the transportation-time component considered here.
Furthermore, the comparison of aggregate published speeds does not establish that route formation itself caused the observed differences. Differences in route length, traffic composition, infrastructure conditions, and operational priorities may also influence average transportation speed. Accordingly, RETS and RTTS were used as descriptive comparative indicators rather than causal estimates.
2.5. Analytical Framework and Study Limitations
The analytical framework integrates three complementary dimensions of freight wagon utilization: the economic conditions of wagon provision, the distribution of mileage between loaded and empty movements, and the transportation-time implications of different operational arrangements. These dimensions are examined jointly to provide a comparative description of rolling-stock resource utilization, but they are not combined into a composite efficiency or sustainability index.
The first dimension concerns the level and variability of wagon usage rates. Descriptive statistics, including the CV and MAMC, characterize differences in the economic conditions under which carrier-owned rolling stock is made available. The second dimension concerns mileage utilization. Published empty-run coefficients and the derived, coefficient-implied PMS characterize the relationship between loaded and empty mileage represented by the annual reference values. The third dimension concerns transportation speed. The RETS and RTTS provide complementary interpretations of differences between reported average speeds for single-dispatch and route-based transportation.
The use of complementary indicators makes it possible to identify differences between specialized bulk wagons, general-purpose freight wagons, and intermodal rolling stock without assuming that economic and operational performance are directly interchangeable. In particular, lower wagon usage rates do not necessarily indicate higher physical productivity, and a larger PMS does not independently establish greater transport output. Similarly, higher reported transportation speeds cannot be interpreted as evidence of lower energy consumption or greenhouse gas emissions.
Several limitations arise from the scope and aggregation of the available data. First, the usage-rate analysis concerns carrier-owned wagons of JSC Ukrainian Railways and does not represent the pricing conditions of the entire Ukrainian freight wagon fleet, including privately owned rolling stock. Second, the monthly rate series covers January 2024–September 2026; consequently, the 2026 descriptive statistics represent a nine-month observation period rather than a complete calendar year.
Third, the three groups of indicators differ in temporal resolution and operational coverage. Wagon usage rates are available monthly, empty-run coefficients are reported annually, and average transportation speeds are differentiated by transportation technology and traffic condition. These observations cannot be treated as synchronized wagon-level records. Accordingly, the analysis does not estimate correlations or causal relationships between changes in wagon usage charges, mileage composition, and transportation speeds.
Fourth, PMS represents the proportion of loaded mileage implied by the published empty-run coefficients rather than a directly observed annual mileage share. It does not measure the utilization of wagon carrying capacity or the volume of freight transported. In addition, the published empty-run coefficients for fitting platforms cover platforms of different lengths, whereas the usage-rate analysis concerns 40-ft platforms. These differences in population coverage preclude direct attribution of the calculated platform PMS values to the 40-ft category alone.
Fifth, RTTS represents a conditional transformation of reported average transportation speeds into relative transportation-time differences over an identical distance. It does not measure actual reductions in wagon turnaround time, which also depends on loading, unloading, terminal processing, waiting, and empty repositioning. Moreover, the published aggregate speeds do not establish that the compared transportation technologies were applied to identical origin–destination pairs or under equivalent operating conditions. Therefore, the observed speed differences cannot be attributed exclusively to route-based transportation.
Finally, the available dataset does not contain wagon-level loading records, actual loaded and empty mileage, cargo volumes, complete wagon-cycle times, energy consumption, or detailed origin–destination information. These limitations prevent the direct estimation of overall fleet productivity, environmental effects, or the causal consequences of operational changes. The framework is consequently intended for descriptive comparison and the identification of potential resource-utilization issues rather than the evaluation of specific optimization measures.
Despite these limitations, the combined use of economic and operational indicators provides a transparent and reproducible basis for comparing selected freight wagon categories. It also identifies the additional information required to extend the analysis towards more comprehensive assessments of rolling-stock productivity, transport resilience, and environmental sustainability.
3. Results
3.1. Dynamics and Variability of Wagon Usage Rates
The monthly usage rates of the three selected wagon categories followed markedly different trajectories between January 2024 and September 2026 (Figure 1). In 2024, grain-hopper rates ranged from 1,100 to 1,600 UAH/wagon-day, gondola-car rates from 1,150 to 1,450 UAH/wagon-day, and 40-ft fitting-platform rates from 1,300 to 1,750 UAH/wagon-day. The respective annual means were 1,287.5, 1,316.7, and 1,554.2 UAH/wagon-day.
The most pronounced divergence occurred in 2025. Grain-hopper rates fell from 1,150 UAH/wagon-day in January to 203 UAH/wagon-day in February, before recovering to 1,250 UAH/wagon-day by December; the annual mean was 588.7 UAH/wagon-day. The mean rate for 40-ft fitting platforms decreased to 683.3 UAH/wagon-day, with a minimum of 400 UAH/wagon-day in September. Gondola-car rates were considerably more stable, averaging 1,225.0 UAH/wagon-day in 2025.
During January–September 2026, grain-hopper rates rose to 3,271 UAH/wagon-day in June and remained at that level through September. The partial-period mean was 2,621.6 UAH/wagon-day. Fitting-platform rates rose from 900 to 2,150 UAH/wagon-day, while gondola-car rates varied within a narrower range of 1,450–1,850 UAH/wagon-day. The normalized rate trajectories (January 2024 = 100) are shown in Figure 2.
Descriptive statistics confirm these differences (Table 1). The full-period CV was highest for grain hoppers (65.95%), followed by fitting platforms (41.05%) and gondola cars (15.83%). Mean absolute monthly changes followed the same ordering: 20.9%, 12.3%, and 7.5%, respectively. Annual coefficients of variation were 11.25%, 7.12%, and 10.93% in 2024; 56.51%, 11.21%, and 32.47% in 2025; and 27.78%, 8.75%, and 28.37% for January–September 2026, respectively (grain hoppers, gondola cars, and fitting platforms in each sequence). The differences in the overall variability and month-to-month fluctuations of wagon usage rates across the three categories are illustrated in Figure 3.
3.2. Empty-Run Characteristics and Productive Mileage
The reported empty-run coefficients differed substantially across wagon categories (Table 2). Grain hoppers had the highest coefficients in each year: 1.29 in 2024, 1.06 in 2025, and 1.11 in 2026. Gondola-car coefficients remained relatively stable at 0.88, 0.85, and 0.89, respectively. Fitting platforms had the lowest coefficients, although their value increased from 0.45 in 2025 to 0.70 in 2026, an increase of 55.6%. The changes in the reported empty-run coefficients for the three wagon categories during 2024–2026 are illustrated in Figure 4.
The PMS was calculated from the reported empty-run coefficients using Equation (6). The resulting values were 43.67%, 48.54%, and 47.39% for grain hoppers in 2024, 2025, and 2026, respectively. Gondola-car PMS values were 53.19%, 54.05%, and 52.91%. For the broader fitting-platform fleet, the corresponding values were 70.92%, 68.97%, and 58.82%.
Grain hoppers had the lowest coefficient-implied PMS in all three reference years, whereas the broader fitting-platform fleet had the highest. The calculated PMS for fitting platforms decreased by 10.15 percentage points between the coefficients applicable in 2025 and 2026. This difference indicates a change in the mileage composition implied by the published coefficients, rather than a directly measured reduction in the actual share of loaded mileage. The results do not measure wagon loading, tonne-kilometres, energy consumption, or emissions. The platform coefficients are not specific to 40-ft units. The published empty-run coefficients and the corresponding calculated PMS values for each wagon category are presented in Table 3.
3.3. Transportation Speed and Route-Based Operational Efficiency
Average transportation speeds for 2026 were compared between single/container dispatches and route/container-train operations within each traffic condition. Table 4 reports the original speeds and the two derived indicators, RETS and RTTS. Both indicators are based on the same paired speed observations but express different relationships: RETS measures the percentage speed difference relative to single dispatches, whereas RTTS measures the corresponding conditional percentage reduction in transportation time over an identical distance.
The largest difference was observed for grain hoppers in domestic/import traffic: speed increased from 93 to 256 km/day, giving RETS = +175.3% and RTTS = 63.67%. This means that the calculated travel time over an identical distance would be 63.67% shorter at the higher reported speed; it does not imply a 175.3% reduction in time. For land-border exports and movements to port stations, grain-hopper RTTS was 39.35% and 38.04%, respectively.
Gondola cars exhibited positive speed differences in all three conditions, corresponding to conditional RTTS values of 21.74% for domestic/import traffic, 34.45% for land-border exports, and 18.47% for port-station traffic. For fitting platforms, the reported speeds were identical between the two operational categories for domestic/import traffic (153 km/day) and land-border exports (185 km/day), producing RETS = 0 and RTTS = 0. For port-station traffic, speeds of 157 and 217 km/day yielded RETS = +38.2% and RTTS = 27.65%. The relative differences in average transportation speeds between single-dispatch and route-based operations across wagon categories and traffic conditions are summarized in Figure 5.
The RTTS values are comparative estimates rather than observations of actual wagon-turnover reduction. The available aggregate speeds do not establish that the same origin–destination pairs, distances, or operating conditions were represented in both transportation categories. Accordingly, the observed differences cannot be attributed solely to the use of route-based transportation.
3.4. Comparative Synthesis of Resource Utilization Indicators
The three wagon categories exhibited distinct combinations of economic and operational characteristics. Grain hoppers had the highest usage-rate variability, the highest reported empty-run coefficients, and the largest relative speed differences between transportation technologies. Gondola cars had the lowest rate variability and comparatively stable empty-run coefficients, with positive but smaller route-associated speed differences. Fitting platforms had intermediate rate variability and the lowest empty-run coefficients, but their speed differences depended on traffic condition.
The new PMS and RTTS indicators clarify two separate dimensions of resource utilization. PMS expresses the loaded-mileage proportion implied by the published empty-run coefficients, while RTTS translates reported speed differences into conditional transportation-time comparisons. Neither indicator alone measures overall fleet productivity, environmental performance, or resilience. In particular, the available observations do not support a causal relationship between monthly wagon usage rates, annual empty-run coefficients, and aggregate transportation speeds.
Taken together, these results provide a differentiated empirical description of the selected wagon categories rather than a single ranking of their overall sustainability. Their implications for rolling-stock management and operational sustainability are examined in the Discussion.
4. Discussion
4.1. Economic and Operational Efficiency of Freight Wagon Utilization
The comparative results demonstrate that the economic conditions of freight wagon use and the operational characteristics of rolling stock differ considerably across wagon categories. An important finding is that variability in wagon usage charges cannot be treated as a direct indicator of physical fleet efficiency. The analysed rates represent charges for the use of carrier-owned wagons rather than complete freight transportation tariffs or the actual costs of providing transport services. Research by Wilson and Lakkakula [4], Miller and Wilson [5], and Zajfert and Suchanek [7] highlights the importance of market conditions, competition, and freight demand in railway pricing. The present findings extend this economic perspective by examining the variability of wagon usage charges alongside indicators of mileage utilization within the same railway system, while maintaining a distinction between their economic and operational meanings.
Grain hoppers exhibited particularly pronounced fluctuations in usage rates, with a CV of 65.95% and a mean absolute monthly change of 20.9% during January 2024–September 2026. These values substantially exceeded those recorded for gondola cars and fitting platforms. The sharp reduction in grain-hopper rates during 2025, followed by their considerable increase in 2026, indicates that the economic conditions of wagon provision changed markedly over a relatively short period. Such fluctuations may complicate expenditure planning for freight customers and the management of specialized rolling-stock resources. Previous studies of grain transportation in Ukraine have examined pricing under wartime conditions and the irregularity of grain freight flows [20,32]. These investigations provide relevant context for interpreting the observed rate dynamics. Nevertheless, the available data do not establish whether seasonal freight demand, wagon availability, export logistics, or commercial pricing decisions were responsible for particular changes in the analysed series.
Gondola cars presented a contrasting pattern. Their usage rates were substantially less variable (CV = 15.83%; MAMC = 7.5%), while the reported empty-run coefficients remained within a relatively narrow interval of 0.85–0.89. This combination indicates greater stability in the observed economic and mileage characteristics, although it does not demonstrate superior overall fleet productivity. In particular, stable rates may coexist with considerable empty mileage, as the calculated PMS for gondola cars remained close to 53–54%. Milenković et al. [8] investigated freight wagon fleet size optimization, whereas Ma and Bao [9] examined empty-railcar distribution in heavy-haul railway operations. Compared with these optimization-oriented approaches, the present study provides an empirical characterization of publicly reported operating indicators, helping identify which aspects of wagon utilization may warrant more detailed modelling.
The relationship between loaded and empty mileage is particularly important for interpreting differences in operational resource utilization. The PMS translates the published empty-run coefficient into an implied proportion of total wagon mileage performed under load. In 2026, the calculated PMS was 47.39% for grain hoppers, 52.91% for gondola cars, and 58.82% for fitting platforms. Thus, the published grain-hopper coefficient for 2026 implies that empty movements would account for more than half of total mileage under the coefficient’s underlying ratio, although this does not establish the actual mileage composition during 2026. From an operational perspective, such movements require rolling-stock time and infrastructure capacity without directly contributing to loaded freight transportation. However, they cannot be regarded as entirely avoidable losses. Venes et al. [10] examined the distribution of empty wagon batches to satisfy loading demand, while Krauth and Haalboom [15] investigated the economic implications of wagon rerouting within a single-wagonload network. These studies demonstrate that empty movements arise partly from the spatial distribution of freight demand and the need to reposition equipment. Consequently, improving mileage utilization requires consideration of network organization and wagon allocation rather than simply minimizing empty movements irrespective of operational requirements.
The fitting-platform fleet exhibited the highest calculated PMS throughout the period, although this indicator declined from 70.92% in 2024 to 58.82% in 2026. This change indicates a larger implied contribution of empty movements in the coefficients applicable to the fitting-platform fleet, without establishing an equivalent change in actual annual mileage. Nevertheless, the interpretation requires an important qualification: the official empty-run coefficients cover fitting platforms of different lengths, whereas the usage-rate analysis concerns specifically 40-ft platforms. The two datasets therefore cannot establish a direct relationship between changes in 40-ft platform charges and the mileage utilization of that particular platform category. Furthermore, a higher proportion of loaded mileage does not necessarily indicate greater transport productivity, since the actual payload, carrying capacity, and freight volume remain unknown.
Taken together, these findings suggest that the three wagon categories require differentiated approaches to operational management. For grain hoppers, the combination of substantial rate volatility and a relatively high proportion of empty mileage identifies two distinct issues requiring further investigation: the predictability of wagon provision conditions and the organization of empty-wagon circulation. For gondola cars, the comparatively stable indicators provide a useful reference for examining the relationship between wagon allocation and freight demand. For fitting platforms, the decrease in coefficient-implied PMS between the 2024 and 2026 reference values indicates the need for more detailed analysis of actual mileage utilization by platform length, cargo flow, and operating segment. The principal contribution of the comparison is therefore not to rank wagon categories according to a single efficiency criterion, but to identify differences in their economic and operational characteristics that may inform subsequent fleet-management decisions.
4.2. Implications for Sustainable Rail Freight Transport
The implications of the findings for sustainable rail freight transport concern primarily the utilization of rolling-stock capacity, infrastructure resources, and operational time. In this study, operational sustainability is considered in terms of maintaining freight transportation while using available resources more efficiently, rather than as a directly measured reduction in environmental impacts. This interpretation is consistent with research addressing the implementation of green logistics principles in railway transport and the institutional conditions supporting sustainable rail freight development [2,3]. The present analysis complements these broader perspectives by identifying differences in resource utilization among three functionally distinct categories of freight wagons.
Two indicators are particularly relevant to this interpretation. The PMS characterizes the loaded-mileage proportion implied by the published empty-run coefficients, whereas RTTS expresses the conditional difference in transportation time associated with reported average speeds. These indicators characterize different aspects of operational resource utilization and should not be combined into a single measure of sustainability. A higher coefficient-implied PMS corresponds to a larger calculated share of loaded mileage under the published coefficient, but does not establish greater freight output or a directly observed improvement in annual mileage utilization. Similarly, a positive RTTS indicates a shorter calculated transportation time over an identical distance, but does not demonstrate a corresponding reduction in the complete wagon operating cycle.
The speed comparisons reveal substantial differences in the potential time-related advantages associated with alternative transportation arrangements. For grain hoppers in domestic and import traffic, the reported average speeds of 93 km/day for single dispatches and 256 km/day for route-based transportation correspond to RETS of 175.3% and RTTS of 63.67%. The latter value means that transportation over an identical distance would require approximately 63.67% less time at the higher reported speed. For grain hoppers transported through land border crossings and to port stations, the corresponding RTTS values were 39.35% and 38.04%. These differences indicate that the time implications of transportation arrangements vary across traffic conditions, even within the same wagon category.
Gondola cars exhibited smaller but consistently positive conditional time differences, with RTTS values ranging from 18.47% to 34.45%. The results for fitting platforms were less uniform. No difference between the reported speeds of single/container dispatches and route/container-train transportation was observed in domestic/import traffic or exports through land border crossings. However, transportation to port stations was associated with RTTS of 27.65%. This contrast is important because it demonstrates that the potential advantages of route-based transportation cannot be generalized across all wagon categories or operating conditions. Research on container train planning and empty-container dispatch has similarly emphasized the importance of coordinating train operations with the circulation and availability of transport equipment [14].
From the perspective of rolling-stock resource utilization, shorter transportation time may reduce the period during which a wagon remains occupied by the line-haul component of a shipment. Under otherwise comparable operating conditions, this could improve wagon availability for subsequent transportation tasks. However, the practical significance of such time differences depends on the organization of the complete wagon operating cycle. Loading and unloading operations, terminal processing, waiting periods, and empty repositioning may offset part of the time advantage associated with higher transportation speeds. Moreover, the published speed aggregates do not establish that the compared transportation arrangements involved identical routes, distances, or operating conditions. Consequently, the calculated RTTS values should be interpreted as conditional comparisons rather than observed improvements in wagon turnover.
The relationship between mileage utilization and operational time also deserves consideration. Empty wagon movements require infrastructure capacity and rolling-stock time without directly generating loaded transportation output. At the same time, repositioning empty wagons is often necessary to satisfy geographically dispersed freight demand. A reduction in unnecessary empty movements could therefore release capacity for other operations, although the magnitude of this effect would depend on the specific railway network and freight flows. Improvements in transportation speed and empty-wagon allocation should consequently be considered as potentially complementary management objectives rather than independent or universally applicable solutions. Research on empty-wagon distribution, freight fleet optimization, and railway network organization provides methodological foundations for investigating such interactions in greater detail [8,9,10].
An important distinction must nevertheless be maintained between operational resource efficiency and environmental sustainability. Research on the relationship between freight wagon mass and train energy consumption demonstrates that energy performance depends on physical and operational characteristics not represented by mileage shares alone [33]. Similarly, comparative assessments of intermodal transportation emissions, costs, and delivery times require information on transport distances, traffic volumes, equipment characteristics, and operating conditions [34]. Although reducing unnecessary empty movements or transportation time may create opportunities for more efficient resource use, the present results cannot establish the magnitude or even the direction of changes in energy consumption or greenhouse gas emissions under particular operational interventions. Such conclusions would require additional information on train composition, traction systems, payloads, route characteristics, and actual energy use.
The practical relevance of the findings lies in identifying where more detailed sustainability-oriented assessments may be justified. For grain hoppers, the combination of a relatively low PMS and substantial differences between reported transportation speeds suggests that empty-wagon allocation and transportation organization deserve particular attention. For gondola cars, the comparatively stable mileage characteristics and positive speed differences provide a basis for examining whether operational adjustments could improve wagon availability. For fitting platforms, the decline in coefficient-implied PMS and the variation in reported speed differences across traffic conditions indicate the importance of distinguishing between platform types and transport corridors in subsequent operational assessments. These observations do not establish the effectiveness of specific interventions, but they help define priorities for subsequent operational analysis.
Overall, the study demonstrates the value of distinguishing mileage utilization from transportation-time efficiency when assessing the sustainable use of freight railway resources. PMS and RTTS provide complementary information that may support the identification of operational constraints, while their interpretation remains limited by the aggregation of the available data. The principal sustainability-related contribution is therefore the identification of category-specific opportunities for further investigation, rather than the quantification of environmental benefits. Integrating these indicators with wagon-cycle records, freight volumes, energy consumption, and corridor-level information would allow future research to assess whether improvements in operational resource utilization translate into measurable economic and environmental outcomes.
4.3. Freight Transport Resilience Under Wartime Conditions
The Ukrainian railway system provides a particularly relevant setting for examining freight wagon resource utilization under constrained operating conditions. The observation period of 2024–2026 coincides with the ongoing full-scale war, during which railway freight transportation has had to operate within a changing logistical environment. Previous studies addressing the development of Ukrainian railway transport, international freight transportation, and grain transport pricing under wartime conditions provide important context for understanding these circumstances [18,19,20]. Nevertheless, the present analysis does not contain direct observations of infrastructure damage, temporary line closures, changes in border-crossing capacity, or individual transport disruptions. The wartime context therefore provides the setting for interpreting the findings rather than an independently measured explanatory variable.
Operational resilience in railway freight transportation involves the ability to maintain essential transport functions, adapt to changing operating conditions, and restore an acceptable level of service following disruptions. This concept differs from operational efficiency, although the two are closely related. A railway system may maintain freight movements by redirecting traffic, reallocating rolling stock, modifying train formation, or accepting additional transportation time and empty mileage. Such adjustments may support service continuity while temporarily reducing conventional efficiency indicators. Consequently, resilience cannot be assessed solely through transportation speed, wagon usage charges, or the proportion of loaded mileage.
Research on railway operations during infrastructure interruptions offers a useful basis for considering these relationships. Bulková et al. [17] examined railway operations under planned infrastructure interruptions, while Krauth and Haalboom [15] investigated the economic implications of rerouting wagons within a single-wagonload network. Although planned interruptions and congestion differ fundamentally from the disruptions associated with military operations, these studies illustrate the importance of operational adaptation when the availability of network capacity changes. They also indicate why maintaining freight services may require decisions that are not optimal when evaluated exclusively against transportation time or the direct costs of individual movements.
The differences identified among the three wagon categories suggest several issues relevant to the management of rolling-stock resources under such conditions. Grain hoppers exhibited the greatest variability in usage charges and the highest empty-run coefficients throughout the analysed period. Their specialization in agricultural freight transportation makes the organization of wagon circulation particularly important when loading locations, freight destinations, or available transport corridors change. However, the observed fluctuations cannot be attributed to specific wartime events without additional information on freight demand, wagon availability, and operational restrictions. Previous research on grain transportation pricing and the irregularity of grain freight flows in Ukraine provides relevant background for investigating these relationships [20,32].
Gondola cars displayed considerably more stable usage rates and empty-run coefficients. Their broader application in bulk freight transportation may provide different opportunities for reallocating rolling stock among freight flows, although this possibility cannot be established from the aggregated indicators examined here. The relatively stable economic and mileage characteristics of gondola cars should therefore not be interpreted as direct evidence of greater resilience. Assessing their adaptability would require information on the actual availability of wagons, cargo compatibility, loading demand, and the ability to maintain transportation services when individual routes or terminals become unavailable.
Fitting platforms represent another important dimension because of their role in containerized and intermodal transportation. The coefficient-implied PMS for the broader fitting-platform fleet decreased from 70.92% for 2024 to 58.82% for 2026. This difference reflects a change in the mileage composition implied by the published annual coefficients and should not be interpreted as a directly measured increase in empty mileage during the corresponding calendar years. Nevertheless, the change may justify closer examination of platform repositioning and the spatial distribution of container traffic. The available data do not identify the reasons for the difference, and the empty-run coefficients cover fitting platforms of different lengths rather than only the 40-ft platforms included in the usage-rate analysis. Research on container train planning and empty-container dispatch highlights the operational importance of coordinating equipment allocation and train services [14].
The transportation-speed results further demonstrate the need to distinguish among traffic conditions. For grain hoppers, the calculated RTTS was 63.67% in domestic/import traffic, 39.35% for exports through land border crossings, and 38.04% for transportation to port stations. Gondola cars and fitting platforms exhibited different patterns, including traffic conditions in which no speed difference between the reported transportation arrangements was observed. These findings indicate that the potential transportation-time implications of operational arrangements vary by wagon category and traffic segment. They do not, however, establish which arrangements would be more resilient during an actual disruption. Higher average speed under ordinary operating conditions does not necessarily imply greater reliability when infrastructure capacity is reduced or transport routes must be changed.
The distinction between efficiency and resilience is particularly relevant when interpreting PMS and RTTS. PMS characterizes the loaded-mileage proportion implied by the published coefficients and may help identify wagon categories for which the actual extent of empty repositioning deserves closer investigation. RTTS expresses conditional differences in transportation time associated with reported average speeds. Both indicators can support the identification of operational resource-utilization issues, but neither measures the continuity of freight services, the availability of alternative routes, or the time required to recover from a disruption. Their practical value in resilience-oriented analysis therefore lies in providing complementary baseline characteristics that could be combined with more detailed information on network performance.
For Ukrainian railway freight management, such an approach suggests the importance of monitoring resource utilization at the level of individual corridors and freight flows. In addition to mileage composition and transportation speed, resilience assessments would need to consider the availability of alternative routes, terminal capacity, wagon turnaround time, loading and unloading performance, and the duration of service interruptions. The optimization of empty-wagon distribution and fleet allocation, examined in previous railway research [8,9,10], offers a methodological basis for developing such assessments. However, optimization objectives under disrupted conditions may need to prioritize the continuity of strategically important freight movements rather than minimizing transportation time or empty mileage alone.
The broader relevance of these issues is consistent with Sustainable Development Goal 9, which emphasizes resilient infrastructure, and Sustainable Development Goal 12, which addresses responsible resource use [35,36]. The present study does not measure progress towards these goals or quantify the resilience of the Ukrainian railway system. Its contribution is more specific: it identifies differences in the economic and operational characteristics of three freight wagon categories during a period of exceptional external constraints. These findings provide a basis for formulating further research questions concerning the relationship between rolling-stock resource utilization, operational adaptability, and the continuity of freight transportation under disruptive conditions.
4.4. Limitations and Directions for Further Research
The findings should be interpreted in light of several limitations associated with the scope and aggregation of the available data. The analysis of wagon usage rates is restricted to carrier-owned rolling stock of JSC Ukrainian Railways and does not represent the pricing conditions of the entire Ukrainian freight wagon fleet. Moreover, the three groups of indicators differ in their temporal and operational coverage: usage rates are reported monthly, empty-run coefficients annually, and transportation speeds by traffic condition and transportation arrangement. Consequently, their combined interpretation supports descriptive comparisons but does not establish statistical or causal relationships between economic conditions and operational performance.
Two additional qualifications concern the derived resource-utilization indicators. First, PMS is a coefficient-implied measure of loaded-mileage share derived from the annual empty-run coefficients published by Ukrainian Railways. It does not represent an independently measured annual mileage share and does not account for payload, carrying capacity, or freight transport output. The reported empty-run coefficients for fitting platforms also cover platforms of different lengths, whereas the usage-rate analysis concerns specifically 40-ft units. Second, RTTS is calculated from published average speeds under the assumption of an identical transportation distance. It does not represent observed reductions in wagon turnaround time, and the available data do not establish whether the compared transportation arrangements operated under equivalent conditions.
Future research should integrate wagon-level operating records with information on freight volumes, origin–destination pairs, loaded and empty mileage, terminal processing, and complete wagon-cycle duration. Such data would allow the relationship between wagon allocation, transportation organization, and actual resource productivity to be investigated more directly. Existing approaches to empty-wagon distribution and fleet optimization [8,9,10] could provide a methodological basis for evaluating alternative operating strategies. Incorporating traction energy consumption, train composition, and payload data would also make it possible to examine whether changes in mileage utilization and transportation time produce measurable environmental benefits.
A further research direction concerns the resilience of freight operations under disruptions. Linking operational indicators to documented infrastructure restrictions, route diversions, service interruptions, and recovery periods would permit an assessment of how resource-utilization strategies influence the continuity of railway freight transportation. This would extend the present descriptive framework towards a more comprehensive evaluation of economic efficiency, operational adaptability, and environmental sustainability.
5. Conclusions
This study examined the economic conditions and selected operational characteristics of freight wagon utilization in Ukraine during 2024–2026, focusing on grain hoppers, gondola cars, and fitting platforms operated by JSC Ukrainian Railways. By comparing wagon usage rates, empty-run coefficients, and transportation speeds, the research identified substantial differences in the utilization of rolling-stock resources across these three categories. The findings demonstrate the importance of assessing economic and operational indicators separately rather than interpreting any single measure as evidence of overall freight transport efficiency.
The analysis of monthly wagon usage rates for January 2024–September 2026 revealed considerable differences in their variability. Grain hoppers exhibited the greatest fluctuations, with a CV of 65.95%, compared with 41.05% for 40-ft fitting platforms and 15.83% for gondola cars. These differences indicate that the economic conditions of wagon provision varied substantially among rolling-stock categories. However, changes in usage charges cannot independently establish changes in transport costs or physical wagon productivity.
The comparison of published empty-run coefficients revealed substantial differences in the mileage composition implied by the annual reference values. Grain hoppers consistently exhibited the lowest coefficient-implied PMS, whereas the broader fitting-platform fleet had the highest. The calculated PMS for fitting platforms decreased from 70.92% for 2024 to 58.82% for 2026, indicating a larger implied contribution of empty movements. These results do not establish an equivalent change in actual annual loaded or empty mileage. Nevertheless, they highlight the relevance of wagon specialization and empty-wagon circulation to rolling-stock resource assessment. The platform results must also be interpreted with regard to the different fleet populations represented in the usage-rate and empty-run datasets.
Transportation-speed comparisons showed that the potential time-related advantages associated with route-based operations differed considerably by wagon category and traffic condition. The largest observed speed difference concerned grain hoppers in domestic/import transportation, where the reported speeds corresponded to an RTTS of 63.67% over an identical distance. In contrast, fitting platforms showed no speed difference between the compared transportation arrangements in domestic/import and land-border export traffic. These results indicate that the operational implications of transportation arrangements cannot be generalized across different freight flows. Moreover, the calculated time differences do not establish actual reductions in wagon turnaround time or causal effects of route-based transportation.
The principal contribution of the study is the integration of economic and operational indicators into a comparative framework for assessing freight wagon resource utilization. PMS and RTTS provide complementary interpretations of coefficient-implied mileage composition and conditional transportation-time differences, respectively. Their combined consideration helps identify category-specific issues that may warrant further investigation: empty-wagon circulation and rate variability for grain hoppers, the relationship between wagon allocation and freight demand for gondola cars, and changes in the published empty-run coefficients for fitting platforms. These findings provide a basis for more targeted operational analysis and rolling-stock management.
In the context of Ukraine’s wartime railway operations, the results offer a descriptive basis for examining the use of constrained transport resources, but they do not directly measure operational resilience or environmental sustainability. Further research should integrate wagon-level mileage, freight volumes, complete operating-cycle times, origin–destination characteristics, and energy consumption. Such information would allow the relationship between rolling-stock utilization, operational performance, and measurable economic and environmental outcomes to be investigated more comprehensively.
Author Contributions
Conceptualization, O.S.; methodology, O.S.; validation, O.S.; formal analysis, A.B.; investigation, A.B.; resources, A.B.; data curation, O.S.; writing—original draft preparation, A.B.; writing—review and editing, O.S.; visualization, A.B. All authors have read and agreed to the published version of the manuscript.
Funding
This research received no external funding.
Institutional Review Board Statement
Not applicable.
Informed Consent Statement
Not applicable.
Data Availability Statement
The dataset supporting the findings of this study is publicly available in the Zenodo repository at Strelko, O., & Bernatskyi, A. (2026), Freight Wagon Utilization Data for Ukraine, 2024–2026, Version 1.0.0, https://doi.org/10.5281/zenodo.24221999. The repository contains the underlying data, accompanying documentation, and source information used in the analysis.
Conflicts of Interest
The authors declare no conflict of interest.
References
- Jacyna-Gołda, I.; Gavkalova, N.; Salwin, M. Managing Innovation for a Sustainable Transport System: A Comparative Study of the EU and Ukraine. Sustainability 2026, 18, 504. [Google Scholar] [CrossRef]
- Čižiūnienė, K.; Matijošius, J.; Sokolovskij, E.; Balevičiūtė, J. Assessment of Implementing Green Logistics Principles in Railway Transport: The Case of Lithuania. Sustainability 2024, 16, 2716. [Google Scholar] [CrossRef]
- Černá, L.; Mašek, J. Model of Public Support for Railway Sidings as a Component of the Sustainable Development of Rail Freight Transport. Sustainability 2025, 17, 7872. [Google Scholar] [CrossRef]
- Wilson, W.; Lakkakula, P. Secondary Rail Car Markets for Grain Transportation and Basis Values. Agribusiness 2021, 37, 472–488. [Google Scholar] [CrossRef]
- Miller, K.; Wilson, W.W. Changes in Rail Rates for U.S. Commodity Grain Shipments over Time. Res. Transp. Econ. 2023, 102, 101359. [Google Scholar] [CrossRef]
- Zeng, J.; Qi, F.; Guo, S.; Zeng, J. Comprehensive Evaluation Model and Empirical Research on Railway Freight Rates in a Competitive Environment. Transp. Res. Rec. J. Transp. Res. Board 2021, 2675(12), 929–938. [Google Scholar] [CrossRef]
- Zajfert, M.; Suchanek, M. Price Elasticity of Rail Freight Services: The Case of Poland. Transp. Res. Interdiscip. Perspect. 2025, 34, 101762. [Google Scholar] [CrossRef]
- Milenković, M.; Bojović, N.; Abramin, D. Railway Freight Wagon Fleet Size Optimization: A Real-World Application. J. Rail Transp. Plan. Manag. 2023, 26, 100373. [Google Scholar] [CrossRef]
- Ma, L.; Bao, Y. Optimization of Empty Railcar Distribution at the Loading End of a Heavy-Haul Railway Based on Deep Reinforcement Learning. Future Transp. 2026, 6, 127. [Google Scholar] [CrossRef]
- Venes, H.; de Alvarenga Rosa, R.; Resendo, L.C.; Pestana, R.P. Planning the Distribution of Empty Wagon Batches from Marshalling Yards to Meet Mine Loading Demand. Int. J. Logist. Syst. Manag. 2024, 49, 389–411. [Google Scholar] [CrossRef]
- Stoilov, V.; Purgic, S. Optimization of the Technical Parameters of Universal Freight Wagons. Appl. Sci. 2025, 15, 12673. [Google Scholar] [CrossRef]
- Moya, I.; Perez, A.; Zabalegui, P.; de Miguel, G.; Losada, M.; Amengual, J.; Adin, I.; Mendizabal, J. Freight Wagon Digitalization for Condition Monitoring and Advanced Operation. Sensors 2023, 23, 7448. [Google Scholar] [CrossRef] [PubMed]
- Barotov, J.; Mukhamedova, Z.; Kobulov, J.; Tursunkhodjaeva, R.; Saidivaliyev, S.; Abdullayev, R.; Boboyev, D. Modeling of Delivery Infrastructure for Solving Problems by Type of Goods. Systems 2026, 14, 184. [Google Scholar] [CrossRef]
- Song, W.; Liu, D.; Rong, W. Optimization of Passenger-like Container Train Running Plan Considering Empty Container Dispatch. Sustainability 2022, 14, 4697. [Google Scholar] [CrossRef]
- Krauth, M.; Haalboom, D. An Economic View on Rerouting Railway Wagons in a Single Wagonload Network to Avoid Congestion. Eur. Transp. Res. Rev. 2022, 14, 48. [Google Scholar] [CrossRef]
- Zhao, Y.; Jiang, H. Low-Carbon Railway Traffic Flow Organization: Integrated and Two-Stage Optimization of Traffic Routing and Train Formation. Sustainability 2026, 18, 6223. [Google Scholar] [CrossRef]
- Bulková, Z.; Gašparík, J.; Zitrický, V. The Management of Railway Operations during the Planned Interruption of Railway Infrastructure. Infrastructures 2024, 9, 119. [Google Scholar] [CrossRef]
- Kyrychenko, H.; Berdnychenko, Y.; Hrushevska, T.; Bernatskyi, A.; Strelko, O. Optimization of Incomes from International Cargo Transportation on Railway Transport of Ukraine. In *Smart Technologies in Urban Engineering, STUE 2024*; Lecture Notes in Networks and Systems; Arsenyeva, O., Romanova, T., Sukhonos, M., Biletskyi, I., Tsegelnyk, Y., Eds.; Springer: Cham, Switzerland, 2026; Volume 1658, pp. 24–33. [Google Scholar] [CrossRef]
- Strelko, O.; Solovyova, O.; Berdnychenko, Y.; Kyrychenko, H.; Solovyova, L. Study of the Contemporary Trends in the Development of Transport Systems of the Ukrainian Railways. Acta Sci. Pol. Adm. Locorum 2023, 22, 263–279. [Google Scholar] [CrossRef]
- Karnasiuk, I. Analysis of Railway Work and Pricing of the Cost of Transportation of Grain Loads by Rail Transport in the Conditions of War. Adv. Mech. Eng. Transp. (In Ukrainian) 2024, 1(22), 153–162. [Google Scholar] [CrossRef]
- Strelko, O.; Toropov, B.; Horban, A.; Hrushevska, T.; Bernatskyi, A. Some Issues of the Project Analysis of Options for the Implementation of European Standard Railways in Ukraine. Trans. Transp. Sci. 2024, 15, 64–70. [Google Scholar] [CrossRef]
- Strelko, O.; Ryzheva, N.; Hurinchuk, S.; Berdnychenko, Y. The History of the Emergence, Development and Improvement of High-Speed Railways: Technical, Socio-Economic and Cultural Aspects. Hist. Sci. Technol. 2025, 15, 499–530. [Google Scholar] [CrossRef]
- Verkhovna Rada of Ukraine. Law of Ukraine on Railway Transport, No. 273/96-VR, 4 July 1996 (as amended). Available online: https://zakon.rada.gov.ua/laws/show/273/96-%D0%B2%D1%80 (accessed on 12 November 2026).
- Ministry of Transport and Communications of Ukraine. Order No. 317 of 26 March 2009: Collection of Tariffs for Freight Transportation by Rail within Ukraine and Related Services. Available online: https://zakon.rada.gov.ua/laws/show/z0340-09 (accessed on 12 November 2026).
- Ministry of Transport and Communications of Ukraine. Coefficients Applicable to the Collection of Tariffs for Freight Transportation by Rail. Available online: https://zakon.rada.gov.ua/laws/show/z0341-09 (accessed on 12 November 2026).
- Ministry of Infrastructure of Ukraine. Order No. 782 of 8 October 2013: On Approval of the Procedure for Revising Tariffs for Freight Transportation by Rail. Available online: https://zakon.rada.gov.ua/laws/show/z1762-13 (accessed on 14 November 2026).
- JSC Ukrainian Railways. Monthly Rates for the Use of Carrier-Owned Freight Wagons (January 2024–September 2026). Available online: https://uz-cargo.uz.gov.ua/stavky-platy-za-vykorystannia-vahoniv (accessed on 13 November 2026).
- JSC Ukrainian Railways. Empty-Run Coefficients (Kpp) for Carrier-Owned Freight Wagons, 2024. Available online: https://www.uz.gov.ua/cargo_transportation/tariff_conditions/stavky/kpp24/ (accessed on 14 November 2026).
- JSC Ukrainian Railways. Empty-Run Coefficients (Kpp) for Carrier-Owned Freight Wagons, 2025. Available online: https://www.uz.gov.ua/cargo_transportation/tariff_conditions/stavky/kpp25/ (accessed on 14 November 2026).
- JSC Ukrainian Railways. Empty-Run Coefficients (Kpp) for Carrier-Owned Freight Wagons, 2026. Available online: https://www.uz.gov.ua/cargo_transportation/tariff_conditions/stavky/kpp26/ (accessed on 14 November 2026).
- JSC Ukrainian Railways. Average Transportation Speeds of Carrier-Owned Freight Wagons (2024–2026). Available online: https://uz-cargo.uz.gov.ua/serednia-shvydkist-perevezennia-vlasnoho-vahonu (accessed on 13 November 2026).
- Suslov, A.V.; Zahaikevych, K.I. Assessment of the Irregularity of Grain Cargo Transportation by Rail in Ukraine. Transp. Syst. Transp. Technol. (In Ukrainian) 2025, 30, 66–72. [Google Scholar] [CrossRef] [PubMed]
- Bulakh, M. Evaluation and Reduction of Energy Consumption of Railway Train Movement on a Straight Track Section with Reduced Freight Wagon Mass. Energies 2025, 18, 280. [Google Scholar] [CrossRef]
- Bayramoğlu, K.; Çelikoğlu, Ş.; Turan, İ. An Examination of the Emissions, Cost, and Time of Intermodal Transportation. Sustainability 2025, 17, 2368. [Google Scholar] [CrossRef]
- United Nations. Goal 9: Build Resilient Infrastructure, Promote Inclusive and Sustainable Industrialization and Foster Innovation. Available online: https://sdgs.un.org/goals/goal9 (accessed on 12 November 2026).
- United Nations. Goal 12: Ensure Sustainable Consumption and Production Patterns. Available online: https://sdgs.un.org/goals/goal12 (accessed on 12 November 2026).
Figure 1.
Monthly usage rates for selected freight wagon types, January 2024 ‒ September 2026.
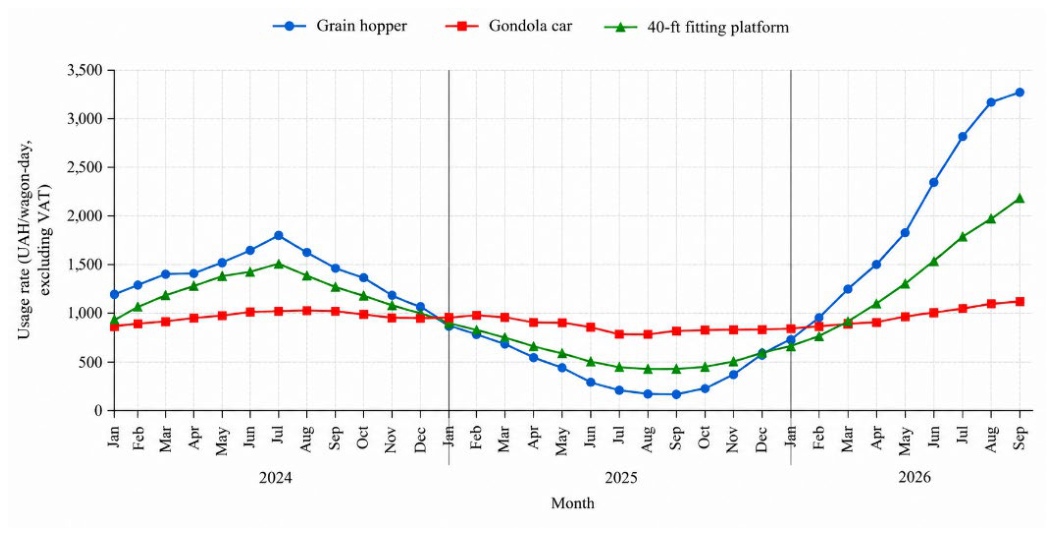
Figure 2.
Normalized dynamics of wagon usage rates (January 2024 = 100).
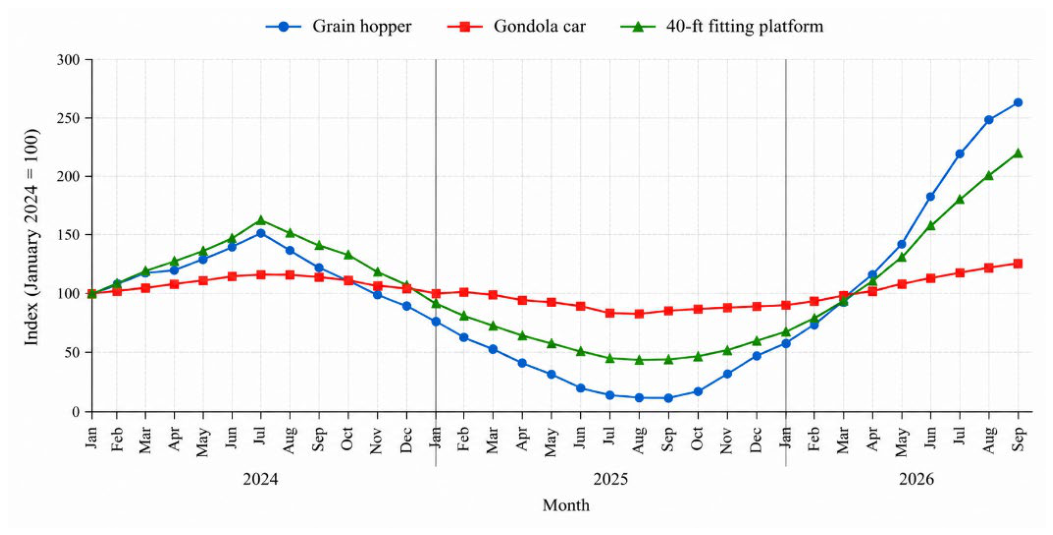
Figure 3.
Variability of wagon usage rates by wagon type: (a) CV; (b) mean absolute monthly change.
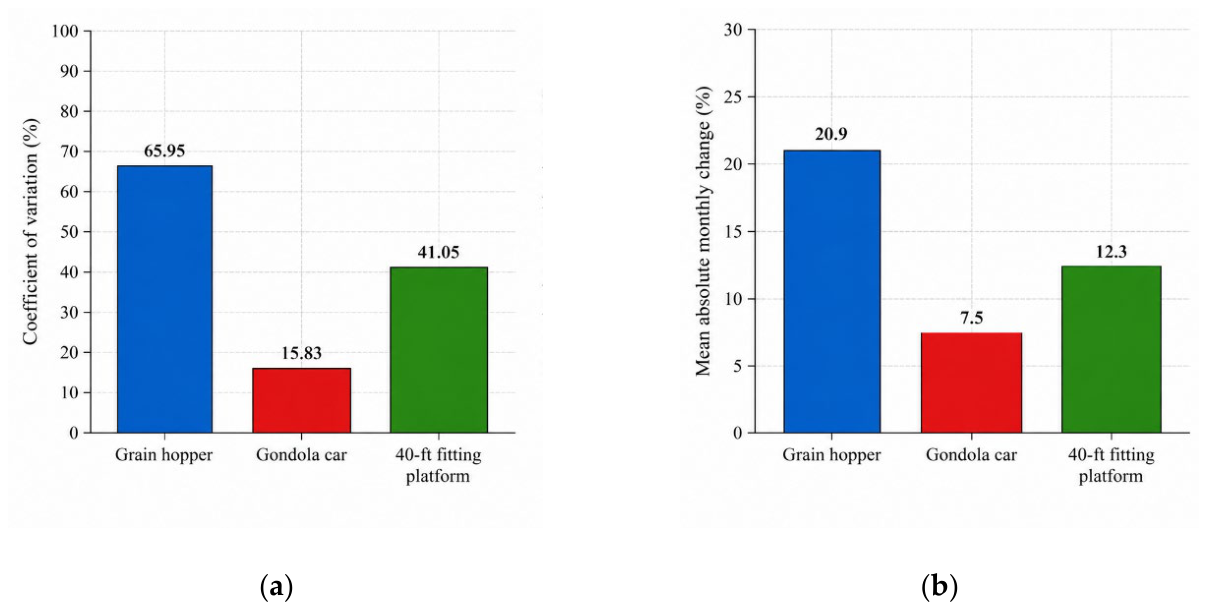
Figure 4.
Changes in empty-run coefficients for selected freight wagon categories, 2024–2026.
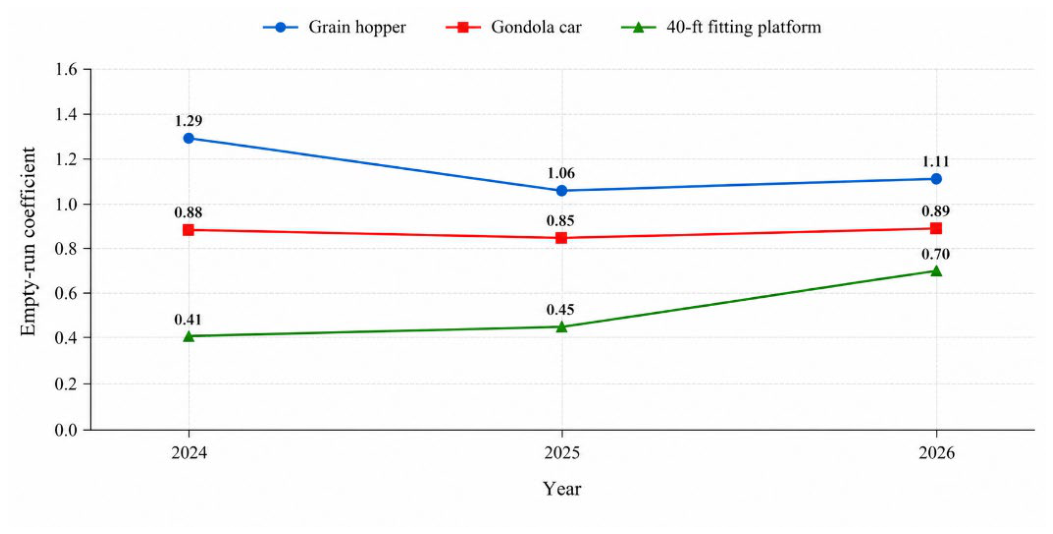
Figure 5.
Relative effect of route-based transportation on average transportation speed (RETS) by wagon category and traffic condition.
Figure 5.
Relative effect of route-based transportation on average transportation speed (RETS) by wagon category and traffic condition.
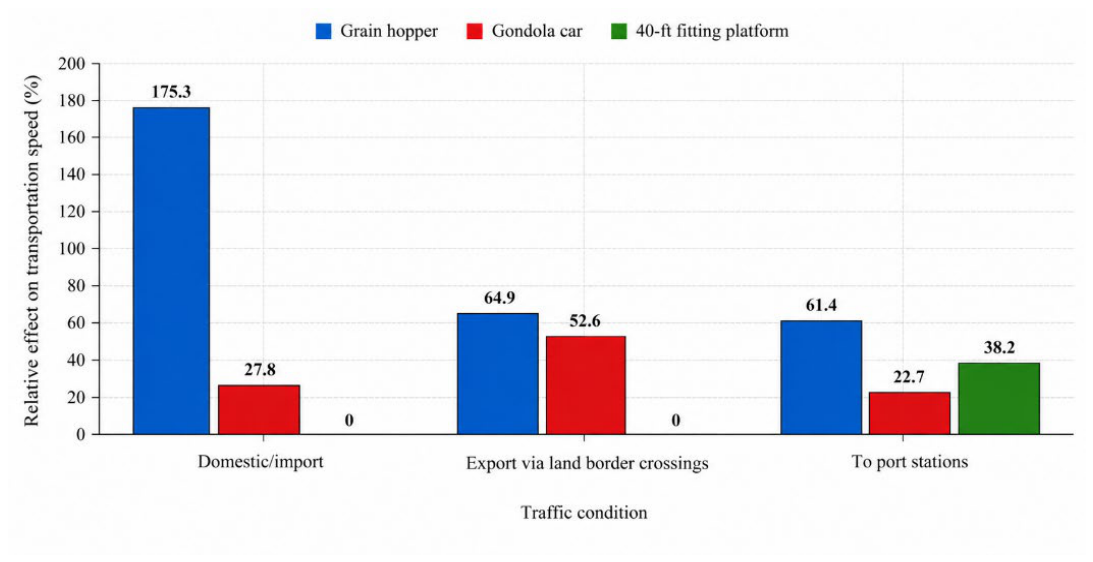

Table 1.
Descriptive statistics of wagon usage rates, January 2024 – September 2026.
| Indicator | Grain hoppers | Gondola cars | 40-ft fitting platforms |
| Observations | 33 | 33 | 33 |
| Mean, UAH/wagon-day | 1,397.2 | 1,377.3 | 1,240.9 |
| Median, UAH/wagon-day | 1,250 | 1,350 | 1,350 |
| Minimum, UAH/wagon-day | 203 | 1,100 | 400 |
| Maximum, UAH/wagon-day | 3,271 | 1,850 | 2,150 |
| Maximum/minimum | 16.11 | 1.68 | 5.38 |
| CV, % | 65.95 | 15.83 | 41.05 |
| MAMC, % | 20.9 | 7.5 | 12.3 |
Table 2.
Empty-run coefficients and average transportation speeds of selected wagon categories.
| Indicator | Grain hopper | Gondola car | Fitting platform |
| Empty-run coefficient | |||
| 2024 | 1.29 | 0.88 | 0.41 |
| 2025 | 1.06 | 0.85 | 0.45 |
| 2026 | 1.11 | 0.89 | 0.70 |
| Domestic/import, km/day | |||
| Single/container dispatch | 93 | 126 | 153 |
| Route/container train | 256 | 161 | 153 |
| RETS, % | +175.3 | +27.8 | 0.0 |
| Export via land border crossings, km/day | |||
| Single/container dispatch | 131 | 196 | 185 |
| Route/container train | 216 | 299 | 185 |
| RETS, % | +64.9 | +52.6 | 0.0 |
| Transportation to port stations, km/day | |||
| Single/container dispatch | 158 | 203 | 157 |
| Route/container train | 255 | 249 | 217 |
| RETS, % | +61.4 | +22.7 | +38.2 |
Table 3.
Reported empty-run coefficients and calculated PMS.
| Wagon category | 2024 Ker | 2024 PMS, % | 2025 Ker | 2025 PMS, % | 2026 Ker | 2026 PMS, % |
| Grain hoppers | 1.29 | 43.67 | 1.06 | 48.54 | 1.11 | 47.39 |
| Gondola cars | 0.88 | 53.19 | 0.85 | 54.05 | 0.89 | 52.91 |
| Fitting platforms (all lengths) | 0.41 | 70.92 | 0.45 | 68.97 | 0.70 | 58.82 |
Note: PMS = 100/(1 +Ker), whereKeris the ratio of empty mileage to loaded mileage. The empty-run coefficients for fitting platforms cover platforms of all lengths. PMS values are calculated from the published annual coefficients and do not represent independently measured mileage shares for the corresponding calendar years.
Table 4.
Reported transportation speeds and derived RETS and RTTS indicators for 2026.
| Traffic condition | Wagon category | Single, km/day | Route, km/day | RETS, % | RTTS, % |
| Domestic/import | Grain hoppers | 93 | 256 | +175.3 | 63.67 |
| Domestic/import | Gondola cars | 126 | 161 | +27.8 | 21.74 |
| Domestic/import | Fitting platforms | 153 | 153 | +0.0 | 0.00 |
| Land-border exports | Grain hoppers | 131 | 216 | +64.9 | 39.35 |
| Land-border exports | Gondola cars | 196 | 299 | +52.6 | 34.45 |
| Land-border exports | Fitting platforms | 185 | 185 | +0.0 | 0.00 |
| Port stations | Grain hoppers | 158 | 255 | +61.4 | 38.04 |
| Port stations | Gondola cars | 203 | 249 | +22.7 | 18.47 |
| Port stations | Fitting platforms | 157 | 217 | +38.2 | 27.65 |
Disclaimer/Publisher’s Note: The statements, opinions and data contained in all publications are solely those of the individual author(s) and contributor(s) and not of MDPI and/or the editor(s). MDPI and/or the editor(s) disclaim responsibility for any injury to people or property resulting from any ideas, methods, instructions or products referred to in the content. |
© 2026 by the authors. Licensee MDPI, Basel, Switzerland. This article is an open access article distributed under the terms and conditions of the Creative Commons Attribution (CC BY) license (http://creativecommons.org/licenses/by/4.0/).
Copyright: This open access article is published under a Creative Commons CC BY 4.0 license, which permit the free download, distribution, and reuse, provided that the author and preprint are cited in any reuse.