
Submitted:
16 November 2026
Posted:
17 November 2026
You are already at the latest version
Abstract
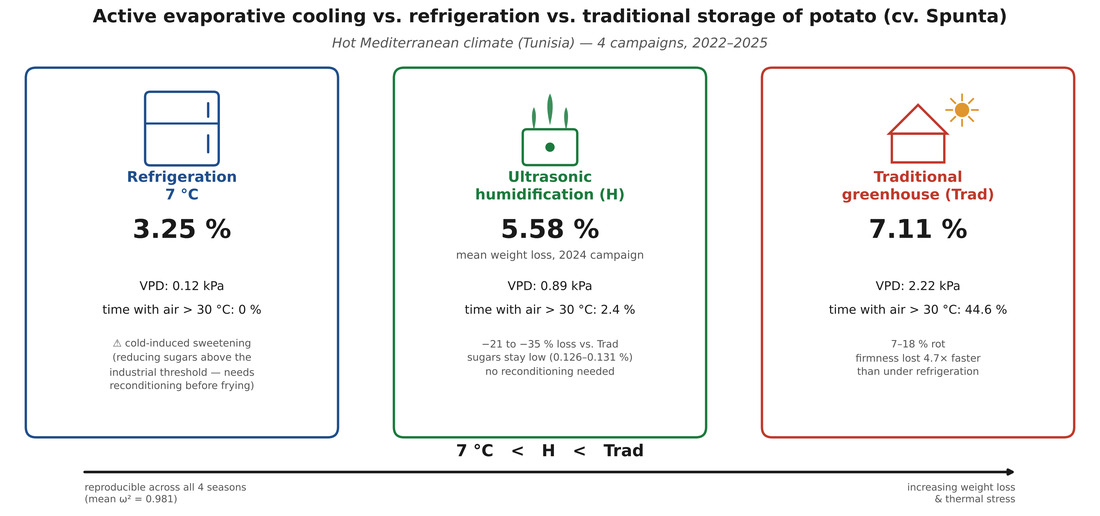
Storing potato after harvest is challenging in a hot Mediterranean climate, where in-crate temperatures can reach 41–42 °C and cold storage is not always accessible to growers. This study pools four campaigns (2022–2025) at the CTPTA (Tunisia) on cv. Spunta, comparing refrigeration at 7 °C, ultrasonic humidification (H) and traditional greenhouse storage (Trad), testing the reproducibility of their ranking. Storage mode explains 95.5–99.6% of weight-loss variance, and the order 7 °C < H < Trad never inverts across four seasons (mean ω² = 0.981; Mode × Year interaction under 1%). Refrigeration minimises losses (1.86–3.88%) and preserves sanitary quality but triggers cold-induced sweetening beyond the industrial threshold (0.548–0.559%), unsuitable for frying without reconditioning. Humidification keeps sugars low (0.126–0.131%) and limits losses to 3.99–6.36%, cutting them 21–35% relative to the traditional mode, which reaches 5.13–8.63% with 7–18% rot. Skin firmness and titratable acidity (2024) recover the same hierarchy: firmness declines 4.7 times faster under the traditional mode than refrigeration (−1.965 vs −0.416 N/week), and acidity about three times faster (−0.052 vs −0.017 point/week). Sensor monitoring (2024–2025) ranks vapour pressure deficit in the same order (0.12 < 0.89 < 2.22 kPa in 2024), humidification holding the air 6.2 °C and 5.4 °C below the traditional mode and outside temperature at midday. Refrigeration remains the fresh-market reference but requires reconditioning before processing; humidification decouples loss control from technological suitability, offering the most reproducible low-energy option where cold chains are unavailable. Single-site, single-cultivar scope limits external validity.
Keywords:
Solanum tuberosum
; post-harvest storage
; ultrasonic humidification
; cold-induced sweetening
; weight loss
; reproducibility
; Mediterranean Tunisia
1. Introduction
Potato (Solanum tuberosum L.) is the world's fourth food crop. In Tunisia, it is a strategic sector covering between 35,000 and 40,000 hectares with a production of around 400,000 tonnes, 80% of which is the Spunta variety [1,2]. Its marketing is nonetheless hampered by considerable post-harvest losses. Under the Tunisian summer climate, where the air regularly exceeds 40 °C, poorly controlled storage can destroy 20 to 40 % of the harvested mass [3,4]; depending on the season, storage losses are further aggravated by disease pressure under humid conditions and by sprouting and natural deterioration under dry conditions [5]. Reducing these losses has a direct impact on producers' incomes and the region's food security.
The solutions available to the Tunisian grower are shaped by economic and energy constraints. Mechanical refrigeration between 4 and 8 °C is the international standard [3], but it requires infrastructure that is both costly and highly energy-intensive. Due to farmers' limited access to refrigeration, traditional storage in greenhouses or unregulated facilities remains widespread. This type of storage exposes tubers to high summer temperatures, resulting in significant quantitative and qualitative losses. Against this backdrop, evaporative cooling via ultrasonic humidification offers a promising compromise. This process, which generates water micro-droplets using high-frequency piezoelectric vibrations [6], provides a viable intermediate solution that farmers can implement independently at ambient temperatures and without the need for a compressor. The method maintains high relative humidity within the storage space; humidifying the air converts sensible heat into latent heat thereby lowering the temperature and reduces the vapor pressure gradient responsible for transpiration, all while entailing far lower investment and energy costs than refrigeration.
Evaporative cooling resulting from ultrasonic humidification relies on the same principle of latent heat of vaporization as passive fan-and-pad (or wet-media) cooling systems. These systems have been widely documented in recent years for fruit and vegetable storage in hot, dry regions [7,8,9,26]. These passive systems usually lower the temperature by several degrees by forcing air through a large, wet surface area, though they require significant space and depend on low ambient humidity to function effectively. Their saturation efficiency is moderate, from 64 to 70 % for cellulosic pads tested under Mediterranean greenhouse conditions [29]. Over time, the porous trickle material becomes fouled and accumulates mineral deposits, which reduce porosity and increase the pressure drop across the panel by approximately 170% after three seasons of operation [30]. Clogging caused by water impurities, algae, and decomposition affects wetting uniformity and, in extreme cases, renders the system inoperable. The air passing through a permanently wetted medium before reaching the produce creates conditions favourable to microbial proliferation which is unsuitable in food storage process. The current maintenance guidance for evaporative systems has been judged insufficient on this point [31]. Piezoelectric nebulization disperses micro-droplets directly upstream of the storage area's air intake. The device is compact, and its output is electronically adjustable against a temperature or humidity set point, independently of the airflow design; the cooling obtained nevertheless remains bounded by the wet-bulb temperature of the air. It is this precisely controllable, active form of evaporative cooling that distinguishes it from passive counterparts. This method has been less studied than the passive systems evaluated here for potatoes.
From a qualitative standpoint, cold storage presents a major biochemical drawback: sugar accumulation. At temperatures below 8–10°C, the tuber's enzymatic balance shifts toward starch hydrolysis—driven by the combined action of phosphorylase, amylase, and, above all, vacuolar acid invertase, which releases sucrose followed by glucose and fructose [10,11,12,13,24]. Once the reducing sugar content exceeds the industrial threshold of 0.25% of fresh weight, frying quality is compromised: at high temperatures, the Maillard reaction between reducing sugars and amino acids causes excessive browning of chips and french fries and generates acrylamide, an undesirable compound [14]. This sugar accumulation phenomenon is partially reversible through thermal reconditioning by warming tubers, which reactivates starch resynthesis [15]; however, this process consumes both time and energy. Evaporative cooling/humidification is a storage method designed to prevent or minimize this issue providing a compelling technical argument for the potato-processing sector.
The weight loss is not the only criterion of performance for a potatoes storage system. The market and technological quality of the tuber involves several physically distinct dimensions such as the dry matter content, a major technological criterion that evolves in storage under the combined effect of concentration by dehydration and respiratory consumption; the skin firmness, a mechanical indicator of skin suberization and impact resistance, on which handling suitability depends and the titratable acidity, a tracer of metabolic evolution and senescence [16,17]. Comparing indicators of independent nature: gravimetric, mechanical, biochemical, limits the risk of a diagnosis biased by a single criterion.
The aim of this study is to compare three potato storage methods practiced at various levels in Tunisia. The viability of evaporative cooling combined achieved through ultrasonic humidification will be analyzed alongside mechanical refrigeration and traditional storage.
Objectives
Because access to refrigerated storage is limited by its cost, most Tunisian growers rely on traditional storage, which exposes tubers to high losses as well as to disease and rot risks that are further aggravated by inter-seasonal climatic variability. This study aims first to optimise active evaporative cooling by ultrasonic humidification as an on-farm alternative storage method, accessible to growers, capable of limiting these losses and giving the grower some latitude to manage the timing of sales of their production. Refrigeration at 7 °C is used as a performance benchmark, to situate the proposed method relative to what the cold chain achieves when it is accessible. This evaluation draws on a set of quantitative and qualitative tuber parameters — weight loss, reducing-sugar content, dry matter, firmness and titratable acidity — monitored throughout four consecutive storage campaigns (2022–2025).
A second objective is to assess the ability of the humidification system, instrumented with a network of IoT sensors, to reliably and homogeneously control storage conditions (temperature, relative humidity) throughout the enclosure, together with the robustness of the control strategy implemented. This is therefore not simply a matter of using these sensors as a measurement tool, but of verifying — as a condition for the system's practical viability for growers — that an instrumented device of this kind is indeed capable of maintaining homogeneous, controlled conditions, which is itself a prerequisite for the observed storage performance to be attributable to the mode itself rather than to uncontrolled heterogeneity within the enclosure.
Finally, a third, methodological objective is to test whether the hierarchy observed between the storage modes reproduces from one campaign to the next. In the Mediterranean climate, the intensity and duration of heat waves vary appreciably from one year to the next, so that a difference observed over a single season could reflect that year's particular conditions rather than a robust effect of the storage mode. Claiming that a mode is ‘reliable’ is therefore a statistical claim, tested here formally by means of the Mode × Year interaction and the comparison of effect sizes across the four campaigns.
2. Materials and Methods
2.1. Site, Plant Material and Campaigns
The trials were conducted at the Technical Centre for Potato and Artichoke (CTPTA) in Manouba-Essaida (36°47′ N, 10°02′ E), on deep clay soil representative of the main production areas of northern Tunisia. The Spunta variety (E category), grown under drip irrigation following regional practice, was mechanically harvested at maturity over four consecutive campaigns (2022, 2023, 2024 and 2025). From one year to the next, the storage conditions (July to September) proved severe: summer maxima of 41 to 44 °C, a gap of 15 to 18 °C above European reference conditions. This thermal exposure amplifies transpiration and respiration, that the evaluated storage modes precisely aim to master.
Chosen as reference material for all campaigns, the Spunta is characterizable by its oblong yellow-fleshed tubers, its short dormancy index and its moderate sensitivity to Phytophthora infesting. It represents about 80 % of Tunisian production, which provides to results a direct relevance for the sector of potatoes production. The design covered the whole post-harvest cycle, from harvest to the end of storage, each mode being applied to independent replicates (five to ten depending on the campaign). Tubers were randomly allocated from the harvest lot to each replicate bag. Bags were randomly positioned within the crate stack of their storage chamber to average out any residual spatial gradient. Experimental measurements were done at regular intervals over five standardized periods in order to follow up the full kinetics of losses and quality evolution. The progressive upgrading of the design, such as more replicates, addition of measuring instruments and a connected-sensor network, explains the continuous improvement in statistical precision from one campaign to the next.
Site climatic conditions during storage. The Manouba site has a hot, dry-summer Mediterranean climate (Köppen-Geiger classification: Csa). Over the storage period, from 1 July to the end of September, the region has met its most constraining conditions. The mean maxima were in the order of 33 to 37 °C in July–August, reaching or exceeding 40 °C during heat waves. The summer relatively humidity are low , ranging, usually, from 55 to 60 % and there is almost no rainfall. The traditional mode in conjunction to these severes conditions exposed tubers to high temperature unsuitable for preservation, hence the high losses and rapid senescence that are usually recorded. During the four campaigns, a DELTA OHM weather station installed on site continuously monitored air temperature and relative humidity (Table 1). These latter are the two variables driving the vapour-pressure deficit responsible for tuber transpiration.
Solar radiation and rainfall records are incomplete for parts of 2023–2024 caused by an instrument interruption.
2.2. Storage Modes Compared
Three modes tested and compared in each campaign are:
refrigeration at 7.0 ± 0.5 °C;
Evaporative cooling by ultrasonic humidification (H), misting by piezoelectric transducers (1–5 µm droplets). The ultrasonic humidification enclosure was instrumented continuously by a five-node IoT sensor system.
traditional storage (Trad) at ambient temperature in a greenhouse, which serves as control. The greenhouse is shielded from direct solar radiation by two superposed layers: a woven reed screen, topped by a layer of straw, which together exclude solar radiation and protect the tubers from sunscald. The greenhouse is further ventilated on both sides to facilitate air renewal. Inside, the bulk storage is organized using straw bales assembled into a cube; the floor is first covered with a layer of straw, on which the potatoes are placed for storage, then covered with a loose straw layer approximately 50 cm thick above the tubers.
For the 3 storage modes, tubers were packed in 5 kg mesh bags (one replicate = one bag). The bags were placed in stacked plastic crates (Figure 1b and Figure 2). Physiological weight losses were monitored by precision weighing and expressed as a cumulative percentage of the initial mass. Dry matter (oven drying at 105 °C), reducing sugars (enzymatic glucose assay, %RS = %Glucose/FW × 1.8), sprouting and rot were recorded during storage.
Instrumentation and characterization of internal conditions: During the 2024 and 2025 campaigns, the three modes were continuously instrumented by a connected-sensor network: five nodes serving the humidification mode, three above the crates inside the chamber and two in the underfloor plenum, one node in the cold room, one node in the greenhouse and one to two outdoor reference nodes (Figure 3). Each node recorded air temperature and relative humidity to within ±0.2 °C and ±2 % RH. Inside crates, the carbon dioxide concentration and temperature were also measured using a digital probe immersed among the tubers at the center of a crate. After a physical plausibility filter removing sensor fault codes (Table S4), 69,467 instantaneous records were retained, spread over 46 to 57 monitored days per mode. These records characterize, for each mode, the physical constraint effectively borne by the lot, summarized by the vapor pressure deficit (VPD) of the air as the direct driver of cuticular transpiration and by the temperature reached inside the crates (§ 3.2).
Implementation of the three modes: Refrigeration was carried out in a cold room maintained at 7.0 ± 0.5 °C with humidity control; this temperature corresponds to the optimal range recommended for table potato, low enough to slow transpiration, respiration and sprouting. The 7°C was chosen at 7 °C rather than 4 °C in order to limit the intensity of cold sweetening based on a preliminary comparison having confirmed, in 2022 campaign, the excessive sugar accumulation at 4 °C. Humidification was provided by an industrial ultrasonic unit (BH-05; 600 W, 220 V, 50 Hz; stainless-steel housing, 550 × 480 × 500 mm) fitted with four misting blocks totaling ten transducer heads, delivering up to 5 L/h of microdroplets in the 1–5 µm range. It was supplied from the mains water network and fitted with an automatic reservoir level control. A three-stage cartridge filter (EJIM, Tunisia), installed on the water supply and in place throughout the four campaigns, retained suspended particles; no pretreatment of dissolved minerals (softening or demineralisation) was applied. Since the dissolved salts of mains water may deposit on the transducers and be carried with the microdroplets, such a pretreatment is recommended for prolonged operation. The set-up was improved from one campaign to the next. In 2022 and 2023, the humidifier, installed outside the storage chamber (5 × 3 × 3 m), injected the mist directly into it through an inlet located 2.5 m above the floor, without outside-air admission or exhaust fan; it was driven by its relative-humidity set point and stopped when relative humidity reached 90 %. From 2024 onwards, the humidifier, still installed outside the chamber (Figure 1c), discharged a mixture of air and microdroplets through two ducts into an underfloor tunnel measuring 2 × 1 × 3 m, supplied with outside air by an intake fan; from this tunnel, the humidified air rose through a grooved grille and then through the ventilated crate stacks. The hot, dry Tunisian summer favours this mechanism: as ambient humidity can fall to 21–35 % on the driest days, the difference between air temperature and its wet-bulb temperature, which measures the cooling potential, remains large. A connected control unit (Figure 1a) operated the installation according to three rules. (i) Temperature is the regulated variable. The set point is the wet-bulb temperature of the outside air (adiabatic saturation temperature, T_wet,out), measured by the outdoor reference node, which is the theoretical limit of evaporative cooling. The humidifier was switched on as long as the mean chamber temperature, averaged over the three nodes located above the crates (N1–N3), remained above T_wet,out, and switched off as soon as it fell to T_wet,out. (ii) The relative humidity of the incoming air was kept between 80 and 90 %. (iii) As an exception to rule (i), whenever the outside air temperature fell below the chamber temperature, mainly at night, the humidifier remained off and only the intake fan operated, the outside air then providing the cooling directly. Without forced exhaust, however, the humidified air remained in the chamber in 2024, with a risk of condensation on the tubers. In 2025, the installation was completed by an exhaust fan, switched on in the event of a condensation risk, an excessive temperature rise, or a failure of the humidifier or of the intake fan, and by (iv) a differential rule that switched between recirculation of chamber air and admission of outside air whenever the indoor–outdoor difference exceeded 10 °C or 10 % RH. The traditional mode, finally, reproduces the widespread practice of greenhouse storage at ambient temperature, the lots being covered with straw under a shading net (Figure 2), a control representative of the conditions undergone by the majority of non-refrigerated lots. In all three modes, packaging was identical (5 kg mesh bags), so that only the thermo-hygrometric condition differed.
Equipment and operating balance: The cooling obtained under humidification arises from evaporation itself, without mechanical refrigeration, and the equipment represents a markedly lower capital outlay than a cold room. Electrical consumption was not metered during the trials, so no comparison of running energy against refrigeration is advanced here; the unit is rated at 600 W, and its energy and water balance — up to 5 L/h of mains water while operating, a consideration of weight in a water-scarce region — deserves dedicated measurement.
2.3. Experimental Designs by Campaign
The four campaigns shared the storage protocol above but differed in sample size, duration and design, as summarized in Table 2. The first three campaigns (2022, 2023, 2024) relied on a single harvest lot; in the 2025 campaign a factorial design crossing three harvest dates (105, 120 and 135 days after planting, DAP) and the three methods was adopted. In 2025, only one lot, of maturity comparable to the single lot of the previous campaigns, is analysed here.
2.4. Pre-Storage Phase
Immediately after mechanical harvest, the tubers were transported to a covered, naturally ventilated shed for a pre-storage phase of variable duration depending on the campaign (16 days in 2022, 10 in 2023, 18 in 2024). This transition phase, agronomically essential, fulfils three functions: the progressive cooling of the harvested mass, the healing of mechanical injuries by suberization (deposition of suberin forming a wound periderm that limits infection and dehydration), and the sanitary and qualitative sorting before storage. Weight losses during this phase were determined by individually weighing 10 crates at the beginning and at the end of pre-storage (Table 3).
2.5. Measured Variables and Protocols
The main summary variable is the cumulative physiological weight loss (%), available at the replicate level in the four campaigns. It was determined by gravimetric weighing of the bags and expressed as a cumulative percentage of the initial mass of each bag at entry into storage.
Dry matter. The dry matter content (%DM) was determined by oven drying at 105 ± 2 °C to constant mass [32]. In storage, dry matter evolution results from two antagonistic processes: concentration and respiration. Dry matter content increases with water loss and decreases with the respiratory consumption of reserves; it is therefore not a monotonic indicator of the storage regime (see § 3.9).
Reducing sugars. At each sampling date, samples of five tubers (two to four samples per mode depending on the campaign; Table 11) were taken from bags reserved for destructive analyses, kept in each mode next to the weighing bags. The juice was extracted with a centrifugal juicer and glucose was assayed in it by the enzymatic Gluco-LIS® method, validated according to the ICH Q2(R1) standard by Ouni et al. [18]; in 2022, each sample was read three times and the mean of the readings was retained. Readings below the detection limit were set at that limit (10 mg/dL). Reducing sugars (%RS) are derived from glucose using (Eq. 3). The reference industrial threshold, widely accepted in the processing literature, is set at 0.25 % reducing sugars on fresh weight, beyond which the Maillard reaction during frying causes excessive browning and acrylamide formation [10,14].
Skin firmness. Skin firmness, a direct mechanical indicator of skin suberization and handling suitability, was measured with a PCE-FM 200 digital penetrometer. The instrument covers a range of 0–200 N with an accuracy of ± 0.05 % of full scale and is fitted with a 30° conical tip suited to non-destructive monitoring of the periderm. The skin firmness was expressed in newtons (N) Its evolution during storage was characterised, per mode, by the degradation slope (linear regression, N/week) and the end-of-trial value, allowing a relative comparison between modes rather than a comparison against a fixed threshold.
Titratable acidity. Titratable acidity (TA), a tracer of metabolic evolution and senescence, was determined on tuber juice with an HI84532 automatic titrator (Hanna Instruments) and expressed as grams of citric acid per 100 mL of juice (% w/v), citric acid being the dominant organic acid in potato tubers. Its evolution was characterised, per mode, by the decline slope (point/week) and the end-of-trial value.
The two instrumental measurements, skin firmness and titratable acidity, were introduced with the 2024 protocol upgrade and monitored per mode throughout storage. In 2025, they were measured at harvest to compare the three harvest dates; they therefore belong to a separate study and are not reported here.
Sanitary quality. Sprouting and rot were recorded as sanitary indicators (2022–2024). Disease-related losses during prolonged potato storage are reported in the literature to range from 0.6 to 10 % [35]; this range served as an operational reference for judging when a lot had crossed the threshold of commercial viability, a criterion specific to this trial. Table 4 summarizes the variables available per storage mode and campaign.
2.6. Computed Quantities
Cumulative physiological losses are expressed, at each period, as a percentage of the initial bag mass (Eq. 1), where M₀ is the mass at the starting of storage and Mₜ the mass at date t. The dry matter content is obtained by oven drying (Eq. 2). Reducing sugars (glucose + fructose) are estimated from the assayed glucose (Eq. 3), using the conversion factor of 1.8 recommended in the Gluco-LIS® user manual [33]; this factor corresponds to a fructose content close to 0.8 times that of glucose and assumes a constant fructose/glucose ratio across storage modes.
Loss (%) = (M₀ − Mₜ) / M₀ × 100
%DM = (dry mass / fresh mass) × 100
%RS = %Glucose × 1.8
Effect sizes are quantified in two complementary ways. Omega-squared, a nearly unbiased estimator of the explained proportion of variance, is computed for each campaign (Eq. 4). For pairwise comparisons, Cohen's d [19] is estimated from the Welch t statistic and the group size n (Eq. 5). In the combined analysis, the partial eta-squared is reported for each model term (Eq. 6), and the proportion of total variance is given by the ratio of the effect sum of squares to the corrected total sum of squares.
ω² = (SS_effect − df_effect × MS_error) / (SS_total + MS_error)
d = 2t / √(2n − 2)
η²ₚ = SS_effect / (SS_effect + SS_error)
The vapour pressure deficit is computed from the temperature–relative humidity pair: saturation vapour pressure follows the Tetens formulation (Eq. 7) and the deficit results from the gap to the actual vapour pressure (Eq. 8).
where T is air temperature (°C), RH relative humidity (%) and eₛ the saturation vapour pressure (kPa) [27]. Wet-bulb temperature was estimated after the Stull approximation [28] in order to quantify the evaporative cooling potential of each atmosphere. The saturation efficiency of the humidified enclosure, the conventional basis on which evaporative coolers are compared, was then computed over the 12–18 h window (Eq. 9):
where T_out is the outdoor dry-bulb air temperature (°C), measured by the outdoor reference node; T_H the mean air temperature of the humidified chamber (°C), averaged over the three nodes N1–N3; and T_wet,out the outdoor wet-bulb temperature (°C), computed with the Stull approximation [28] from T_out and the outdoor relative humidity, which is also the control set point of the humidifier (§ 2.2). The numerator
eₛ = 0.6108 × exp[17.27 · T / (T + 237.3)]
VPD = eₛ × (1 − RH/100)
η_sat = (T_out − T_H) / (T_out − T_wet,out) × 100
2.7. Statistical Analysis Plan
Research question and experimental parameters. The analysis aims to establish whether the ranking of the three modes for weight losses (7 °C < H < Trad), and the advantage of humidification over the traditional mode, hold from one campaign to the next despite differing climatic conditions, durations and sample sizes; if so, losses are determined by the storage mode rather than by the season. The design crosses two factors: storage mode (7 °C, H, Trad) and campaign (2022 to 2025). The experimental unit is the 5 kg mesh bag (5 bags per mode in 2022 and 2025, 10 in 2023 and 2024; Table 2). The main variable is the cumulative weight loss, measured on each bag at five reading dates (P1 to P5); the quality variables (reducing sugars, dry matter, firmness, acidity, sanitary state) serve to interpret the differences in losses.
Level 1: mode effect within each campaign. At each reading date, the losses of the three modes were compared by one-way ANOVA, together with a Kruskal-Wallis test, which does not assume normality. Pairwise comparisons rely on the Tukey HSD test [23] and Welch's t-test, with Cohen's d [19] quantifying the gap between two modes. Normality of residuals (Shapiro-Wilk [20,21]) and homogeneity of variances (Levene-Brown-Forsythe [22]) were checked; when variances were heterogeneous, Welch's ANOVA was applied (Table 10). This level establishes the ranking of the modes for each season.
Level 2: stability of the ranking across campaigns. To compare seasons at equal duration, losses were brought to two common dates: D50 for the three modes, and D70 for refrigeration and humidification only; when no reading fell exactly on these dates, the value was obtained by linear interpolation between the two bracketing readings. The end-of-storage losses of the 2023 to 2025 campaigns (N = 75 bags) were then analysed with a general linear model with two fixed factors, mode and campaign, and their interaction (type III sums of squares, suited to unequal sample sizes); the 2022 campaign is excluded, the traditional mode having been stopped early. If the conclusions are reproducible, a dominant mode effect, a mode × campaign interaction small relative to it, and the same Tukey ranking every year are expected. For reducing sugars, the modes were compared at the end of storage within each campaign (Welch’s ANOVA, Kruskal-Wallis test, Tukey comparisons), each mode was compared with the 0.25 % industrial threshold (one-sample t-test), and the increase in sugars during storage was analysed with a Mode × Campaign general linear model pooling all four campaigns (2022–2025, n = 60).
Level 3: generalisation beyond the observed seasons. A linear mixed model, with mode as a fixed effect and campaign as a random effect, treats the campaigns studied as a sample of possible seasons: a significant mode effect in this model indicates that the ranking can be expected in other years. A principal component analysis and Pearson correlations between campaigns complete this plan, describing respectively the separation of the modes across all variables and the similarity of loss kinetics from one year to the next. Analyses were performed with IBM SPSS Statistics 27.
2.8. State of the Material Entering Storage
In each campaign, the lots placed in storage came from the optimal harvest period determined in the field, ensuring a homogeneous maturity stage of the incoming material, comparable from one year to the next. This initial homogeneity ensures that the gaps observed during storage are attributable to the mode, and not to initial heterogeneity. One exception should be noted for methodological transparency: the single harvest lot used in the 2023 campaign was pulled from the field at approximately 137 days after planting, later than in the other campaigns; no systematic effect of this later harvest date on the measured outcomes was detected.
3. Results and Discussion
3.1. Measured Storage Conditions
Evaporative Cooling and Vapour Pressure Deficit
Site climate and humidification chamber, as measured. Over the July–September storage window, the on-site DELTA OHM station recorded mean air temperatures ranging from 27.1 to 28.3 °C across campaigns, with daily maxima reaching 44 to 48 °C, and mean relative humidity ranging from 46 % (2022) to 57 % (2024), falling as low as 21–35 % on the driest days (Table 1). Inside the humidification enclosure, the three nodes above the crates maintained a mean temperature of 26.8 ± 2.0 °C at a mean relative humidity of 75.2 ± 12.1 % in 2024, and 25.3 ± 2.1 °C at 84.1 ± 10.7 % in 2025 (Table 5). Monthly means reached saturation intermittently in both campaigns (RH = 100 % at the wettest hours), the enclosure operating between 74.8 % and 81.2 % of relative humidity from July to September 2024 and between 93.1 % and 74.4 % from June to August 2025. Maintaining relative humidity above 70 % for 71 % of the monitored time in 2024 and 90 % in 2025, combined with slight evaporative cooling (latent heat drawn from the air, L = 2,501 kJ/kg at 25 °C), lowers the vapour pressure deficit between the tuber and the air and limits cuticular transpiration, the dominant weight-loss mechanism under hot conditions.
The vapor pressure deficit, the driving force of water vapour diffusion through the periderm, ranks in the same order in both instrumented campaigns: 7 °C < H < Trad (0.12 < 0.89 < 2.22 kPa) in 2024 and 0.33 < 0.57 < 0.97 kPa in 2025 (Table 5).
Humidification and traditional storage. The two modes accessible without a cold chain provided higher difference in storage conditions, with respect to the 4 periods of the day, mainly during the hottest hours. In 2024, ultrasonic humidification lowered the mean VPD from 2.22 to 0.89 kPa, a 60 % reduction in the force extracting water from the tuber. This reduction reaches 63 % over the period from 12 to 18 h (1.27 against 3.42 kPa), when the constraint is maximal and the absolute contrast between the two modes is most marked (Figure 4b). Humidification first maintained relative humidity 28.3 points above that of the greenhouse at the peak of the day (67.9 % against 39.7 %). The latent heat drawn from the air during evaporation then produces a measurable cooling: over the same period, the enclosure air is 6.2 °C cooler than the greenhouse and 5.4 °C cooler than the outdoor reference air (Figure 4c). Humidification is thus the only one of the two modes to make temperature falling below ambient temperature without mechanical input, and the depression obtained lies within the range reported for passive wetted-media evaporative coolers in hot, dry regions [7,8,9], for a markedly smaller footprint. Expressed as saturation efficiency over the same window, the cooling obtained reached 53 % in 2024, ranging from 50 to 55 % across the three chamber nodes against an outdoor wet-bulb depression of 10.2 °C, and 84 % in 2025, ranging from 83 to 84 % against a depression of 11.2 °C. The 2025 value exceeds the 64 to 70 % reported for cellulose pads under Mediterranean greenhouse conditions [29], and does so with a far smaller footprint; the 2024 value does not. This gain coincided with the activation of the differential control rule in 2025 campaign.
This regulation has direct consequences at the product level. In 2024, greenhouse air exceeded 30 °C for 44.6 % of the storage period, against 2.4 % in the humidified enclosure and never in the cold room; the temperature inside the crates of exposed tubers peaked at 40.9 °C in the greenhouse, and at 42.1 °C during the 2025 campaign, against 30.9 °C under humidification (Figure 4d). This gap of nearly ten degrees inside the crates is consistent with an Arrhenius-type respiration kinetics (Q₁₀ of 2 to 3) and accounts for the increased consumption of reserves and the rapid senescence that characterise the traditional mode. It also provides a physical reading of the 21 to 35 % loss gap reported in Table 7: the 60 % reduction in VPD and the eighteenfold reduction in time spent above 30 °C constitute its measured counterpart.
Panel (d) reports, for each mode, the share of time above 30 °C (bars) and the maximum in-crate temperature (diamonds); error bars in panels (b) and (c) represent the standard error of the mean.
Stability and homogeneity of the climatic control inside the storage structures. The humidification enclosure shows comparable operation from one season to the next, 26.8 ± 2.0 °C and 75.2 ± 12.1 % in 2024, 25.3 ± 2.1 °C and 84.1 ± 10.7 % in 2025 in mean temperature and relative humidity respectively .A relative spatial homogeneity was observed, the mean VPD of the five experimental nodes varies with a coefficient of variation of 31 % in both campaigns (Table S3), no node approaching the constraint level recorded in the greenhouse, i.e. the traditional mode's storage structure (Figure 5a).
The Thermo-hygrometric conditions measured in the three storage modes by the connected-sensor network, 2024 and 2025 campaigns are presented in Table 5. The vapour pressure deficit (VPD) ranks, in both campaigns, according to the 7 °C < H < Trad order observed on weight losses. Means ± standard deviation on instantaneous records after plausibility filtering; “Trad” denotes greenhouse storage. Outdoor reference conditions allow the evaporatively obtained temperature depression to be situated; they are taken from the single open-air node of each campaign, and the H rows are computed on the three nodes above the crates, the two plenum nodes being excluded as they do not describe the atmosphere surrounding the tubers. ᵃ Record limited to the period 13 June – 2 July. ᵇ Abnormally low diurnal amplitude, suggestive of air-sensor drift; the comparison of the H and Trad atmospheres rests on the 2024 campaign. The in-crate probe of the same node remained functional. ᶜ Compressor fault in the 7 °C chamber, 6–22 August 2024 (up to 25.3 °C); the value given is the highest maximum outside that episode (chamber start-up, 17 July). ᵈ The 2025 in-crate probe stopped logging on 23 June, before the 2025 storage period itself began (13 June – 18 August for the other modes); the value given is its least-elevated instantaneous reading (22 June) and does not reflect genuine in-season 7 °C conditions.
3.2. Physiological Bases of the Observed Hierarchy
The hierarchy 7 °C < H < Trad and its reproducibility are explained by three physiological processes whose intensity depends directly on the temperature–humidity pair. The first is transpiration, water loss by vapour diffusion through the periderm, governed by the vapour pressure deficit between the tuber and the ambient air. It is the dominant component of losses: by maintaining relative humidity around 74 % (up to saturation at the start of storage), ultrasonic humidification lowers this deficit and strongly reduces transpiration, while cold acts by another route — the lowering of the saturation vapour pressure — and the traditional mode, in hot dry air, undergoes maximal transpiration [3,25]. This dual effectiveness — a moisture-based mechanism for humidification, a thermal one for cold — explains why these two modes systematically outperform the control.
The second process is respiration, the oxidation of reserves that consumes dry matter and releases heat and water vapour. Its rate follows an Arrhenius-type law (Q₁₀ ≈ 2–3): between 7 °C and 40 °C, respiratory activity is multiplied by a factor of the order of ten, which explains the markedly greater consumption of reserves under the traditional mode.
The skin senescence is explained by the suberization, which strengthens the skin and its mechanical resistance and is better preserved at low temperature. — hence a firmness that declines only slowly under refrigeration (−0.416 N/week, ending at 100.14 N) and collapses (−1.965 N/week) under ambient conditions,
The counterpart of cold is cold-induced sweetening: at low temperature, the activation of vacuolar acid invertase hydrolyses sucrose into glucose and fructose [10,11,24]. The accumulation of reducing sugars beyond 0.25 % makes refrigerated lots unfit for frying without thermal reconditioning [15]. Humidification, and its induced evaporative cooling , escapes this drift by design as it decouples the control of water losses from the carbohydrate penalty, which underpins its value for tuber processing destination.
3.3. Practical and Economic Implications for the Sector
The main applied lesson of this work is the validation, over four campaigns, of ultrasonic humidification as a breakthrough technology for post-harvest storage in the hot Mediterranean zone. This process combines a set of advantages that no competing mode brings together: it reduces losses by 21 to 35 % relative to the traditional mode by maintaining high humidity; it fully preserves processing suitability, sugars remaining below 0.15 % where cold triggers a prohibitive sweetening; it operates at ambient temperature without a refrigeration unit, for an investment and consumption far below those of a cold room; and it ensures satisfactory mechanical and sanitary quality over storage periods ranging from thirty-to-sixty-day.

Table 6.
Synthesis of end-of-storage results for the three outcome variables, by mode and campaign (2022–2025). Values are drawn from Table 7 (losses), 11 (reducing sugars) and 12 (dry matter); see those tables for standard errors, Tukey groups and full methodological notes. ᵃ 2022 traditional-mode storage was stopped at D45 for excessive rot; value is the last weighing, at D40 (§ 3.8). ᵇ Interpolated between bracketing weighings (Table 7). * 2022 traditional-mode sampling point is D45, not D70 (Table 11).
Table 6.
Synthesis of end-of-storage results for the three outcome variables, by mode and campaign (2022–2025). Values are drawn from Table 7 (losses), 11 (reducing sugars) and 12 (dry matter); see those tables for standard errors, Tukey groups and full methodological notes. ᵃ 2022 traditional-mode storage was stopped at D45 for excessive rot; value is the last weighing, at D40 (§ 3.8). ᵇ Interpolated between bracketing weighings (Table 7). * 2022 traditional-mode sampling point is D45, not D70 (Table 11).
| Campaign | Mode | Losses (%) | Reducing sugars, %RS | Dry matter, MSᶠ (%) |
| 2022 | 7 °C | 2.18ᵇ | 0.555 ± 0.005 | 17.81 ± 0.13 |
| 2022 | H | 4.92ᵇ | 0.126 ± 0.002 | 17.13 ± 0.11 |
| 2022 | Trad | 5.13 ± 0.01ᵃ | 0.085 ± 0.001* | 17.56 ± 0.09 |
| 2023 | 7 °C | 3.88 ± 0.15 | 0.548 ± 0.005 | 18.03 ± 0.09 |
| 2023 | H | 6.36 ± 0.05 | 0.126 ± 0.002 | 17.35 ± 0.10 |
| 2023 | Trad | 8.63 ± 0.11 | 0.096 ± 0.002 | 16.96 ± 0.08 |
| 2024 | 7 °C | 3.25 ± 0.05 | 0.559 ± 0.008 | 17.76 ± 0.14 |
| 2024 | H | 5.58 ± 0.03 | 0.131 ± 0.002 | 17.27 ± 0.09 |
| 2024 | Trad | 7.11 ± 0.04 | 0.096 ± 0.002 | 16.60 ± 0.05 |
| 2025 | 7 °C | 2.73 ± 0.07 | 0.557 ± 0.006 | 18.22 ± 0.09 |
| 2025 | H | 4.89 ± 0.18 | 0.131 ± 0.001 | 17.65 ± 0.06 |
| 2025 | Trad | 7.16 ± 0.05 | 0.094 ± 0.002 | 17.15 ± 0.17 |
3.4. Weight Losses by Mode and by Campaign
Weight losses during storage were monitored on 5 kg mesh bags made up at entry into each mode; they are expressed relative to the initial mass of each bag and therefore do not include pre-storage losses. Pre-storage had caused a mean loss of 6.21 % in 2022, then 4.36 % in 2023 and 4.15 % in 2024 for the large calibre (Table 3): the decrease between 2022 and 2023 is significant (Welch's t-test, p < 0.001), whereas the 2023 and 2024 values do not differ (p = 0.36) despite an 80 % longer duration in 2024, reflecting the progressive mastery of handling practices.
Whatever the storage duration, weight losses follow the order 7 °C < H < Trad in the four campaigns (Figure 6). To compare campaigns at equal duration, losses were brought to D50 (§ 2.7): beyond 45 to 60 days, the traditional mode is generally no longer marketable because of sprouting and rot (§ 3.8), and in 2022 it had to be stopped at D45, rot having reached 18.2 % — the trial's operational stopping criterion (§2.5), its last weight reading dating from D40 (5.13 %). At D50, refrigeration records the lowest losses (1.86 to 2.60 % depending on the campaign), humidification intermediate losses (3.41 to 4.59 %) and the traditional mode the highest (4.94 to 5.99 % from 2023 to 2025). Humidification thus reduces losses by 23 % (2023), 24 % (2024) and 31 % (2025) relative to the traditional mode (Table 7). Over a longer duration, only refrigeration and humidification remain relevant: at D70, losses reach 2.18 to 3.27 % under refrigeration and 4.83 to 5.73 % under humidification, a ratio close to 1.8 in 2023–2025 and of 2.3 in 2022, when direct mist injection favoured condensation on the tubers.
From one campaign to the next, the results highlight the robustness of the outcome. In 2022, the comparison was limited to D70: the humidified lot, then stored by direct injection of mist into the chamber, showed rot caused by condensation on the tubers, and monitoring of the refrigerated lot was not extended beyond, so as to compare the modes over the same duration. At D70, refrigeration had lost only 2.18 % and humidification 4.92 %. Expressed per week, losses under refrigeration (0.22 to 0.32 % depending on the campaign) are of the same order as the 0.2 % per week adopted, after the first two weeks, by the design standard for potato stores [34]. In 2023 (86 days) and 2024 (88 days), losses reach 3.88 % and 3.25 % under refrigeration, against 6.36 % and 5.58 % under humidification; in 2025 (72 days), 2.73 % against 4.89 %. The traditional mode, whose marketable storage life does not exceed 45 to 60 days, was nevertheless weighed until the end of storage in 2023–2025, reaching 7.11 to 8.63 %; these values describe the evolution of a lot that had become unmarketable rather than a usable performance. In 2022, it had to be stopped at D45 for excessive rot, a reminder that this mode exposes the crop, beyond weight loss alone, to a prohibitive sanitary risk under the Mediterranean summer. The modulation of absolute gaps from one campaign to the next attributable to, durations, seasonal climatic conditions and the progressive refinement of the protocol has never questioned the order of the modes or the dominance of the Mode factor
Table 7.
Cumulative weight losses (% of initial mass; mean ± standard error) at two common dates — D50 for the three modes and D70 for refrigeration and humidification — and at the end of storage. ᵃ Last weighing at D40: 5.13 ± 0.01 %. ᵇ Interpolated between the bracketing weighings (2022: D61 and D73; 2023: D48 and D72).
Table 7.
Cumulative weight losses (% of initial mass; mean ± standard error) at two common dates — D50 for the three modes and D70 for refrigeration and humidification — and at the end of storage. ᵃ Last weighing at D40: 5.13 ± 0.01 %. ᵇ Interpolated between the bracketing weighings (2022: D61 and D73; 2023: D48 and D72).
| Campaign | 7 °C | H | Trad | Comparison |
| A. D50 (common date) | H vs Trad | |||
| 2022 (D52) | 1.86 ± 0.06 | 3.99 ± 0.23 | stopped at D45ᵃ | — |
| 2023ᵇ | 2.60 ± 0.14 | 4.59 ± 0.05 | 5.99 ± 0.08 | −23 % |
| 2024 | 2.09 ± 0.03 | 3.95 ± 0.02 | 5.17 ± 0.03 | −24 % |
| 2025 | 2.01 ± 0.11 | 3.41 ± 0.21 | 4.94 ± 0.08 | −31 % |
| B. D70 (7 °C and H) | H : 7 °C ratio | |||
| 2022ᵇ | 2.18 | 4.92 | — | 2.26 |
| 2023ᵇ | 3.27 ± 0.15 | 5.73 ± 0.05 | — | 1.75 |
| 2024 (D71) | 2.68 ± 0.03 | 4.83 ± 0.03 | — | 1.80 |
| 2025 (D72) | 2.73 ± 0.07 | 4.89 ± 0.18 | — | 1.79 |
| C. End of storage | H vs Trad | |||
| 2023 (D86) | 3.88 ± 0.15 | 6.36 ± 0.05 | 8.63 ± 0.11 | −26 % |
| 2024 (D88) | 3.25 ± 0.05 | 5.58 ± 0.03 | 7.11 ± 0.04 | −22 % |
| 2025 (D72) | 2.73 ± 0.07 | 4.89 ± 0.18 | 7.16 ± 0.05 | −32 % |
This weight-loss hierarchy is independently confirmed by the physical conditions measured inside each mode: plotted against the weight-loss rate, the vapour pressure deficit of the three modes falls in the same order on both axes in each campaign (§ 3.1; Figure 5b).
3.5. Dominance and Constancy of the Mode Effect
The storage mode is the near-exclusive determinant of physiological losses. The proportion of variance it explains, measured by the effect size ω², is exceptionally high and remarkably stable: 0.981–0.996 in 2022 (P1–P4; at P5, the traditional mode having been stopped, only two modes are compared), 0.955–0.970 in 2023, 0.983–0.996 in 2024 and 0.981 in 2025. All these ω² values lie far above the conventional 'large effect' threshold (0.14; Cohen [19]), with a mean of 0.981, and the ANOVA and Kruskal-Wallis tests agree at every reading date of each campaign. Figure 7b summarises this pattern: the effect sizes of the four campaigns cluster clearly above this threshold, which constitutes the central descriptive evidence of the reproducibility of the Mode effect (Table 8).
3.6. Formal Test of the Mode × Year Interaction
The Mode × Year general linear model applied to the final losses (N = 75; 2023, 2024 and 2025) confirms the overwhelming dominance of the Mode factor (Table 9). The mode explains 80.1 % of the total variance of losses (F(2,66) = 1511; p < 0.001; η²ₚ = 0.979), far ahead of the parameter Year (8.9 %). The Mode × Year interaction is statistically significant (F(4,66) = 9.04; p < 0.001) — expected given the very small within-group variability and high power, but this interaction weighs only 0.96 % of the total variance. It reflects a quantitative modulation of the gaps between modes across seasons, not a reorganisation of their hierarchy.
The Tukey post-hoc test separates the three modes into three strictly disjoint homogeneous subsets: 7 °C (3.40 %) < H (5.75 %) < Trad (7.73 %), all pairs significant at p < 0.001. This order recurs in each of the three campaigns taken separately (marginal means: 7 °C 3.88/3.25/2.73; H 6.36/5.58/4.89; Trad 8.63/7.11/7.16 for 2023, 2024 and 2025). The inter-seasonal reproducibility of the hierarchy is thus formally established, in perfect agreement with the constancy of the ω² (Figure 7).
Practical magnitude of the gaps. Beyond significance, the magnitude of the gaps is considerable. In each campaign, the intra-campaign analyses yield very high F statistics at every reading date: 391 to 1,784 in 2022 (P1–P4), 320 to 491 in 2023, 882 to 3,589 in 2024 (maximum at D81) and 386 in 2025 (end of storage; Table S5). At the common reference period P3, Cohen’s d reaches, for the humidification / traditional comparison — the most important for the aim of the study — 11.92 in 2022, 6.87 in 2023 and 12.32 in 2024 (7.89 at the end of storage in 2025); for the refrigeration / humidification comparison, it amounts to 9.39, 6.09 and 23.91 (7.19 in 2025). All these values far exceed the ‘large effect’ threshold (d = 0.8; Cohen [19]): the loss all above 0.05, so that the null hypotheses of normality and of equal variances are not rejected; Table S5 gives these tests for every reading date of each campaign, whereas Table 10 reports only the reference reading.
Robustness. On the combined data set, the residuals depart from normality (Shapiro-Wilk W = 0.942; p = 0.002) and the variances are not homogeneous across the nine cells of the model (3 modes × 3 campaigns; Levene F(8,66) = 4.40; p < 0.001). These departures arise from the very small variance of the refrigerated mode and from two extreme values, both recorded in the 2023 refrigerated lot: bags R4 (4.93 %) and R9 (3.16 %), against a mean of 3.88 % (standardised residuals of +3.9 and −2.7), whose deviation persists at every weighing from the second one (D34) onwards, which reflects genuine biological variability rather than a measurement error. Without these two bags, the normality of residuals is restored (W = 0.979; p = 0.27) and the Mode effect remains overwhelming (F = 2,189). With F statistics of the order of 1,500, these departures from the assumptions are therefore inconsequential for the conclusions, as confirmed by two independent routes: the ANOVA / Kruskal-Wallis agreement in each campaign, and a mixed model with a random year effect, which recovers a highly significant and generalisable Mode effect (F(2,70) = 1,142.7; p < 0.001). In this model, the between-year variance (σ² = 0.49) is estimated but imprecise (p = 0.322), reflecting the small number of seasons (three levels) rather than an absence of effect.
For methodological transparency, Table 10 summarises the assumption checks conducted from one campaign to the next at the reference reading of each campaign (end of storage in 2023–2025, D40 in 2022; every reading date is given in Table S5). The normality of residuals was satisfied in the four campaigns at this reading (Shapiro-Wilk, p = 0.355 to 0.966) ; unlike the combined analysis, whose rejection arises from pooling heterogeneous cells. Homogeneity of variances is satisfied in 2023 and 2024; rejected on the mean in 2022 and 2025, campaigns for which the robust Welch and Brown-Forsythe tests, applied as a precaution, confirm the effect. Moreover , parametric ANOVA, its robust versions and the Kruskal-Wallis test all conclude, in each campaign, to a highly significant Mode effect, 100 % concordance, an internal cross-validation of the diagnosis.
For the 2022 campaign, these checks are conducted on the mid-storage point D40, common to the three modes: this choice was necessary because the traditional mode had to be stopped at D45 for excessive rot, with no later reading available for that mode. This D40 point therefore differs from the readings reported in Table 7 (D52 and D70 for 7 °C and H; last weighing at D40 for Trad). The two tables serve distinct purposes — the performance of each mode for Table 7 and statistical comparability at equal duration for Table 10 — without affecting either the ranking of the modes or the significance of the Mode effect.
Table 10.
Statistical validations by campaign (weight loss). The normality of residuals (Shapiro-Wilk) is satisfied in the four campaigns; homogeneity (Levene) is satisfied in 2023–2024 and rejected in 2022 and 2025 (ᵃ), hence the robust Welch and Brown-Forsythe tests (2022 is satisfied on the median, p = 0.332). ANOVA, robust versions and Kruskal-Wallis agree at 100 % (Mode effect significant at p ≤ 0.003 everywhere). Results at every reading date are given in Table S5.
Table 10.
Statistical validations by campaign (weight loss). The normality of residuals (Shapiro-Wilk) is satisfied in the four campaigns; homogeneity (Levene) is satisfied in 2023–2024 and rejected in 2022 and 2025 (ᵃ), hence the robust Welch and Brown-Forsythe tests (2022 is satisfied on the median, p = 0.332). ANOVA, robust versions and Kruskal-Wallis agree at 100 % (Mode effect significant at p ≤ 0.003 everywhere). Results at every reading date are given in Table S5.
| Campaign | Shapiro-Wilk (residuals) | Levene (mean) | ANOVA F | Welch (robust) | Kruskal-Wallis |
| 2022 | W = 0.955; p = 0.648 | F = 4.77; p = 0.032ᵃ | 1784 (2; 11) | 2373; p < 0.001 | H = 11.6; p = 0.003 |
| 2023 | W = 0.962; p = 0.355 | F = 2.48; p = 0.102 | 441 (2; 27) | 324; p < 0.001 | H = 25.8; p < 0.001 |
| 2024 | W = 0.964; p = 0.392 | F = 0.45; p = 0.643 | 2362 (2; 27) | 1838; p < 0.001 | H = 25.8; p < 0.001 |
| 2025 | W = 0.980; p = 0.966 | F = 8.22; p = 0.006ᵃ | 386 (2; 12) | 1275; p < 0.001 | H = 12.5; p = 0.002 |
3.7. Reducing Sugars and Cold-Induced Sweetening
The decisive contrast between modes concerns reducing sugars (Table 11, Figure 8). Across all four campaigns (2022–2025), refrigeration at 7 °C caused marked and consistent sweetening: reducing sugars significantly exceeded the 0.25 % industrial threshold and reached between 0.548 and 0.559 % at the end of storage (one-sample t-test against 0.25 %: p < 0.001 in every campaign), four to five times the values observed under humidification (0.126–0.131 %) and five to seven times those of the traditional mode (0.085–0.096 %), both of which remained significantly below the threshold (p < 0.001). Humidification and the traditional mode both kept reducing sugars low, below the 0.15 % level considered fully compatible with processing into chips and fries; the small but consistent difference between them (humidification 0.030–0.041 percentage points higher) was statistically significant in every campaign (Tukey, p < 0.001 to p = 0.0002). The traditional mode, however, achieved this at the cost of severe sanitary degradation (rot and sprouting; § 3.8). Pooling all four campaigns (2022–2025, n = 60), a two-way ANOVA (Mode × Campaign) on the sugar increase from entry into storage to the end of storage confirms an overwhelming Mode effect (F(2,48) = 15,166.7; p < 0.001; partial η² = 0.998), with no significant Campaign effect (F(3,48) = 1.56; p = 0.211) and no significant interaction (F(6,48) = 0.98; p = 0.452): the increase is driven by storage mode alone, consistently across seasons. Tukey HSD confirms all three modes differ significantly from one another (p < 0.001): 7 °C (+0.507 percentage points) greatly exceeds H (+0.081) and the traditional mode (+0.045). To verify the robustness of the mode effect on end-of-storage reducing sugars, complementary tests were conducted independently for each campaign (2022–2025): Shapiro-Wilk, Levene, one-way ANOVA, Welch, Brown-Forsythe and Kruskal-Wallis. Normality was not rejected in any of the 12 groups (p > 0.05). Variance homogeneity was confirmed in 2022 (p = 0.073) but rejected for 2023–2025 (p ≤ 0.015), justifying the use of robust tests. Regardless of method, the Mode effect remained highly significant (p < 0.001 for classical ANOVA, Welch and Brown-Forsythe; p = 0.002 for Kruskal-Wallis) in all four campaigns, with a consistent ranking: 7 °C > H > Trad.
The threshold crossing under refrigeration, counted from entry into storage, i.e. after pre-storage (§ 2.4; losses over the first days of storage are shown in Figure 6), occurs between D34 and D48 in 2023 and between D28 and D39 in 2024 and is not reached within the 2022 analysis window; the outcome, however, is invariable: at the end of storage, refrigerated lots are unfit for frying without corrective treatment. This sweetening is partially reversible by thermal reconditioning. Warming tubers to 15–20 °C for ten to twenty days reactivates starch resynthesis and reabsorbs part of the sugars [15], but this step lengthens the supply chain and complicates logistics up to the commercial phase. Humidification, operating at ambient temperature, avoids the carbohydrate drift from the outset and removes the need for reconditioning. Beyond its favourable energy balance, this represents a decisive technological argument that distinguishes it from refrigeration for the industrial processing sector. The choice of storage mode must therefore be settled according to the destination of the tubers.
Table 11.
End-of-storage reducing sugars (%RS = 1.8 × glucose, % FW; mean ± SE) by mode and campaign (2022–2025), and number of tuber samples per mode (n = 5). Within a row, different letters indicate significant differences (Tukey, p < 0.05; confirmed by Welch’s, Brown-Forsythe’s and the Kruskal-Wallis test).
Table 11.
End-of-storage reducing sugars (%RS = 1.8 × glucose, % FW; mean ± SE) by mode and campaign (2022–2025), and number of tuber samples per mode (n = 5). Within a row, different letters indicate significant differences (Tukey, p < 0.05; confirmed by Welch’s, Brown-Forsythe’s and the Kruskal-Wallis test).
| Campaign (date) | 7 °C | H | Trad | n per mode |
| 2022 (D70) | 0.555 ± 0.005ᶜ | 0.126 ± 0.002ᵇ | 0.085 ± 0.001ᵃ* | 5 |
| 2023 (D86) | 0.548 ± 0.005ᶜ | 0.126 ± 0.002ᵇ | 0.096 ± 0.002ᵃ | 5 |
| 2024 (D88) | 0.559 ± 0.008ᶜ | 0.131 ± 0.002ᵇ | 0.096 ± 0.002ᵃ | 5 |
| 2025 (D72) | 0.557 ± 0.006ᶜ | 0.131 ± 0.001ᵇ | 0.094 ± 0.002ᵃ | 5 |
* Traditional mode discontinued at D45 (last sampling point) due to sanitary degradation (rot, sprouting); 7 °C and H continued to D70.
3.8. Sanitary Quality
Sanitary quality clearly separates the modes and confirms the hierarchy. Refrigeration provides a good quality every year, sprouting below 0.7 %, rot zero to 1 % and viable duration as three to four months .— Cold inhibits both opportunistic pathogens and dormancy break. Humidification and the traditional mode instead leave tuber temperature close to ambient: the same Arrhenius-type acceleration of metabolism that hastens dormancy break also favours opportunistic pathogens, an effect compounded by sustained high humidity under humidification and by uncontrolled summer heat under the traditional mode. The advantage of timing of dormancy break follows the same order, in 2024 the first sprouts appeared on day 43 in the traditional mode, on day 50 under humidification and only on day 62 in the cold room. So that refrigeration delayed the onset of sprouting by nineteen days relative to the traditional unprotected control and by twelve days relative to humidification. Humidification, under high air relative humidity, records sprouting and rot beyond two months. Rot below 1 % at 56 days in 2024, reaching 7 to 14 % by three months, which restricts its optimal use to a storage od 30-to-60-day. The traditional mode combines high rot (7 to 18 %) and rapid senescence, in 2022, its comparative monitoring had been interrupted at mid-storage, with respect to the commercial acceptability threshold, the cumulative rot has crossed 18% (18.24 %). This degradation, characteristic of an infestation by soft and dry rot agents (Pectobacterium carotovorum, Fusarium solani) favoured by heat and residual humidity has experimentally demonstrated the unsuitability of traditional storage for Mediterranean summers.
3.9. Dry Matter Evolution During Storage
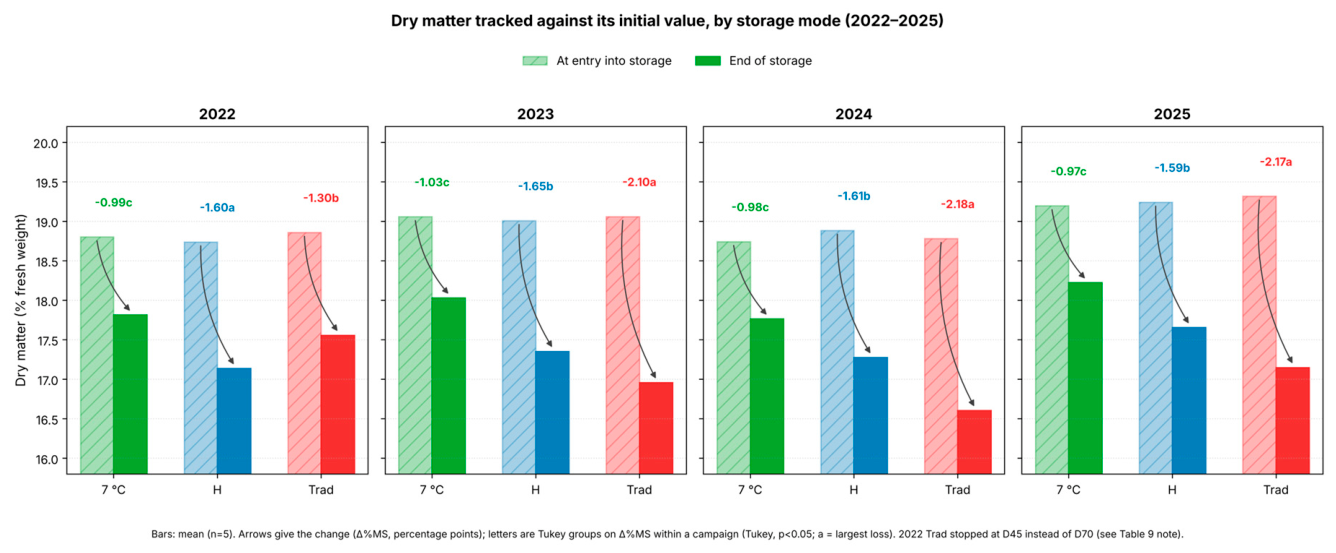
In storage, direct measurement of dry-matter content (Table 12) shows a net decrease in all three modes: respiration consumes the tuber’s reserves faster than dehydration can concentrate the remainder, so the dry-matter fraction falls rather than rises. Over the four instrumented campaigns, the amplitude of this decrease follows exactly the order of water losses: refrigeration limited it to 0.97–1.03 percentage points, against 1.59–1.65 points for humidification and 1.30–2.18 points for the traditional mode, Tukey’s HSD separating the three modes within each campaign (p < 0.05; letters a, b, c, Table 12).
Humidification consistently outperformed the traditional mode, limiting dry-matter loss to about three-quarters of what was recorded without protection (e.g. −1.61 vs. −2.18 percentage points in 2024, a 26 % reduction) — an advantage reversed only in 2022, when the traditional lot’s monitoring had been stopped early, at day 45 instead of day 70, because of excessive rot (§ 3.8), rather than reflecting any true performance gain for that mode. Dry matter thus adds a fourth convergent line of evidence — after water losses, sanitary quality and processing suitability — for the advantage of evaporative cooling with ultrasonic humidification over unprotected traditional storage, with refrigeration remaining the reference. Physically, these differences trace back to the slowing of respiration and transpiration at low temperature and under near-saturated air: cold, and to a lesser extent humidification, preserve the tuber’s reserves and limit water loss, whereas the heat of the traditional mode accelerates both processes.
Figure 9.
Dry matter tracked against its initial value, by storage mode (2022–2025). Bars show the mean value at entry into and at end of storage (n = 5); arrows give the change (Δ%MS, percentage points); letters are Tukey groups on Δ%MS within a campaign (p < 0.05; a = largest loss). The 2022 traditional-mode lot was stopped at day 45 instead of day 70 because of excessive rot (§ 3.8, Table 12).
Figure 9.
Dry matter tracked against its initial value, by storage mode (2022–2025). Bars show the mean value at entry into and at end of storage (n = 5); arrows give the change (Δ%MS, percentage points); letters are Tukey groups on Δ%MS within a campaign (p < 0.05; a = largest loss). The 2022 traditional-mode lot was stopped at day 45 instead of day 70 because of excessive rot (§ 3.8, Table 12).
3.10. Instrumental Quality: Firmness and Acidity (2024)
The 2024 upgrade introduced two instrumental measurements monitored per mode: skin firmness by penetrometer and titratable acidity. Both confirm the 7 °C > H > Trad hierarchy (Figure 10, Table 13).
The skin firmness declines in all modes over the 88 days, but at very contrasting rates. Refrigeration best preserves the skin (slope −0.416 N/week; R² = 0.934) and ends the trial at the highest value (100.14 N). Humidification degrades faster (−0.929 N/week; R² = 0.979) to end at 94.66 N. The traditional mode collapses (−1.965 N/week; R² = 0.998) to end at 79.91 N, a degradation of 4.7 times faster than under refrigeration.
The titratable acidity also declines in all modes, at a rate strongly dependent on the thermal regime. Refrigeration best slows this decline (−0.017 point/week; 0.79 → 0.61 %), humidification is intermediate (−0.030; 0.76 → 0.44 %), and the traditional mode shows the steepest drop (−0.052; 0.74 → 0.22 %), a decline about three times faster than under refrigeration (−0.052 vs −0.017 point/week). Mechanistically, these two degradations share a common origin which is the acceleration of metabolism at high temperature inducing loss of turgor and enzymatic evolution of the periderm for firmness and respiratory consumption of organic acids (foremost citric acid) for acidity. Their convergence towards the same diagnosis strengthens the conclusion that the traditional mode does not merely lose weight, it undergoes an accelerated senescence that simultaneously compromises firmness, taste and sanitary preservation.
3.11. Integrated Quality Profile
Brought together, all the criteria (Figure 11) draw three clearly distinct profiles, consistent with the section-by-section results. Refrigeration dominates on losses, firmness, acidity and sanitary quality, but remains penalised by its sweetening (unfavourable processing suitability) and its energy dependence. Humidification showed a balanced profile, with no prohibitive weak point: contained losses, low sugars, adequate firmness and acidity throughout its use window, and good energy efficiency, as evidenced by the results above.The traditional mode, while retaining the advantage of frugality and low sugars, collapses on all physiological and sanitary dimensions. The technological choice of a storage mode is thus a matter of trade-off by destination rather than of a universally superior mode.
Figure 11 shows a quality profile as a decision-support tool not based on statistical result, , it aggregates indicators otherwise tested individually as studied in previous sections. Each criterion is scored on a three-level scale, excellent (1.00), good (0.66) or poor/unfavourable (0.33), For final losses, reducing sugars (vs the 0.25 % industrial threshold) and energy dependence (presence or absence of a refrigeration unit), scoring compares the measured value against a predefined threshold. For skin firmness, titratable acidity, and sanitary quality — cumulative rot, consistent with the 0.6–10 % range reported in the literature [35] rather than a fixed commercial threshold — scoring reflects the relative ranking among the three modes. This transparent and reproducible construction allows the figure to be reconstructed identically from the published values.
Statistical confirmation by principal component analysis. The separation suggested by the quality profile was confirmed by a principal component analysis applied to the parameters measured per replicate in 2025 (losses, dry matter, reducing sugars; Figure 12). The analysis is significant (KMO = 0.750; Bartlett's sphericity test: χ² = 52.8; p < 0.001) and remarkably parsimonious, which was suggested by the first component alone explaining 94.3 % of the total variance. This component when opposed losses (loading −0.980) to dry matter and reducing sugars (loadings +0.981 and +0.952), summarised the whole storage trade-off along a single axis along which the three modes separate clearly — refrigeration at one extreme, the traditional mode at the other, humidification in the center. It highlights an objective, data-driven confirmation of the hierarchy.
3.12. Correlations: Reproducibility And Trade-Off Between Parameters
Two types of correlations, of distinct nature, are relevant here and must not be confused. Correlating two different parameters (losses and sugars, for example) requires measuring them on the same units: such a correlation is necessarily intra-campaign, since the loss of a 2023 replicate cannot be paired with the sugar of a 2025 replicate. This is why the correlation between parameters is established on the optimized 2025 campaign, the only one where dry matter and sugars were assayed on each replicate, then extended at the level of mode × campaign means to cover the four seasons without pseudo-replication. Conversely, correlating the same parameter (losses) between two campaigns; the resemblance of kinetic profiles from one year to the next is perfectly legitimate, and is precisely the reproducibility measure presented below.
The reproducibility of the loss dynamics, quantified by the Pearson correlation between kinetic profiles of successive campaigns, mode by mode, is very high: r = 0.994 for refrigeration and r = 0.992 for humidification between 2022 and 2023, and all coefficients, across every campaign and mode , remain above 0.975 (Table 15). In other words, more than 97 % of the dynamics observed one year recurs the next; the very shape of the curves, and not only the final ranking, is reproducible. The PCA of § 3.11 (Figure 12) supports this diagnosis on the multivariate level.
The trade-off between parameters is read in Table 14. At the 2025 campaign replicate level, the three relationships are highly significant: losses are strongly and negatively correlated with both dry matter (r = −0.966; p < 0.001) and reducing sugars (r = −0.886; p < 0.001) — the direct expression of the trade-off, refrigeration combining low losses with both the best dry-matter retention and the strongest sweetening, the traditional mode showing the opposite on all three counts; dry matter and reducing sugars are in turn strongly and positively correlated with each other (r = +0.890; p < 0.001). At the inter-campaign level (twelve mode × campaign means), i.e. the per-mode means computed separately for each of the four campaigns rather than individual replicates, the losses–sugars compromise remains significant over the four seasons (r = −0.661; p < 0.05), establishing the reproducibility not only of the ranking of the modes but of the compromise structure linking them (Figure 13).
Table 14.
Correlations between storage parameters. (a) Per-replicate correlations on the 2025 campaign (the only one with replicated biochemical assays): losses are negatively correlated with both dry matter and reducing sugars, which are in turn positively correlated with each other — all three relationships highly significant. (b) Correlation at the level of mode × campaign means, confirming the losses–sugars compromise over the four campaigns.
Table 14.
Correlations between storage parameters. (a) Per-replicate correlations on the 2025 campaign (the only one with replicated biochemical assays): losses are negatively correlated with both dry matter and reducing sugars, which are in turn positively correlated with each other — all three relationships highly significant. (b) Correlation at the level of mode × campaign means, confirming the losses–sugars compromise over the four campaigns.
| Correlation | Pearson r | Spearman ρ | p | n |
| (a) Per replicate — 2025 campaign | ||||
| Losses ↔ Reducing sugars | −0.886 | −0.918 | < 0.001 | 15 |
| Losses ↔ Dry matter | −0.966 | −0.911 | < 0.001 | 15 |
| Dry matter ↔ Reducing sugars | +0.890 | +0.921 | < 0.001 | 15 |
| (b) Mode × campaign means — 4 campaigns | ||||
| Losses ↔ Reducing sugars | −0.661 | −0.601 | < 0.05 | 12 |
Table 15.
Inter-campaign Pearson correlations of the weight-loss kinetic profiles, by mode. Each coefficient is the Pearson correlation between the cumulative weight-loss values measured at the five normalised storage periods of two successive campaigns, computed separately for each mode from the per-replicate SPSS data; the input values and the resulting coefficients are given in the supplementary dataset deposited in the public data repository (see the Data Availability Statement) All coefficients exceed 0.975, confirming a very strong reproducibility of the kinetic shape. The 2022 traditional mode, interrupted at D45 for rot > 18 %, is correlated over the common P1–P4 periods.
Table 15.
Inter-campaign Pearson correlations of the weight-loss kinetic profiles, by mode. Each coefficient is the Pearson correlation between the cumulative weight-loss values measured at the five normalised storage periods of two successive campaigns, computed separately for each mode from the per-replicate SPSS data; the input values and the resulting coefficients are given in the supplementary dataset deposited in the public data repository (see the Data Availability Statement) All coefficients exceed 0.975, confirming a very strong reproducibility of the kinetic shape. The 2022 traditional mode, interrupted at D45 for rot > 18 %, is correlated over the common P1–P4 periods.
| Mode | 2022–2023 | 2023–2024 | Interpretation |
| 7 °C | r = 0.994 | r = 0.976 | > 97.5 % of the dynamics reproduced |
| H | r = 0.992 | r = 0.980 | strong and stable reproducibility |
| Trad | r = 0.989 | r = 0.985 | reproducible profile (2022 over P1–P4, stop D45) |
3.13. Synthesis of Results
All the analyses converge towards a coherent and reproducible diagnosis. The storage mode dominates losses, it explains 95.5 to 99.6 % of the variance depending on campaign and period, with an order 7 °C < H < Trad This has never been reversed over four seasons. The Mode × Year interaction was proved significant but negligible since it was responsible for less than 1 % of the variance. This ranking recurs, along physically independent axes, in the concentration of dry matter (Δ%DM increasing from cold towards the control, over the four campaigns), skin firmness and titratable acidity (2024), and sanitary quality. Reproducibility concerns not only the final ranking but the very shape of the kinetics, reproduced to more than 97 % from one year to the next (r > 0.975). It can be stated that— losses negatively correlated with sugars and positively with dry matter which held per replicate (2025) and across all campaigns. The analyses highlighted that refrigeration is optimal for the fresh market destination but penalised by sweetening, for industrial product destination . Humidification offered the most balanced compromise for cold-chain-free channels to fresh market or processing destinations. Traditional mode showed unsuitability beyond a few weeks under the Mediterranean summer conditions.
4. Conclusion
By pooling four consecutive campaigns (2022–2025) in a hot Mediterranean climate, this study establishes that the hierarchy of storage modes for potato cv. Spunta — 7 °C < H < Trad — reproduces from one season to the next: the mode explains 95.5 to 99.6 % of the variance of losses (mean effect size ω² = 0.981) and, over the pooled campaigns, 80 % of the total variance; the Mode × Year interaction, although significant, weighs only 0.96 % and never reverses the ranking. Refrigeration remains the reference for direct consumption (minimal losses, perfect sanitary quality) but stays unsuitable for processing because of a reproducible sweetening. Ultrasonic humidification asserts itself as the most credible and most reproducible alternative for a sector without a cold chain: it reduces losses by 21 to 35 % relative to the traditional mode, keeps sugars below the industrial threshold and operates without a compressor. The technological choice must thus be guided by the product's destination — direct consumption (cold) or processing (humidification) — rather than by the search for a universally superior mode.
Beyond the agronomic result, the significance of this work lies in its level of evidence: the convergence, over four seasons and through independent statistical methods — general linear model, mixed model, effect sizes, reproducibility of profiles and multivariate analysis — transforms an empirical observation into a solidly established regularity, exceeding the usual single-season standards of the Mediterranean literature. These findings provide a reliable basis for differentiated operational recommendations and open three extensions: a multi-site and multi-varietal replication, the extension of instrumental monitoring per mode over several campaigns, and a complete techno-economic analysis of the net benefit of humidification. By quantitatively documenting this low-energy technology as a reproducible alternative to cold, this study contributes directly to the reduction of post-harvest losses, a central issue of food security and income for the sectors of hot regions.
Positioned between cold — effective but costly and penalised by sweetening — and the traditional mode — frugal but destructive — humidification occupies a novel technological optimum, particularly suited to the small and medium producers who make up the bulk of the sector.
Three practical lessons follow. First, the choice of mode must be driven by product destination: for fresh consumption, refrigeration at 7 °C remains the reference, sweetening being inconsequential there since the product is not intended for frying; for processing, by contrast, it requires a prior thermal reconditioning that humidification avoids from the outset. Second, humidification stands out for operators lacking cold-storage infrastructure — small and medium producers, cooperatives — its only constraint being an optimal window of 30 to 60 days beyond which sprouting and rot progress. Third, the traditional mode must be formally discouraged beyond a few weeks under the Mediterranean summer: its only asset, energy frugality, is now matched by humidification, which additionally keeps losses and quality under control. The progressive substitution of the traditional mode by humidification thus represents a concrete lever for reducing post-harvest losses at the sector scale.
The useful storage duration is nonetheless extended by a factor of two to three relative to the traditional mode. A complete techno-economic evaluation — investment, energy, avoided losses, differential valorisation of lots by destination — would allow this net benefit to be precisely quantified.
The central contribution of this synthesis is to transform a repeated observation into a proof of reproducibility. Over four contrasting seasons, the storage mode dominates losses (mean ω² 0.981) with a strictly invariant order 7 °C < H < Trad, and the Mode effect does not vary substantially from one year to the next. The trials showed values unusually reported for this type of trial — reflecting the intensity of the Tunisian summer thermal gradient (up to 42.1 °C inside the crates for the traditional mode), which clearly separates the three storage environments and gives the Mode factor a near-deterministic character under these conditions. Most available work on storage under Mediterranean conditions relied on a single campaign [36,37,38], which does not allow a real effect to be distinguished from a seasonal artefact. By confirming the hierarchy over four seasons — through the constancy of the effect sizes, the absence of a substantial Mode × Year interaction, the reproducibility of the profiles (r > 0.975) and a convergent principal component analysis (PCA) — this comparative analysis of the three storage methods makes it possible to draw robust conclusions regarding the choice to be made, depending on the preservation objectives. Regarding the current state of potato storage in Tunisia, for instance — where 70% of the crop is held in traditional storage with a rot rate of 36% [39,40] — the study indicates that it is time to shift to humidification-based preservation, leveraging the benefits of evaporative cooling.
It should be noted that the humidification enclosure was itself refined between campaigns, so the reproducibility established here concerns the ranking of the modes and the magnitude of the losses, not the absolute cooling performance of the humidification system, which improved measurably from 2024 to 2025 — a protocol evolution that, by reducing within-group variability, strengthens rather than weakens this conclusion. A further limitation inherent to single-station applied storage trials is that, in each campaign, every mode was implemented in one dedicated chamber rather than in several independently replicated chambers, so bag-level replicates are nested within a single chamber per mode and campaign and a chamber-specific idiosyncrasy could in principle be confounded with the mode effect; this risk is mitigated by the random allocation and positioning of replicates, by the reproduction of the hierarchy across four independent seasons with distinct physical implementations of the equipment, and by its recovery along physically independent measurement axes grounded in an independent physical mechanism. Replicating each mode across multiple independent chambers within a single campaign remains a valuable refinement for future work.
Supplementary Materials
The following supporting information can be downloaded at the website of this paper posted on Preprints.org. Table S1: Thermo-hygrometric conditions per storage mode (2024-2025 campaigns); Table S2: Conditions per intra-day window; Table S3: Conditions per sensor node of the humidification enclosure; Table S4: Data-quality control log applied to the raw sensor records; Table S5: Assumption checks and effect sizes of the weight-loss analyses at every reading date; Figure S1: Mean VPD per node and ordinal concordance between VPD and weight-loss rate.
Author Contributions
Ouni Aymen: Conceptualization, Methodology, Software, Investigation, Formal analysis, Visualization, Writing – original draft, Writing – review & editing. Chtorou Wajdi: Methodology, Investigation, Resources, Visualization, Writing – review & editing. Kharroubi Hassen: Investigation, Resources, Writing – review & editing. El Moueddeb Khaled: Methodology, Supervision, Validation, Writing – review & editing.
Funding
This research received no external funding.
Institutional Review Board Statement
Not applicable.
Informed Consent Statement
Not applicable.
Data Availability Statement
The raw IoT sensor records (vapour pressure deficit and temperature, 2024–2025), the consolidated dataset, and the processing script used to derive them have been deposited in a public repository and are available at https://data.mendeley.com/datasets/sbwxmtpj47/2. The raw weight-loss, reducing-sugar, firmness and titratable-acidity measurements for the four storage campaigns (2022–2025), together with the corresponding SPSS statistical output files, are available from the corresponding author upon reasonable request.
Acknowledgments
During the preparation of this work the authors used a generative AI assistant in order to support the preparation of figures from the IoT sensor records. After using this tool, the authors reviewed and edited the content as needed and take full responsibility for the content of the publication. No generative AI tool was used to create or alter any image representing primary experimental data: the photographs in Figure 1 and Figure 2 are unaltered apart from cropping and resizing.
Conflicts of Interest
The authors declare no conflict of interest.
References
- Muthoni, Jane; Shimelis, Hussein. An overview of potato production in Africa. In Potato Production Worldwide; Elsevier, 2023; pp. 435–456. [Google Scholar] [CrossRef]
- FAOSTAT. Crops and livestock products — Potato production. FAO, 2023. Available online: https://www.fao.org/faostat/en/#data/QCL.
- Rastovski; van Es, A. (Eds.) Storage of Potatoes; Pudoc, 1987. [Google Scholar]
- Burton, W.G. The Potato, third ed.; Longman Scientific & Technical, 1989; Available online: https://www.nypl.org/research/research-catalog/bib/b11248126.
- Zhang, S.; Wang, X.; Kinay, P.; Dau, Q. Climate change impacts on potato storage. Foods 2024, 13, 1119. [Google Scholar] [CrossRef]
- Mohammed, M.; Alqahtani, N.; El-Shafie, H. Development and evaluation of an ultrasonic humidifier to control humidity in a cold storage room for postharvest quality management of dates. Foods 2021, 10, 949. [Google Scholar] [CrossRef]
- Defraeye, T.; Shoji, K.; Schudel, S.; Onwude, D.; Shrivastava, C. Passive evaporative coolers for postharvest storage of fruit and vegetables: where to best deploy them and how well do they perform. Front. Food Sci. Technol. 2023, 3, 1100181. [Google Scholar] [CrossRef]
- Nishad, P.; Mangaraj, S. Development and evaluation of earth air heat exchanger cum evaporative cool system as an energy-efficient method for storage of tomatoes. J. Sci. Food Agric. 2024, 104, 769–777. [Google Scholar] [CrossRef]
- Lufu, R.; Ambaw, A.; Opara, U.L. Evaporative cooling systems for perishables in Sub-Saharan Africa — a review. J. Food Process Eng. 2025, 48, e70127. [Google Scholar] [CrossRef]
- Sowokinos, J.R. Biochemical and molecular control of cold-induced sweetening in potatoes. Am. J. Potato Res. 2001, 78, 221–236. [Google Scholar] [CrossRef]
- Bhaskar, P.B.; Wu, L.; Busse, J.S.; et al. Suppression of the vacuolar invertase gene prevents cold-induced sweetening in potato. Plant Physiol. 2010, 154, 939–948. [Google Scholar] [CrossRef]
- Datir, S.S.; Yousf, S.; Sharma, S.; et al. Cold storage reveals distinct metabolic perturbations in processing and non-processing cultivars of potato. Sci. Rep. 2020, 10, 6268. [Google Scholar] [CrossRef]
- Wiberley-Bradford, A.E.; Busse, J.S.; Jiang, J.; Bethke, P.C. Sugar metabolism, chip color, invertase activity, and gene expression during long-term cold storage of potato tubers. BMC Res. Notes 2014, 7, 801. [Google Scholar] [CrossRef]
- Chuda, Y.; Ono, H.; Yada, H.; et al. Effects of physiological changes in potato tubers after low temperature storage on the level of acrylamide formed in potato chips. Biosci. Biotechnol. Biochem. 2003, 67, 1188–1190. [Google Scholar] [CrossRef]
- Gikundi, E.N.; Buzera, A.; Orina, I.; Sila, D. Impact of the temperature reconditioning of cold-stored potatoes on the color of potato chips and French fries. Foods 2024, 13, 652. [Google Scholar] [CrossRef]
- Keithellakpam, L.B.; Karunakaran, C.; Singh, C.B.; et al. A comprehensive review on pre- and post-harvest perspectives of potato quality and non-destructive assessment approaches. Appl. Sci. 2026, 16, 190. [Google Scholar] [CrossRef]
- Abed; Kaci, Z.; Dahmane, T.; N. Tirchi, D. Baali Cherif, Evolution of some biochemical parameters during cold storage and their effect on the formation of acrylamide in fried potatoes. Asian J. Dairy Food Res. 2024, 43, 32–38. [Google Scholar] [CrossRef]
- Ouni; Chtorou, W.; Kharoubi, H.; El Moueddeb, K. Validation of an enzymatic method for glucose determination in potato juice (Solanum tuberosum L.) using Gluco-LIS®: comprehensive evaluation according to ICH Q2(R1) and suitability for post-harvest quality control. Ecol. Eng. Environ. Technol. 2026, 27, 192–216. [Google Scholar] [CrossRef]
- Cohen, J. Statistical Power Analysis for the Behavioral Sciences, second ed.; Lawrence Erlbaum Associates, 1988; Available online: https://www.routledge.com/Statistical-Power-Analysis-for-the-Behavioral-Sciences/Cohen/p/book/9780805802832.
- Shapiro, S.S.; Wilk, M.B. An analysis of variance test for normality (complete samples). Biometrika 1965, 52, 591–611. [Google Scholar] [CrossRef]
- Arnastauskaitė, J.; Ruzgas, T.; Bražėnas, M. An exhaustive power comparison of normality tests. Mathematics 2021, 9, 788. [Google Scholar] [CrossRef]
- Brown, M.B.; Forsythe, A.B. Robust tests for the equality of variances. J. Am. Stat. Assoc. 1974, 69, 364–367. [Google Scholar] [CrossRef]
- Tukey, J.W. Comparing individual means in the analysis of variance. Biometrics 1949, 5, 99–114. [Google Scholar] [CrossRef]
- . Pressey, Role of invertase in the accumulation of sugars in cold-stored potatoes. Am. Potato J. 1969, 46, 291–297. [CrossRef]
- Sparks, W.C. Influence of ventilation and humidity during storage on weight and quality changes of Russet Burbank potatoes. Potato Res. 1973, 16, 213–223. [Google Scholar] [CrossRef]
- Heltoft, P.; Wold, A.-B.; Molteberg, E.L. Effect of ventilation strategy on storage quality indicators of processing potatoes with different maturity levels at harvest. Postharvest Biol. Technol. 2016, 117, 21–29. [Google Scholar] [CrossRef]
- Allen, R.G.; Pereira, L.S.; Raes, D.; Smith, M. Crop evapotranspiration — Guidelines for computing crop water requirements. In FAO Irrigation and Drainage Paper 56; FAO: Rome, 1998; Available online: https://www.fao.org/3/X0490E/X0490E00.htm.
- . Stull, Wet-bulb temperature from relative humidity and air temperature. J. Appl. Meteorol. Climatol. 2011, 50, 2267–2269. [CrossRef]
- Franco; Valera, D.L.; Peña, A. Energy efficiency in greenhouse evaporative cooling techniques: cooling boxes versus cellulose pads. Energies 2014, 7, 1427–1447. [Google Scholar] [CrossRef]
- Franco-Salas; Peña-Fernández, A.; Valera-Martínez, D.L. Refrigeration capacity and effect of ageing on the operation of cellulose evaporative cooling pads, by wind tunnel analysis. Int. J. Environ. Res. Public Health 2019, 16, 4690. [Google Scholar] [CrossRef]
- Challenges and future directions in evaporative cooling: balancing sustainable cooling with microbial safety. Build. Environ. 2025, 267, 112292. [CrossRef]
- Haase, N.U. Estimation of dry matter and starch concentration in potatoes by determination of under-water weight and near infrared spectroscopy. Potato Res. 2003, 46, 117–127. [Google Scholar] [CrossRef]
- ARVALIS – Institut du végétal, Gluco-LIS® Blue: user manual (notice d’utilisation); Agro-Systèmes: La Membrolle-sur-Choisille, France, 2012; Available online: https://martinlishman.com/wp-content/uploads/Glucolis-BLUE-Instructions-English-1.pdf.
- ASABE, ASAE EP475.3: Design and Management of Storages for Bulk, Fall-Crop, Irish Potatoes; American Society of Agricultural and Biological Engineers: St. Joseph, MI, 2018.
- Grudzińska, M.; Mańkowski, D. Losses during storage of potato varieties in relation to weather conditions during the vegetation period and temperatures during long-term storage. Am. J. Potato Res. 2018, 95, 130–138. [Google Scholar] [CrossRef]
- Chandra; Singh, A.K. Effect of evaporative cooling chamber on storage of potato. Asian J. Dairy Food Res. 2019, 30(2), 131–133. Available online: https://arccjournals.com/journal/asian-journal-of-dairy-and-food-research/ARCC1000.
- Mishra, B.K.; Jain, N.K.; Kumar, S.; Doharey, D.S.; Sharma, K.C. Shelf life studies on potato and tomato under evaporative cooled storage structure in southern Rajasthan. J. Agric. Eng. 2009, 46(3). [Google Scholar] [CrossRef]
- Patel, C.K.; Sasani, G.V.; Patel, S.H.; et al. Comparison of some traditional storage methods of potato. J. Indian Potato Assoc. 2001, 28(1), 152–153. [Google Scholar]
- Bergaoui, R. Potato in Tunisia: from a marginal product to a strategic pillar. Leaders.com.tn. 11 November 2025. Available online: https://www.leaders.com.tn/article/37471-la-pomme-de-terre-en-tunisie-d-un-produit-marginal-a-un-pilier-strategique.
- La Presse (Tunisia). Potato sector: on-farm storage to avoid post-harvest loss, 21 July 2021 (survey of 347 farmers; also reported by Kapitalis, 23 July 2021). Available online: https://www.argenpapa.com.ar/noticia/10974-tunez-filiere-pommes-de-terre-le-stockage-a-la-ferme-pour-eviter-la-perte-post-recolte.
Figure 1.
Evaporative cooling storage by ultrasonic humidification: (a) IoT supervision and control unit: human–machine interface, wireless gateway, power supply and protection cabinet. (b) Storage chamber during nebulisation: the humidified air, coming from the tunnel located beneath the chamber, enters it through a grooved grille and passes upward through the crates holding the 5 kg mesh bags; sensor nodes are visible in the upper part of the chamber, which houses three of the five nodes. (c) Ultrasonic humidifier installed outside the chamber, its four misting blocks discharging through two ducts that pass through the wall, and the wall-mounted fan ensuring air renewal of the enclosure.
Figure 1.
Evaporative cooling storage by ultrasonic humidification: (a) IoT supervision and control unit: human–machine interface, wireless gateway, power supply and protection cabinet. (b) Storage chamber during nebulisation: the humidified air, coming from the tunnel located beneath the chamber, enters it through a grooved grille and passes upward through the crates holding the 5 kg mesh bags; sensor nodes are visible in the upper part of the chamber, which houses three of the five nodes. (c) Ultrasonic humidifier installed outside the chamber, its four misting blocks discharging through two ducts that pass through the wall, and the wall-mounted fan ensuring air renewal of the enclosure.
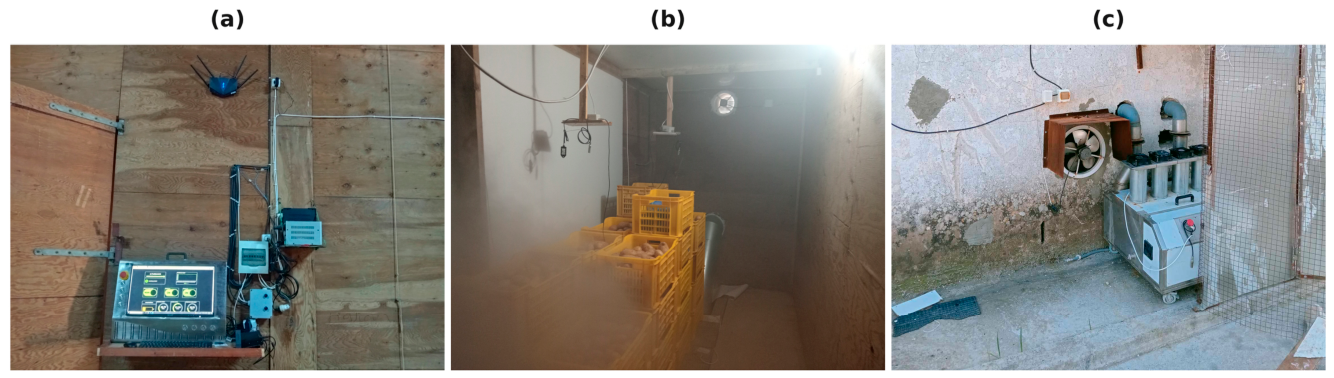
Figure 2.
The two storage modes operated without humidification. (a) Refrigerated storage at 7 °C: crates of 5 kg mesh bags, with a sensor node on the wall and its probe descending into a bag. (b) Traditional greenhouse storage (Trad): lots covered with straw under a shading net, with stacked crates at the rear, a practice representative of non-refrigerated storage in the region.
Figure 2.
The two storage modes operated without humidification. (a) Refrigerated storage at 7 °C: crates of 5 kg mesh bags, with a sensor node on the wall and its probe descending into a bag. (b) Traditional greenhouse storage (Trad): lots covered with straw under a shading net, with stacked crates at the rear, a practice representative of non-refrigerated storage in the region.
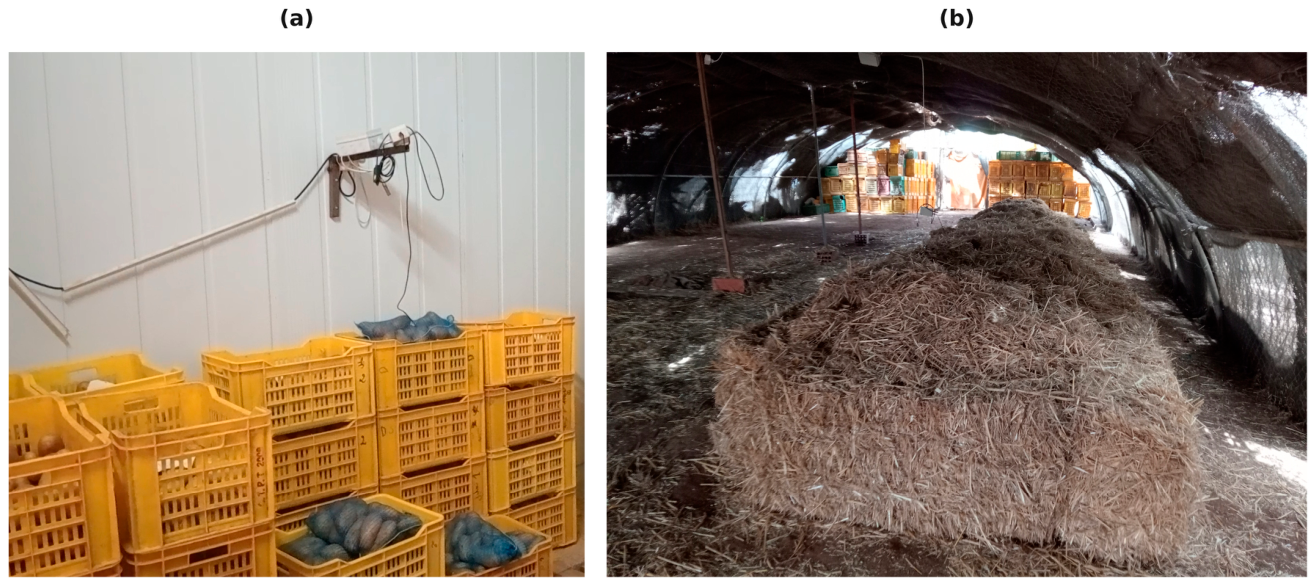
Figure 3.
Experimental installation and wireless monitoring of the three storage modes (scale renderings of the built facility, 2025 campaign). The three compared modes, each fitted with sensor nodes: (a) refrigeration at 7 °C, (b) ultrasonic humidification, and (c) traditional greenhouse storage. The framed panel “Ultrasonic humidification (see b)” details the humidification system.
Figure 3.
Experimental installation and wireless monitoring of the three storage modes (scale renderings of the built facility, 2025 campaign). The three compared modes, each fitted with sensor nodes: (a) refrigeration at 7 °C, (b) ultrasonic humidification, and (c) traditional greenhouse storage. The framed panel “Ultrasonic humidification (see b)” details the humidification system.
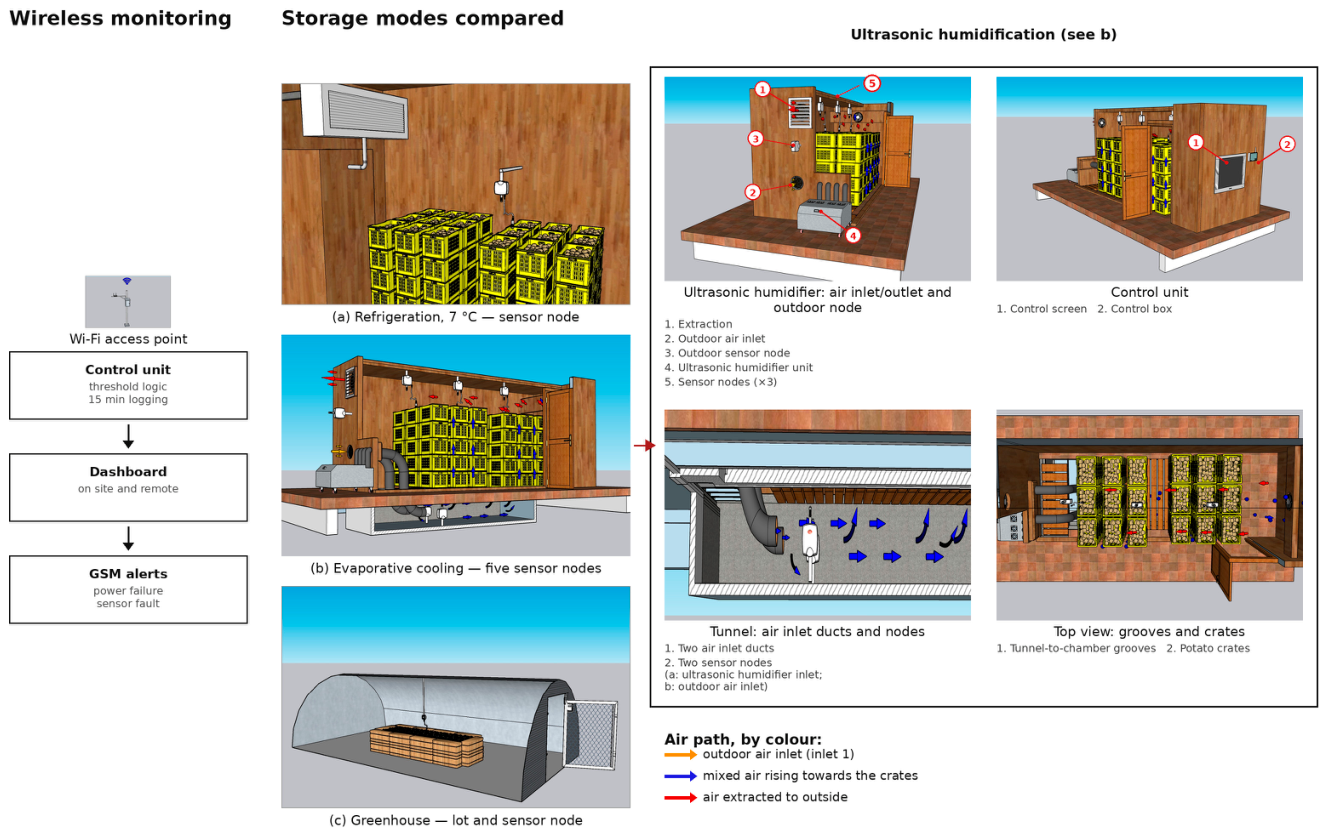
Figure 4.
Physical conditions measured in the three storage modes. (a) Mean VPD by mode and by campaign. (b) Diurnal course of VPD in 2024 over four fixed period of time. (c) Diurnal course of air temperature in 2024. (d) Thermal load on the lot in 2024 (2025 in-crate maximum also shown for H and Trad).
Figure 4.
Physical conditions measured in the three storage modes. (a) Mean VPD by mode and by campaign. (b) Diurnal course of VPD in 2024 over four fixed period of time. (c) Diurnal course of air temperature in 2024. (d) Thermal load on the lot in 2024 (2025 in-crate maximum also shown for H and Trad).
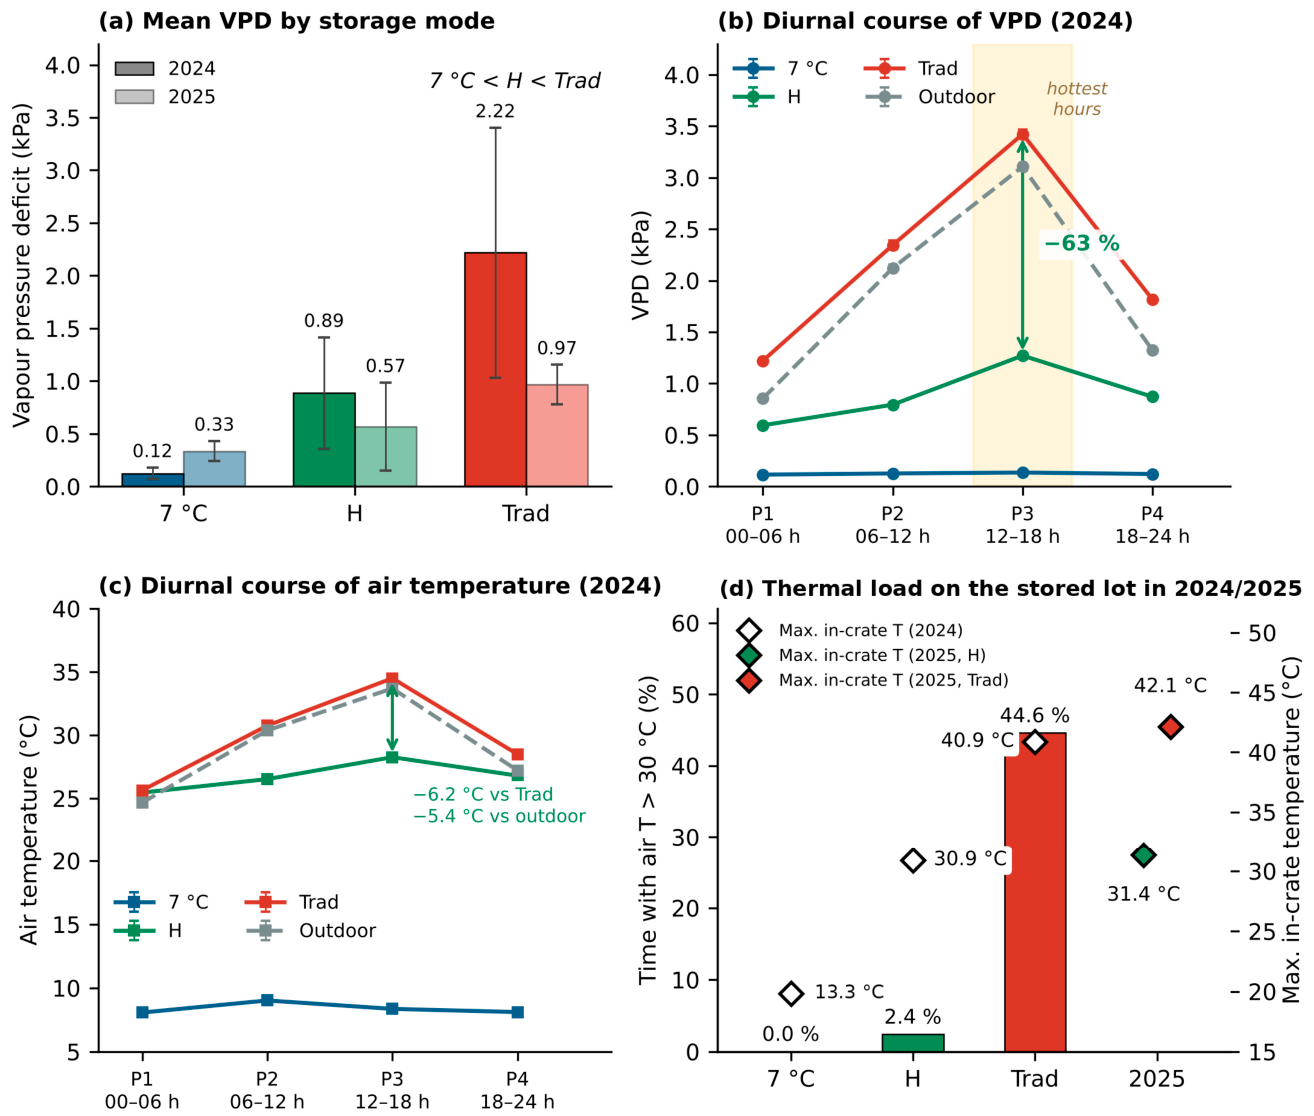
Figure 5.
Vapour pressure deficit by sensor node and ordinal concordance of storage conditions. (a) Mean VPD at each of the five nodes serving the humidification mode, separated into the three nodes above the crates inside the chamber and the two nodes in the underfloor plenum, where N4 samples the incoming outside air and N5 the humidifier discharge; error bars are standard errors. (b) Weight-loss rate plotted against mean VPD for the three modes in both campaigns.
Figure 5.
Vapour pressure deficit by sensor node and ordinal concordance of storage conditions. (a) Mean VPD at each of the five nodes serving the humidification mode, separated into the three nodes above the crates inside the chamber and the two nodes in the underfloor plenum, where N4 samples the incoming outside air and N5 the humidifier discharge; error bars are standard errors. (b) Weight-loss rate plotted against mean VPD for the three modes in both campaigns.
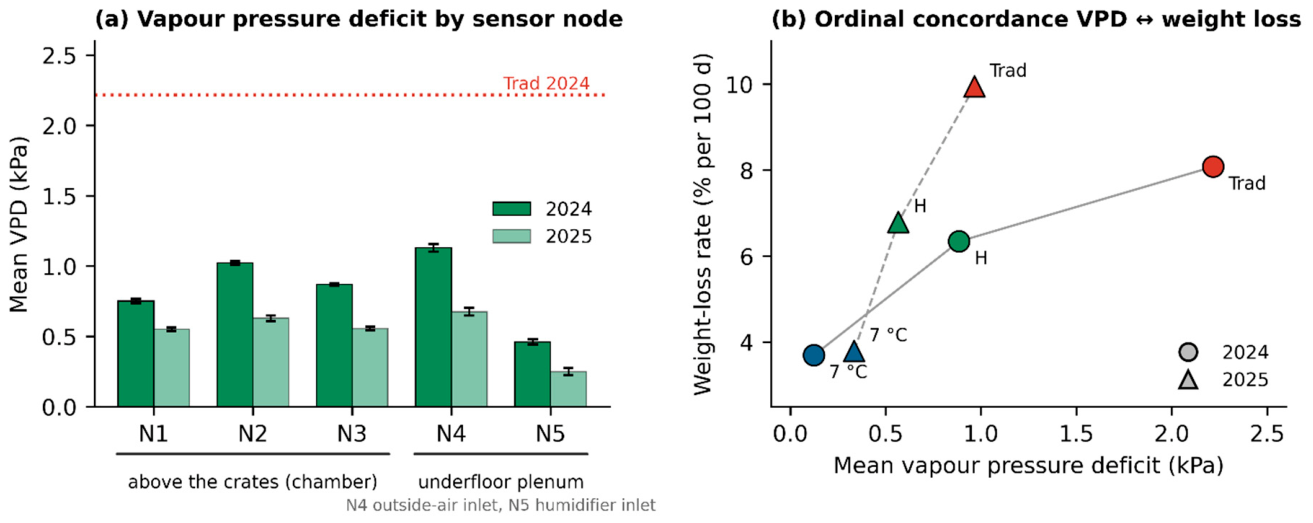
Figure 6.
Kinetics of cumulative weight losses by storage mode, one panel per campaign: (a) 2022, (b) 2023, (c) 2024 and (d) 2025. Means ± standard error of all weighings; the vertical lines mark the comparison dates D50 and D70 (§ 2.7). The ranking 7 °C < H < Trad is preserved in the four campaigns; in 2022, the traditional mode was stopped at D45, and open symbols denote values interpolated between the bracketing weighings (Trad at D45; 7 °C and H at D70).
Figure 6.
Kinetics of cumulative weight losses by storage mode, one panel per campaign: (a) 2022, (b) 2023, (c) 2024 and (d) 2025. Means ± standard error of all weighings; the vertical lines mark the comparison dates D50 and D70 (§ 2.7). The ranking 7 °C < H < Trad is preserved in the four campaigns; in 2022, the traditional mode was stopped at D45, and open symbols denote values interpolated between the bracketing weighings (Trad at D45; 7 °C and H at D70).
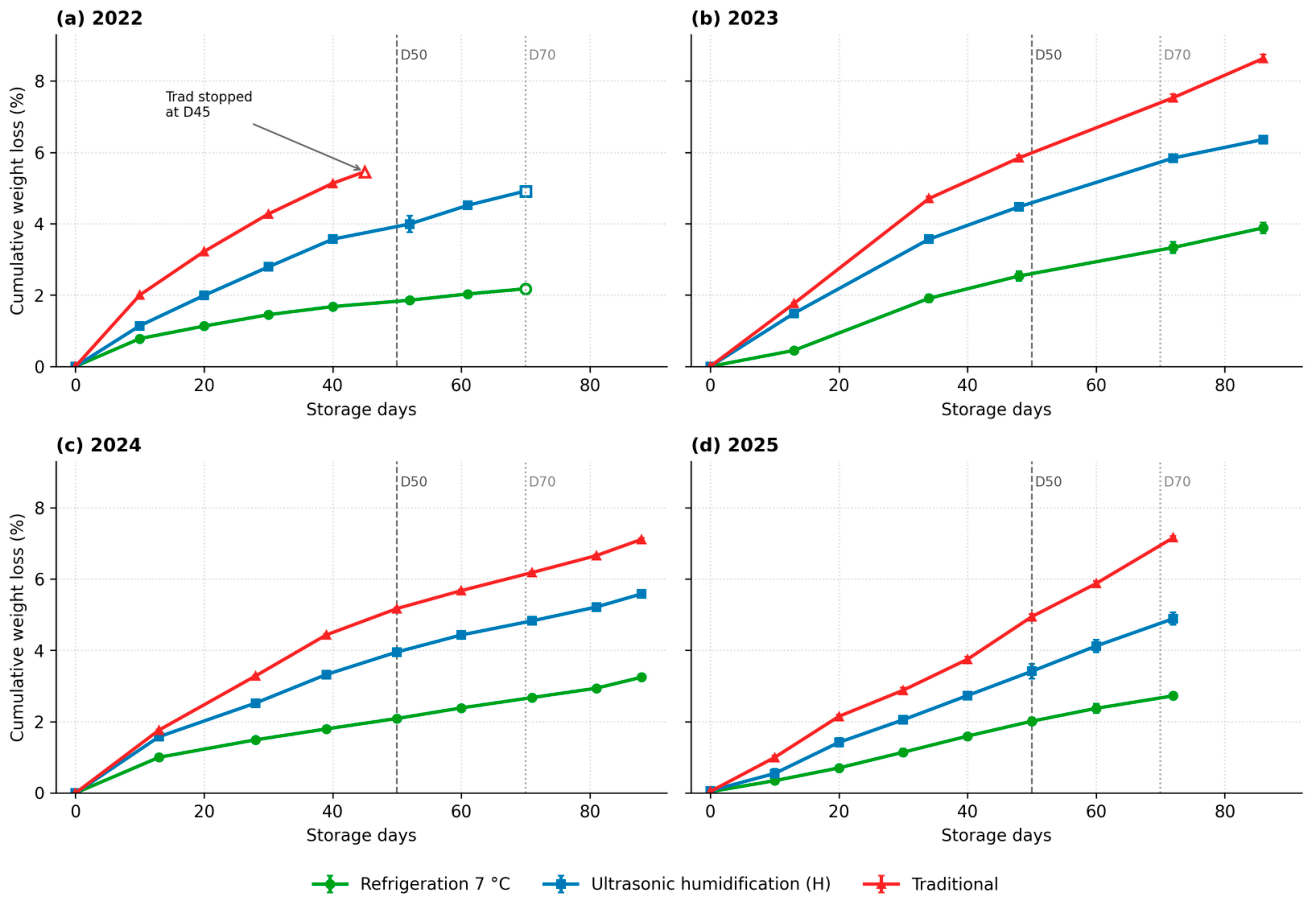
Figure 7.
Inter-seasonal reproducibility of the mode effect. (a) Losses by mode and by campaign at the last reading analysed (2022: D52 for 7 °C and H, D40 for Trad; 2023–2025: end of storage): the order 7 °C < H < Trad holds in the four seasons. (b) Effect size of the Mode factor by campaign, given as the ω² range across the storage periods for 2022 to 2024 and as the ω² of the final losses for 2025: all values far exceed the 'large effect' threshold (0.14), with a mean ω² of 0.981 and minimal dispersion.
Figure 7.
Inter-seasonal reproducibility of the mode effect. (a) Losses by mode and by campaign at the last reading analysed (2022: D52 for 7 °C and H, D40 for Trad; 2023–2025: end of storage): the order 7 °C < H < Trad holds in the four seasons. (b) Effect size of the Mode factor by campaign, given as the ω² range across the storage periods for 2022 to 2024 and as the ω² of the final losses for 2025: all values far exceed the 'large effect' threshold (0.14), with a mean ω² of 0.981 and minimal dispersion.
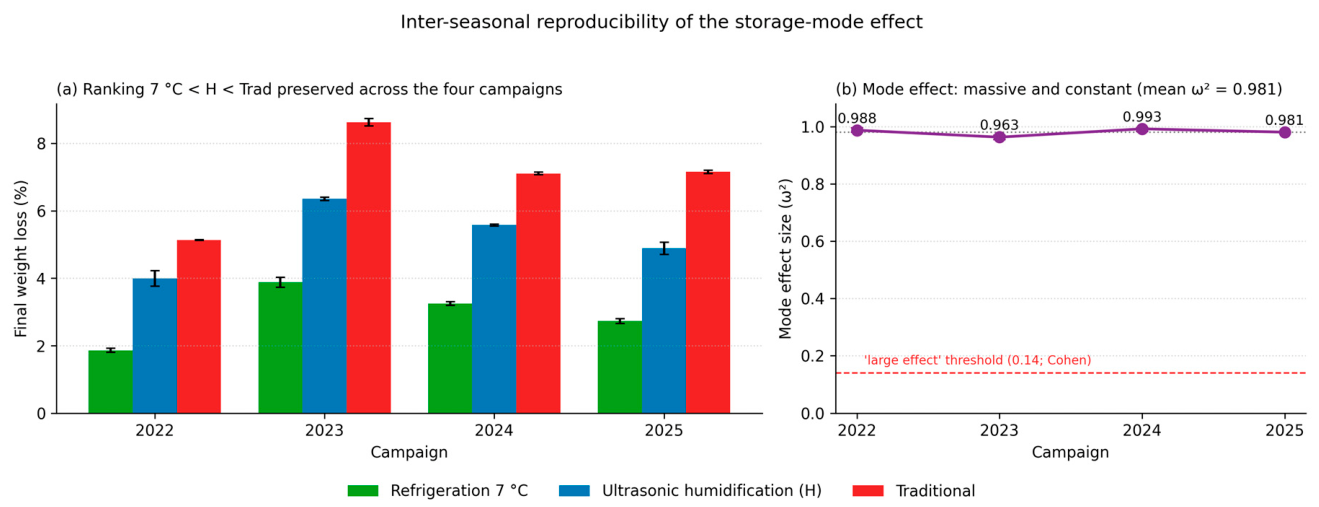
Figure 8.
Reducing sugars by mode at a common storage duration of 40 days (D40; actual measurements for all campaigns and modes, 2022–2025), compared with the 0.25 % industrial threshold (dashed line). This common checkpoint allows direct comparison across campaigns independently of their differing total storage duration (70–88 days); see Table 11 for the values at the actual end of storage of each campaign. Black horizontal marks show the level at entry into storage. Within a campaign, different letters indicate significant differences (Tukey, p < 0.05).
Figure 8.
Reducing sugars by mode at a common storage duration of 40 days (D40; actual measurements for all campaigns and modes, 2022–2025), compared with the 0.25 % industrial threshold (dashed line). This common checkpoint allows direct comparison across campaigns independently of their differing total storage duration (70–88 days); see Table 11 for the values at the actual end of storage of each campaign. Black horizontal marks show the level at entry into storage. Within a campaign, different letters indicate significant differences (Tukey, p < 0.05).
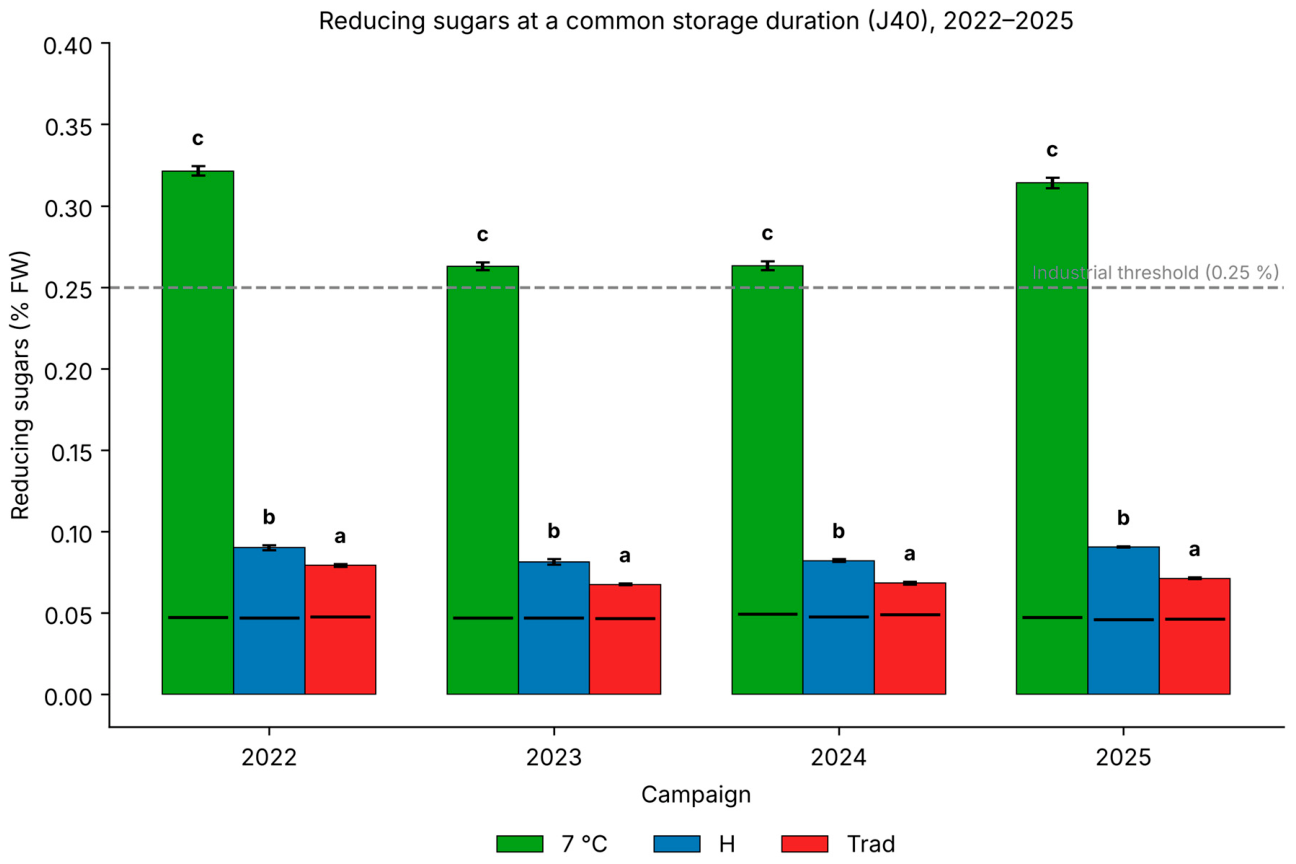
Figure 10.
(a) Degradation of skin firmness by week; (b) evolution of titratable acidity by date — by mode for 2024 campaign. Firmness and acidity both decline fastest under the traditional mode and slowest under refrigeration, confirming the 7 °C > H > Trad hierarchy independently of weight-loss measurements.
Figure 10.
(a) Degradation of skin firmness by week; (b) evolution of titratable acidity by date — by mode for 2024 campaign. Firmness and acidity both decline fastest under the traditional mode and slowest under refrigeration, confirming the 7 °C > H > Trad hierarchy independently of weight-loss measurements.
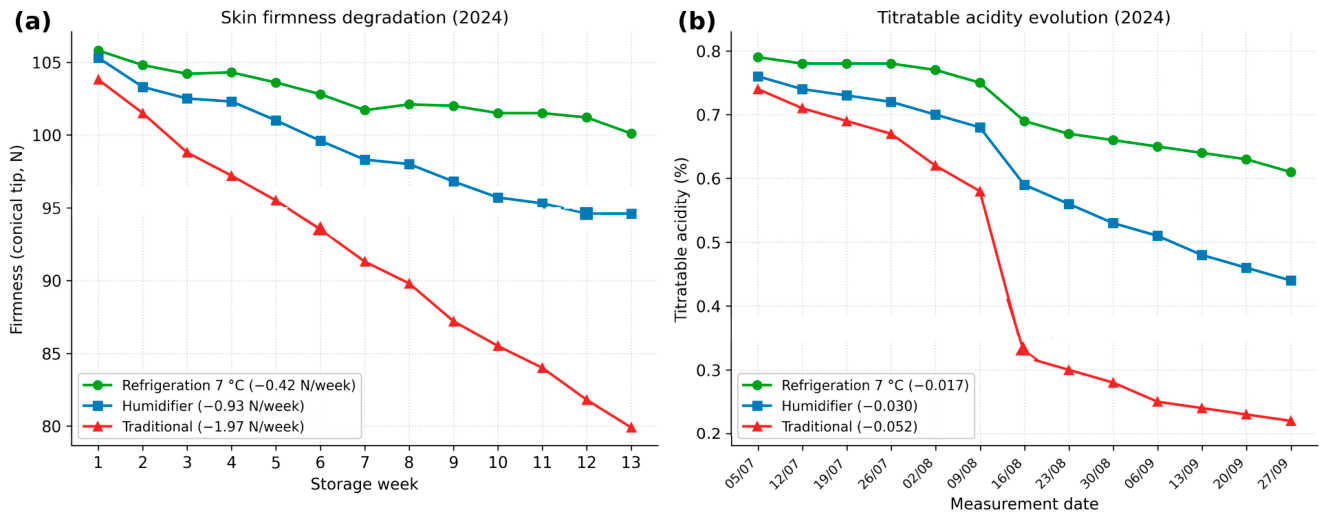
Figure 11.
Multi-criteria quality profile by storage mode referred to 2024 campaign. Each criterion is scored excellent (1.0), good (0.66) or poor (0.33) by comparison with predefined thresholds. A synthesis and decision-support tool, not a statistical result. Refrigeration was the most effective for each criterion except for processing suitability. It could be concluded that humidification offers the most balanced profile.
Figure 11.
Multi-criteria quality profile by storage mode referred to 2024 campaign. Each criterion is scored excellent (1.0), good (0.66) or poor (0.33) by comparison with predefined thresholds. A synthesis and decision-support tool, not a statistical result. Refrigeration was the most effective for each criterion except for processing suitability. It could be concluded that humidification offers the most balanced profile.
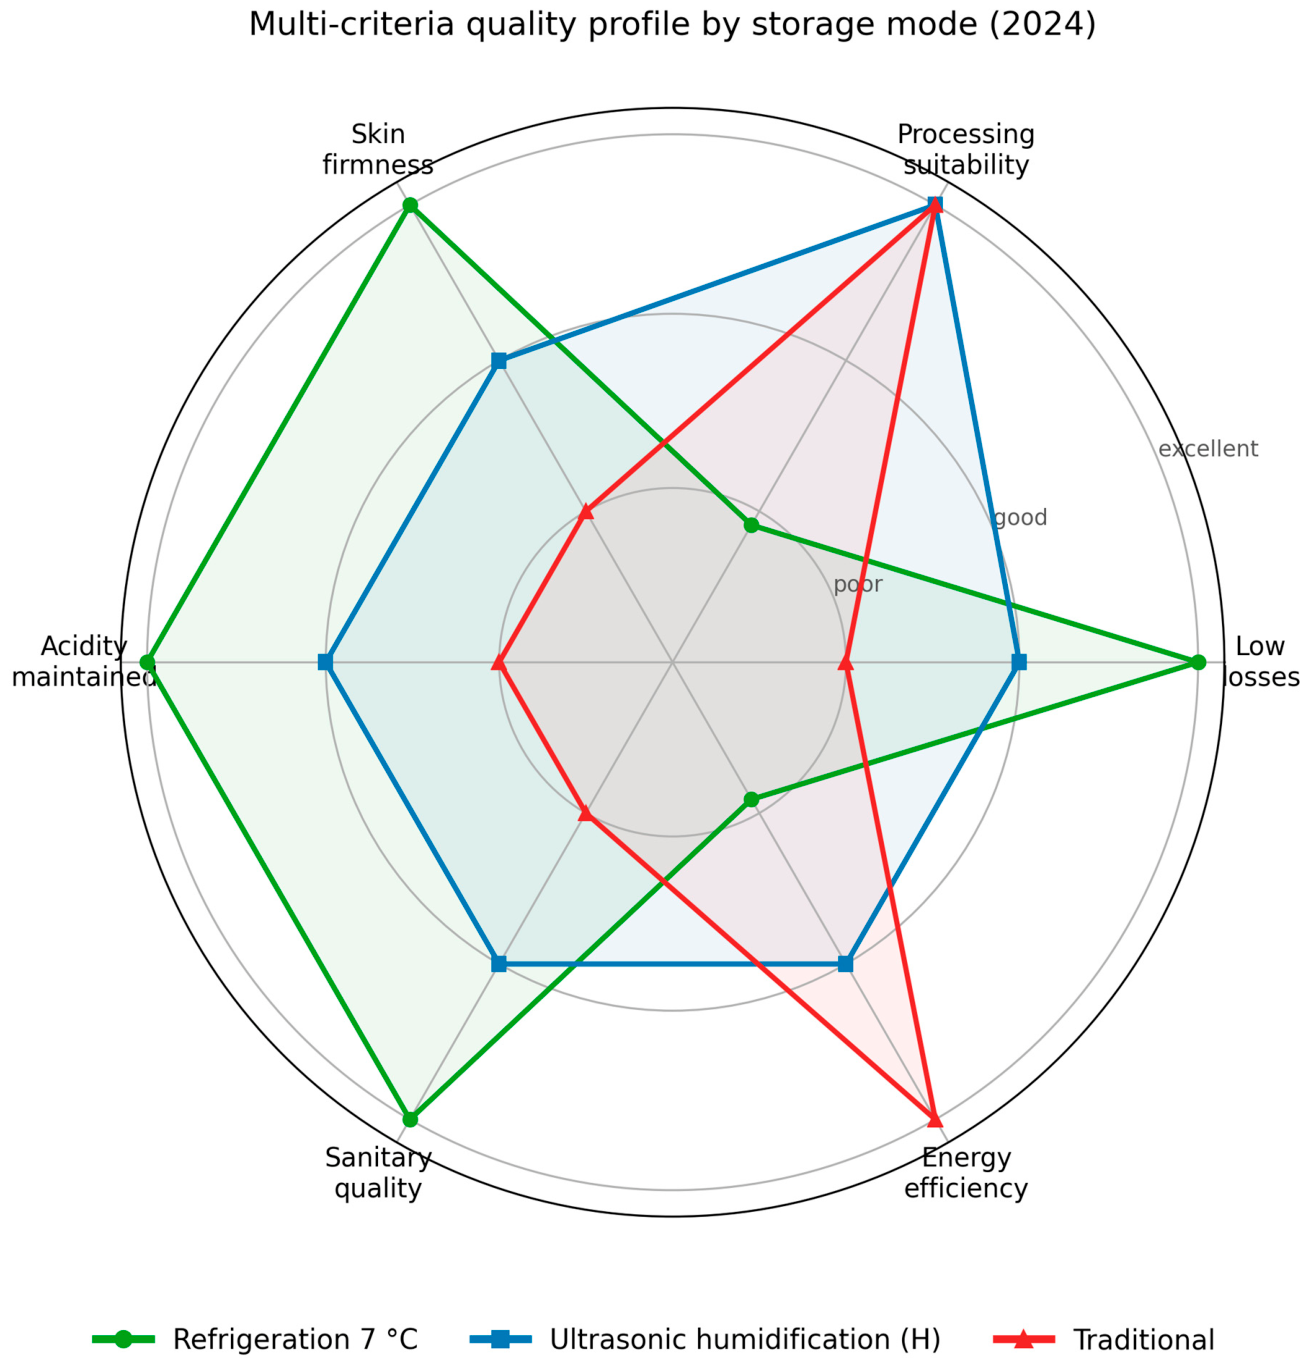
Figure 12.
Principal component analysis of storage parameters per replicate (2025 campaign, n = 15). (a) Replicate scores in the plane of the first two components: the three modes separate clearly along the first (94.3 % of the variance). (b) Variable loadings: the first component opposes losses to dry matter and reducing sugars. KMO = 0.750; Bartlett p < 0.001.
Figure 12.
Principal component analysis of storage parameters per replicate (2025 campaign, n = 15). (a) Replicate scores in the plane of the first two components: the three modes separate clearly along the first (94.3 % of the variance). (b) Variable loadings: the first component opposes losses to dry matter and reducing sugars. KMO = 0.750; Bartlett p < 0.001.
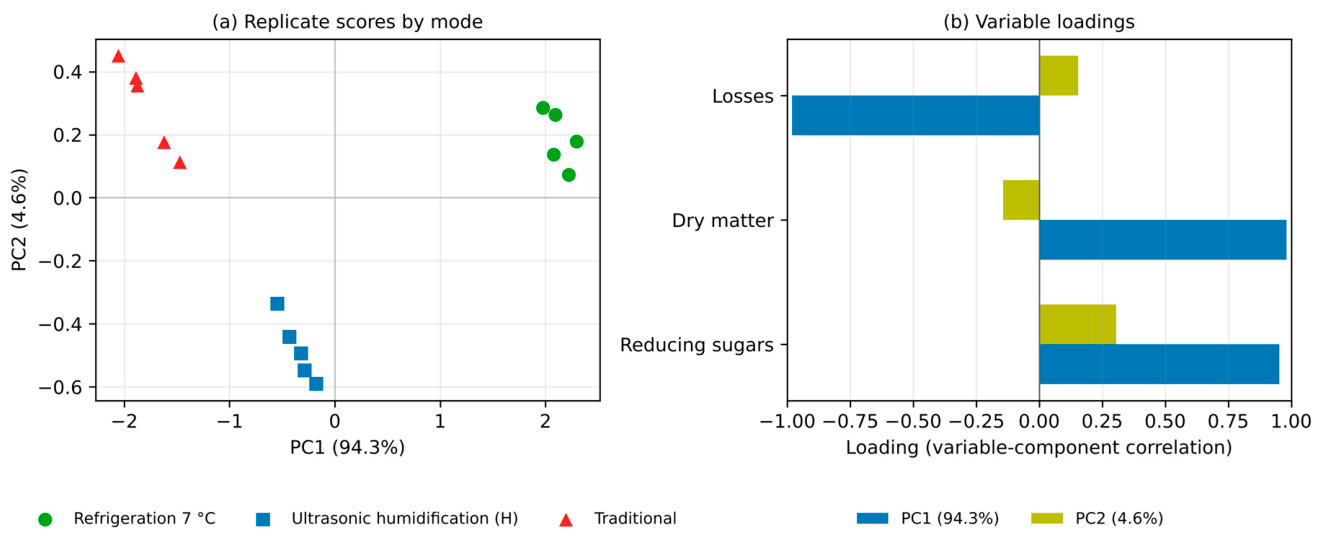
Figure 13.
Correlations between storage parameters per replicate (2025 campaign, n = 15). (a) Losses are negatively correlated with reducing sugars (r = −0.886): refrigeration combines low losses with high sweetening, the traditional mode the opposite. (b) Losses are also negatively correlated with dry matter (r = −0.966): refrigeration combines low losses with the best dry-matter retention, the traditional mode the opposite.
Figure 13.
Correlations between storage parameters per replicate (2025 campaign, n = 15). (a) Losses are negatively correlated with reducing sugars (r = −0.886): refrigeration combines low losses with high sweetening, the traditional mode the opposite. (b) Losses are also negatively correlated with dry matter (r = −0.966): refrigeration combines low losses with the best dry-matter retention, the traditional mode the opposite.
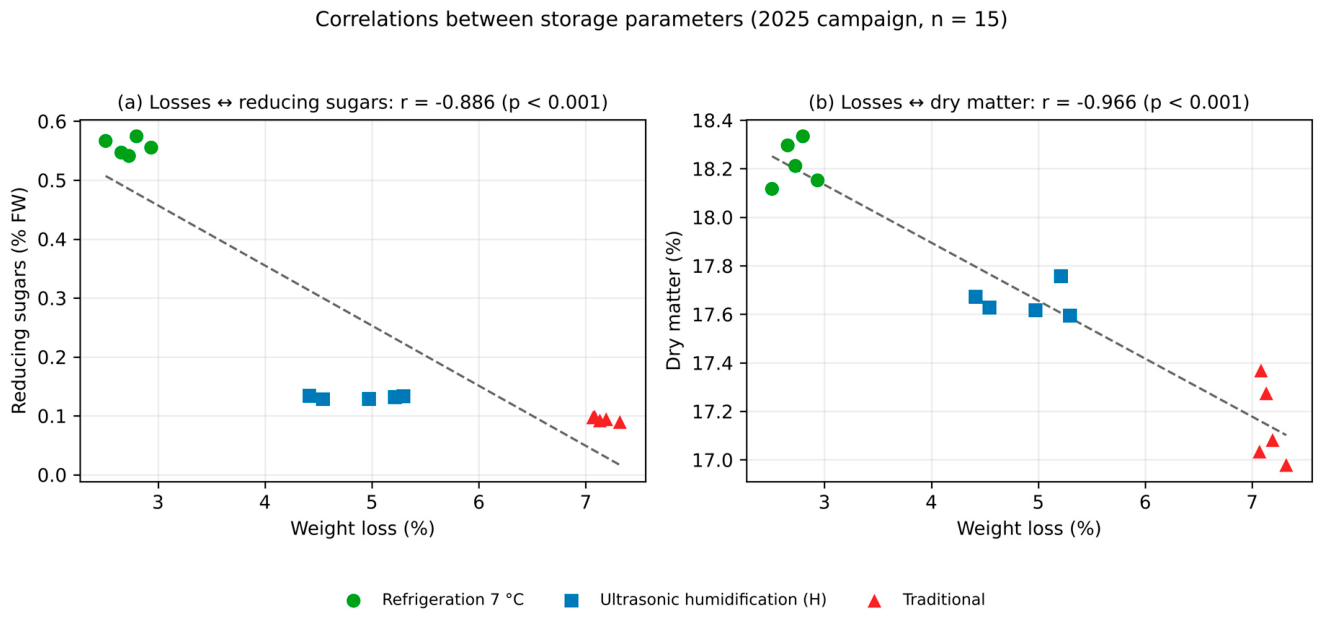
Table 1.
Air temperature and relative humidity from the 1st of July to30th of September of each campaign recorded by the on-site DELTA OHM weather station. Each daily mean is the arithmetic mean of the readings logged by the station over the 24 h of that day; the campaign mean is then the arithmetic mean of those daily means over the 92 days of the window, and the standard deviation is computed on the same daily series. Min/max values are the coolest/warmest and driest/most humid daily means of the window (not instantaneous hourly extremes).
Table 1.
Air temperature and relative humidity from the 1st of July to30th of September of each campaign recorded by the on-site DELTA OHM weather station. Each daily mean is the arithmetic mean of the readings logged by the station over the 24 h of that day; the campaign mean is then the arithmetic mean of those daily means over the 92 days of the window, and the standard deviation is computed on the same daily series. Min/max values are the coolest/warmest and driest/most humid daily means of the window (not instantaneous hourly extremes).
| Campaign | T mean (°C) | T min (°C) | T max (°C) | RH mean (%) | RH min (%) | RH max (%) |
| 2022 | 28.0 | 12.7 | 44.4 | 46.2 | 22.1 | 87.5 |
| 2023 | 28.3 | 15.1 | 48.3 | 54.8 | 20.7 | 71.3 |
| 2024 | 27.7 | 11.0 | 44.9 | 56.9 | 34.9 | 77.1 |
| 2025 | 27.1 | 14.1 | 44.0 | 50.1 | 25.2 | 82.0 |
Table 2.
Summary of the storage designs of the four campaigns (2022–2025). The three-mode protocol is common; sample size, duration and design differ.
Table 2.
Summary of the storage designs of the four campaigns (2022–2025). The three-mode protocol is common; sample size, duration and design differ.
| Campaign | Design | n / mode | Duration | Statistical conditions (losses) |
| 2022 | 3 modes, single lot | 5 | D70 for 7 °C and H; Trad stopped at D45 (rot > 18 %) | Normality rejected at P5; homogeneity satisfied on the median at all periods (rejected on the mean at P4) |
| 2023 | 3 modes, single lot | 10 | 86 days | Normality satisfied; one heteroscedasticity (P3) → Welch ANOVA |
| 2024 | 3 modes, single lot | 10 | 88 days | Normality AND homogeneity satisfied at all periods (only campaign) |
| 2025 | Factorial 3 dates × 3 methods | 5 | D60 + end (72 d) | Normality satisfied; heteroscedasticity at D72 → Welch ANOVA; balanced design, type III SS |
Table 3.
Summary of the pre-storage phase over the three campaigns: duration and large-calibre losses. Losses are given as mean ± standard deviation (n = 10 crates).
Table 3.
Summary of the pre-storage phase over the three campaigns: duration and large-calibre losses. Losses are given as mean ± standard deviation (n = 10 crates).
| Pre-storage phase | 2022 | 2023 | 2024 | p |
| Duration (days) | 16 | 10 | 18 | — |
| Large-calibre losses (%) | 6.21 ± 0.75 | 4.36 ± 0.63 | 4.15 ± 0.35 | — |
Table 4.
Quality variables available per storage mode over the four campaigns.
| Variable (per mode) | 2022 | 2023 | 2024 | 2025 |
| Weight losses | yes | yes | yes | yes |
| Reducing sugars / glucose | yes | yes | yes | glucose |
| Dry matter | yes | yes | yes | yes |
| Sprouting / rot | yes | yes | yes | — |
| Skin firmness | — | — | yes | — |
| Titratable acidity | — | — | yes | — |
Table 5.
Thermo-hygrometric conditions measured in the three storage modes by the connected-sensor network, 2024 and 2025 campaigns.
Table 5.
Thermo-hygrometric conditions measured in the three storage modes by the connected-sensor network, 2024 and 2025 campaigns.
| Campaign | Mode or reference | Air T (°C) | RH (%) | VPD (kPa) | VPD 12–18 h (kPa) | Time > 30 °C (%) | Max in-crate T (°C) |
| 2024 | 7 °C | 8.4 ± 2.3 | 88.5 ± 4.3 | 0.12 ± 0.05 | 0.14 | 0.0 | 13.3ᶜ |
| 2024 | H | 26.8 ± 2.0 | 75.2 ± 12.1 | 0.89 ± 0.53 | 1.27 | 2.4 | 30.9 |
| 2024 | Trad | 30.0 ± 4.2 | 51.8 ± 13.3 | 2.22 ± 1.18 | 3.42 | 44.6 | 40.9 |
| 2024 | Outdoor air (reference) | 29.0 ± 4.9 | 58.0 ± 17.5 | 1.87 ± 1.27 | 3.11 | 40.1 | — |
| 2025 | 7 °Cᵃ | 14.5 ± 1.9 | 80.0 ± 5.2 | 0.33 ± 0.10 | 0.37 | 0.0 | 15.75ᵈ |
| 2025 | H | 25.3 ± 2.1 | 84.1 ± 10.7 | 0.57 ± 0.42 | 0.83 | 0.1 | 31.4 |
| 2025 | Tradᵇ | 25.6 ± 0.9 | 70.6 ± 5.8 | 0.97 ± 0.19 | 0.97 | 0.2 | 42.1 |
| 2025 | Outdoor air (reference) | 29.0 ± 6.1 | 57.6 ± 20.2 | 2.07 ± 1.63 | 3.92 | 43.3 | — |
Table 8.
Effect sizes of the Mode factor, sample sizes, durations and test agreement by campaign. The high and tight ω² values (mean 0.981), obtained on heterogeneous designs, are shown in Figure 7b.
Table 8.
Effect sizes of the Mode factor, sample sizes, durations and test agreement by campaign. The high and tight ω² values (mean 0.981), obtained on heterogeneous designs, are shown in Figure 7b.
| Campaign | ω² (Mode) | n / mode | Duration | ANOVA/KW agreement |
| 2022 | 0.981–0.996 (P1–P4) | 5 | D70 (Trad: D45) | 100 % |
| 2023 | 0.955–0.970 | 10 | D86 | 100 % |
| 2024 | 0.983–0.996 | 10 | D88 | 100 % |
| 2025 | 0.981 | 5 | D72 | 100 % |
Table 9.
General linear model Mode × Year on final weight losses (type III sums of squares; N = 75; R² = 0.983). The variance share is the share of the corrected total sum of squares. The Mode effect dominates (80 %); the interaction, though significant, is negligible (< 1 %).
Table 9.
General linear model Mode × Year on final weight losses (type III sums of squares; N = 75; R² = 0.983). The variance share is the share of the corrected total sum of squares. The Mode effect dominates (80 %); the interaction, though significant, is negligible (< 1 %).
| Source | df | F | p | η²ₚ | Variance share |
| Mode | 2 | 1510.97 | < 0.001 | 0.979 | 80.1 % |
| Year | 2 | 168.06 | < 0.001 | 0.836 | 8.9 % |
| Mode × Year | 4 | 9.04 | < 0.001 | 0.354 | 0.96 % |
| Error | 66 | — | — | — | 1.75 % |
Table 12.
Dry-matter content at entry into and at end of storage, by mode and by campaign (2022–2025). MSᵢ: dry matter at entry (% fresh weight); MSᶠ: dry matter at end of storage; ΔMS: MSᶠ − MSᵢ (percentage points, mean ± SD, n = 5). Letters denote Tukey HSD groups on ΔMS within a campaign (p < 0.05); a = largest loss. The 2022 traditional-mode lot was stopped at day 45 instead of day 70 because of excessive rot (§ 3.8).
Table 12.
Dry-matter content at entry into and at end of storage, by mode and by campaign (2022–2025). MSᵢ: dry matter at entry (% fresh weight); MSᶠ: dry matter at end of storage; ΔMS: MSᶠ − MSᵢ (percentage points, mean ± SD, n = 5). Letters denote Tukey HSD groups on ΔMS within a campaign (p < 0.05); a = largest loss. The 2022 traditional-mode lot was stopped at day 45 instead of day 70 because of excessive rot (§ 3.8).
| Campaign | Mode | MSᵢ (%) | MSᶠ (%) | ΔMS (pts) |
| 2022 | Trad | 18.86 ± 0.08 | 17.56 ± 0.09 | −1.30 ± 0.03 b |
| 2022 | H | 18.74 ± 0.06 | 17.13 ± 0.11 | −1.60 ± 0.07 a |
| 2022 | 7 °C | 18.80 ± 0.06 | 17.81 ± 0.13 | −0.99 ± 0.09 c |
| 2023 | Trad | 19.06 ± 0.08 | 16.96 ± 0.08 | −2.10 ± 0.05 a |
| 2023 | H | 19.01 ± 0.10 | 17.35 ± 0.10 | −1.65 ± 0.03 b |
| 2023 | 7 °C | 19.06 ± 0.08 | 18.03 ± 0.09 | −1.03 ± 0.04 c |
| 2024 | Trad | 18.78 ± 0.08 | 16.60 ± 0.05 | −2.18 ± 0.05 a |
| 2024 | H | 18.88 ± 0.09 | 17.27 ± 0.09 | −1.61 ± 0.05 b |
| 2024 | 7 °C | 18.74 ± 0.11 | 17.76 ± 0.14 | −0.98 ± 0.08 c |
| 2025 | Trad | 19.32 ± 0.10 | 17.15 ± 0.17 | −2.17 ± 0.08 a |
| 2025 | H | 19.24 ± 0.09 | 17.65 ± 0.06 | −1.59 ± 0.05 b |
| 2025 | 7 °C | 19.20 ± 0.02 | 18.22 ± 0.09 | −0.97 ± 0.09 c |
Table 13.
End-of-storage skin firmness and titratable acidity and degradation rates by mode (2024 campaign, n = 10). Firmness declines 4.7 times faster, and acidity about 3 times faster, under the traditional mode than under refrigeration, confirming the 7 °C > H > Trad hierarchy on axes physiologically independent of weight loss.
Table 13.
End-of-storage skin firmness and titratable acidity and degradation rates by mode (2024 campaign, n = 10). Firmness declines 4.7 times faster, and acidity about 3 times faster, under the traditional mode than under refrigeration, confirming the 7 °C > H > Trad hierarchy on axes physiologically independent of weight loss.
| Parameter (end, 2024) | 7 °C | H | Trad | |
| Skin firmness (N) | 100.14 | 94.66 | 79.91 | |
| Firmness slope (N/week) | −0.416 | −0.929 | −1.965 | |
| Titratable acidity (%) | 0.61 | 0.44 | 0.22 | |
| Acidity slope (pt/week) | −0.017 | −0.030 | −0.052 |
Disclaimer/Publisher’s Note: The statements, opinions and data contained in all publications are solely those of the individual author(s) and contributor(s) and not of MDPI and/or the editor(s). MDPI and/or the editor(s) disclaim responsibility for any injury to people or property resulting from any ideas, methods, instructions or products referred to in the content. |
© 2026 by the authors. Licensee MDPI, Basel, Switzerland. This article is an open access article distributed under the terms and conditions of the Creative Commons Attribution (CC BY) license.
Copyright: This open access article is published under a Creative Commons CC BY 4.0 license, which permit the free download, distribution, and reuse, provided that the author and preprint are cited in any reuse.