

Submitted:
11 November 2026
Posted:
17 November 2026
You are already at the latest version
Abstract
Objective: Pelvic incidence (PI) is generally considered a fixed morphologic parameter after skeletal maturity, although postoperative variation has been reported following spinal fusion. This study examined whether measured PI changes after posterior long-segment fusion for adult spinal deformity, with particular emphasis on bidirectional variability at the patient level. Methods: We retrospectively reviewed patients who underwent posterior fusion across at least five levels between 2010 and 2015. Two independent observers measured preoperative and postoperative spinopelvic parameters on standing full-length spine radiographs, and the mean of their PI measurements was used in the analyses. Interobserver agreement was assessed using intraclass correlation coefficients (ICCs). Patients were grouped according to whether the distal construct terminated in the lumbar spine or extended to the pelvis. Because no prespecified direction of postoperative PI change was assumed, both the directional change and the absolute patient-level difference were analyzed. Results: The study included 42 patients, 38 of whom were women. Mean age was 69.64 ± 6.94 years, and median follow-up was 42.5 months (interquartile range [IQR], 26–59 months). Mean PI increased from 49.6 ± 11.97° preoperatively to 52.5 ± 10.01° postoperatively (p = 0.097), corresponding to a mean directional change of 2.94 ± 11.20°. Directional changes also did not reach statistical significance within either distal-fusion subgroup. The median absolute PI difference was 6° (IQR, 2–13.5°; p < 0.001). Oswestry Disability Index (ODI) and back- and leg-pain visual analog scale (VAS) scores decreased significantly after surgery (all p < 0.001), but the magnitude of these changes was not correlated with PI variability. Interobserver agreement ranged from moderate to good (ICC, 0.715–0.857). Conclusion: Measured PI varied in both directions after posterior long-segment fusion. The mean directional shift was small, and the observed magnitude should be interpreted in the context of radiographic measurement variability. PI variability was not associated with changes in disability or pain scores and may reflect postoperative spinopelvic adaptation rather than symptomatic recovery. Reassessment of the current spinopelvic profile may be useful during long-term follow-up and revision planning.
Keywords:
pelvic incidence
; adult spinal deformity
; sagittal balance
; spinopelvic alignment
; sacroiliac joint
1. Introduction
Adult spinal deformity (ASD) is a heterogeneous clinical condition encompassing structural abnormalities that arise or progress after skeletal maturity, including degenerative scoliosis, sagittal malalignment, spinal stenosis, and vertebral instability. Its prevalence increases markedly with the accumulation of age-related degenerative changes. Among adults older than 60 years, reported prevalence varies widely according to the population and diagnostic criteria, with rates as high as 68% described in selected elderly volunteer cohorts [1,2]. The clinical burden extends beyond radiographic curvature and includes pain, neurologic symptoms, reduced walking capacity, and impaired daily functioning [2,3].
Early radiographic studies compared sagittal alignment and balance between asymptomatic volunteers and patients with low back pain [4]. Subsequent evidence linking sagittal malalignment with symptom severity, disability, and health-related quality of life has made sagittal-plane assessment central to adult deformity evaluation and surgical planning [5,6]. Larger sagittal vertical axis (SVA), pelvic tilt (PT), and pelvic incidence–lumbar lordosis mismatch have been associated with worse patient-reported outcomes [5,6,7]. Accordingly, restoration of global sagittal alignment has become an important goal of adult deformity surgery [5,6,7,8].
The sagittal profile is described using SVA, thoracic kyphosis (TK), lumbar lordosis (LL), PT, sacral slope (SS), and pelvic incidence (PI) [5,6]. PI is defined as the angle between a line perpendicular to the midpoint of the sacral endplate and a line connecting that point to the axis of the femoral head centers [9]. It reflects pelvic morphology and has traditionally been regarded as an individualized, posture-independent anatomical measure that remains constant after skeletal maturity [9]. Because PI is geometrically equal to the sum of PT and SS, it provides a morphologic reference for the sagittal relationship between the spine and pelvis [9,10].
PI plays a central role in determining target LL, and conventional surgical planning generally aims to maintain the PI–LL difference within approximately ±10° [5,6]. Reports of changes in measured PI after correction of adult spinal deformity have challenged the assumption that the parameter remains absolutely invariant [11,12]. Wei et al. reported that measured PI increased in some patients and decreased in others, with substantial variation in the magnitude of change [12]. Such bidirectional variability may be obscured when assessment is limited to the mean preoperative-to-postoperative directional difference.
The sacroiliac joint is a recognized potential source of lower-back and gluteal pain [13]. Lumbar fusion models have shown that angular motion and articular surface stress at the sacroiliac joint increase as the number of fused levels increases [14]. These biomechanical changes, together with the corrective forces generated by long-segment constructs, could theoretically influence the relative position of the sacrum and ilium and contribute to variability in radiographic PI measurements [12,14].
This study examined whether measured PI changes after posterior long-segment fusion in patients with ASD. Because PI, unlike clinical scores, has no prespecified desirable direction of change, postoperative variation was evaluated using both the directional difference and its absolute magnitude. Secondary analyses examined whether PI variability was associated with the distal level of fusion, other spinopelvic parameters, or functional outcomes.
2. Materials and Methods
2.1. Study Design and Clinical Data Collection
Patients who underwent posterior long-segment fusion between 2010 and 2015 were retrospectively reviewed. Institutional ethics committee approval was obtained (Adana City Training and Research Hospital Scientific Research Ethics Committee, approval number:25/1287), and each patient provided informed consent. Eligibility criteria were a diagnosis of ASD and posterior fusion involving at least five levels. Patients were excluded if they had a history of tumor, infection, or trauma, had previously undergone pelvic surgery, or had incomplete radiographic or clinical data.
Posterior fusion was performed using pedicle screws and titanium rods in all patients. Follow-up assessments were conducted at 3 months, 1 year, and 2 years after surgery. Standing full-length spine radiographs, computed tomography scans, and magnetic resonance images were obtained preoperatively and postoperatively. Postoperative measurements were obtained from the radiographs taken at the last follow-up. Patients were divided into two groups according to the distal extent of fusion: the pelvic fixation group, in which the construct extended to the pelvis, and the non-pelvic fixation group, in which the construct terminated proximal to the pelvis (at L5 in seven patients, L4 in two, and L3 in three).
2.2. Clinical Evaluation
Demographic and surgical data, including age, sex, body mass index, and operative characteristics, were recorded. Functional outcomes were assessed using the Oswestry Disability Index (ODI) and visual analog scale (VAS) scores for back and leg pain.
2.3. Radiological Assessment
Spinopelvic parameters were measured on standing full-length spine radiographs and included SVA, TK, LL, PT, SS, and PI (Figure 1). SVA was measured as the horizontal distance between the C7 plumb line and the posterosuperior corner of the sacrum. TK was measured as the angle between the superior endplate of T4 and the inferior endplate of T12, whereas LL was measured between the superior endplates of L1 and S1. PT was defined as the angle between the vertical axis and a line connecting the midpoint of the sacral endplate to the axis of the femoral head centers. SS was measured between the sacral endplate and the horizontal plane. PI was defined as the angle between a line perpendicular to the midpoint of the sacral endplate and a line connecting that point to the axis of the femoral head centers (Figure 1). Two independent observers performed all measurements. For PI, the mean of their measurements was used in the statistical analyses. For descriptive purposes, PI was categorized as low (<45°), normal (45–60°), or high (>60°).
2.4. Statistical Analysis
All analyses were performed using IBM SPSS Statistics version 27 (IBM Corp., Armonk, NY, USA). Statistical significance was defined as p < 0.05. Normality was assessed using the Shapiro–Wilk test. Normally distributed continuous variables are presented as mean ± standard deviation, non-normally distributed continuous variables as median (25th–75th percentile), and categorical variables as frequency and percentage.
Interobserver agreement for PI measurements was assessed using intraclass correlation coefficients (ICCs). Between-group comparisons of continuous variables were performed using Student’s t test or the Mann–Whitney U test, as appropriate. Repeated measurements of normally distributed continuous variables were analyzed using two-way repeated-measures analysis of variance (ANOVA) within the distal-fusion groups and the paired t test in the overall cohort, whereas non-normally distributed repeated measurements were analyzed using the Wilcoxon signed-rank test. Between-group comparisons of categorical variables were performed using Fisher’s exact test or the Fisher–Freeman–Halton exact test. Repeated categorical measurements were evaluated using the marginal homogeneity test.
Unlike clinical scores, PI has no prespecified desirable direction of postoperative change. A decrease in VAS or ODI scores represents clinical improvement, whereas both an increase and a decrease in PI may represent postoperative positional variability of the pelvis. The absolute magnitude of PI change was therefore analyzed in addition to the conventional directional difference to prevent changes in opposite directions from canceling each other in the group mean. The absolute difference between preoperative and postoperative PI measurements was tested using a one-sample Wilcoxon signed-rank test under the null hypothesis that the absolute difference was zero. Associations between the absolute PI difference and other variables were examined using Spearman rank correlation coefficients.
3. Results
3.1. Patient Demographics and Group Characteristics
A total of 42 patients met the eligibility criteria and were included in the analysis. Of these, 38 were women (90.48%) and 4 were men (9.52%). Mean age was 69.64 ± 6.94 years, and median follow-up was 42.5 months (25th–75th percentile, 26–59 months). All patients had undergone posterior long-segment fusion involving at least six levels for ASD. The pelvic fixation group included 30 patients, and the non-pelvic fixation group included 12. Proximal junctional kyphosis (PJK) was observed in 10 patients (23.81%).
Age, sex distribution, number of fused levels, and PJK frequency did not differ significantly between the groups (all p > 0.05). Median follow-up, however, was significantly longer in the non-pelvic fixation group than in the pelvic fixation group: 71 months (35.5–77.5 months) versus 37 months (24–46 months), respectively (p = 0.003).
3.2. Interobserver Agreement
Interobserver agreement for PI measurements was assessed using ICCs (Table 1). Agreement in the overall cohort was good for both preoperative and postoperative measurements, with ICCs of 0.856 and 0.829, respectively. Within the subgroups, agreement for postoperative PI measurements in the pelvic fixation group was moderate (ICC, 0.715; 95% confidence interval [CI], 0.405–0.864). Agreement was good for all remaining measurements. Subsequent analyses were performed using the mean of the measurements obtained by the two observers.
3.3. Changes in Pelvic Incidence
Mean PI in the overall cohort increased from 49.6 ± 11.97° preoperatively to 52.5 ± 10.01° postoperatively. The within-group comparison did not reach statistical significance (p = 0.097), with a mean directional change of 2.94 ± 11.20°. Because PI increased in some patients and decreased in others, the absolute magnitude of change was also analyzed. The median absolute PI difference was 6° (2–13.5°) and differed significantly from zero (p < 0.001) (Figure 2).
Directional PI change did not reach statistical significance in either the pelvic fixation group (1.68 ± 9.24°, p = 0.414) or the non-pelvic fixation group (6.08 ± 15.09°, p = 0.066). In contrast, the absolute PI difference differed significantly from zero in both groups: 5° (2–11.5°) in the pelvic fixation group (p < 0.001) and 7.75° (2–17.25°) in the non-pelvic fixation group (p = 0.002). Neither the directional change nor the absolute difference differed significantly between the groups (p = 0.255 and p = 0.336, respectively).
3.4. Pelvic Incidence Classification
The distribution of preoperative PI categories did not differ significantly between the groups (p = 0.127), whereas the postoperative distribution did (p = 0.012). The high-PI category (>60°) was more frequent in the non-pelvic fixation group. Within-group transitions between preoperative and postoperative PI categories were not statistically significant (all p > 0.05). PI category remained unchanged in 64.29% of patients, shifted toward the normal range in 23.81%, and shifted away from the normal range in 11.90%. The distribution of these transitions did not differ significantly between the groups (p = 0.597).
3.5. Clinical Outcomes
All three functional measures decreased significantly after surgery. Mean ODI declined from 66.61 ± 20.95 to 45.36 ± 22.52 (p < 0.001). Median back-pain VAS score decreased from 8 (7–9) to 4.5 (2–5), and median leg-pain VAS score decreased from 7 (5–9) to 3 (2–5) (both p < 0.001). The magnitude of these changes did not differ significantly between the pelvic fixation and non-pelvic fixation groups (all p > 0.05).
3.6. Other Spinopelvic Parameters
Mean SVA in the overall cohort decreased from 111.0 mm preoperatively to 88.3 mm postoperatively. The corresponding medians were 92 mm (50–150 mm) and 77.5 mm (51–110 mm), respectively; the change did not reach statistical significance (p = 0.140). Within the subgroup analyses, SVA decreased significantly only in the pelvic fixation group (p = 0.044). Mean PT changed from 26.43 ± 10.82° preoperatively to 27.93 ± 8.45° postoperatively (p = 0.320). Postoperative PT differed significantly between the groups (p = 0.042). Mean SS increased from 24.9° preoperatively to 29.2° postoperatively. Mean LL increased from 28.57 ± 15.49° to 32.00 ± 11.18°, without reaching statistical significance (p = 0.076). Mean TK increased from 28.1° preoperatively to 31.9° postoperatively. The corresponding medians were 25° (20–35°) and 30° (25–39°), respectively (p = 0.060). TK increased significantly in the pelvic fixation group (p = 0.001) but did not change significantly in the non-pelvic fixation group. The direction of TK change differed significantly between the groups (p = 0.001).

Table 2.
Demographic characteristics, surgical data, and preoperative and postoperative measurements by group.
Table 2.
Demographic characteristics, surgical data, and preoperative and postoperative measurements by group.
| Variable | Overall cohort (n = 42) | Pelvic fixation group (n = 30) | non-pelvic fixation group (n = 12) | Between-group p |
| Age, years | 69.64 ± 6.94 | 68.63 ± 6.65 | 72.17 ± 7.30 | 0.138† |
| Female sex | 38 (90.48%) | 29 (96.67%) | 9 (75.00%) | 0.063‖ |
| Male sex | 4 (9.52%) | 1 (3.33%) | 3 (25.00%) | |
| Number of fused levels | 10 (8 - 11) | 10 (10 - 11) | 8 (8 - 10.5) | 0.241§ |
| Follow-up, months | 42.5 (26 - 59) | 37 (24 - 46) | 71 (35.5 - 77.5) | 0.003§ |
| PJK | 10 (23.81%) | 8 (26.67%) | 2 (16.67%) | 0.696‖ |
| Pelvic incidence, ° | ||||
| Preoperative | 49.6 ± 11.97 | 47.73 ± 11.06 | 54.46 ± 13.27 | 0.101‡ |
| Postoperative | 52.5 ± 10.01 | 49.42 ± 7.82 | 60.54 ± 10.77 | <0.001‡ |
| Within-group p | 0.097Ψ | 0.414‡ | 0.066‡ | |
| Change (1) | 2.94 ± 11.20 | 1.68 ± 9.24 | 6.08 ± 15.09 | 0.255‡ |
| Absolute difference (2) | 6 (2 - 13.5) | 5 (2 - 11.5) | 7.75 (2 - 17.25) | 0.336§ |
| p for absolute difference versus zero (3) | <0.001¥ | <0.001¥ | 0.002¥ | |
| Preoperative PI category | 0.127¶ | |||
| Low (<45°) | 15 (35.71%) | 12 (40.00%) | 3 (25.00%) | |
| Normal (45–60°) | 21 (50.00%) | 16 (53.33%) | 5 (41.67%) | |
| High (>60°) | 6 (14.29%) | 2 (6.67%) | 4 (33.33%) | |
| Postoperative PI category | 0.012¶ | |||
| Low (<45°) | 10 (23.81%) | 10 (33.33%) | 0 (0.00%) | |
| Normal (45–60°) | 26 (61.90%) | 18 (60.00%) | 8 (66.67%) | |
| High (>60°) | 6 (14.29%) | 2 (6.67%) | 4 (33.33%)* | |
| Within-group p | 0.251Φ | 0.527Φ | 0.317Φ | |
| Category transition (4) | 0.597¶ | |||
| Shift away from the normal range | 5 (11.90%) | 4 (13.33%) | 1 (8.33%) | |
| No category change | 27 (64.29%) | 20 (66.67%) | 7 (58.33%) | |
| Shift toward the normal range | 10 (23.81%) | 6 (20.00%) | 4 (33.33%) | |
| Back-pain VAS | ||||
| Preoperative | 8 (7 - 9) | 8 (7 - 9) | 8 (8 - 9) | 0.700§ |
| Postoperative | 4.5 (2 - 5) | 4 (2 - 5) | 5 (4 - 5) | 0.514§ |
| Within-group p | <0.001# | <0.001# | 0.003# | |
| Change (1) | -4 (-5 - -3) | -4 (-6 - -3) | -4 (-5 - -3) | 0.683§ |
| Leg-pain VAS | ||||
| Preoperative | 7 (5 - 9) | 7 (5 - 9) | 8.5 (7 - 9) | 0.141§ |
| Postoperative | 3 (2 - 5) | 3 (2 - 5) | 3 (1.5 - 4) | 0.977§ |
| Within-group p | <0.001# | <0.001# | 0.007# | |
| Change (1) | -4 (-6 - -1) | -3 (-5 - -1) | -5 (-6 - -2) | 0.279§ |
| ODI (%) | ||||
| Preoperative | 66.61 ± 20.95 | 69.55 ± 20.08 | 59.25 ± 22.13 | 0.152‡ |
| Postoperative | 45.36 ± 22.52 | 46.27 ± 21.55 | 43.08 ± 25.66 | 0.684‡ |
| Within-group p | <0.001Ψ | <0.001‡ | 0.001‡ | |
| Change (1) | -21.25 ± 16.11 | -23.28 ± 18.07 | -16.17 ± 8.16 | 0.200‡ |
| SVA (mm) | ||||
| Preoperative | Mean: 111.0; median: 92 (50 - 150) | 103.5 (54 - 160) | 81 (40.5 - 106) | 0.089§ |
| Postoperative | Mean: 88.3; median: 77.5 (51 - 110) | 71 (45 - 114) | 96.5 (60 - 110) | 0.495§ |
| Within-group p | 0.140# | 0.044# | 0.583# | |
| Change (1) | -11 (-42 - 21) | -20 (-81 - 19) | -3.5 (-16.5 - 32) | 0.089§ |
| Pelvic tilt, ° | ||||
| Preoperative | 26.43 ± 10.82 | 25.50 ± 10.32 | 28.75 ± 12.14 | 0.386‡ |
| Postoperative | 27.93 ± 8.45 | 26.27 ± 7.58 | 32.08 ± 9.41 | 0.042‡ |
| Within-group p | 0.320Ψ | 0.668‡ | 0.241‡ | |
| Change (1) | 1.50 ± 9.66 | 0.77 ± 10.25 | 3.33 ± 8.07 | 0.443‡ |
| Sacral slope, ° | ||||
| Preoperative | 24.9 | 29.90 ± 11.51 | 27.50 ± 9.30 | 0.525‡ |
| Postoperative | 29.2 | 23.43 ± 9.16 | 28.83 ± 9.61 | 0.096‡ |
| Within-group p | 0.032Ψ | 0.005‡ | 0.702‡ | |
| Change (1) | -4.24 ± 12.35 | -6.47 ± 12.62 | 1.33 ± 10.04 | 0.064‡ |
| Lumbar lordosis, ° | ||||
| Preoperative | 28.57 ± 15.49 | 27.33 ± 14.18 | 31.67 ± 18.71 | 0.420‡ |
| Postoperative | 32.00 ± 11.18 | 31.07 ± 9.84 | 34.33 ± 14.21 | 0.399‡ |
| Within-group p | 0.076Ψ | 0.105‡ | 0.458‡ | |
| Change (1) | 3.43 ± 12.19 | 3.73 ± 11.08 | 2.67 ± 15.14 | 0.801‡ |
| Thoracic kyphosis, ° | ||||
| Preoperative | Mean: 28.1; median: 25 (20 - 35) | 23.5 (16 - 30) | 32.5 (24 - 50) | 0.012§ |
| Postoperative | Mean: 31.9; median: 30 (25 - 39) | 30 (25 - 39) | 28.5 (20.5 - 40.5) | 0.845§ |
| Within-group p | 0.060# | 0.001# | 0.099# | |
| Change (1) | 4 (-4 - 14) | 7.5 (0 - 15) | -4.5 (-13 - 0.5) | 0.001§ |
Normally distributed continuous variables are presented as mean ± standard deviation, non-normally distributed continuous variables as median (25th–75th percentile), and categorical variables as frequency (percentage). † Student’s t test; ‡ two-way repeated-measures analysis of variance; § Mann–Whitney U test; # Wilcoxon signed-rank test; ¥ one-sample Wilcoxon signed-rank test; ‖ Fisher’s exact test; ¶ Fisher–Freeman–Halton exact test; Φ marginal homogeneity test; Ψ paired t test. *Statistically significant category in variables with three or more categories. (1) Postoperative minus preoperative value; negative values indicate a decrease and positive values indicate an increase. (2) Absolute value of the difference between postoperative and preoperative PI. (3) Tested under the null hypothesis that the absolute PI difference was zero. (4) Postoperative PI category relative to the preoperative category. ANOVA: analysis of variance; LL: lumbar lordosis; ODI: Oswestry Disability Index; PI: pelvic incidence; PJK: proximal junctional kyphosis; PT: pelvic tilt; SS: sacral slope; SVA: sagittal vertical axis; TK: thoracic kyphosis; VAS: visual analog scale. For overall-cohort SVA and TK, author-supplied means are additionally shown alongside the original medians (25th–75th percentile).
3.7. Factors Associated with Pelvic Incidence Variability
Associations between the absolute PI difference and demographic, clinical, and radiographic variables were examined using Spearman correlation analysis (Table 3). The absolute PI difference was not significantly associated with age, sex, number of fused levels, or PJK. No significant correlations were identified with ODI or back- and leg-pain VAS scores.
4. Discussion
The principal finding was that measured PI, traditionally regarded as a fixed parameter, was not invariant at the patient level after posterior long-segment fusion. Mean PI increased from 49.6 ± 11.97° preoperatively to 52.5 ± 10.01° postoperatively, but the mean directional change was small (2.94 ± 11.20°) and not statistically significant (p = 0.097). Neither subgroup showed a statistically significant directional change. Because PI increased in some patients and decreased in others, the direction-independent magnitude was also examined. The median absolute PI difference was 6° (2–13.5°) and differed significantly from zero (p < 0.001). The bidirectional distribution indicates that patient-level variation may be obscured when analysis is limited to the mean directional difference. PI variability was not associated with clinical recovery: ODI and pain scores decreased significantly, but their changes did not correlate with the absolute PI difference.
PI relates the orientation of the sacral endplate to the centers of the femoral heads and provides an individualized measure of sagittal pelvic morphology [9,10]. Because it is geometrically equal to the sum of PT and SS, PI has traditionally been considered a posture-independent anatomical characteristic that remains constant after skeletal maturity [6,9]. This assumption has established PI as a central reference for determining target LL and interpreting PI–LL mismatch [5,6]. The associations of SVA, PT, and PI–LL mismatch with disability and health-related quality of life have further supported PI-based surgical planning [5,7]. Reports of postoperative changes in measured PI, however, have raised a narrower question: not whether pelvic morphology necessarily changes after surgery, but whether radiographically measured PI remains invariant under postoperative conditions [11,12,15].
Previous studies have generally reported only small changes in mean postoperative PI, although patient-level variation has been considerably more heterogeneous [11,12,15]. Lee et al. observed an increase in mean PI after surgery for adult sagittal deformity and reported a larger change among patients without sacropelvic fixation [11]. Wei et al., examining constructs extended to the pelvis using S2-alar-iliac screws, found that PI increased in some patients and decreased in others, demonstrating that postoperative change was not unidirectional [12]. A recent systematic review similarly identified appreciable patient-level PI changes across studies despite differences in methodology and assessment timing [15]. The mean directional change of approximately 3° in the present cohort is consistent with the small angular differences previously reported [11,12,15]. The contribution of the current analysis therefore lies not in demonstrating a larger mean change, but in separately characterizing the absolute patient-level magnitude when opposing changes may cancel each other in the directional mean. Absolute difference nevertheless removes information about direction and converts measurement error into a positive value. It should not be interpreted as a direct measure of true anatomical change.
The sacroiliac joint is a recognized potential source of lower-back and gluteal pain [13]. Radiostereometric studies have shown that small reciprocal movements can occur between the sacrum and ilium despite the joint’s limited range of motion [16]. Finite element models have also demonstrated increased angular motion and articular surface stress across the sacroiliac joint after lumbar fusion [14]. Clinical studies have reported sacroiliac pain and degeneration after lumbar or lumbosacral fusion [17,18]. Altered loading after long-segment correction could therefore influence the relative position of the sacrum within the pelvis and the geometry observed on radiographs. Reciprocal sacroiliac motion is biomechanically consistent with the finding that PI increased in some patients and decreased in others. Because sacroiliac motion was not measured directly, however, this explanation remains hypothetical rather than established.
Long-segment fusion reduces the number of mobile spinal segments and transfers corrective forces and mechanical loads toward distal structures. Biomechanical modeling has demonstrated increased sacroiliac joint motion and stress after lumbar fusion, while clinical studies have reported postoperative sacroiliac joint degeneration [14,18]. The pelvis and sacroiliac complex may consequently participate in postoperative spinopelvic reorganization. In the present cohort, neither directional PI change nor absolute PI difference varied significantly according to whether the construct terminated in the lumbar spine or extended to the pelvis (p = 0.255 and p = 0.336, respectively). The analysis therefore did not demonstrate that distal construct level determined PI variability. The non-pelvic fixation group, however, included only 12 patients, and follow-up differed significantly between the groups. A true group effect may consequently have remained undetected. The absence of a statistically significant difference should not be interpreted as evidence that distal construct level has no effect.
Dubousset’s chain-of-balance and pelvic vertebra concepts describe the pelvis as an active component of global alignment rather than a passive foundation beneath the spine [19]. Compensatory pelvic retroversion during sagittal malalignment and the association of PT with the clinical consequences of deformity support the pelvis’s role in postural adaptation [7]. Studies comparing sitting and standing radiographs have likewise shown that the lumbar spine, pelvis, and femur function as an interdependent system [20]. Bidirectional PI variability in the present cohort is compatible with this adaptive framework. Unlike PT and SS, however, PI has traditionally been regarded as a morphologic parameter. The findings do not establish that surgery altered pelvic morphology. A more cautious interpretation is that sacral position, pelvic orientation, load transfer, patient positioning, and two-dimensional projection may together produce patient-level variability in measured PI.
The absence of an association with functional outcomes suggests that measured PI variability was not a principal determinant of postoperative symptomatic improvement. ODI and back- and leg-pain VAS scores decreased significantly, but the magnitude of these changes was unrelated to the absolute PI difference. Positive sagittal balance has been associated with symptom burden in ASD, and SVA, PT, and PI–LL mismatch have been linked to disability and health-related quality of life [5,7,8]. The lack of parallel change between PI variability and clinical recovery does not diminish the importance of global sagittal alignment. It indicates that variability in PI alone did not explain symptomatic improvement.
The findings do not undermine the role of PI in surgical planning. PI remains a principal morphologic reference for determining target LL and evaluating sagittal proportionality [5,6]. Consequently, if measured PI changes postoperatively, a lordosis target derived exclusively from the preoperative PI could correspond to a different PI–LL relationship on follow-up radiographs [11,12]. Age-adjusted alignment thresholds have shown that operative targets should account for patient age [21]. The Global Alignment and Proportion (GAP) score similarly assesses sagittal alignment as a PI-based proportional construct rather than applying a single universal threshold and was developed to estimate the risk of mechanical complications [22]. In patients with mechanical complications or those undergoing evaluation for revision surgery, PI, LL, PT, SS, and SVA may therefore be more appropriately interpreted together on current standing radiographs rather than by relying exclusively on the preoperative PI value. The absence of an association with clinical recovery does not support using postoperative PI variability as an independent correction target.
4.1. Limitations
This study has several limitations. Its retrospective design introduced the possibility of selection bias, unmeasured confounding, and incomplete standardization of radiographic acquisition. The sample was small, particularly in the non-pelvic fixation group, limiting the power of subgroup comparisons. The predominance of women also restricts generalizability to male patients. Interobserver agreement was good for most PI measurements but only moderate for postoperative measurements in the pelvic fixation group. ICC reflects relative agreement and does not quantify measurement error in degrees or provide the smallest detectable change. The absolute difference is bounded at zero by definition. Testing it against zero therefore does not independently demonstrate true anatomical change and may amplify ordinary measurement variability. Follow-up duration also varied among patients and differed significantly between the groups, introducing an additional potential confounder. Measurements were obtained from two-dimensional standing radiographs and may have been influenced by patient posture, hip and knee position, visibility of the femoral heads, and projection-related variation. In addition, PT and SS were recorded separately from the PI measurements, and their sum did not consistently equal the measured PI. Without a nonsurgical control group, natural measurement variability over a comparable interval could not be estimated. Finally, the absence of three-dimensional imaging and dynamic assessment prevented true morphologic change, altered sacral position, and radiographic measurement variability from being distinguished.
5. Conclusions
Pelvic incidence measured on standing radiographs varied in both increasing and decreasing directions at the patient level after posterior long-segment fusion. The mean directional change was small and not statistically significant, whereas analysis of the absolute difference showed that opposing changes could be obscured in the group mean. The observed magnitude should be interpreted in the context of radiographic measurement variability and cannot be regarded as evidence of true anatomical change. PI variability was not associated with improvements in disability or pain and may represent one component of postoperative spinopelvic adaptation rather than a determinant of symptomatic recovery. PI remains an important morphologic reference, but its current value should be interpreted within the complete spinopelvic profile, particularly during long-term follow-up and revision planning. Prospective studies using standardized radiographic acquisition, three-dimensional imaging, and larger samples are required to clarify the validity and clinical relevance of the observed variability.
References
- Schwab, F.; Dubey, A.; Gamez, L.; El Fegoun, A.B.; Hwang, K.; Pagala, M.; et al. Adult scoliosis: prevalence, SF-36, and nutritional parameters in an elderly volunteer population. Spine 2005, 30(9), 1082–5. [Google Scholar] [CrossRef] [PubMed]
- Aebi, M. The adult scoliosis. European spine journal: official publication of the European Spine Society, the European Spinal Deformity Society, and the European Section of the Cervical Spine Research Society 2005, 14(10), 925–48. [Google Scholar] [CrossRef] [PubMed]
- Glassman, S.D.; Berven, S.; Bridwell, K.; Horton, W.; Dimar, J.R. Correlation of radiographic parameters and clinical symptoms in adult scoliosis. Spine 2005, 30(6), 682–8. [Google Scholar] [CrossRef] [PubMed]
- Jackson, R.P.; McManus, A.C. Radiographic analysis of sagittal plane alignment and balance in standing volunteers and patients with low back pain matched for age, sex, and size. A prospective controlled clinical study. Spine 1994, 19(14), 1611–8. [Google Scholar] [PubMed]
- Schwab, F.J.; Blondel, B.; Bess, S.; Hostin, R.; Shaffrey, C.I.; Smith, J.S.; et al. Radiographical spinopelvic parameters and disability in the setting of adult spinal deformity: a prospective multicenter analysis. Spine 2013, 38(13), E803-12. [Google Scholar] [PubMed]
- Le Huec, J.C.; Thompson, W.; Mohsinaly, Y.; Barrey, C.; Faundez, A. Sagittal balance of the spine. Eur. Spine Journal. 2019, 28(9), 1889–905. [Google Scholar] [CrossRef] [PubMed]
- Lafage, V.; Schwab, F.; Patel, A.; Hawkinson, N.; Farcy, J.P. Pelvic tilt and truncal inclination: two key radiographic parameters in the setting of adults with spinal deformity. Spine 2009, 34(17), E599-606. [Google Scholar] [PubMed]
- Glassman, S.D.; Bridwell, K.; Dimar, J.R.; Horton, W.; Berven, S.; Schwab, F. The impact of positive sagittal balance in adult spinal deformity. Spine 2005, 30(18), 2024–9. [Google Scholar] [CrossRef] [PubMed]
- Legaye, J.; Duval-Beaupère, G.; Hecquet, J.; Marty, C. Pelvic incidence: a fundamental pelvic parameter for three-dimensional regulation of spinal sagittal curves. European spine journal: official publication of the European Spine Society, the European Spinal Deformity Society, and the European Section of the Cervical Spine Research Society 1998, 7(2), 99–103. [Google Scholar] [CrossRef] [PubMed]
- Duval-Beaupère, G.; Schmidt, C.; Cosson, P. A Barycentremetric study of the sagittal shape of spine and pelvis: the conditions required for an economic standing position. Ann. Biomed. Eng. 1992, 20(4), 451–62. [Google Scholar] [CrossRef] [PubMed]
- Lee, J.H.; Na, K.H.; Kim, J.H.; Jeong, H.Y.; Chang, D.G. Is pelvic incidence a constant, as everyone knows? Changes of pelvic incidence in surgically corrected adult sagittal deformity. European spine journal: official publication of the European Spine Society, the European Spinal Deformity Society, and the European Section of the Cervical Spine Research Society 2016, 25(11), 3707–14. [Google Scholar] [CrossRef] [PubMed]
- Wei, C.; Zuckerman, S.L.; Cerpa, M.; Ma, H.; Yang, M.; Yuan, S.; et al. Can pelvic incidence change after spinal deformity correction to the pelvis with S2-alar-iliac screws? European spine journal: official publication of the European Spine Society, the European Spinal Deformity Society, and the European Section of the Cervical Spine Research Society. 2021, 30(9), 2486–94. [Google Scholar] [PubMed]
- Dreyfuss, P.; Dreyer, S.J.; Cole, A.; Mayo, K. Sacroiliac joint pain. J. Am. Acad. Orthop. Surg. 2004, 12(4), 255–65. [Google Scholar] [CrossRef] [PubMed]
- Ivanov, A.A.; Kiapour, A.; Ebraheim, N.A.; Goel, V. Lumbar fusion leads to increases in angular motion and stress across sacroiliac joint: a finite element study. Spine 2009, 34(5), E162-9. [Google Scholar] [PubMed]
- Manzetti, M.; Ruffilli, A.; Viroli, G.; Traversari, M.; Ialuna, M.; Petitoni, C.R.; et al. Can postoperative changes in pelvic incidence occur after adult spine deformity surgery? When do they occur, and what factors influence them? A systematic review with pooled analysis. Spine Deform. 2025, 13(5), 1327–44. [Google Scholar] [CrossRef] [PubMed]
- Sturesson, B.; Uden, A.; Vleeming, A. A radiostereometric analysis of the movements of the sacroiliac joints in the reciprocal straddle position. Spine 2000, 25(2), 214–7. [Google Scholar] [CrossRef] [PubMed]
- Yoshihara, H. Sacroiliac joint pain after lumbar/lumbosacral fusion: current knowledge. European spine journal: official publication of the European Spine Society, the European Spinal Deformity Society, and the European Section of the Cervical Spine Research Society 2012, 21(9), 1788–96. [Google Scholar] [CrossRef] [PubMed]
- Ha, K.Y.; Lee, J.S.; Kim, K.W. Degeneration of sacroiliac joint after instrumented lumbar or lumbosacral fusion: a prospective cohort study over five-year follow-up. Spine 2008, 33(11), 1192–8. [Google Scholar] [PubMed]
- Hasegawa, K.; Dubousset, J.F. Cone of Economy with the Chain of Balance-Historical Perspective and Proof of Concept. Spine Surg. Relat. Res. 2022, 6(4), 337–49. [Google Scholar] [CrossRef] [PubMed]
- Lazennec, J.Y.; Brusson, A.; Rousseau, M.A. Lumbar-pelvic-femoral balance on sitting and standing lateral radiographs. Orthop. Traumatol. Surg. Res. OTSR 2013, 99((1) Suppl, S87–103. [Google Scholar] [CrossRef] [PubMed]
- Lafage, R.; Schwab, F.; Challier, V.; Henry, J.K.; Gum, J.; Smith, J.; et al. Defining Spino-Pelvic Alignment Thresholds: Should Operative Goals in Adult Spinal Deformity Surgery Account for Age? Spine 2016, 41(1), 62–8. [Google Scholar] [PubMed]
- Yilgor, C.; Sogunmez, N.; Boissiere, L.; Yavuz, Y.; Obeid, I.; Kleinstück, F.; et al. Global Alignment and Proportion (GAP) Score: Development and Validation of a New Method of Analyzing Spinopelvic Alignment to Predict Mechanical Complications After Adult Spinal Deformity Surgery. J. Bone Jt. Surg. Am. Vol. 2017, 99(19), 1661–72. [Google Scholar]
Figure 1.
Measurement of spinopelvic parameters on standing full-length spine radiographs: sagittal vertical axis (SVA), thoracic kyphosis (TK), lumbar lordosis (LL), pelvic tilt (PT), sacral slope (SS), and pelvic incidence (PI).
Figure 1.
Measurement of spinopelvic parameters on standing full-length spine radiographs: sagittal vertical axis (SVA), thoracic kyphosis (TK), lumbar lordosis (LL), pelvic tilt (PT), sacral slope (SS), and pelvic incidence (PI).
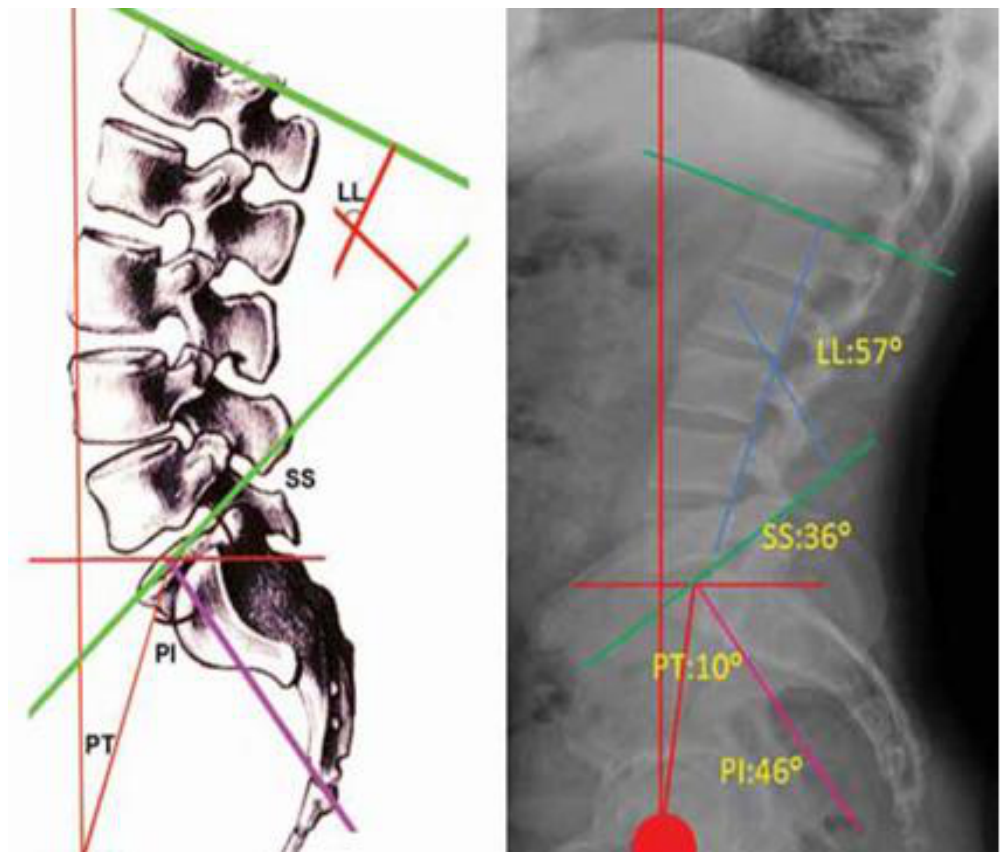
Figure 2.
Absolute difference in pelvic incidence between preoperative and postoperative measurements (n = 42). The plot label L5 denotes the non-pelvic fixation group, which included distal fusion levels L3–L5.
Figure 2.
Absolute difference in pelvic incidence between preoperative and postoperative measurements (n = 42). The plot label L5 denotes the non-pelvic fixation group, which included distal fusion levels L3–L5.
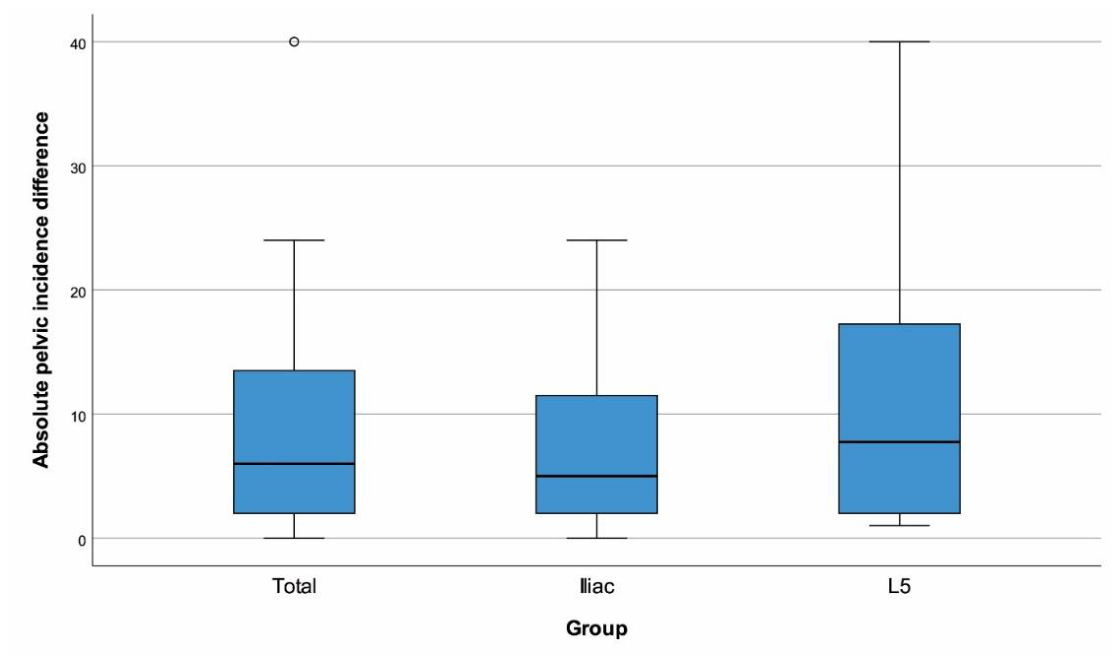
Table 1.
Interobserver agreement for pelvic incidence measurements.
| Group | Preoperative PI, ICC (95% CI) | Postoperative PI, ICC (95% CI) |
| Overall cohort | 0.856 (0.733 - 0.922) | 0.829 (0.684 - 0.908) |
| Pelvic fixation | 0.853 (0.692 - 0.930) | 0.715 (0.405 - 0.864) |
| Non-pelvic fixation | 0.845 (0.490 - 0.955) | 0.857 (0.494 - 0.959) |
CI: confidence interval; ICC: intraclass correlation coefficient; PI: pelvic incidence.
Table 3.
Correlations between the absolute pelvic incidence difference and other variables.
| Variable | Measurement | r | p |
| Age, years | 0.129 | 0.415 | |
| Male sex | 0.204 | 0.194 | |
| Number of fused levels | 0.033 | 0.835 | |
| PJK present | 0.201 | 0.202 | |
| Back-pain VAS | Preoperative | -0.070 | 0.658 |
| Postoperative | 0.062 | 0.698 | |
| Change (1) | 0.184 | 0.244 | |
| Leg-pain VAS | Preoperative | -0.097 | 0.539 |
| Postoperative | -0.014 | 0.930 | |
| Change (1) | 0.080 | 0.616 | |
| ODI (%) | Preoperative | 0.046 | 0.770 |
| Postoperative | 0.254 | 0.105 | |
| Change (1) | 0.175 | 0.268 | |
| Pelvic tilt, ° | Preoperative | 0.065 | 0.685 |
| Postoperative | -0.045 | 0.777 | |
| Change (1) | -0.053 | 0.740 | |
| Sacral slope, ° | Preoperative | -0.185 | 0.240 |
| Postoperative | 0.036 | 0.820 | |
| Change (1) | 0.117 | 0.460 | |
| Lumbar lordosis, ° | Preoperative | 0.030 | 0.848 |
| Postoperative | -0.038 | 0.811 | |
| Change (1) | -0.080 | 0.615 | |
| Thoracic kyphosis, ° | Preoperative | -0.029 | 0.855 |
| Postoperative | 0.007 | 0.966 | |
| Change (1) | -0.033 | 0.838 |
LL: lumbar lordosis; ODI: Oswestry Disability Index; PJK: proximal junctional kyphosis; PT: pelvic tilt; r: Spearman rank correlation coefficient; SS: sacral slope; TK: thoracic kyphosis; VAS: visual analog scale. Change was calculated as the postoperative value minus the preoperative value. Statistically significant p values are shown in bold.
Disclaimer/Publisher’s Note: The statements, opinions and data contained in all publications are solely those of the individual author(s) and contributor(s) and not of MDPI and/or the editor(s). MDPI and/or the editor(s) disclaim responsibility for any injury to people or property resulting from any ideas, methods, instructions or products referred to in the content. |
© 2026 by the authors. Licensee MDPI, Basel, Switzerland. This article is an open access article distributed under the terms and conditions of the Creative Commons Attribution (CC BY) license.
Copyright: This open access article is published under a Creative Commons CC BY 4.0 license, which permit the free download, distribution, and reuse, provided that the author and preprint are cited in any reuse.