

Submitted:
13 November 2026
Posted:
17 November 2026
You are already at the latest version
Abstract
Objective. Common peroneal nerve neuromuscular electrical stimulation (NMES), given after stroke to prevent venous thromboembolism, was associated with increased fNIRS haemoglobin oxygenation in the published primary analysis. We asked how far these optical responses reflect cardiac, vascular and neural-autonomic physiology, using EEG-fNIRS recordings. Approach. In RETRAIN Phase 1 (16 subacute patients, five NMES intensities), eight operationally distinct physiological families were each represented by one measure. Each was tested for stimulation versus baseline, first-block versus later-block differences and Optimal+1 versus Optimal, with exploratory question-wise Benjamini-Hochberg adjustment. Simulations, two open datasets with short channels and a compartment model set what the measures can mean. Sensitivity analyses excluded participants with a history of atrial fibrillation (AF). Main results. Optically inferred cardiac and respiratory predictors accounted for 29% excess predictability of slow global HbO variance relative to shifted controls. Blocks with larger heart rate rises showed larger global HbO and HbT rises but no HbR change (within-participant z +0.30, p = 0.012). EEG-haemodynamic (+0.034 excess coherence), brain-heart (Granger z +0.64) and cardiac-haemodynamic (+0.19) coupling exceeded surrogate nulls but did not track intensity. Mayer-band HbO power was lower in the first block (nominal), and higher at Optimal+1 than at Optimal (question-wise BH q = 0.002). In the 11 participants without AF, pulse amplitude fell by 12% in the first block (p < 0.001) and rose at Optimal+1 (p = 0.005). Pulse-amplitude contrasts differed by documented AF history (three AF-history participants with usable pulse data, between-group p = 0.003), and optical-pulse usability was 61% versus 93%. Significance. Optical haemodynamic signals co-varied with inferred cardiac and respiratory physiology. EEG-fNIRS coherence indicated cross-modal dependence that shared autonomic modulation and common amplitude envelopes can produce. Pulse-derived outcomes differed by documented AF history. Future studies should verify rhythm by simultaneous ECG and prespecify rhythm-aware analyses.
Keywords:
neuromuscular electrical stimulation
; atrial fibrillation
; Mayer waves
; brain-heart coupling
; neurovascular coupling
; functional near-infrared spectroscopy
; electroencephalography
; ischaemic stroke
1. Introduction
Ischaemic stroke disturbs the control systems that match cerebral perfusion to demand. Dynamic cerebral autoregulation and neurovascular coupling are impaired in the affected hemisphere and often bilaterally [1,2]. Autonomic dysfunction is common in the first weeks and predicts outcome: heart-rate variability and baroreflex sensitivity fall and blood pressure becomes labile [3,4,5]. Common peroneal nerve neuromuscular electrical stimulation (NMES, geko™) could influence these systems through peripheral muscle-pump and afferent pathways. It activates the calf muscle pump and doubles femoral venous flow in healthy volunteers [6,7], it is used for venous thromboembolism (VTE) prophylaxis, and it delivers a 1-Hz afferent volley. In RETRAIN Phase 1, NMES was associated with increased fNIRS haemoglobin oxygenation in subacute stroke [8]. That primary outcome concerns the haemodynamic response. This secondary, hypothesis-generating analysis characterises associations among optical haemodynamics, optically inferred cardiac and respiratory signals, and EEG activity. Cardiac output, sympathetic outflow and cerebral blood flow were not independently measured, so their contributions cannot be partitioned anatomically.
Peripheral stimulation could reach each system by a different route, and the routes predict different signatures. Venous return loads cardiopulmonary and arterial baroreceptors, which could lower sympathetic outflow and heart rate. A pump-mediated effect should saturate once motor recruitment is complete. Muscle and cutaneous afferents drive the exercise pressor reflex, which raises blood pressure and sympathetic activity, often with little change in heart rate [9,10]. An afferent or pressor effect should grow with intensity. Higher geko settings lengthen the pulse, and pulse duration can influence axonal recruitment without selectively identifying sensory or motor fibres [11,12], so afferent and mechanical contributions cannot be separated by stimulation level alone. A novel or salient stimulus elicits an orienting response, a brief cardiac deceleration with cutaneous vasoconstriction that habituates with repetition [13,14,15,16]. An orienting effect should be largest at first exposure and then decline.
The systems also act on different end-organs, 1. the ~0.1-Hz baroreflex resonance that produces Mayer waves in arterial pressure and haemodynamic signals [17,18], 2. the sympathetically controlled scalp arterioles [19], 3. the sinoatrial node, 4. the respiratory pump and chemoreflex [20,21], 5. the central autonomic network that drives the heart [22,23], 6. the cortex, whose electrical state co-fluctuates with global haemodynamics through arousal [24,25,26]. We treat these as operationally distinct physiological families, each with one representative measure.
Measuring these families at the bedside raises two challenges. The first is depth. A continuous-wave fNIRS channel at 30-40 mm samples scalp, skull, cerebrospinal fluid and cortex, and the extracerebral share of the signal is large [27]. Heart rate, arterial pressure, respiration and sympathetic vasomotor tone produce slow, spatially widespread haemodynamic fluctuations that are strongest near 0.1 Hz and can mimic or mask task responses [19,28,29]. Short-separation channels (~8 mm) estimate the superficial component [30,31,32], but RETRAIN had no short-separation recordings meeting the quality requirements of the present analysis. EEG-fNIRS coupling is usually estimated in the band where systemic oscillations are strongest [33,34]. Its significance is judged against surrogate nulls whose behaviour on non-stationary physiological signals is rarely checked.
The second problem is cardiac rhythm. Heart rate, pulse amplitude and pulse-interval variability derived from the optical pulse assume a regular rhythm. Atrial fibrillation (AF) is common after ischaemic stroke, and it breaks that assumption. Stroke volume and pulse amplitude vary from beat to beat with the preceding cycle length, and an irregular ventricular response by itself lowers cardiac output and raises sympathetic outflow [35,36]. Heart-rate variability analysis is defined for sinus rhythm [37]. AF has been associated with lower cerebral blood flow and altered neurovascular coupling and autoregulation [38,39].
This paper is organised around physiology (Figure 1). A condensed measurement-validity analysis sets the limits of interpretation for recordings without short channels: Monte Carlo calibration of the coupling statistics, two open datasets with short channels and a four-compartment optical model. We then quantify how the optical signals relate to cardiac physiology, describe the neural-autonomic coupling present during stimulation, and test three questions per family in RETRAIN Phase 1. Does stimulation change the family relative to baseline? Does it adapt between the first and later stimulation blocks? Does one step up in intensity, from the VTE-optimal setting to Optimal+1, add to it? Finally, we examine how a history of AF alters the pulse-derived results. All analyses are exploratory secondary analyses performed after the primary outcome was published.
2. Methods
2.1. Design and Status of the Analyses
This is a secondary, exploratory analysis of RETRAIN Phase 1, supported by simulation and two public datasets. None of the analyses was prespecified in the trial protocol, all were defined after the primary outcome had been analysed [8]. The raw RETRAIN files (SNIRF fNIRS and EEG) were reprocessed for this paper. These analyses, including the question-wise false-discovery-rate adjustments and AF sensitivity analyses, remain exploratory.
2.2. Participants and Stimulation
RETRAIN Phase 1 (NCT06614400) was a prospective single-site study at the Stroke Rehabilitation Unit, Ellesmere Port Hospital, UK (REC 343056). It was conducted under Good Clinical Practice with written informed consent [8]. Inclusion. Adults with CT- or MRI-confirmed ischaemic stroke more than 7 days after onset, receiving geko™ NMES as standard VTE prophylaxis and able to transfer between postures with assistance. Exclusion. Stroke within the previous 7 days, transient ischaemic attack, epilepsy, peripheral nerve disorder, recent lower-limb amputation, other implanted neuromodulation devices and inability to consent.
Eighteen participants were enrolled (Table 1). Their mean age was 75.6 years (SD 12.7), 10 were men and 8 women, median NIHSS was 3 (IQR 1-6), and the median interval from stroke to recording was 27 days (IQR 23-52) in the 17 participants with a valid interval. Six participants had a documented history of AF, rhythm at the time of recording was not documented.
The geko™ T-3 device (Firstkind Ltd., UK) delivered biphasic, charge-balanced 1-Hz pulses bilaterally to the common peroneal nerve at the fibular head. It has 11 settings, from 35 µs at 27 mA to 560 µs at 54 mA. The VTE-optimal setting was titrated to visible ankle dorsiflexion.
Each participant was recorded in three postures: supine, 45° semi-supine and sitting, in an order that varied between participants. In each posture they completed six 5-min blocks in a fixed order: baseline (device off), Optimal, Optimal+1, Optimal−1, Optimal−2 and Optimal−3. Physiological time series were not recorded during intervening rests, file timestamps permit calculation of rest intervals. Within each posture, stimulation always followed baseline and intensity fell after the second block.
2.3. Acquisition and Signals
Recordings used a NIRSport2 continuous-wave system (NIRx, Berlin, Germany) at 760 and 850 nm, with 16 sources and 16 detectors forming 48 channels over bilateral frontal, central and parietal cortex. EEG was recorded with 16 channels at 10-20 positions, including F3 and F4. Obtaining adequate signal quality from short-separation channels over hair-bearing scalp regions required prolonged optode adjustment, which was impractical in the subacute stroke setting. The limited short-separation data acquired were of insufficient quality for reliable analysis and were therefore excluded. fNIRS was sampled at 4.36 Hz. No ECG, photoplethysmography or continuous arterial pressure was recorded with fNIRS or EEG. Blood pressure was measured once per posture.
RETRAIN Phase 1 clinical staff, including a coauthor of the primary report, coordinated study procedures and data acquisition. The EEG and fNIRS acquisition-system clocks were synchronized before recording, and the data streams were subsequently aligned using file-header timestamps, with a residual alignment uncertainty of about ±1 s. In three participants (PIDs 3, 5, and 6), discrepancies in experimental-condition labels were identified between the EEG and fNIRS recordings. All analyses were therefore repeated after excluding these participants (the CLEAR set) to assess the robustness of the findings. Participant and block accounting is given in Figure 2 and Supplementary Table S1. There were 240 synchronised blocks from 16 participants, 210 blocks from 15 participants met the coherence quality criteria, and the optical pulse was usable in 200 blocks.
The signals were defined as follows, Global signal: the median HbO over good long channels, Local HbO: the mean of the ROI channels nearest F3 or F4, Heart rate (HR) and optical pulse amplitude (PA): obtained beat by beat from the cardiac pulse in the optical density, pooled over channels with a cardiac spectral peak, after band-pass filtering to 0.6-1.96 Hz. In open data, optically derived beats matched finger photoplethysmography in 98-99% of beats. In RETRAIN, no locking of the optical pulse to the 1-Hz stimulation was detected, and baseline optical HR correlated moderately with Holter mean HR recorded at a different time (r = 0.46, n = 11) (Supplementary S11). These pulse-derived quantities are surrogates, not ECG measures, Low-frequency pulse-interval variability (LF-PIV): ln inter-beat-interval power at 0.04-0.15 Hz, a pulse-derived surrogate of LF heart-rate variability, Respiratory amplitude: the Hilbert envelope of the 0.15-0.45 Hz component of the channel-mean 850-nm optical density, Transcutaneous CO₂ (tcCO₂): sampled at 1 Hz with two sensors averaged, usable data available for 10 participants and aligned by clock time, EEG predictor: the log₁₀ 1-12 Hz power envelope at F3 or F4, after masking railed or noisy 10-s segments and notch-filtering the fNIRS frame-rate crosstalk.
2.4. Physiological Families and Representative Measures
A family was treated as distinct when it differed from every other family in at least two of four respects, end-organ: sinoatrial node, resistance vessels, scalp skin, respiratory pump or cerebral vessels, efferent pathway: cardiac vagal or sympathetic, vascular sympathetic, chemoreflex or local neurovascular, time scale: cardiac, respiratory, Mayer band or minutes, class of statistic: level, auto-spectral power, coherence or directed prediction.
The families are therefore operationally distinct domains. Baroreflex oscillation, sympathetic vasomotor tone and cardiac-haemodynamic coupling, for example, share efferent pathways. A measure that shared all four respects with a family’s representative was treated as corroborating evidence for that family, not as a separate test. Eight families resulted (Table 2). Representative measures were chosen using a consistent retrospective estimator-based rule: the estimator that the analysis already used for that construct, preferring surrogate-corrected or directed statistics to raw ones. Families are expressed as the change from the baseline block of the same posture. 1. Mayer-band optical haemodynamic oscillation (candidate baroreflex-related physiology). Mayer waves are oscillations of arterial pressure near 0.1 Hz, coupled to synchronous oscillations of sympathetic vasomotor outflow and best explained by baroreflex resonance [17]. In fNIRS, the Mayer band is where the signal couples most strongly to arterial pressure and heart rate, with a mixed extracerebral and cerebral origin [18,40]. Representative: ln HbO power at 0.07-0.13 Hz (60-s Hann windows, 50% overlap, motion-free and pulse-valid windows). LF-PIV indexes baroreflex modulation of cardiac outflow rather than cardiac sympathetic tone [41], as the cardiac arm of the same loop, it is corroborating. Mayer-wave power during orthostasis depends on intact vascular-sympathetic baroreflex function [42], so all contrasts are posture-matched. 2. Optical vascular pulsatility (candidate superficial vasomotor influence). The scalp arterial bed is under strong sympathetic vasoconstrictor control, and sympathetic constriction lowers pulsatile volume [19,43]. Representative: optical pulse amplitude, as 100 × the change in ln mean pulse amplitude (~ % change). 3. Cardiac chronotropic tone. Representative: mean heart rate. Low-intensity NMES raises blood pressure and muscle sympathetic activity without detectable change in heart rate [10], and orienting responses produce brief decelerations that habituate [14], so small effects of either sign are expected. 4. Cardiac-haemodynamic coupling. Association between slow heart-rate fluctuations and optical haemodynamics, causal transmission and tissue origin are not identified [28,44]. Coherence is invariant to the mean and scale of either series, so it is separate from heart-rate level. Representative: HR-HbO coherence at 0.07-0.13 Hz above the mean of 99 circular-shift surrogates. Raw coherence and the HR-global HbO excess coherence (0.02-0.10 Hz) are corroborating. 5. Respiratory-haemodynamic coupling. Breathing modulates venous return and blood volume, and slow fluctuations of breathing depth produce characteristic haemodynamic responses [21]. Representative: the variance of slow (0.01-0.15 Hz) global HbO explained by the lagged respiratory envelope (−6 to +12 s), above 49 circularly shifted controls. 6. Arterial CO₂. CO₂ is a strong cerebral vasoactive agent with a much weaker effect on the external carotid circulation [45], and hyperventilation-induced hypocapnia lowers prefrontal HbO [20]. Representative: block-mean tcCO₂. This family is the least powered (n ≤ 10). 7. EEG-leading HR predictive asymmetry. The EEG-to-HR timing association is compatible with, but does not establish, central autonomic drive [22,23]. Representative: net time-reversed Granger causality (TRGC) from the EEG envelope to HR, as a block z against 199 circular shifts. EEG-HR excess coherence is corroborating. 8. EEG-haemodynamic coupling. Co-fluctuation of cortical electrical state with haemodynamics. In this band it mixes focal neurovascular coupling with arousal-related global co-fluctuation [24,26]. Representative: EEG-local HbO excess coherence in the reference specification (Section 2.6). EEG-global coherence and EEG to HbO TRGC are corroborating.
2.5. Contrasts and Sensitivity Analyses
Each family was tested for three questions. Participants were the unit, and postures were averaged within participant. 1. Stimulation versus baseline: the mean over the five stimulation blocks of each block minus the same-posture baseline block. 2. First-block versus later-block contrast: the Optimal block, always the first stimulation block in a posture, minus the mean of the later stimulation blocks. Orienting and defence responses can differ by exposure, but fixed-order and session effects cannot be excluded [15,16]. 3. Dose: Optimal+1 minus Optimal, in postures in which Optimal+1 raised the setting, each step lengthens the pulse by a factor of about 1.4. Group inference used exact sign-flip tests of participant means and 95% percentile bootstrap confidence intervals. Benjamini-Hochberg false-discovery-rate control [46] was applied across the eight families within each question (q).
The following sensitivity analyses were not adjusted, an elapsed-time “bump” contrast for dose: Optimal+1 minus the value interpolated between Optimal and Optimal−1 at the midpoint time of Optimal+1, which cancels a drift linear in elapsed time, exclusion of postures in which a contrasted block followed an unrecorded gap longer than 10 min, the CLEAR set, the corroborating measures, a visit-order check comparing the Optimal block in the first posture recorded on a visit with later postures.
Within-participant correlations of block-level changes between family representatives were computed to check that the families were not redundant. Effect sizes with confidence intervals are reported for every cell, in line with recommendations for exploratory analyses [47,48].
Cardiac-haemodynamic association. For each block, the within-block change in optical HR was computed as the mean of the last 60 s minus the mean of the first 20 s. The same windows gave the within-block change in global HbO, HbR and HbT. Within each participant, both changes were demeaned within posture and correlated across blocks, and the Fisher-transformed correlations were tested across participants. This association asks whether blocks in which heart rate drifted upward were also blocks in which global haemoglobin rose. It concerns block-to-block covariation, not the mean stimulation effect.
Atrial fibrillation. Every family contrast, the coupling levels and the cardiac-haemodynamic association were repeated without the participants with a documented history of AF. For each family contrast, the difference between participants without and with AF was tested by exact permutation over all splits of the pooled participants. Usability of the optical pulse was compared between the groups. Rhythm during the recordings was not documented, so “AF” means a history of AF.
2.6. Coupling Statistics and Their Calibration
Excess coherence. Magnitude-squared coherence between the EEG envelope and each haemodynamic signal was estimated by Welch’s method (Hann windows, 50% overlap) and averaged over the band. It was expressed as excess coherence: observed coherence minus the mean over 99 surrogates of the haemodynamic signal. Because the EEG predictor is a power envelope, this coherence quantifies slow co-fluctuation of EEG amplitude with haemodynamics. The sensitivity grid crossed three factors, surrogate: circular shift of at least 30 s, or phase randomisation, window: 60 s or 100 s, band: 0.02-0.10 Hz or 0.07-0.13 Hz [34].
The reference specification (0.02-0.10 Hz, 60 s, shift) is used for in-text values. Both nulls reject when phase-independent signals share a slow amplitude envelope (Section 3.1). An envelope-normalised estimator therefore divided each band-limited signal by its 60-s running root-mean-square before coherence was computed, with a 120-s window as sensitivity. Envelope co-modulation is itself a dependence that a common neural-autonomic state would produce, so the conventional and normalised estimates are reported as complementary. All 60-s analyses were repeated on each ROI’s trimmed clean segment.
Global-signal regression (GSR). Three variants were applied to local HbO after band-pass filtering: zero-lag full GSR, zero-lag leave-ROI-out (LOO) GSR and lagged LOO GSR (lags −5 to +5 s). The paired GSR contrast was the participant-mean difference in EEG-local excess coherence without and with GSR, computed on identical channels, epochs, bands, windows and nulls. Conditioned coherence asked whether EEG-global coupling survives adjustment for lagged HR and PA. Its calibrated null shifted the raw EEG and then residualised it.
Predictive temporal asymmetry. Net TRGC [49,50] was computed for four pairs: EEG to HR, EEG to PA, EEG to local HbO, and EEG to local HbO conditioned on HR and PA. Signals were resampled to 1 Hz, with a 6-s model order and cause lags starting at 2 s to reduce sensitivity to the alignment uncertainty. A positive value means that the past of the EEG envelope predicts the haemodynamic signal better than the reverse, beyond what time-reversal-symmetric dependence explains. It is compatible with a common driver that reaches the EEG earlier and is not evidence of causation. Holm correction was applied across the four pairs.
Simulation. A Monte Carlo study evaluated the participant-level excess-coherence test under the two nulls and two windows, for four scenarios, 1. independent 1/f signals, 2. an independent Mayer-like rhythm in each signal, 3. phase-independent signals sharing a slow amplitude envelope, 4. graded true coupling.
Calibration cells used 60 simulated cohorts (40 for the conditioned estimators) and grid cells 30, with 10-25 participants at the RETRAIN sampling rate and block length, with and without missing data (Supplementary S4 and S6). A generative route model compared naive and calibrated conditioned estimators.
2.7. Interpreting Long-Separation fNIRS Signals: Evidence from Open Datasets and Compartment Modeling
Two public datasets with short channels served as the reference for recordings without them, 1. MULPA [51]: 22 participants (rest, finger tapping, emotion, 12.6 Hz) with finger photoplethysmography, respiration and skin conductance. 2. OpenNeuro ds005776 [52,53]: 11 participants with electrical (5-s, 5-Hz thumb stimulation at pain ratings 3/10 and 7/10), thermal, tapping and imagery conditions (50 Hz).
For each dataset, we estimated three things, 1. the share of slow long-channel global variance explained by the short-channel global, 2. the effect of short-separation regression (SSR) versus GSR on task responses, 3. three markers that distinguish the scalp-weighted signal from the SSR residual: HbO-HbR correlation, short-to-long transfer phase and cardiac pulse timing (Supplementary S2, S7 and S12).
A wavelength-level four-compartment forward model (scalp, dura, pial vessels, cortex, 600 draws per scenario) asked which compartment combinations reproduce the six observed markers (Supplementary S8). In RETRAIN, the systemic contribution was quantified as the variance of slow global HbO explained by optical HR, PA and respiration above shifted controls (Supplementary S8).
2.8. Reproducibility
Every figure and table, main and supplementary, can be regenerated by one MATLAB script from the de-identified derived data. This includes the AF sensitivity analyses, which read a per-participant AF-history flag. The restricted clinical spreadsheets behind Table 1 are excluded from the public release.
3. Results
3.1. Measurement Validity and the Systemic Contribution
Surrogate nulls are calibrated for independent signals. With independent 1/f signals, both nulls and both windows rejected in 3.3% of 60 simulated cohorts. With an independent Mayer-like rhythm in each signal, they rejected in 1.7-5.0% (Figure 3(a)). When two signals with independent phases were multiplied by the same slow envelope, every estimator rejected in 100% of cohorts. The shared envelope alone produced excess coherence of +0.080 to +0.132, and larger cohorts made rejection more certain. Envelope normalisation restored rejection rates of 0-6.7% in this scenario. At the size of the normalised RETRAIN estimate, it retained 50%, 70% and 90% power for 10, 15 and 25 participants (Figure 3(b)). Gaps placed at the same times in both signals and interpolated generated rejection without coupling, whereas independently placed gaps attenuated true coupling. Only the calibrated conditioned estimator was unbiased (7.5% rejection under the null, against 45% for the naive estimator) (Supplementary S4 and S6).
Short-channel measurements strongly predict the long-channel global signal. In MULPA, the short-channel global explained a median 82-89% of slow (0.02-0.10 Hz) long-channel global variance at zero lag and 89-92% with ±5-s lags, in ds005776, it explained 78-86%. GSR reversed the sign of 29% of tapping responses relative to SSR and increased the share classified as negative from 18% to 37%. In ds005776, electrical stimuli lowered HbO in every uncorrected region, with the largest falls in frontal short channels. After SSR, the contralateral sensorimotor core showed a localised response that the probe-wide average concealed (3/10 stimuli: HbO +0.034 µM, p = 0.027, HbR −0.042 µM, p < 0.001) (Supplementary Table S3, Figure S2). Trials with a larger scalp decrease had a larger fall in pulse amplitude (ρ = +0.28, p = 0.029) and a larger cardiac deceleration (ρ = +0.30, p = 0.024), an orienting-type optical signature.
The SSR residual has distinct markers. Three markers separated the scalp signal from the residual (Supplementary Table S2, Figure S1): 1. HbO and HbR were positively correlated in the scalp signal (MULPA +0.16 to +0.20) and anticorrelated in the residual (−0.39 to −0.43), 2. the long-channel signal lagged the scalp by about 0.3 s at 0.1 Hz, 3. the long-channel pulse peaked 22-70 ms earlier.
In the four-compartment model, scalp-only and dura-like scenarios kept HbO and HbR positively correlated (median r +0.46 and +0.50) and rarely reproduced the residual markers. Mixtures with pial-like and cortical components reproduced them more often. All six markers were reproduced in 13 of 600 draws with all four compartments, and in at most 1 of 600 otherwise. (Supplementary S8, Table S10, Figure S3).
In RETRAIN, slow global haemodynamics covaries with optically inferred physiological proxies. RETRAIN global and local HbO and HbR were positively correlated, like the short-channel signals of the open datasets: +0.34 and +0.47 at 0.02-0.10 Hz, and +0.24 for the whole-recording global at 0.01-0.15 Hz (Supplementary Table S9). Optical HR, PA and respiratory amplitude explained 0.29 (95% CI 0.26 to 0.32) of slow global HbO variance above shifted controls, 0.29 of HbT and 0.20 of HbR, with each regressor contributing on its own. tcCO₂ was unrelated to global haemoglobin change (|z| ≤ 0.02, p ≥ 0.81) (Supplementary Table S9). Families 1, 2, 4 and 8 are therefore interpreted as dominated by systemic contributions whose superficial and intracranial shares cannot be separated here.
3.2. Cardiac-Haemodynamic Relationships
Optically derived HR was strongly coupled to global HbO across blocks: HR-global excess coherence was +0.19 (95% CI 0.13 to 0.25, p < 0.001, n = 16) (Table 3).
The within-block analysis gave the following results (Table 3): HbO and HbT. Within participants, blocks in which heart rate rose more over the block also showed a larger rise in global HbO (Fisher z +0.30, 0.12 to 0.49, p = 0.012, n = 12) and HbT (+0.25, 0.09 to 0.41, p = 0.015). HbR. There was no association with global HbR (−0.08, −0.31 to +0.16, p = 0.52). Stimulation blocks only. The HbO association was at least as strong (+0.39, 0.13 to 0.71, p = 0.018, n = 11). Without AF. It was similar in the participants without AF (+0.27, p = 0.047, n = 10).

Table 3.
Coupling present during the recordings and the within-participant cardiac-haemodynamic association, with and without the participants with a history of atrial fibrillation (participant means, 95% bootstrap CI, exact sign-flip p, unadjusted).
Table 3.
Coupling present during the recordings and the within-participant cardiac-haemodynamic association, with and without the participants with a history of atrial fibrillation (participant means, 95% bootstrap CI, exact sign-flip p, unadjusted).
| Measure | Definition | All participants | No AF history |
| EEG-local HbO excess coherence | all blocks, 0.02-0.10 Hz, 60 s, circular-shift null (Table 4 reference) | +0.034 (+0.020 to +0.048), p < 0.001, n = 15 | +0.031 (+0.015 to +0.049), p 0.003, n = 11 |
| EEG-global HbO excess coherence | as above, global signal | +0.032 (+0.019 to +0.044), p < 0.001, n = 15 | +0.039 (+0.026 to +0.051), p 0.002, n = 11 |
| HR-global HbO excess coherence | all blocks, optical heart rate and global HbO, 0.02-0.10 Hz | +0.189 (+0.133 to +0.254), p < 0.001, n = 16 | +0.153 (+0.104 to +0.204), p < 0.001, n = 11 |
| EEG to HR net TRGC (z) | stimulation blocks (Table 5) | +0.64 (+0.34 to +0.94), p 0.002, n = 15 | +0.83 (+0.51 to +1.14), p 0.003, n = 11 |
| EEG to local HbO net TRGC (z) | stimulation blocks (Table 5) | +0.38 (+0.17 to +0.57), p 0.005, n = 15 | +0.30 (+0.03 to +0.53), p 0.056, n = 11 |
| EEG to local HbO net TRGC given HR, PA (z) | stimulation blocks (Table 5) | +0.35 (+0.06 to +0.61), p 0.033, n = 15 | +0.36 (−0.04 to +0.71), p 0.10, n = 11 |
| HR change vs global HbO change (Fisher z) | within participant, posture-demeaned, all blocks, change = last 60 s − first 20 s of the block | +0.30 (+0.12 to +0.49), p 0.012, n = 12 | +0.27 (+0.07 to +0.50), p 0.047, n = 10 |
| HR change vs global HbO change (Fisher z) | within participant, posture-demeaned, stimulation blocks, change = last 60 s − first 20 s of the block | +0.39 (+0.13 to +0.71), p 0.018, n = 11 | +0.36 (+0.06 to +0.76), p 0.070, n = 9 |
| HR change vs global HbT change (Fisher z) | within participant, posture-demeaned, all blocks, change = last 60 s − first 20 s of the block | +0.25 (+0.09 to +0.41), p 0.015, n = 12 | +0.24 (+0.06 to +0.43), p 0.051, n = 10 |
| HR change vs global HbR change (Fisher z) | within participant, posture-demeaned, all blocks, change = last 60 s − first 20 s of the block | −0.08 (−0.31 to +0.16), p 0.52, n = 12 | −0.02 (−0.24 to +0.24), p 0.89, n = 10 |
Table 4.
RETRAIN Phase 1 sensitivity grid (participant means, 95% bootstrap CI, exact sign-flip p).
| Quantity | n | Reference (0.02-0.10 Hz, 60 s, shift) | Range over specifications | p range |
| EEG-local HbO, absolute | 15 | +0.034 [0.020, 0.048] | +0.030 to +0.041 | < 0.001 |
| EEG-global (leave-ROI-out), absolute | 15 | +0.032 [0.019, 0.044] | +0.024 to +0.039 | ≤ 0.004 |
| EEG-local after zero-lag full GSR | 15 | +0.039 [0.027, 0.052] | +0.029 to +0.039 | ≤ 0.001 |
| EEG-local after zero-lag LOO GSR | 15 | +0.038 [0.025, 0.052] | +0.033 to +0.041 | < 0.001 |
| EEG-local after lagged LOO GSR | 15 | +0.038 [0.029, 0.049] | +0.025 to +0.038 | ≤ 0.001 |
| Paired GSR contrast D, full / LOO / lagged | 15 | −0.006 / −0.005 / −0.004 | −0.006 to +0.011 | ≥ 0.063 |
| Stimulation − baseline, EEG-local | 14 | +0.014 [−0.009, 0.039] | −0.017 to +0.014 | ≥ 0.28 |
| Stimulation − baseline, EEG-local, CLEAR | 12 | +0.022 [−0.001, 0.046] | −0.025 to +0.022 | ≥ 0.11 |
| Stimulation − baseline, EEG-global | 14 | −0.010 [−0.044, 0.021] | −0.016 to +0.013 | ≥ 0.36 |
| EEG-local HbO, envelope-normalised (60 s, 4 specifications) | 15 | +0.017 [0.006, 0.028] | +0.013 to +0.017 | 0.010 to 0.057 |
| EEG-global (LOO), envelope-normalised (60 s, 4 specifications) | 15 | +0.012 [0.005, 0.019] | +0.011 to +0.015 | ≤ 0.014 |
| Paired GSR contrast D (full / LOO / lagged), envelope-normalised | 15 | −0.003 / −0.005 / +0.002 | −0.005 to +0.004 | ≥ 0.11 |
Table 5.
Net time-reversed Granger causality, RETRAIN Phase 1 (Holm across the four pairs).
| Direction | Stimulation blocks | Baseline blocks | Stimulation − baseline (posture-matched) |
| EEG to HR | +0.64 [0.34, 0.94], n = 15, p = 0.002, Holm 0.008 | +0.29 [−0.08, 0.65], n = 13, p = 0.17 | +0.53 [0.15, 0.95], n = 13, p = 0.031, Holm 0.12 |
| EEG to local HbO | +0.38 [0.17, 0.57], n = 15, p = 0.005, Holm 0.014 | −0.07 [−0.49, 0.39], n = 14, p = 0.77 | +0.45 [−0.14, 1.03], n = 14, p = 0.17 |
| EEG to local HbO given HR, PA | +0.35 [0.06, 0.61], n = 15, p = 0.033, Holm 0.065 | +0.08 [−0.49, 0.61], n = 13, p = 0.80 | +0.33 [−0.48, 1.10], n = 13, p = 0.44 |
| EEG to PA | +0.21 [−0.08, 0.53], n = 15, p = 0.23 | +1.01 [0.06, 2.19], n = 13, p = 0.090 | −0.61 [−1.94, 0.48], n = 13, p = 0.43 |
3.3. EEG-Heart and EEG-Haemodynamic Coupling
EEG-haemodynamic coupling. EEG-local HbO excess coherence was +0.034 (95% CI 0.020 to 0.048, p < 0.001) and EEG-global coupling +0.032 (0.019 to 0.044, p < 0.001). Coupling was positive in all eight specifications (EEG-local +0.030 to +0.041, all p ≤ 0.001, EEG-global +0.024 to +0.039, all p ≤ 0.004) and in the CLEAR set (Table 4, Figure 4, Supplementary Table S6). Envelope normalisation reduced EEG-local coupling to +0.017 (p = 0.014) and EEG-global coupling to +0.012 (p = 0.007), with intermediate values for a 120-s window (+0.017 to +0.022, all p ≤ 0.010). Trimming to clean segments changed little (EEG-local +0.029, p < 0.001). Cardiac conditioning. EEG-global coupling persisted after adjustment for lagged HR and PA with the calibrated null (+0.017, 0.010 to 0.023, p < 0.001).
GSR did not detectably reduce EEG-haemodynamic coupling. The negative paired contrasts mean that coupling was, if anything, slightly higher after GSR (Section 4.4). The paired GSR contrast was −0.006 (−0.019 to 0.008, p = 0.43) for zero-lag full GSR, −0.005 (p = 0.46) for zero-lag LOO GSR and −0.004 (p = 0.53) for lagged GSR, with |D| ≤ 0.011 and p ≥ 0.063 across specifications (Table 4). Lagged GSR reduced Mayer-band coupling in 2 of 24 trimmed tests.
EEG-leading heart-rate predictive asymmetry. In stimulation blocks, the past of the EEG envelope predicted the haemodynamic signals better than the reverse (Table 5, Figure 5). HR: mean block z +0.64 (95% CI 0.34 to 0.94, p = 0.002, Holm 0.008). Local HbO: +0.38 (p = 0.005, Holm 0.014). Local HbO after conditioning on HR and PA: the asymmetry persisted marginally (+0.35, p = 0.033, Holm 0.065).
In baseline blocks the asymmetries were smaller (EEG to HR +0.29, p = 0.17). These are properties of the recordings during stimulation, stimulation versus baseline is a question family (Section 3.4).
3.4. First-Exposure Vasomotor Dynamics and the Stimulation Sequence
Within participants, block-level changes in the eight representatives were weakly to moderately correlated. The largest correlation was between Mayer-band power and heart rate (Spearman r = 0.45), followed by Mayer-band power and pulse amplitude (0.44) and HR-HbO coherence and tcCO₂ (0.44, few blocks). All other pairs had |r| ≤ 0.24, and LF-PIV correlated with Mayer-band power at r = 0.24. The moderate vascular-cardiac correlations are consistent with shared mechanisms between operationally distinct families. The family tests are summarised in Table 6 and Figure 6, and the block-by-block profiles in Figure 7.
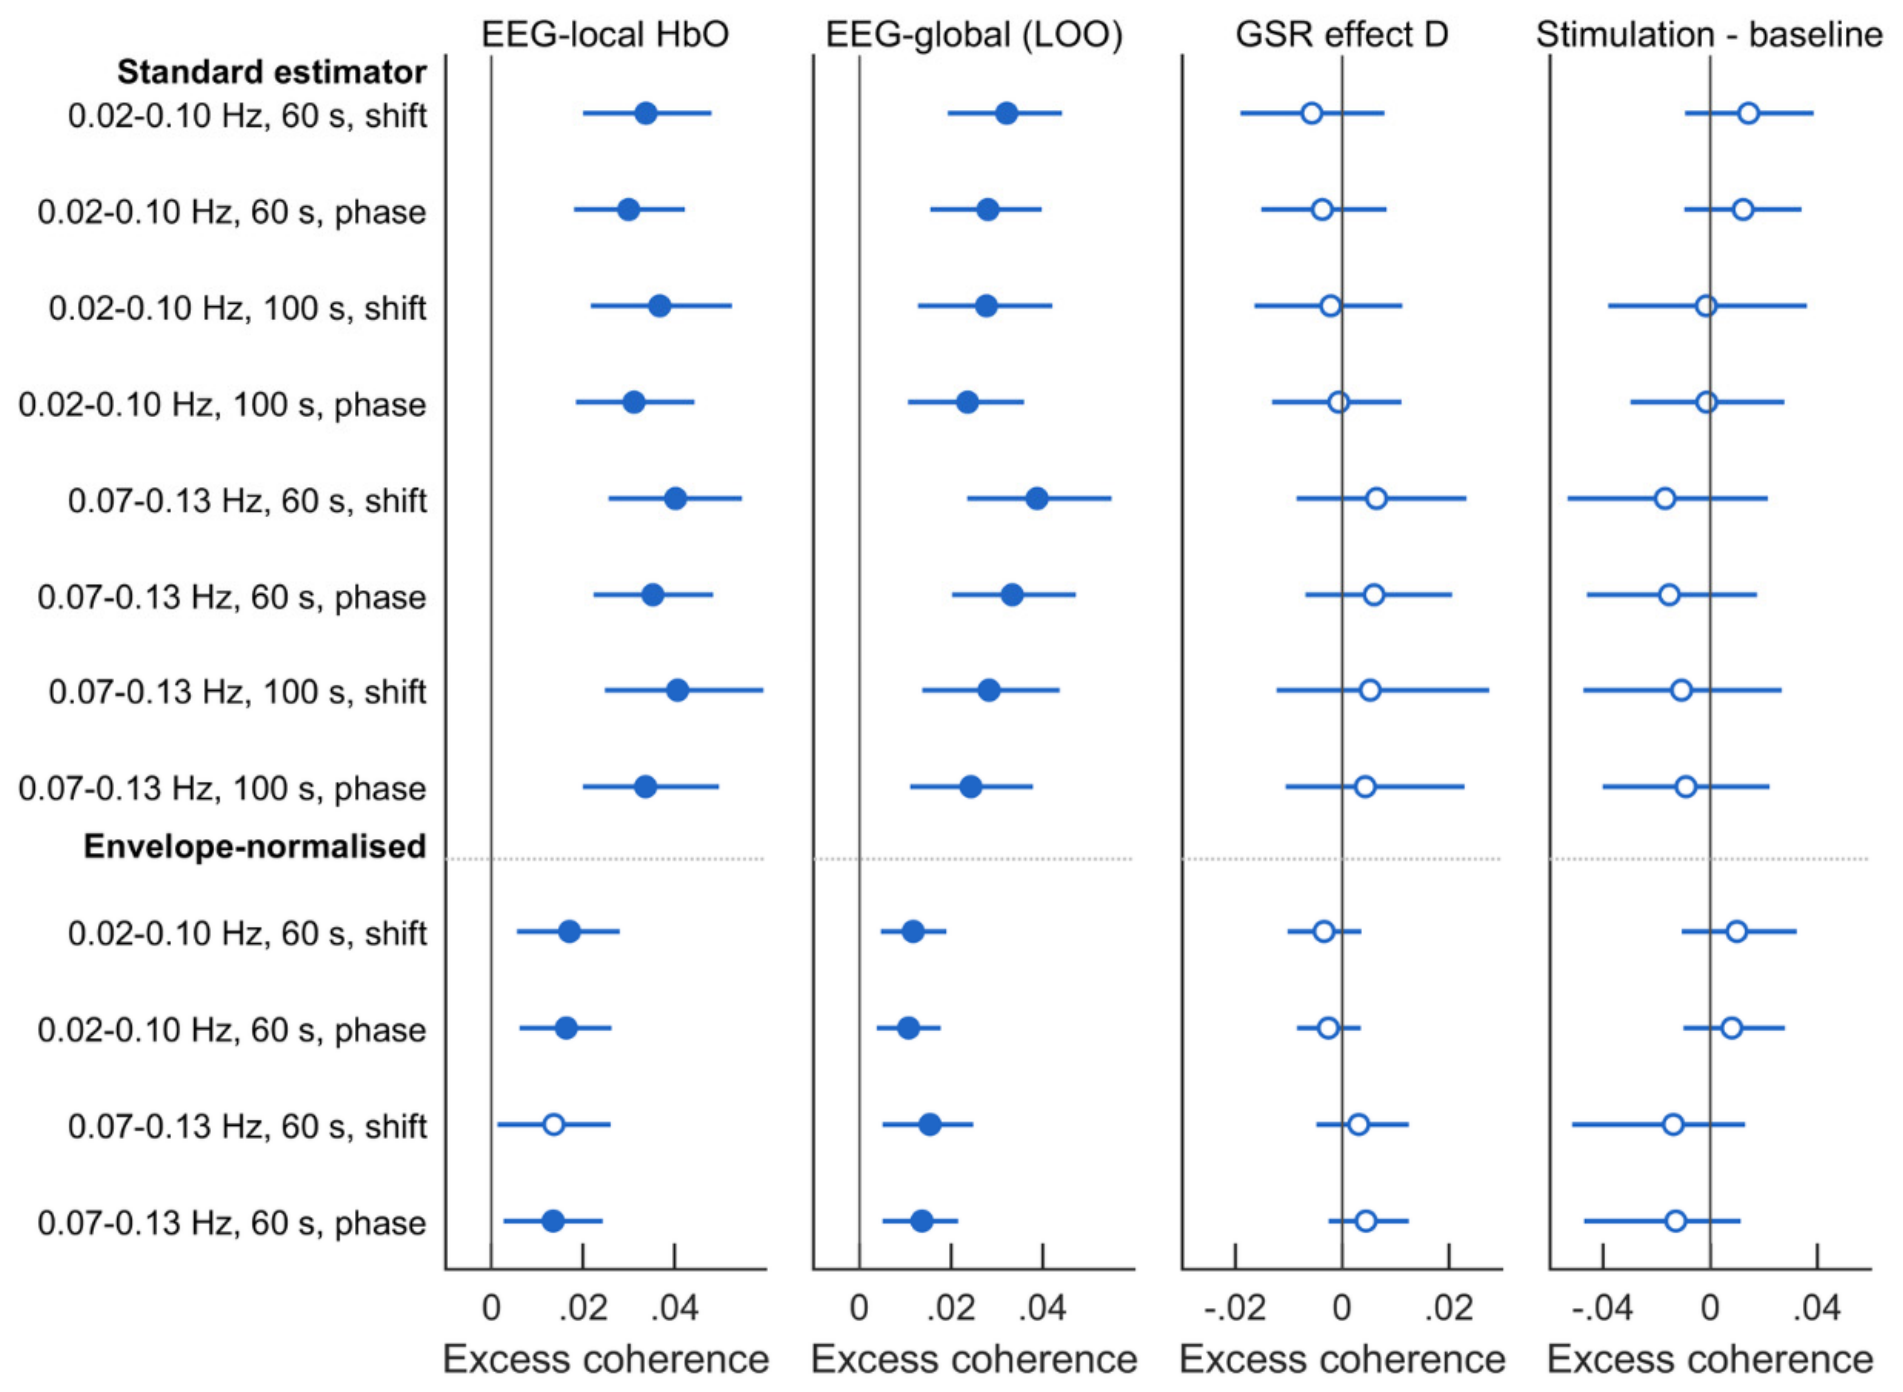
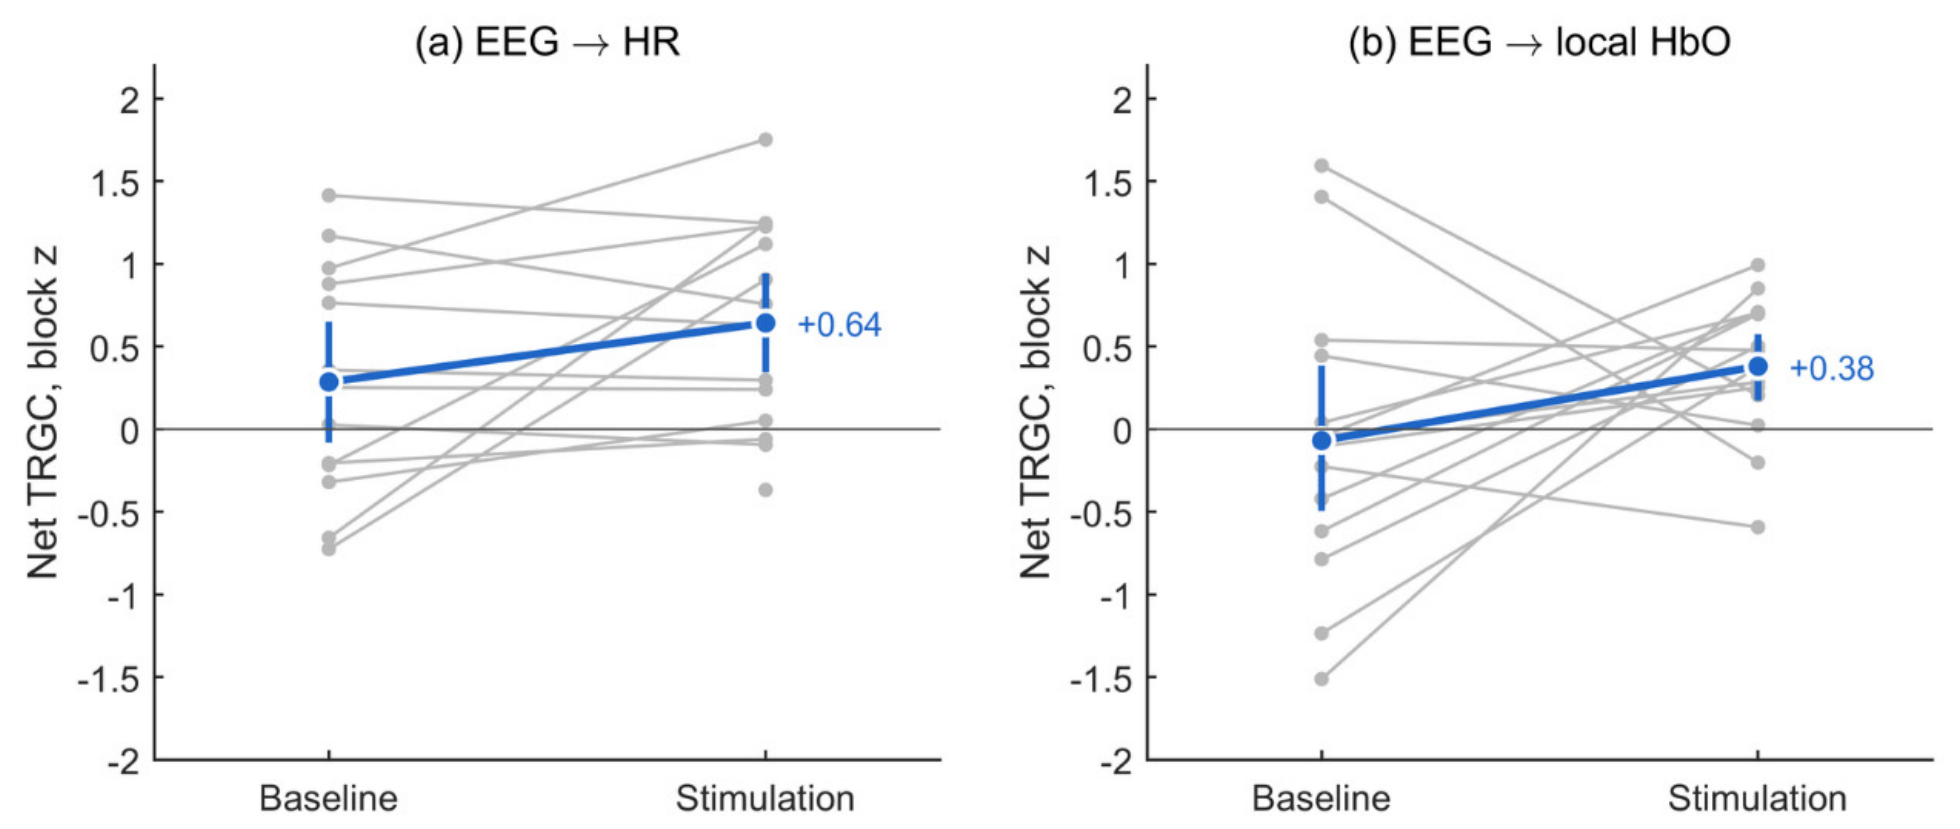
Figure 4.
EEG-haemodynamic coupling in RETRAIN Phase 1 across the sensitivity grid. Each row is one specification (band, Welch window, surrogate null), columns show EEG-local and EEG-global excess coherence and the paired GSR contrast. Participant means with 95% bootstrap CI.
Figure 4.
EEG-haemodynamic coupling in RETRAIN Phase 1 across the sensitivity grid. Each row is one specification (band, Welch window, surrogate null), columns show EEG-local and EEG-global excess coherence and the paired GSR contrast. Participant means with 95% bootstrap CI.
Figure 5.
Predictive temporal asymmetry (net time-reversed Granger causality) in RETRAIN Phase 1. Each grey line joins one participant’s mean block z in baseline and stimulation blocks, positive values mean that the EEG envelope’s past predicts the haemodynamic signal better than the reverse.
Figure 5.
Predictive temporal asymmetry (net time-reversed Granger causality) in RETRAIN Phase 1. Each grey line joins one participant’s mean block z in baseline and stimulation blocks, positive values mean that the EEG envelope’s past predicts the haemodynamic signal better than the reverse.
Stimulation versus baseline. No family changed detectably when the five stimulation blocks were averaged against baseline (all q ≥ 0.25). EEG-leading HR asymmetry rose nominally (EEG to HR z +0.53, 95% CI 0.15 to 0.95, p = 0.031, q = 0.25), more clearly in postures without long gaps (p = 0.009) than in the CLEAR set (p = 0.077). tcCO₂ was nominally lower during stimulation (−0.73 mmHg, p = 0.12, n = 9).
First-exposure adaptation. Two vascular families differed nominally between the first and later stimulation blocks (Supplementary Table S12): Mayer-band HbO power was lower in the Optimal block than in the later blocks (−0.49 ln units, −0.81 to −0.14, p = 0.015, q = 0.090). Pulse amplitude was lower (−7.7%, −13.1 to −2.0, p = 0.023, q = 0.090). Robustness. Both held in postures without long gaps (p = 0.012 and 0.007) and kept their size in the CLEAR set (p = 0.042 and 0.052). The corroborating LF-PIV showed the same direction (−0.28, p = 0.073). Other families. HR-HbO coherence tended to be higher in the first block (+0.043, p = 0.082, q = 0.22). Heart rate, respiratory coupling, tcCO₂, EEG-leading HR asymmetry and EEG-haemodynamic coupling did not differ (all p ≥ 0.57).
The first-block pattern did not depend on whether the posture was the first of the visit. For Mayer-band power, first-of-visit minus later Optimal blocks was +0.60 (p = 0.10), opposite in direction to habituation across the visit, for pulse amplitude it was +1.0% (p = 0.84).
Optimal+1 versus Optimal. Mayer-band HbO power was higher at Optimal+1 than at Optimal (+0.51 ln units, +0.30 to +0.74, p < 0.001, q = 0.002). The difference was robust to long gaps (p < 0.001) and the CLEAR set (p = 0.001), and was corroborated by LF-PIV (+0.50, p = 0.013). The drift-cancelling bump was smaller (+0.24, p = 0.044). The Optimal block was itself low, and Optimal+1 did not exceed the later, lower settings (Figure 7(a)). No other family changed (all p ≥ 0.086).
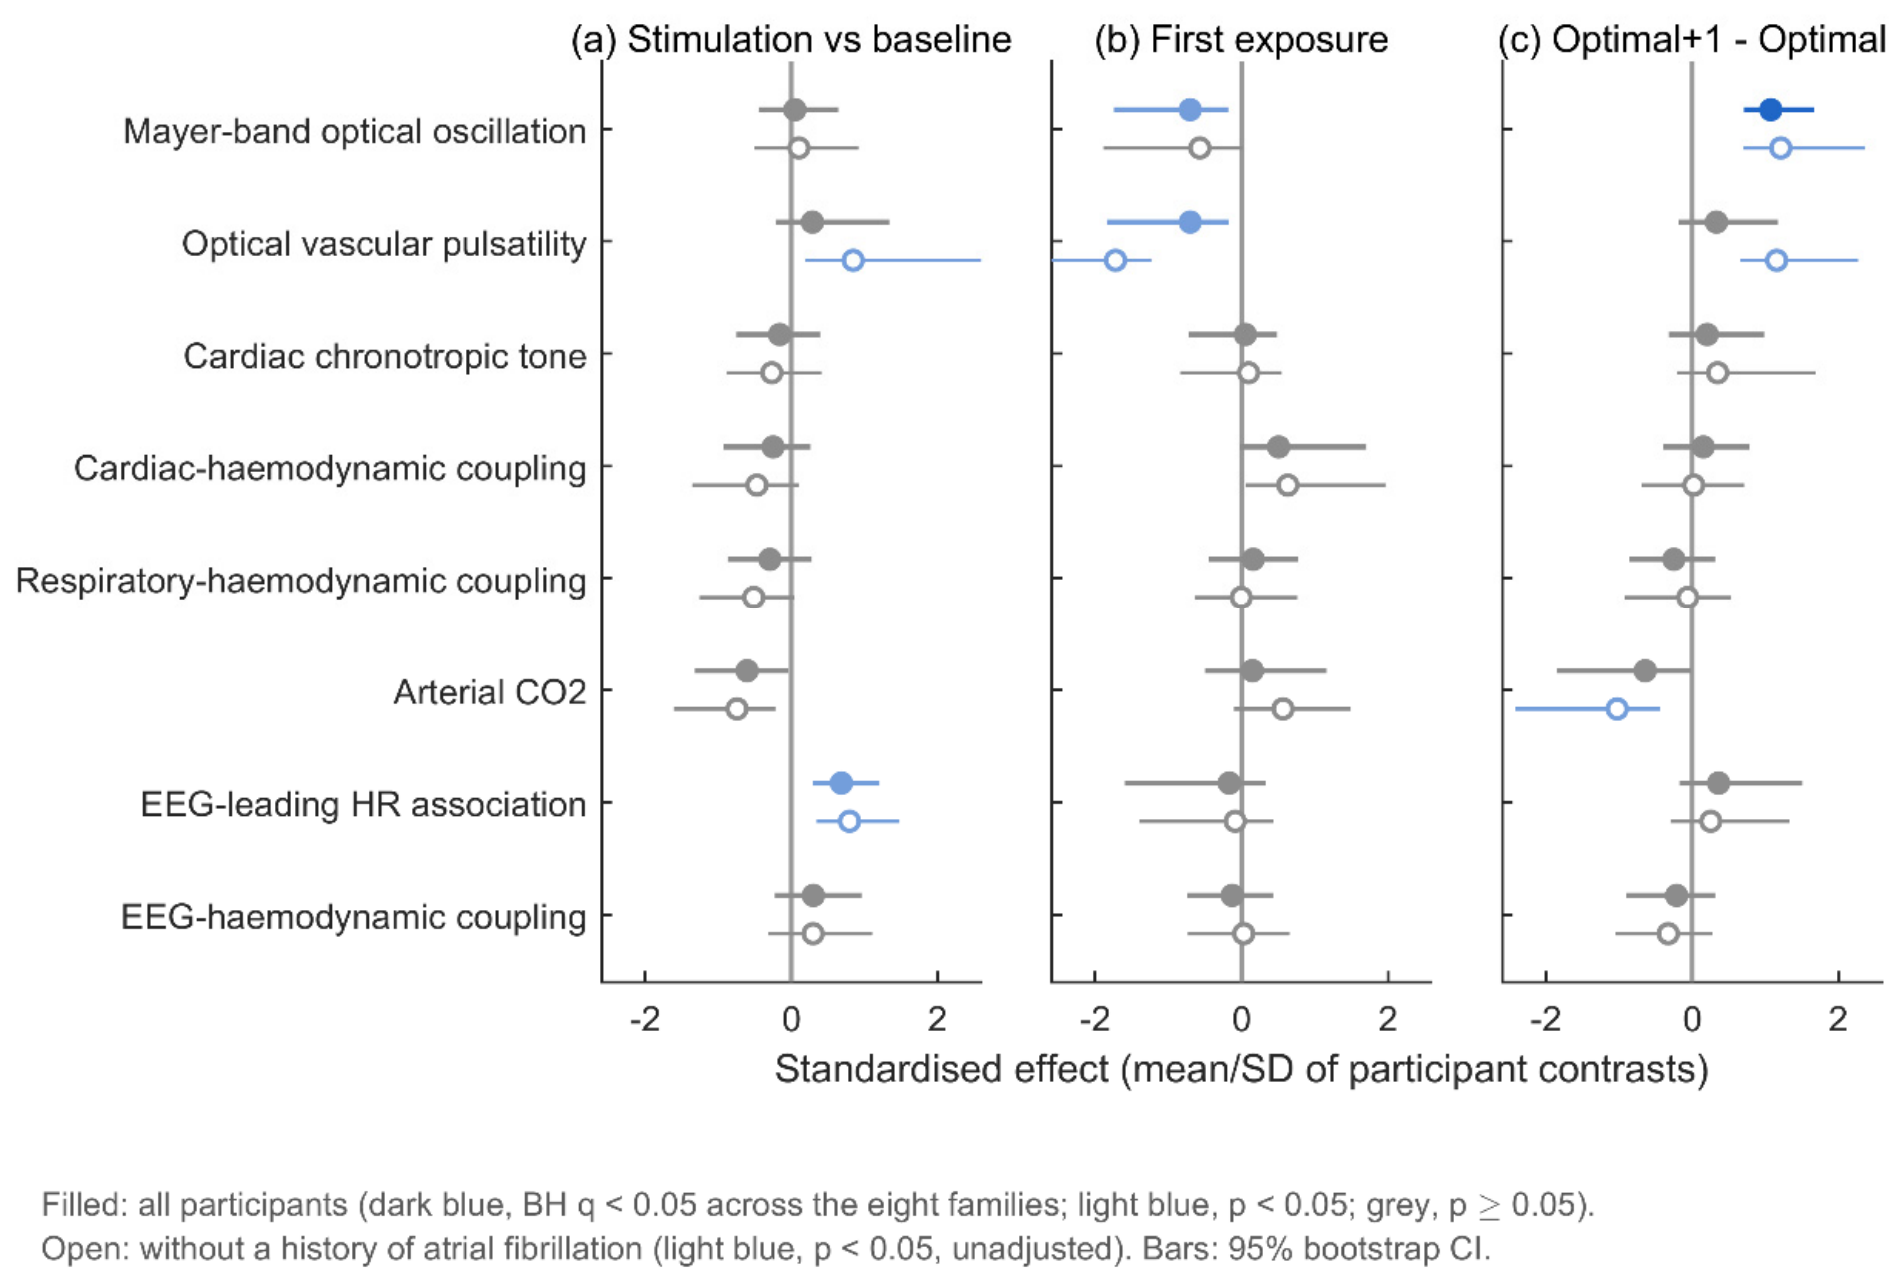
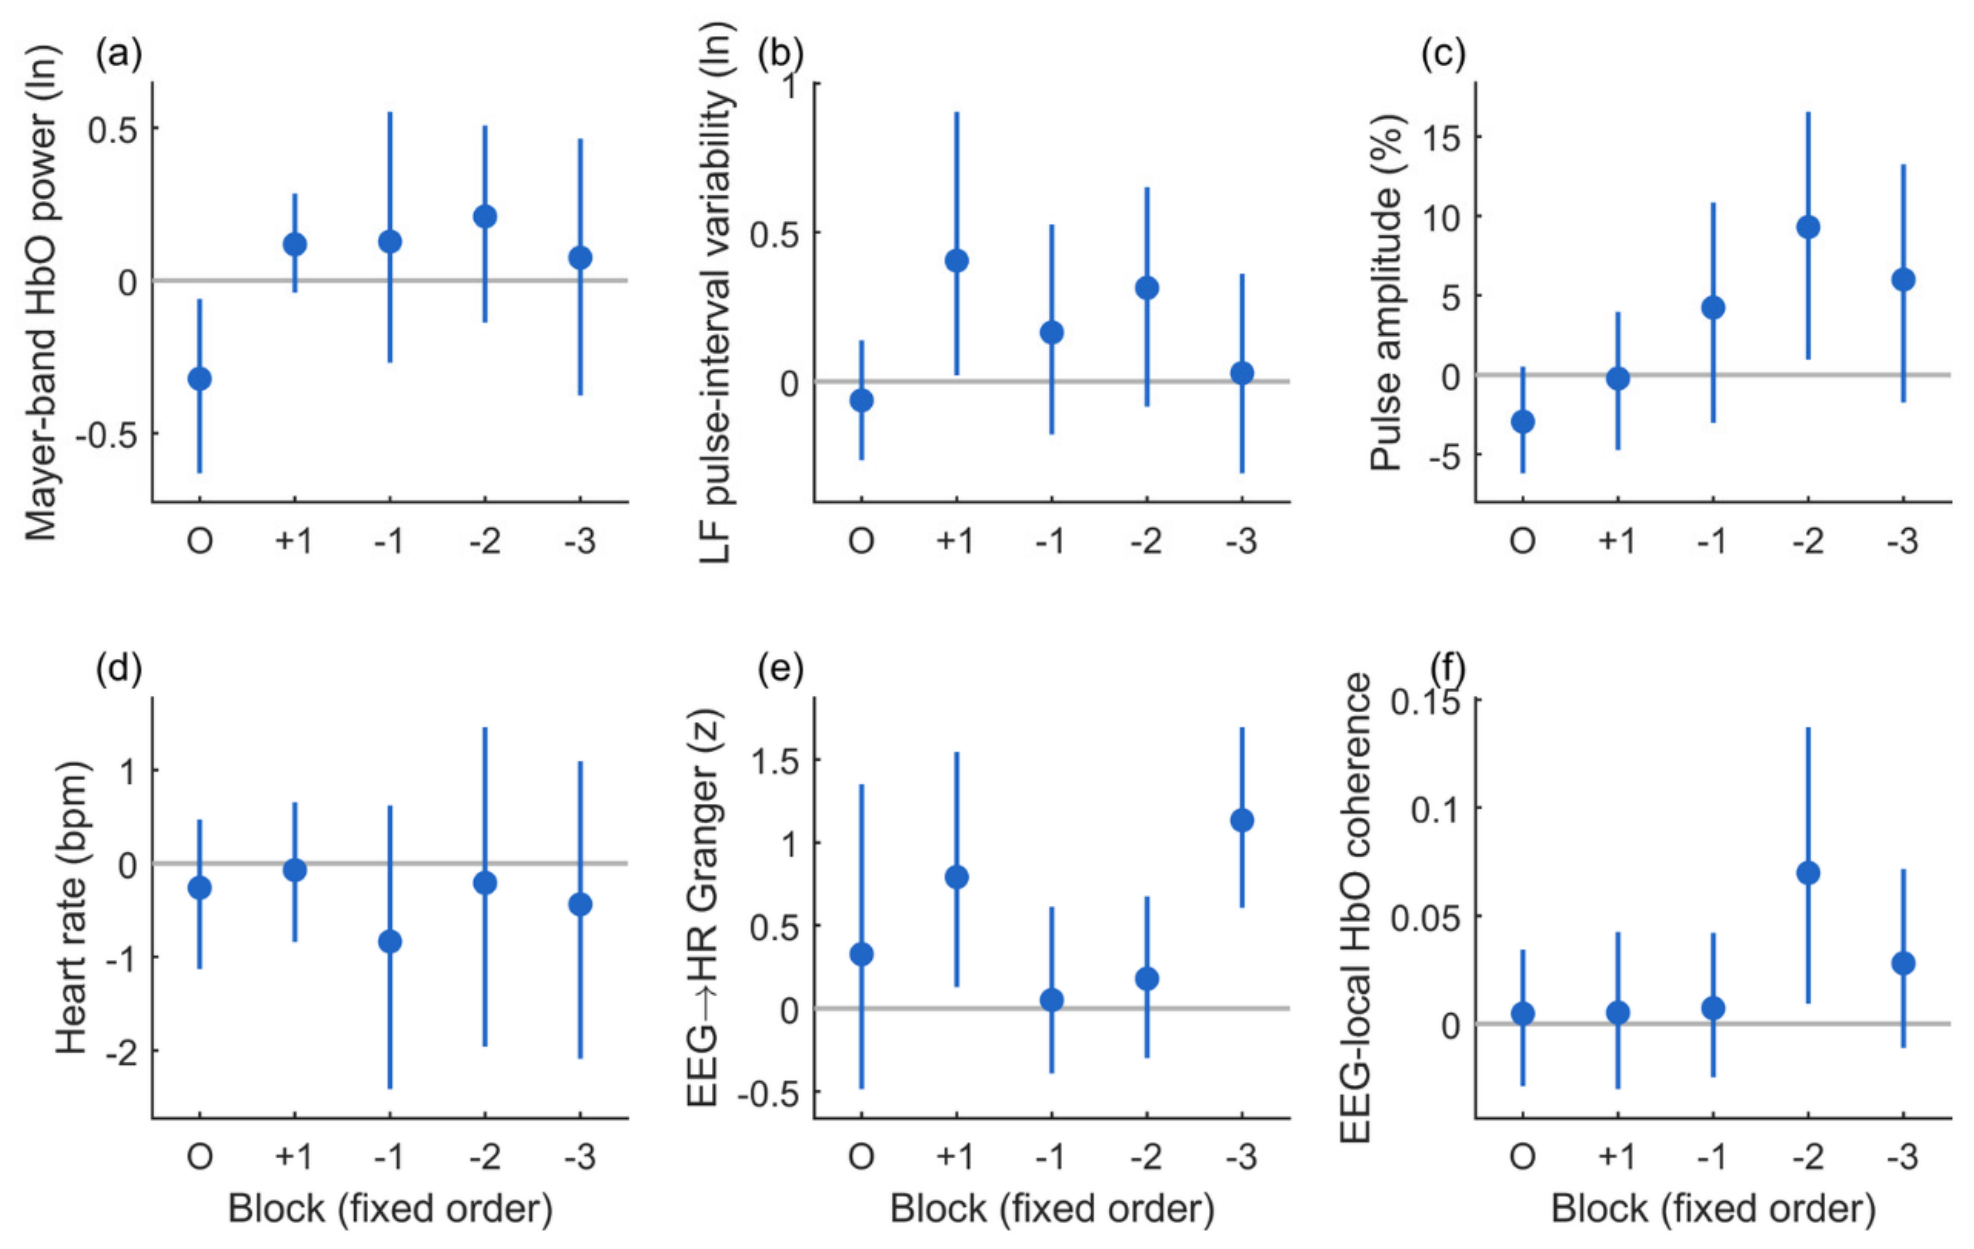
Table 6.
Physiological families: one representative measure per family (change from the same-posture baseline, participant means over postures, 95% bootstrap CI, exact sign-flip p, BH q across the eight families within each question).
Table 6.
Physiological families: one representative measure per family (change from the same-posture baseline, participant means over postures, 95% bootstrap CI, exact sign-flip p, BH q across the eight families within each question).
| Family | Representative measure | Stimulation vs baseline | First exposure (Optimal − later) | Optimal+1 − Optimal |
| Mayer-band optical oscillation | Mayer-band HbO power (ln) | +0.025 (−0.212 to +0.256), p 0.84, q 0.84, n = 16 | −0.493 (−0.812 to −0.143), p 0.015, q 0.090, n = 16 | +0.510 (+0.295 to +0.742), p < 0.001, q 0.002, n = 16 |
| Optical vascular pulsatility | Optical pulse amplitude (%) | +2.92 (−2.31 to +7.69), p 0.29, q 0.49, n = 14 | −7.72 (−13.06 to −1.98), p 0.023, q 0.090, n = 14 | +2.29 (−1.31 to +5.59), p 0.23, q 0.46, n = 14 |
| Cardiac chronotropic tone | Heart rate (bpm) | −0.34 (−1.40 to +0.72), p 0.55, q 0.63, n = 14 | +0.08 (−0.63 to +0.99), p 0.89, q 0.89, n = 14 | +0.21 (−0.32 to +0.70), p 0.45, q 0.51, n = 14 |
| Cardiac-haemodynamic coupling | HR-HbO excess coherence | −0.034 (−0.105 to +0.034), p 0.36, q 0.49, n = 14 | +0.043 (−0.002 to +0.085), p 0.082, q 0.22, n = 14 | +0.023 (−0.053 to +0.098), p 0.57, q 0.57, n = 14 |
| Respiratory-haemodynamic coupling | Respiration-explained HbO variance | −0.038 (−0.109 to +0.027), p 0.31, q 0.49, n = 13 | +0.023 (−0.053 to +0.098), p 0.58, q 0.76, n = 13 | −0.040 (−0.127 to +0.039), p 0.40, q 0.51, n = 13 |
| Arterial CO₂ | tcCO₂ (mmHg) | −0.73 (−1.53 to −0.02), p 0.12, q 0.49, n = 9 | +0.15 (−0.51 to +0.73), p 0.66, q 0.76, n = 9 | −0.35 (−0.68 to −0.01), p 0.086, q 0.34, n = 9 |
| EEG-leading HR association | EEG to HR Granger asymmetry (z) | +0.53 (+0.15 to +0.95), p 0.031, q 0.25, n = 13 | −0.29 (−1.08 to +0.71), p 0.57, q 0.76, n = 13 | +0.51 (−0.30 to +1.18), p 0.22, q 0.46, n = 13 |
| EEG-haemodynamic coupling | EEG-local HbO excess coherence | +0.014 (−0.009 to +0.039), p 0.28, q 0.49, n = 14 | −0.009 (−0.042 to +0.026), p 0.63, q 0.76, n = 14 | −0.022 (−0.074 to +0.030), p 0.44, q 0.51, n = 14 |
Figure 6.
Family tests, all participants (filled) and without participants with a history of atrial fibrillation (open). Standardised effect (participant-mean contrast divided by its SD) with 95% bootstrap CI for each family’s representative measure, for (a) stimulation versus baseline, (b) first exposure (Optimal minus later blocks) and (c) Optimal+1 minus Optimal. Filled: dark blue, Benjamini-Hochberg q < 0.05 across the eight families within the question, light blue, nominal p < 0.05, grey, p ≥ 0.05. Open: light blue, nominal p < 0.05 (unadjusted).
Figure 6.
Family tests, all participants (filled) and without participants with a history of atrial fibrillation (open). Standardised effect (participant-mean contrast divided by its SD) with 95% bootstrap CI for each family’s representative measure, for (a) stimulation versus baseline, (b) first exposure (Optimal minus later blocks) and (c) Optimal+1 minus Optimal. Filled: dark blue, Benjamini-Hochberg q < 0.05 across the eight families within the question, light blue, nominal p < 0.05, grey, p ≥ 0.05. Open: light blue, nominal p < 0.05 (unadjusted).
Figure 7.
Block-by-block profiles across the fixed sequence (O, Optimal, then +1, −1, −2, −3), as change from the same-posture baseline (participant means, 95% bootstrap CI): (a) Mayer-band HbO power, (b) LF pulse-interval variability, (c) optical pulse amplitude, (d) heart rate, (e) EEG to HR Granger asymmetry, (f) EEG-local HbO excess coherence.
Figure 7.
Block-by-block profiles across the fixed sequence (O, Optimal, then +1, −1, −2, −3), as change from the same-posture baseline (participant means, 95% bootstrap CI): (a) Mayer-band HbO power, (b) LF pulse-interval variability, (c) optical pulse amplitude, (d) heart rate, (e) EEG to HR Granger asymmetry, (f) EEG-local HbO excess coherence.
3.5. Atrial Fibrillation
Six of the 18 enrolled participants had a history of AF, four of the 15 in the coupling set and five of the 16 in the family analyses (Table 1, Figure 2). The participants with AF differed from those without in several respects (Table 1), so a history of AF coincided with stroke severity and lesion size in this cohort: Age: mean 82.8 against 72.0 years. Stroke severity: median NIHSS 6.5 against 3. Stroke type and lesion size: more total anterior circulation strokes (4 of 6 against 3 of 12) and lesions larger than 5 cm (4 of 6 against 1 of 12).
The optical pulse was less usable in AF. It met quality criteria in 44 of 72 blocks (61%) of the participants with AF, against 156 of 168 (93%) of the others. At participant level, the mean usable fraction was 0.53 against 0.91 (exact permutation p = 0.015).
Excluding AF sharpened the pulse-amplitude results (Table 7, Figure 6). Without the participants with AF (n = 11): First block: pulse amplitude fell by 12.0% (−16.0 to −8.1, p < 0.001), against −7.7% (p = 0.023) in all participants. Optimal+1: pulse amplitude rose by 5.1% (+2.6 to +7.5, p = 0.005), against +2.3% (p = 0.23). Stimulation versus baseline: pulse amplitude rose by 6.3% (+1.8 to +10.0, p = 0.023). The three participants with AF and usable pulse data responded in the opposite direction in every contrast. The differences between participants without and with AF were −20.2% for the first block (p = 0.003), +13.0% for Optimal+1 (p = 0.003) and +15.7% for stimulation versus baseline (p = 0.014). For the first-block and Optimal+1 contrasts, the observed split was the most extreme of all possible splits.
Other families did not depend on AF (Table 7): Mayer-band power: the Optimal+1 contrast was unchanged without AF (+0.49, +0.27 to +0.72, p = 0.003), and participants with and without AF did not differ in any Mayer-band contrast (p ≥ 0.72). The first-block decrease was similar in size but no longer nominally significant (−0.46, p = 0.091). LF-PIV at Optimal+1 held (+0.47, p = 0.042). Heart rate, HR-HbO coherence and EEG-haemodynamic coupling did not differ between the groups (all p ≥ 0.18). Respiratory coupling, available for only two participants with AF, did not differ either (p ≥ 0.090).
Coupling levels were unchanged without AF (Table 3): EEG-local excess coherence +0.031 (p = 0.003), EEG-global +0.039 (p = 0.002), HR-global +0.15 (p < 0.001), EEG to HR TRGC +0.83 (p = 0.003).
The EEG to HbO asymmetries were weaker in the smaller sample (+0.30, p = 0.056, conditioned +0.36, p = 0.10).
4. Discussion
4.1. Principal Findings
The RETRAIN Phase 1 data support five conclusions, 1. The optical signal co-varies with inferred systemic physiological proxies. Optical cardiac and respiratory signals explained 29% of slow global HbO variance, heart rate was strongly coherent with global HbO, and within participants global HbO and HbT rose with heart rate from block to block while HbR did not. 2. Neural-autonomic coupling was present but stable. EEG-haemodynamic, brain-heart and cardiac-haemodynamic coupling were present throughout stimulation. 3. The clearest responses were vascular, transient and sequence-dependent. Mayer-band power and pulse amplitude fell in the first stimulation block of each posture and recovered in the later blocks. This pattern also produced the one family contrast surviving correction, Mayer-band power at Optimal+1 versus Optimal. 4. AF distorted the pulse-derived vascular measures. A history of AF was associated with a less usable optical pulse and a reversed pulse-amplitude response, and excluding it sharpened the pulse-amplitude results without changing the non-pulse families. 5. The interpretation has limits. The measurement-validity analyses define them: without usable short channels, the superficial and intracranial contributions to the vascular and coupling families cannot be separated, and a significant EEG-fNIRS coherence cannot by itself be attributed to cortical neurovascular coupling.
4.2. Cardiac Carriers of the Optical Response
The cardiac-haemodynamic findings answer part of the question that motivated this analysis: whether optical haemodynamic changes covary with inferred cardiac signals. Three observations converge: 1. a large, stable HR-global coherence (+0.19), 2. a 29% share of slow global variance explained by optical cardiac and respiratory signals, 3. a within-participant association in which blocks with larger heart-rate rises also had larger HbO and HbT rises. Together they identify optically inferred cardiac activity as a main correlate of slow global haemodynamics in these recordings. This is consistent with our open-data analysis (Section 3.1) and previous work [28,44,54].
An HbO/HbT association without a parallel HbR association is compatible with blood-volume-related physiology, but is not specific to pressure, arterial inflow, cortical tissue or scalp vessels. Optical HR and global HbO come from the same channels, but from different frequency bands (cardiac band versus <0.15 Hz). Shared motion artefact would be expected to move HbR as well, and it did not.
The association does not explain the mean stimulation response. Scalp, meningeal, pial and cortical beds all receive a share of cardiac output, and continuous-wave fNIRS cannot separate them. The primary report described heart-rate reductions at low intensities, more pronounced in men [8]. The present analysis suggests that participant-level variation in cardiac drift during stimulation should be modelled when stimulation-related HbO responses are estimated. A direct future test would be to refit the primary GLM with lagged cardiac and respiratory regressors and measure how much the stimulation beta attenuates. A residual response after adjustment would still be compatible with cerebral, pial, meningeal or unmeasured systemic contributions.
Respiratory coupling was stable, as expected at geko’s metabolic load. tcCO₂ showed only nominal decreases during stimulation and at Optimal+1 in nine participants. CO₂ acts much more strongly on cerebral than on scalp vessels [45], and hypocapnia lowers prefrontal HbO [20], so small arousal-related falls in CO₂ would reduce cerebral rather than scalp HbO. With n ≤ 10, this family is the least informative.
4.3. A Transient Vasomotor Adjustment at the Start of Each Stimulation Series
The first block decrease in Mayer-band power, with a parallel fall in pulse amplitude and in LF-PIV, may be compatible with a vascular response near stimulus onset. Pulse amplitude in the long-channel signal is thought to be dominated by the sympathetically controlled scalp arterial bed [19], and sympathetic vasoconstriction indexed by peripheral pulse amplitude contributes widely to haemodynamic signals [43]. In the open data, an electrical stimulus produced the same signature: a superficial decrease coupled, trial by trial, to a fall in pulse amplitude and a cardiac deceleration. This is the orienting pattern described for moderate somatosensory stimuli [13,52].
A lower Mayer-band power at the same time is less expected, because sympathetic activation usually amplifies the 0.1-Hz baroreflex resonance [17,42]. There are two possibilities: 1. onset-related vasoconstriction stiffens the scalp bed and reduces the optical expression of pressure oscillations without reducing the oscillations themselves, 2. the loading of venous return at stimulation onset transiently damps baroreflex oscillation. RETRAIN lacks continuous arterial pressure, so the two cannot be distinguished, and the Mayer band also overlaps the myogenic vasomotion band [55]. The response did not detectably fade across the visit (Section 3.4). Habituation theory predicts that responses recover after a pause and are restored by a change in context [16], and each posture series began after a posture change and a baseline block. Across repeated cold-pressor exposures, chronotropic and cardiac-output responses habituated whereas peripheral resistance did not [15]. This fits the finding that vascular families, but not heart rate, distinguished the first block.
Mayer-band power at Optimal+1 exceeded that at Optimal. The fixed order confounds intensity with time after the second block, and Optimal+1 is a stronger stimulus that can itself dishabituate a response [16]. One step lengthens the pulse by a factor of about 1.4, and on a strength-duration model changes the sensory-to-motor drive ratio by at most about 3% [11,12]. Cortical haemodynamic responses grow with NMES current in healthy adults [56]. The primary analysis reported only a slightly positive relationship between intensity and the fitted HbO response, which its authors interpreted with caution because of systemic contamination [8].
4.4. Stable Neural-Autonomic Coupling
EEG-haemodynamic coupling was small (excess magnitude-squared coherence of about 0.03). It was equally strong to local and global signals, unchanged by GSR and reduced by 36-63% by envelope normalisation. EEG-leading HR predictive asymmetry was detected in the stimulation recordings. Neither tracked intensity or exposure, and only the EEG-leading HR asymmetry rose nominally against baseline. Both were unchanged without the participants with AF.
One plausible explanation is a shared neural-autonomic state: slow EEG-power fluctuations that covary with optically measured haemodynamics and may reflect arousal-related shared influences [24,25,26]. In fMRI, the global signal co-fluctuates with EEG, cardiac and respiratory signals at 0.01-0.1 Hz and responds to sensory stimuli [26]. EEG-ECG coupling remained largely stable under tonic pain even as heart rate rose [57]. Brain-heart interaction is expressed through the central autonomic network, whose insular nodes are often affected by stroke [22,23]. To our knowledge, directed EEG to HR coupling has not been reported in ischaemic stroke, so these estimates are descriptive.
The four classes of interaction that could produce EEG-HbO coupling are set out in Table 8. A shared neural-autonomic state is one plausible explanation, but the data cannot exclude other common physiological drivers. Direct cortical neurovascular coupling is not excluded. The EEG to HR to HbO chain is a hypothesis about conditional dependence: the EEG to HbO asymmetry weakened, but persisted marginally, after conditioning on heart rate and pulse amplitude.
A positive excess-coherence estimate demonstrates association relative to the specified surrogate procedure. Both conventional surrogate nulls rejected for phase-independent signals that shared an amplitude envelope, which arousal-state fluctuations are expected to produce. Envelope normalisation emphasised phase-consistent coupling under the tested models, but it also removes state-dependent coupling expressed as co-varying amplitude. Conventional and normalised coherence are therefore complementary estimators, not total and artefact-free components. The same caution applies to wavelet coherence and correlation-based measures tested against shift or phase surrogates.
Interpreting significant EEG-fNIRS coherence. A positive excess coherence shows that the EEG envelope and the optical signal share slow variance that the surrogate procedure does not reproduce. It is not, by itself, evidence of neurovascular coupling, for four reasons. First, the EEG predictor is a log power envelope, so the statistic measures slow amplitude-to-haemodynamic co-fluctuation rather than coupling to the phase of a neural oscillation. Any process that modulates cortical arousal and vascular tone together, such as fluctuating sympathetic outflow, baroreflex (Mayer-wave) activity, respiration or vigilance, produces coherence in the 0.02-0.13 Hz band without a cortical haemodynamic response. Second, circular-shift and phase-randomised surrogates preserve each signal’s spectrum but not a shared slow amplitude modulation, so both nulls rejected in every simulated cohort when two phase-independent signals shared an envelope (Section 3.1). The conventional estimate (+0.034) therefore combines phase-consistent covariation with envelope co-modulation. The envelope-normalised estimate (+0.017) removes the envelope co-modulation, but a shared autonomic or respiratory driver acting with consistent timing on both signals would still contribute to it.
Third, regression changes what coherence measures. Zero-lag GSR removes only the in-phase part of a shared global component, so delayed or filtered systemic components remain in the residual. In the scalp-only control, zero-lag regression left 83-88% of the variance, and after lagged regression the 2% that remained still had a coherence of 0.14-0.22 with heart rate (Supplementary S12). Because coherence is scale-invariant, a small residual can retain high coherence, and regression on a predictor that is itself correlated with the EEG can add or reverse coherence: in RETRAIN, EEG-local coupling was nominally higher after full GSR (+0.039 against +0.034). Coherence that is unchanged by GSR therefore does not show that the coupling is local or cortical, with EEG-local and EEG-global coupling nearly equal, it is equally compatible with coupling carried by delayed or spatially non-uniform systemic components. Conditioning on HR and PA raises the same problem. Residualising before generating surrogates gave 45% false-positive rejections in simulation, and only the calibrated null, which shifts the raw EEG and repeats the adjustment, was valid (Supplementary S4). The conditioned estimate (+0.017) removes only what the optical HR and PA proxies capture, sympathetic, respiratory and pressure fluctuations that they do not represent remain.
Fourth, temporal asymmetry does not identify the direction of causation. A common driver that reaches the EEG envelope quickly and the haemodynamic signal through a slow vascular filter produces EEG-leading net TRGC without any EEG-to-haemodynamic influence, the generative pathway model includes this case (Supplementary S4). Non-neural components of the EEG envelope that co-vary with heart rate, such as cardiac-field or pulse artefacts and movement, would act as further shared drivers. Taken together, the coherence and asymmetry findings establish a reproducible cross-modal dependence that is robust to the choice of surrogate null, band and window. Attributing it to cortical neurovascular coupling, to a shared neural-autonomic state or to systemic vascular physiology requires independent cardiovascular measurements (ECG, continuous arterial pressure, skin sympathetic activity) and short-separation channels.
4.5. Atrial Fibrillation: Why It Distorts Pulse-Derived Vascular Measures
In the small AF-history subgroup, pulse-amplitude contrasts differed in sign, optical-pulse usability was lower, and the other family estimates did not show corresponding differences. This fits the physiology. Pulse amplitude. In AF, the ventricular cycle length varies from beat to beat, filling time and stroke volume follow it, and the amplitude of each arterial pulse depends on the preceding interval. An irregular sequence of cycle lengths by itself lowers cardiac output and raises filling pressures at the same mean rate [35]. Mean pulse amplitude over a block is then a property of the cycle-length distribution as much as of vascular tone, and a change in ventricular rate at stimulation onset can move it in either direction. Pulse detection. Small beats after short intervals are missed or merged by optical beat detection, which may contribute to the lower observed optical-pulse usability. Sympathetic outflow. An irregular ventricular response raises muscle sympathetic nerve activity independently of mean rate [36]. The vascular sympathetic baseline from which an orienting response departs is therefore different in AF. Pulse-interval variability. In AF, pulse-interval variability no longer reflects autonomic modulation of a sinus node [37]. Cerebral haemodynamics. AF lowers cerebral blood flow and brain perfusion [38] and is associated with weaker neurovascular coupling and autoregulation [39]. Models predict that beat-to-beat irregularity propagates to the cerebral microcirculation as transient hypoperfusion and hypertensive events, more so at higher ventricular rates [58,59].
Three cautions apply. First, this is a post hoc subgroup analysis with three AF participants who had pulse data. Second, a history of AF is not rhythm at the time of recording: paroxysmal AF may have been in sinus rhythm, and rhythm was not documented. Third, AF coincided with greater age, stroke severity and lesion size, so these factors cannot be separated here. The opposite-signed subgroup estimates remain hypothesis-generating and cannot be attributed to active AF without contemporaneous rhythm verification.
For future EEG-fNIRS studies of vascular and autonomic responses after stroke, we draw the following conclusions: Rhythm should be verified by simultaneous ECG in future recordings. Participants with ECG-confirmed AF should be handled using prespecified rhythm-aware analysis and stratification, with exclusion reserved for estimators that cannot validly accommodate irregular rhythm. AF should be a prespecified stratification or exclusion criterion rather than a post hoc sensitivity analysis. Because AF is common in ischaemic stroke, particularly cardioembolic stroke (8 of 18 participants here had cardioembolic aetiology), exclusion limits generalisability. Stratification with ECG verification is preferable where numbers allow.
4.6. Limitations
Design. All analyses are exploratory and post hoc. The samples are small: 13-16 participants per family, 9 for tcCO₂, and 11 in the AF-excluded set. The stimulation order was fixed with no sham, physiological responses during the rests were unrecorded. Benjamini-Hochberg control within each question limits the false-discovery rate per question, not across all 24 tests. The AF analyses are unadjusted. No short channels. The vascular and coupling measures include incompletely separated superficial and intracranial contributions. Transferring the open-data markers assumes that scalp and residual signatures generalise to older adults after stroke, in whom the extracerebral share is likely larger. No independent cardiac or pressure reference. HR, PA, LF-PIV and respiration were derived from the optical signal and share its artefacts. Optical HR agreed only moderately with Holter HR recorded at a different time, and rates above 118 bpm fall outside the analysed cardiac band (0.6-1.96 Hz, the Nyquist limit at 4.36 Hz is 131 bpm). The cardiac-haemodynamic association may partly reflect shared measurement or processing effects. The 1-Hz stimulation lies in the cardiac band, no locking was detected, but aliasing of stimulation harmonics into the Mayer band cannot be excluded without per-channel spectra. Arterial pressure was measured once per posture, so the baroreflex interpretation of the Mayer band is inferential, and pressure-haemodynamic transfer could not be estimated. AF classification. AF status was a documented history, not rhythm verified during recording, and it was confounded with age, stroke severity and lesion size.
4.7. Implications for Future Multimodal Stroke Studies
For EEG-fNIRS studies of peripheral interventions, the analysis suggests six practices for future multimodal stroke studies. 1. Define physiological families and one representative measure for each before testing, so that correlated readouts count once. 2. Record short-separation channels if feasible, continuous arterial pressure and simultaneous ECG, to independently assess cardiovascular influences, better constrain optical sensitivity and validate pulse-derived measures beat by beat. 3. Verify cardiac rhythm and prespecify how AF will be handled. 4. Treat the global signal as a physiological measurement rather than discarding it, model cardiac and respiratory covariates when estimating stimulation responses, and report coupling with and without GSR on identical epochs. 5. Calibrate surrogate nulls by simulation for the study’s own block length and sampling rate, including shared amplitude non-stationarity, and report envelope-normalised beside conventional coherence. 6. Record rests and onset so that adaptation and carry-over can be separated.
5. Conclusions
In this exploratory secondary analysis of subacute ischaemic stroke, optically inferred cardiac and respiratory measures co-varied with global fNIRS haemodynamics, while slow EEG-haemodynamic and EEG-leading HR associations were detectable during recording. No consistent stimulation-versus-baseline increase in the representative physiological families was demonstrated. The clearest sequence-associated contrast was higher Mayer-band HbO power at Optimal+1 than at the first Optimal exposure, a difference that cannot be assigned uniquely to pulse width, habituation or session effects. Optical pulse-amplitude estimates and pulse usability differed by documented AF history, but the subgroup was small and cardiac rhythm was not simultaneously verified. Future studies require usable short-separation measurements if feasible, contemporaneous ECG, PPG, and arterial pressure.
Supplementary Materials
The following supporting information can be downloaded at the website of this paper posted on Preprints.org.
Data and code availability
De-identified derived data and figure/table regeneration Matlab code are planned for release upon acceptance, subject to consent, ethics permissions and appropriate safeguards for potentially identifying small-subgroup variables (including AF history). Restricted clinical data are available from the principal investigator, Dr. Chatterjee, upon reasonable request. MULPA [51] and OpenNeuro ds005776 [53] are public.
Ethics
RETRAIN Phase 1 (ClinicalTrials.gov NCT06614400) was conducted at the Stroke Rehabilitation Unit, Ellesmere Port Hospital, Chester, UK, with research ethics approval (REC reference 343056) and confirms written informed consent from participants and adherence to the Declaration of Helsinki. The present work is a secondary analysis of those recordings.
Acknowledgments
We thank the RETRAIN participants and their families and the clinical and research teams involved in recruitment and acquisition.
Author Contributions (CRediT)
Anirban Dutta: Conceptualization, Methodology, Formal analysis, Visualization, Writing - original draft, Writing - review & editing. Sandra Leason: Investigation, Data curation. Allam Harfoush: Investigation, Data curation. Kausik Chatterjee: Methodology, Writing - review & editing, Supervision, Funding acquisition.
Funding
The underlying RETRAIN Phase 1 study was supported by Innovate UK (Application No. 10038715), with funding awarded to Firstkind Ltd. Firstkind Ltd. had no role in study design, data analysis, interpretation or preparation of that manuscript.
Generative-AI statement
Generative AI tools were used to assist with analytical code development and manuscript editing under author supervision. The authors verified the analytical results, references, and scientific content and take full responsibility for the final manuscript.
References
- Aries, M. J. H.; Elting, J. W.; De Keyser, J.; Kremer, B. P. H.; Vroomen, P. C. A. J. Cerebral autoregulation in stroke: a review of transcranial Doppler studies. Stroke 2010, 41, 2697–704. [Google Scholar] [PubMed]
- Salinet, A. S. M.; Silva, N. C. C.; Caldas, J.; de Azevedo, D. S.; de-Lima-Oliveira, M.; Nogueira, R. C.; Conforto, A. B.; Texeira, M. J.; Robinson, T. G.; Panerai, R. B.; Bor-Seng-Shu, E. 2019. Impaired cerebral autoregulation and neurovascular coupling in middle cerebral artery stroke: influence of severity? J. Cereb. Blood Flow Metab. 39, 2277–85. [CrossRef] [PubMed]
- Xiong, L.; Leung, H. H. W.; Chen, X.; Han, J. H.; Leung, T. W. H.; Soo, Y. O. Y.; Chan, A. Y. Y.; Lau, A. Y. L.; Wong, K. S. L. Comprehensive assessment for autonomic dysfunction in different phases after ischemic stroke. Int. J. Stroke 2013, 8, 645–51. [Google Scholar] [CrossRef] [PubMed]
- Yperzeele, L.; van Hooff, R.-J.; Nagels, G.; De Smedt, A.; De Keyser, J.; Brouns, R. Heart rate variability and baroreceptor sensitivity in acute stroke: a systematic review. Int. J. Stroke 2015, 10, 796–800. [Google Scholar] [CrossRef] [PubMed]
- Robinson, T. G.; Dawson, S. L.; Eames, P. J.; Panerai, R. B.; Potter, J. F. Cardiac baroreceptor sensitivity predicts long-term outcome after acute ischemic stroke. Stroke 2003, 34, 705–11. [Google Scholar] [CrossRef] [PubMed]
- Griffin, M.; Bond, D.; Nicolaides, A. Measurement of blood flow in the deep veins of the lower limb using the gekoTM neuromuscular electro-stimulation device. Int. Angiol. 2016, 35, 406–10. [Google Scholar] [PubMed]
- Williams, K. J.; Moore, H. M.; Davies, A. H. Haemodynamic changes with the use of neuromuscular electrical stimulation compared to intermittent pneumatic compression. Phlebology 2015, 30, 365–72. [Google Scholar] [CrossRef] [PubMed]
- Dutta, A.; Arora, Y.; Leason, S.; Harfoush, A. Chatterjee K 2026 Enhancement of cerebral oxygenation by lower-limb neuromuscular electrical stimulation in stroke survivors. Ann. Biomed. Eng. 54, 2643–64. [PubMed]
- Kaufman, M. P.; Hayes, S. G. The exercise pressor reflex. Clin. Auton. Res. 2002, 12, 429–39. [Google Scholar] [CrossRef] [PubMed]
- Takeda, R.; Kunugi, S.; Watanabe, K. 2026 Low-intensity neuromuscular electrical stimulation elicits detectable metaboreflex-mediated sympathetic responses in humans. Am. J. Physiol. Regul. Integr. Comp. Physiol. [CrossRef] [PubMed]
- Mogyoros, I.; Kiernan, M. C.; Burke, D. Strength-duration properties of human peripheral nerve. Brain 1996, 119, 439–47. [Google Scholar] [CrossRef] [PubMed]
- Bergquist, A. J.; Clair, J. M.; Lagerquist, O.; Mang, C. S.; Okuma, Y.; Collins, D. F. Neuromuscular electrical stimulation: implications of the electrically evoked sensory volley. Eur. J. Appl. Physiol. 2011, 111, 2409–26. [Google Scholar] [CrossRef] [PubMed]
- Turpin, G. Effects of stimulus intensity on autonomic responding: the problem of differentiating orienting and defense reflexes. Psychophysiology 1986, 23, 1–14. [Google Scholar] [CrossRef] [PubMed]
- Gianaros, P. J.; Quigley, K. S. Autonomic origins of a nonsignal stimulus-elicited bradycardia and its habituation in humans. Psychophysiology 2001, 38, 540–7. [Google Scholar] [PubMed]
- Bullock, T.; MacLean, M. H.; Santander, T.; Boone, A. P.; Babenko, V.; Dundon, N. M.; Stuber, A.; Jimmons, L.; Raymer, J.; Okafor, G. N.; Miller, M. B.; Giesbrecht, B.; Grafton, S. 2023 Habituation of the stress response multiplex to repeated cold pressor exposure. Front Physiol. 13, 752900. [CrossRef] [PubMed]
- Rankin, C. H.; Abrams, T.; Barry, R. J.; Bhatnagar, S.; Clayton, D. F.; Colombo, J.; Coppola, G.; Geyer, M. A.; Glanzman, D. L.; Marsland, S.; McSweeney, F. K.; Wilson, D. A.; Wu, C.-F.; Thompson, R. F. 2009 Habituation revisited: an updated and revised description of the behavioral characteristics of habituation. Neurobiol. Learn. Mem. 92, 135–8. [CrossRef] [PubMed]
- Julien, C. The enigma of Mayer waves: facts and models. Cardiovasc Res. 2006, 70, 12–21. [Google Scholar] [CrossRef] [PubMed]
- Kirilina, E.; Yu, N.; Jelzow, A.; Wabnitz, H.; Jacobs, A. M.; Tachtsidis, I. Identifying and quantifying main components of physiological noise in functional near infrared spectroscopy on the prefrontal cortex. Front Hum. Neurosci. 2013, 7, 864. [Google Scholar] [CrossRef] [PubMed]
- Kirilina, E.; Jelzow, A.; Heine, A.; Niessing, M.; Wabnitz, H.; Brühl, R.; Ittermann, B.; Jacobs, A. M.; Tachtsidis, I. The physiological origin of task-evoked systemic artefacts in functional near infrared spectroscopy. NeuroImage 2012, 61, 70–81. [Google Scholar] [CrossRef] [PubMed]
- Scholkmann, F.; Gerber, U.; Wolf, M.; Wolf, U. End-tidal CO2: an important parameter for a correct interpretation in functional brain studies using speech tasks. NeuroImage 2013, 66, 71–9. [Google Scholar] [CrossRef] [PubMed]
- Birn, R. M.; Smith, M. A.; Jones, T. B.; Bandettini, P. A. The respiration response function: the temporal dynamics of fMRI signal fluctuations related to changes in respiration. NeuroImage 2008, 40, 644–54. [Google Scholar] [CrossRef] [PubMed]
- Candia-Rivera, D.; Faes, L.; de Vico Fallani, F.; Chavez, M. 2025 Measures and models of brain–heart interactions. IEEE Rev. Biomed. Eng. [CrossRef] [PubMed]
- Oppenheimer, S. M.; Gelb, A.; Girvin, J. P.; Hachinski, V. Cardiovascular effects of human insular cortex stimulation. Neurology 1992, 42, 1727–32. [Google Scholar] [CrossRef] [PubMed]
- Wong, C. W.; Olafsson, V.; Tal, O.; Liu, T. T. The amplitude of the resting-state fMRI global signal is related to EEG vigilance measures. NeuroImage 2013, 83, 983–90. [Google Scholar] [CrossRef] [PubMed]
- Turchi, J.; Chang, C.; Ye, F. Q.; Russ, B. E.; Yu, D. K.; Cortes, C. R.; Monosov, I. E.; Duyn, J. H.; Leopold, D. A. The basal forebrain regulates global resting-state fMRI fluctuations. Neuron 2018, 97, 940–952.e4. [Google Scholar] [CrossRef] [PubMed]
- Bolt, T.; Wang, S.; Nomi, J. S.; Setton, R.; Gold, B. P.; Frederick, B.; deB; Yeo, B. T. T.; Chen, J. J.; Picchioni, D.; Duyn, J. H.; Spreng, R. N.; Keilholz, S. D.; Uddin, L. Q.; Chang, C. 2025 Autonomic physiological coupling of the global fMRI signal. Nat. Neurosci. 28, 1327–35. [CrossRef] [PubMed]
- Strangman, G. E.; Li, Z.; Zhang, Q. Depth sensitivity and source-detector separations for near infrared spectroscopy based on the Colin27 brain template. PLoS ONE 2013, 8, e66319. [Google Scholar] [CrossRef] [PubMed]
- Tachtsidis, I.; Scholkmann, F. False positives and false negatives in functional near-infrared spectroscopy: issues, challenges, and the way forward. Neurophotonics 2016, 3, 031405. [Google Scholar] [CrossRef] [PubMed]
- Scholkmann, F.; Tachtsidis, I.; Wolf, M.; Wolf, U. Systemic physiology augmented functional near-infrared spectroscopy: a powerful approach to study the embodied human brain. Neurophotonics 2022, 9 030801. [Google Scholar] [CrossRef] [PubMed]
- Gagnon, L.; Yücel, M. A.; Dehaes, M.; Cooper, R. J.; Perdue, K. L.; Selb, J.; Huppert, T. J.; Hoge, R. D.; Boas, D. Quantification of the cortical contribution to the NIRS signal over the motor cortex using concurrent NIRS-fMRI measurements. NeuroImage 2012, 59, 3933–40. [Google Scholar] [CrossRef] [PubMed]
- Yücel, M. A.; Selb, J.; Aasted, C. M.; Petkov, M. P.; Becerra, L.; Borsook, D.; Boas, D. Short separation regression improves statistical significance and better localizes the hemodynamic response obtained by near-infrared spectroscopy for tasks with differing autonomic responses. Neurophotonics 2015, 2, 035005. [Google Scholar] [CrossRef] [PubMed]
- Santosa, H.; Zhai, X.; Fishburn, F.; Sparto, P. J.; Huppert, T. J. Quantitative comparison of correction techniques for removing systemic physiological signal in functional near-infrared spectroscopy studies. Neurophotonics 2020, 7, 035009. [Google Scholar] [CrossRef] [PubMed]
- Nikulin, V. V.; Fedele, T.; Mehnert, J.; Lipp, A.; Noack, C.; Steinbrink, J.; Curio, G. Monochromatic ultra-slow (~0.1 Hz) oscillations in the human electroencephalogram and their relation to hemodynamics. NeuroImage 2014, 97, 71–80. [Google Scholar] [CrossRef] [PubMed]
- Othman, M. H.; Bhattacharya, M.; Møller, K.; Kjeldsen, S.; Grand, J.; Kjaergaard, J.; Dutta, A.; Kondziella, D. Resting-state NIRS–EEG in unresponsive patients with acute brain injury: a proof-of-concept study. Neurocrit Care 2021, 34, 31–44. [Google Scholar] [CrossRef] [PubMed]
- Clark, D. M.; Plumb, V. J.; Epstein, A. E.; Kay, G. N. Hemodynamic effects of an irregular sequence of ventricular cycle lengths during atrial fibrillation. J. Am. Coll. Cardiol. 1997, 30, 1039–45. [Google Scholar] [CrossRef] [PubMed]
- Wasmund, S. L.; Li, J. M.; Page, R. L.; Joglar, J. A.; Kowal, R. C.; Smith, M. L.; Hamdan, M. H. Effect of atrial fibrillation and an irregular ventricular response on sympathetic nerve activity in human subjects. Circulation 2003, 107, 2011–5. [Google Scholar] [CrossRef] [PubMed]
- Task Force of the European Society of Cardiology and the North American Society of Pacing and Electrophysiology 1996 Heart rate variability: standards of measurement, physiological interpretation and clinical use. Circulation 93, 1043–65. [PubMed]
- Gardarsdottir, M.; Sigurdsson, S.; Aspelund, T.; Rokita, H.; Launer, L. J.; Gudnason, V.; Arnar, D. Atrial fibrillation is associated with decreased total cerebral blood flow and brain perfusion . Europace 2018, 20, 1252–8. [Google Scholar] [PubMed]
- Junejo, R. T.; Braz, I. D.; Lucas, S. J. E.; van Lieshout, J. J.; Phillips, A. A.; Lip, G. Y. H.; Fisher, J. P. Neurovascular coupling and cerebral autoregulation in atrial fibrillation. J. Cereb. Blood Flow Metab. 2020, 40, 1647–57. [Google Scholar] [CrossRef] [PubMed]
- Yücel, M. A.; Selb, J.; Aasted, C. M.; Lin, P.-Y.; Borsook, D.; Becerra, L.; Boas, D. A. 2016 Mayer waves reduce the accuracy of estimated hemodynamic response functions in functional near-infrared spectroscopy. Biomed. Opt. Express 7, 3078–88. [CrossRef] [PubMed]
- Goldstein, D. S.; Bentho, O.; Park, M.-Y.; Sharabi, Y. Low-frequency power of heart rate variability is not a measure of cardiac sympathetic tone but may be a measure of modulation of cardiac autonomic outflows by baroreflexes. Exp. Physiol. 2011, 96, 1255–61. [Google Scholar] [CrossRef] [PubMed]
- Grabov, E.; Sullivan, P.; Wang, S.; Goldstein, D. Tilt-evoked, breathing-driven blood pressure oscillations: independence from baroreflex-sympathoneural function. Clin. Auton. Res. 2024, 34, 125–35. [Google Scholar] [CrossRef] [PubMed]
- Özbay, P. S.; Chang, C.; Picchioni, D.; Mandelkow, H.; Chappel-Farley, M. G.; van Gelderen, P.; de Zwart, J. A.; Duyn, J. Sympathetic activity contributes to the fMRI signal. Commun. Biol. 2019, 2 421. [Google Scholar] [CrossRef] [PubMed]
- Tong, Y.; Hocke, L. M.; Licata, S. C.; deB, Frederick B. Low-frequency oscillations measured in the periphery with near-infrared spectroscopy are strongly correlated with blood oxygen level-dependent functional magnetic resonance imaging signals. J. Biomed. Opt. 2012, 17, 106004. [Google Scholar] [CrossRef] [PubMed]
- Sato, K.; Sadamoto, T.; Hirasawa, A.; Oue, A.; Subudhi, A. W.; Miyazawa, T.; Ogoh, S. Differential blood flow responses to CO₂ in human internal and external carotid and vertebral arteries. J. Physiol. 2012, 590, 3277–90. [Google Scholar] [CrossRef] [PubMed]
- Benjamini, Y.; Hochberg, Y. Controlling the false discovery rate: a practical and powerful approach to multiple testing. J. R. Stat. Soc. B 1995, 57, 289–300. [Google Scholar] [CrossRef]
- Bender, R.; Lange, S. 2001 Adjusting for multiple testing—when and how? J. Clin. Epidemiol. 54, 343–9. [CrossRef] [PubMed]
- Wasserstein, R. L.; Lazar, N. A. The ASA’s statement on p-values: context, process, and purpose. Am. Stat. 2016, 70, 129–33. [Google Scholar] [CrossRef]
- Haufe, S.; Nikulin, V. V.; Müller, K.-R.; Nolte, G. A critical assessment of connectivity measures for EEG data: a simulation study. NeuroImage 2013, 64, 120–33. [Google Scholar] [CrossRef] [PubMed]
- Winkler, I.; Panknin, D.; Bartz, D.; Müller, K.-R.; Haufe, S. 2016 Validity of time reversal for testing Granger causality. IEEE Trans. Signal Process. 64, 2746–60. [CrossRef]
- Raible, S.; Pereira, J.; Kotsogiannis, F.; Direito, B.; Sousa, T.; da Cunha Seiffert, M.; Lavicka, R.; Skeltona, V.; Evenblij, D.; Ciarlo, A.; Heinecke, A.; Gädtke, J.; Tipado, Z.; Mehler, D. M. A.; Kohl, S. H.; Castelo-Branco, M.; Goebel, R.; Lührs, M.; Sorger, B. All signals considered: data quality partially explains inter-individual task differences in a large, open fNIRS dataset (preprint). bioRxiv 2026. [Google Scholar] [CrossRef]
- Yücel, M. A.; Aasted, C. M.; Petkov, M. P.; Borsook, D.; Boas, D. A.; Becerra, L. Specificity of hemodynamic brain responses to painful stimuli: a functional near-infrared spectroscopy study. Sci. Rep. 2015, 5, 9469. [Google Scholar] [CrossRef] [PubMed]
- Yücel, M. A.; Selb, J.; Aasted, C.; Petkov, M.; Borsook, D.; Boas, D.; Becerra, L. Electrical_Thermal_FingerTapping_2015. 2025. [Google Scholar] [PubMed]
- Caldwell, M.; Scholkmann, F.; Wolf, U.; Wolf, M.; Elwell, C.; Tachtsidis, I. Modelling confounding effects from extracerebral contamination and systemic factors on functional near-infrared spectroscopy. NeuroImage 2016, 143, 91–105. [Google Scholar] [CrossRef] [PubMed]
- Stefanovska, A.; Bracic, M.; Kvernmo, H. D. Wavelet analysis of oscillations in the peripheral blood circulation measured by laser Doppler technique. IEEE Trans. Biomed. Eng. 1999, 46, 1230–9. [Google Scholar] [CrossRef] [PubMed]
- Muthalib, M.; Re, R.; Zucchelli, L.; Perrey, S.; Contini, D.; Caffini, M.; Spinelli, L.; Kerr, G.; Quaresima, V.; Ferrari, M.; Torricelli, A. Effects of increasing neuromuscular electrical stimulation current intensity on cortical sensorimotor network activation: a time domain fNIRS study. PLoS ONE 2015, 10, e0131951. [Google Scholar] [CrossRef] [PubMed]
- Aulenkamp, J. L.; Nedergaard, R. B.; Niazi, I. K.; Liao, D.; Kuhlmann, L.; Rojas, F.; Rasool, K.; Phillips, A. E.; Yadav, D.; de-Madaria, E.; Hegyi, P.; Garg, P.; Olesen, S. S.; Jagannath, S.; Hagn-Meincke, R.; Hajnády, Z.; Brock, C.; Drewes, A. M. 2025 Individual autonomic profiles influence brain–heart connectivity in tonic pain. J. Pain Res. 18, 6023–36. [CrossRef] [PubMed]
- Anselmino, M.; Scarsoglio, S.; Saglietto, A.; Gaita, F.; Ridolfi, L. Transient cerebral hypoperfusion and hypertensive events during atrial fibrillation: a plausible mechanism for cognitive impairment. Sci. Rep. 2016, 6, 28635. [Google Scholar] [CrossRef] [PubMed]
- Saglietto, A.; Scarsoglio, S.; Ridolfi, L.; Gaita, F.; Anselmino, M. Higher ventricular rate during atrial fibrillation relates to increased cerebral hypoperfusions and hypertensive events. Sci. Rep. 2019, 9, 3779. [Google Scholar] [CrossRef] [PubMed]
Figure 1.
Physiological families and the pathways by which lower-limb NMES could reach them. Left: intervention and calf muscle pump (shaded). Centre: latent physiological pathways (dashed). Right: the eight families with their representative measures. Families 2-4 are derived from the optical cardiac pulse and are distorted by an irregular rhythm. Pathways are mechanistic candidates, with no usable short-separation measurements, the anatomical origins of the optical family representatives cannot be established.
Figure 1.
Physiological families and the pathways by which lower-limb NMES could reach them. Left: intervention and calf muscle pump (shaded). Centre: latent physiological pathways (dashed). Right: the eight families with their representative measures. Families 2-4 are derived from the optical cardiac pulse and are distorted by an irregular rhythm. Pathways are mechanistic candidates, with no usable short-separation measurements, the anatomical origins of the optical family representatives cannot be established.
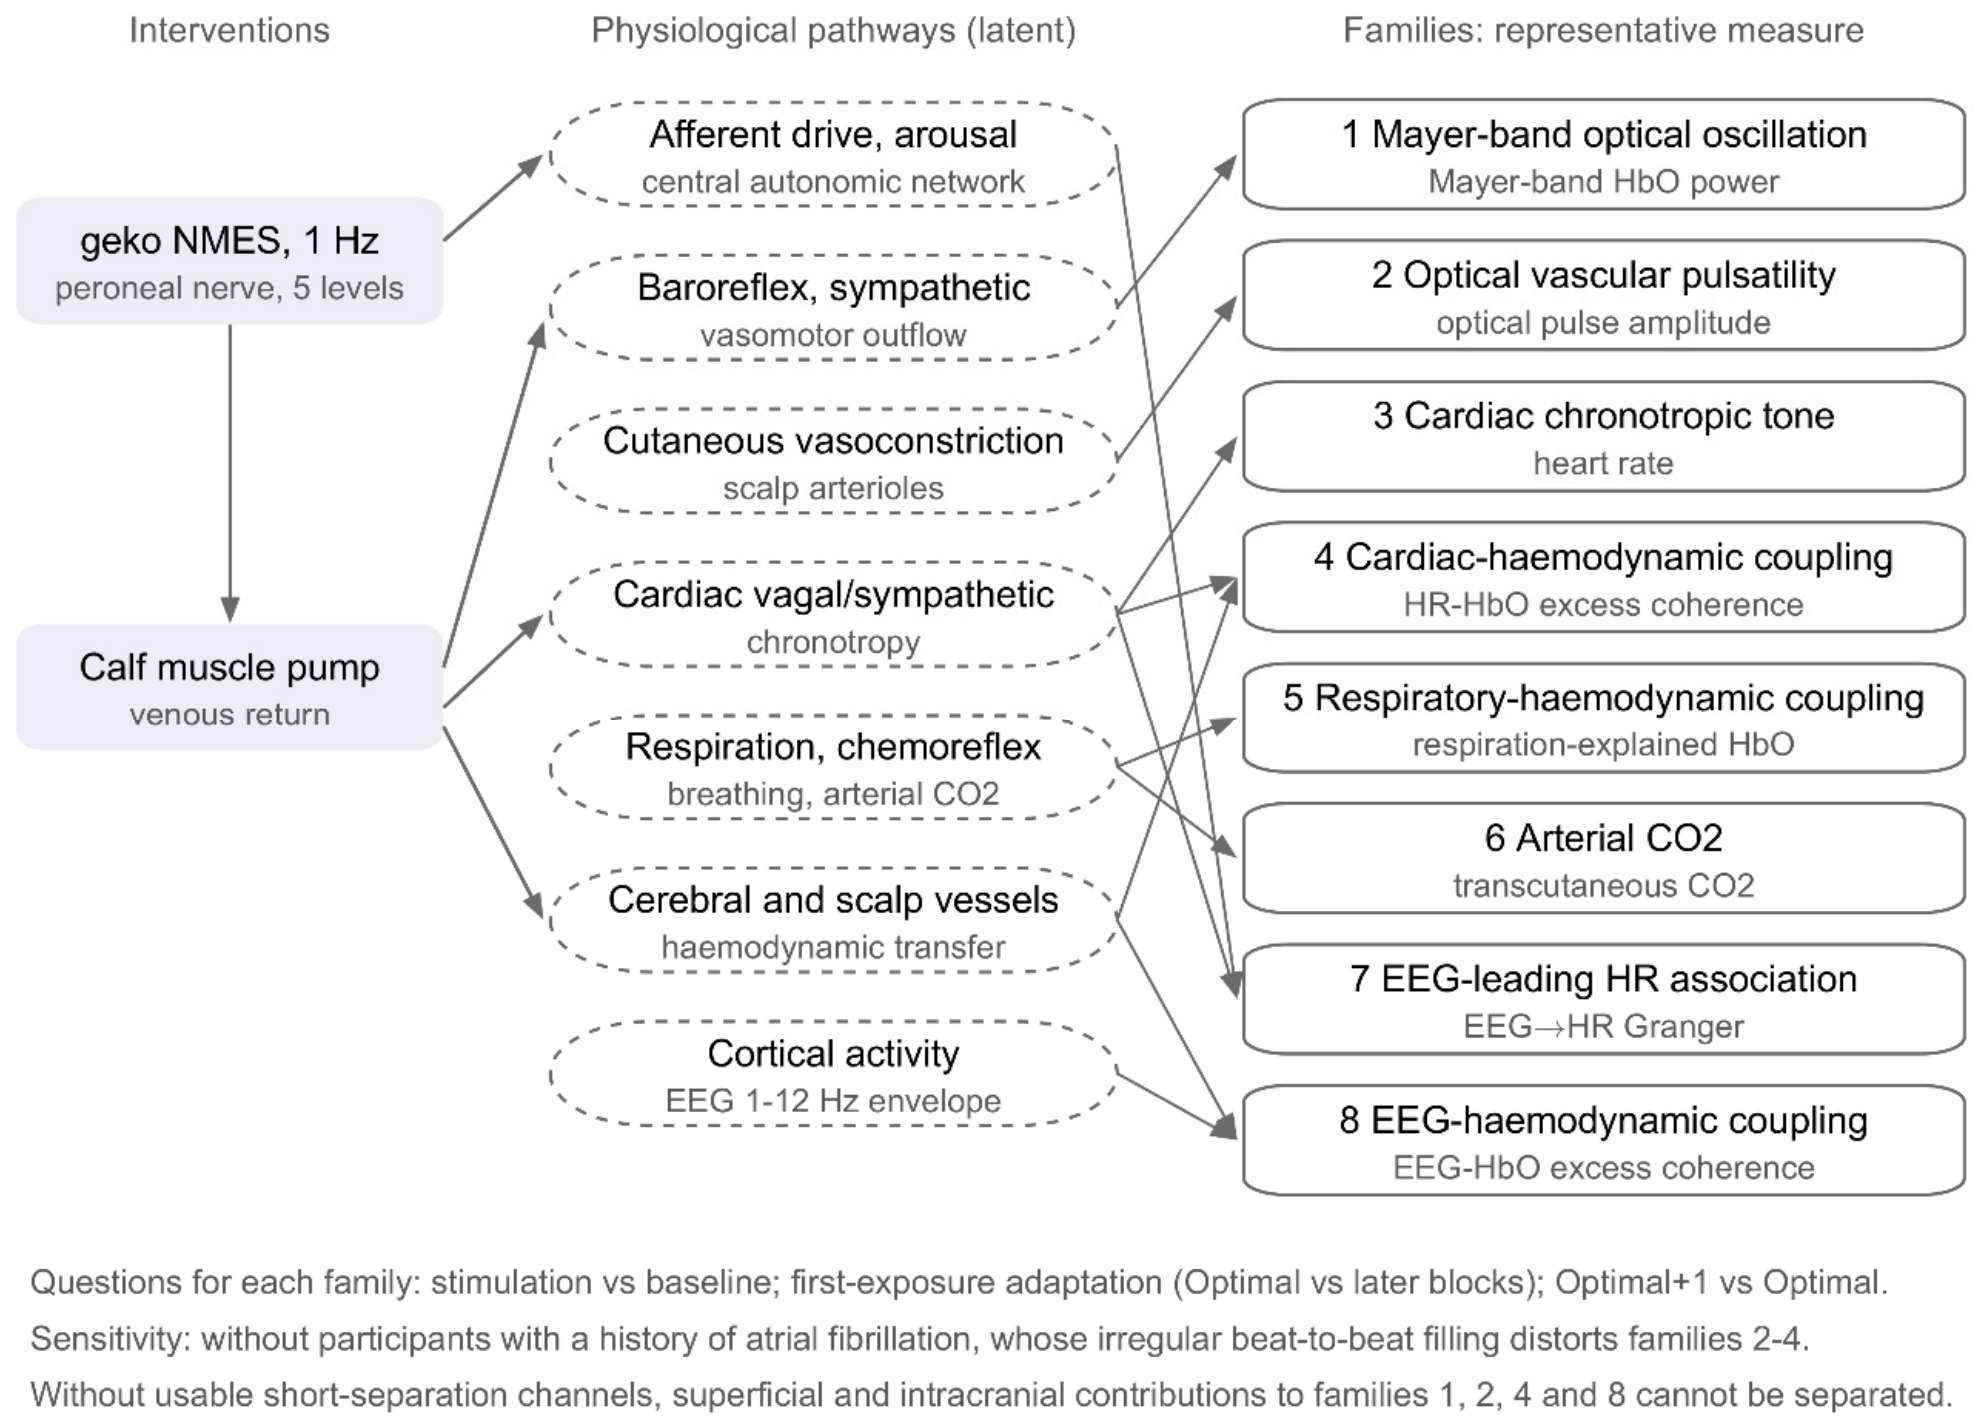
Figure 2.
Flow of participants and blocks in RETRAIN Phase 1. A block entered the coherence analyses if at least 150 s of clean EEG and fNIRS remained in at least one ROI and at least four good channels lay outside both ROIs. Cardiac and vascular family measures needed no EEG, so their n varies by measure. Participants with a history of atrial fibrillation were excluded only in sensitivity analyses.
Figure 2.
Flow of participants and blocks in RETRAIN Phase 1. A block entered the coherence analyses if at least 150 s of clean EEG and fNIRS remained in at least one ROI and at least four good channels lay outside both ROIs. Cardiac and vascular family measures needed no EEG, so their n varies by measure. Participants with a history of atrial fibrillation were excluded only in sensitivity analyses.
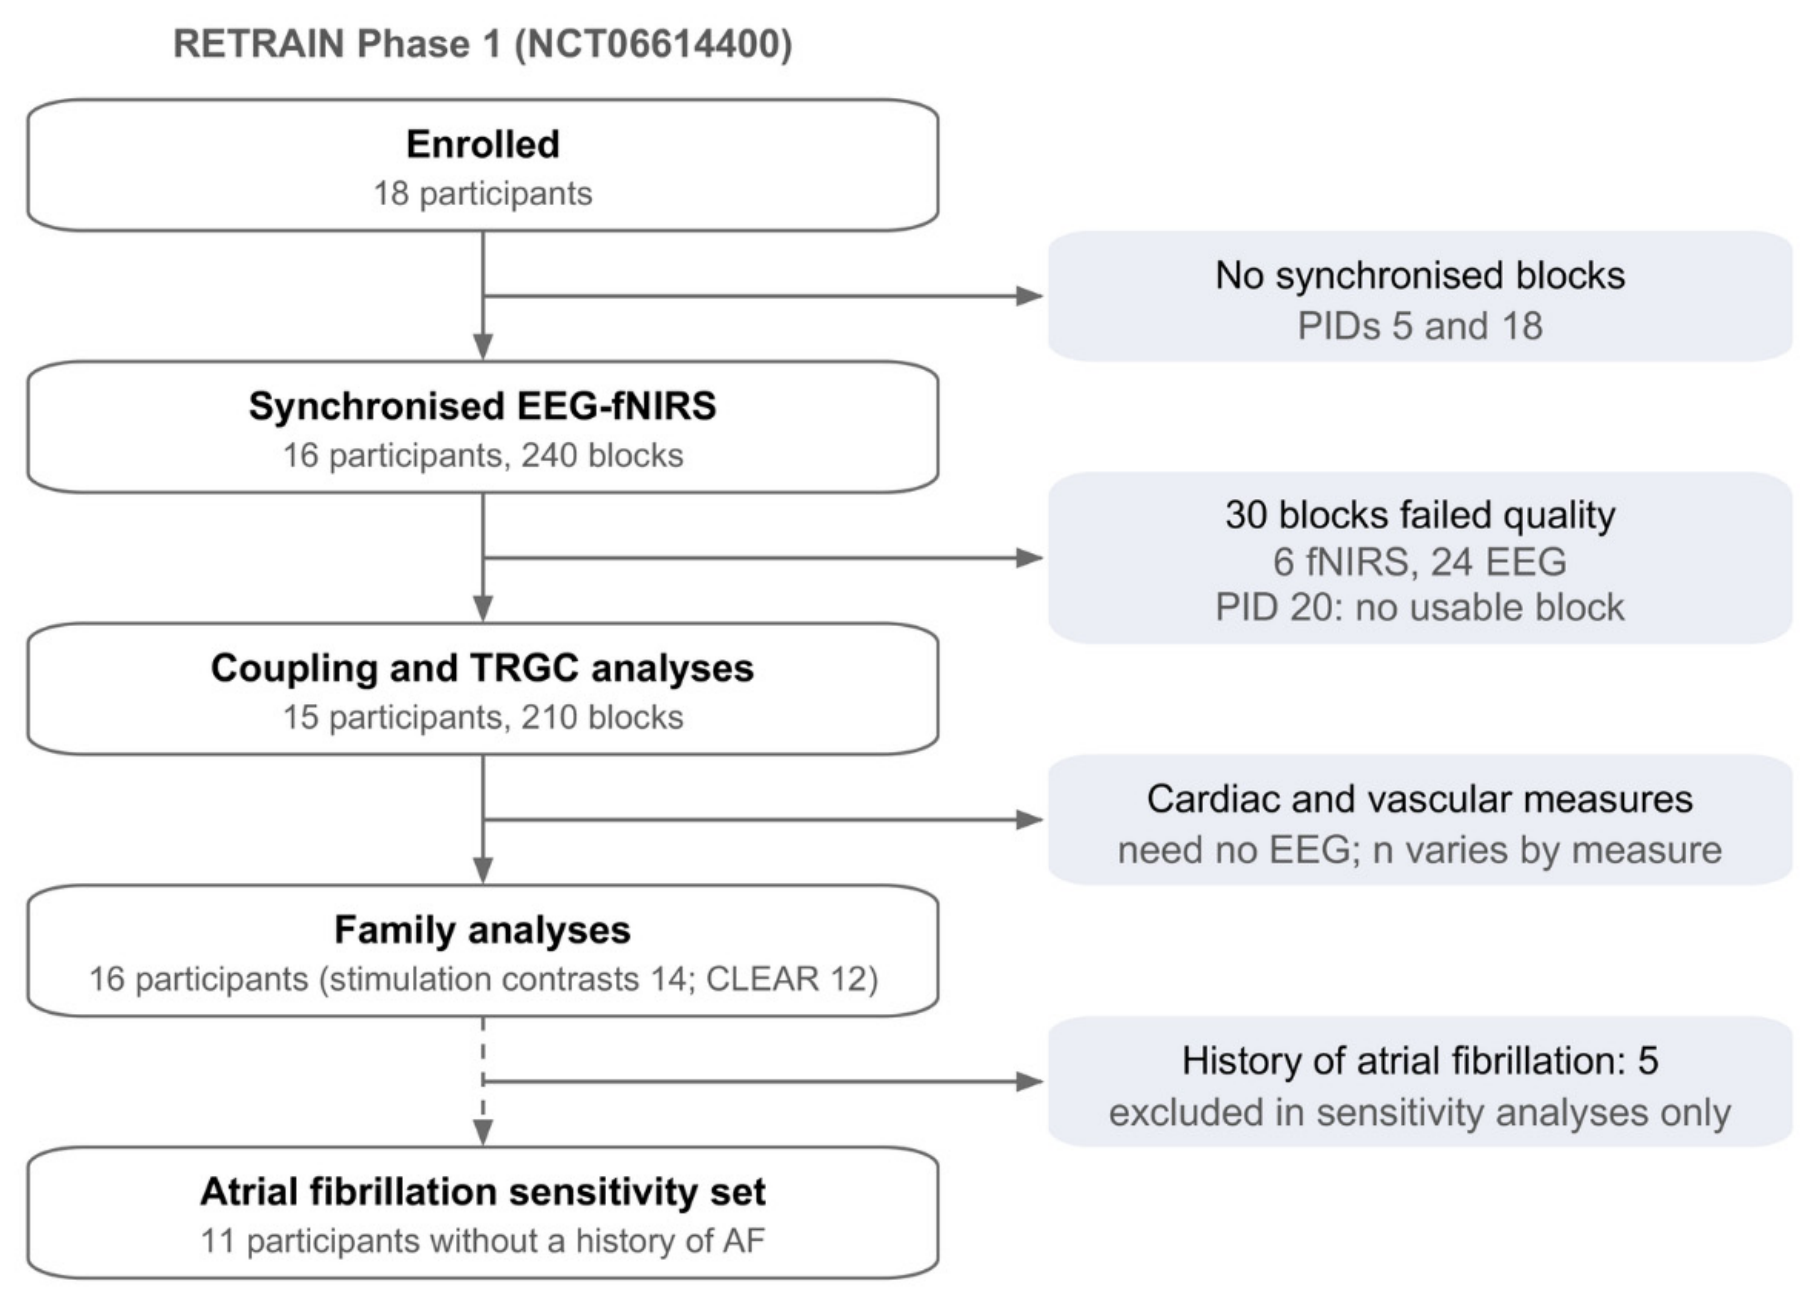
Figure 3.
Monte Carlo calibration of the participant-level excess-coherence test. (a) Empirical rejection rate by scenario, surrogate null and window (30-60 cohorts per cell). (b) Power of the envelope-normalised estimator by coupling gain and cohort size. Independent signals and independent Mayer-like rhythms are calibrated, phase-independent signals that share a slow amplitude envelope are rejected by both conventional nulls.
Figure 3.
Monte Carlo calibration of the participant-level excess-coherence test. (a) Empirical rejection rate by scenario, surrogate null and window (30-60 cohorts per cell). (b) Power of the envelope-normalised estimator by coupling gain and cohort size. Independent signals and independent Mayer-like rhythms are calibrated, phase-independent signals that share a slow amplitude envelope are rejected by both conventional nulls.
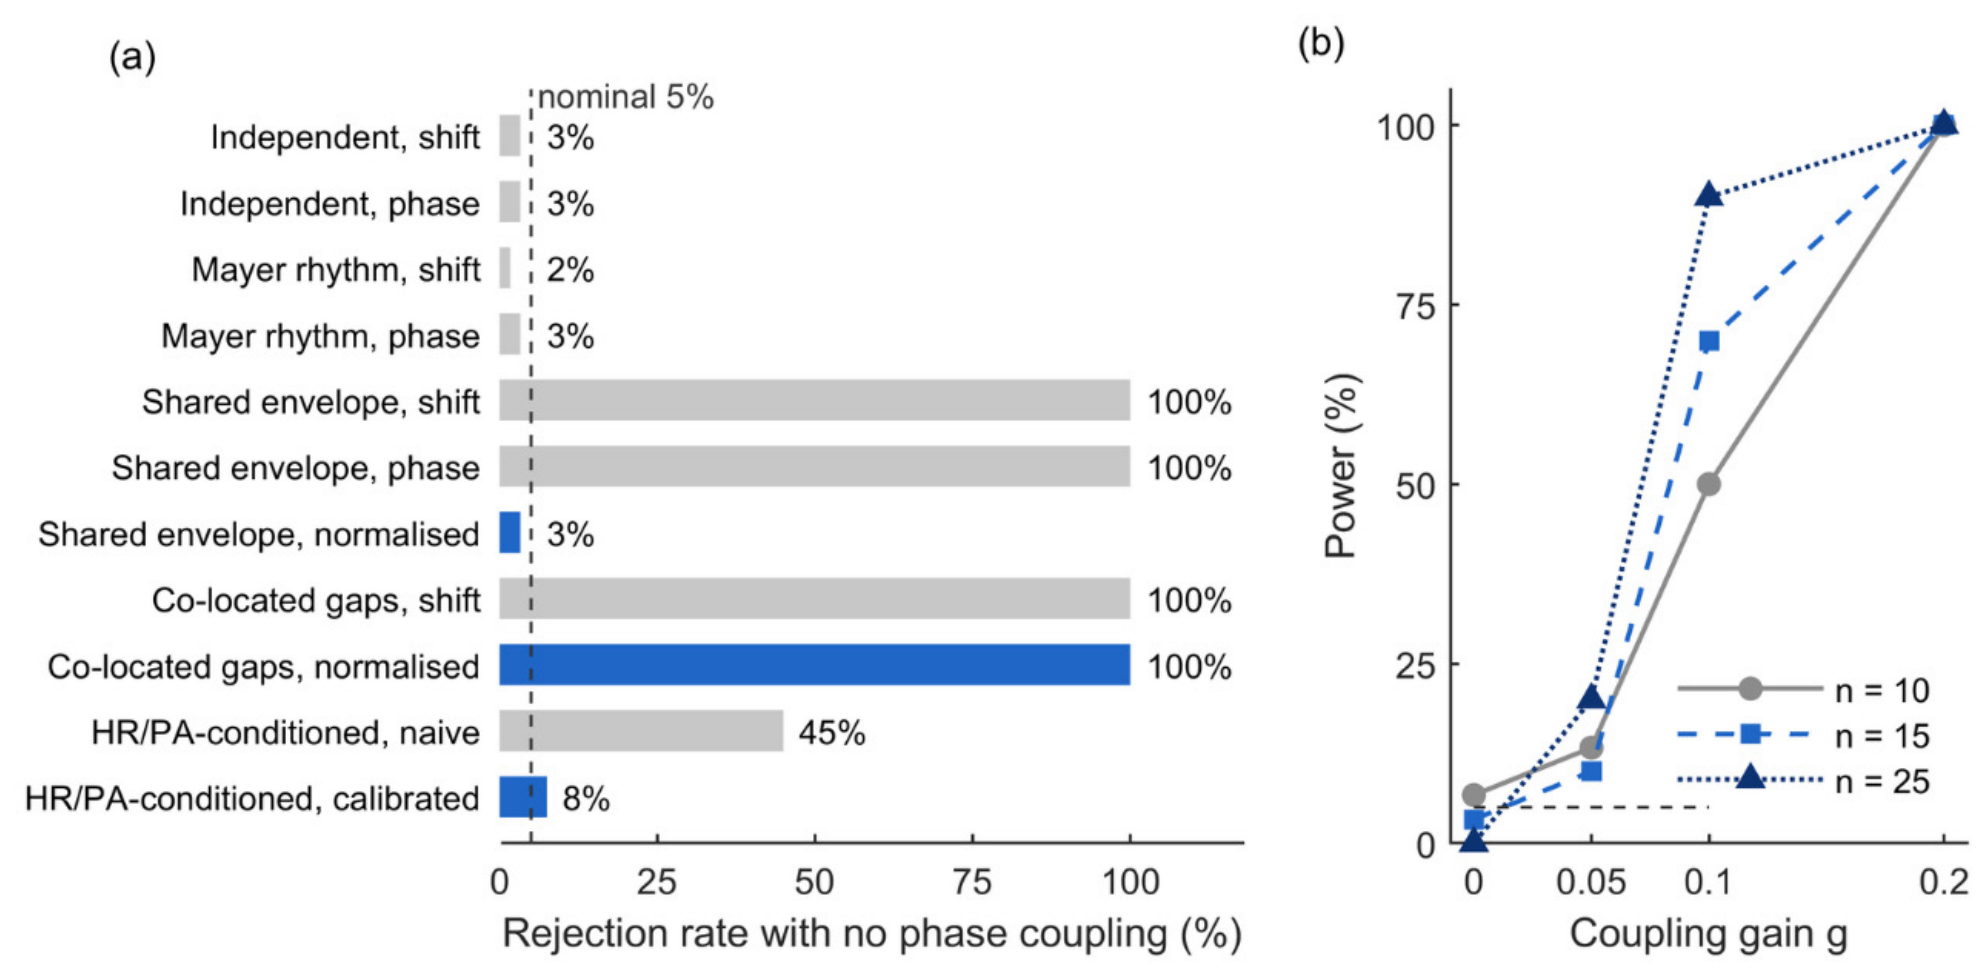
Table 1.
Participants, RETRAIN Phase 1, overall and by documented history of atrial fibrillation (AF), from the de-identified participant table. Coupling set: participants with at least one block meeting the coherence quality criteria.
Table 1.
Participants, RETRAIN Phase 1, overall and by documented history of atrial fibrillation (AF), from the de-identified participant table. Coupling set: participants with at least one block meeting the coherence quality criteria.
| Characteristic | Enrolled (n = 18) | Coupling set (n = 15) | History of AF (n = 6) | No history of AF (n = 12) |
| Age, years, mean (SD) | 75.6 (12.7) | 76.1 (12.8) | 82.8 (9.4) | 72.0 (12.9) |
| Men / women | 10 / 8 | 9 / 6 | 5 / 1 | 5 / 7 |
| NIHSS, median [IQR] | 3 [1,2,3,4,5,6] (n = 17) | 2.5 [1-4.75] (n = 14) | 6.5 [2.75-8.75] (n = 6) | 3 [1,2,3,4] (n = 11) |
| Days from stroke to recording, median [IQR] † | 27 [23,24,25,26,27,28,29,30,31,32,33,34,35,36,37,38,39,40,41,42,43,44,45,46,47,48,49,50,51,52] (n = 17) | 31 [25,26,27,28,29,30,31,32,33,34,35,36,37,38,39,40,41,42,43,44,45,46,47,48,49] (n = 14) | 30 [22,23,24,25,26,27,28,29,30,31,32,33,34,35,36,37,38,39,40,41,42,43,44,45,46,47,48,49,50] (n = 6) | 27 [25,26,27,28,29,30,31,32,33,34,35,36,37,38,39,40,41,42,43,44,45,46] (n = 11) |
| OCSP: TACS / PACS / LACS / POCS | 7 / 4 / 3 / 4 | 5 / 4 / 2 / 4 | 4 / 1 / 0 / 1 | 3 / 3 / 3 / 3 |
| Largest lesion < 1.5 / 1.5-5 / > 5 cm | 4 / 9 / 5 | 3 / 9 / 3 | 1 / 1 / 4 | 3 / 8 / 1 |
| Aetiology: cardioembolic / cryptogenic / large-artery / small-vessel / other / not recorded | 8 / 4 / 2 / 2 / 1 / 1 | 7 / 3 / 2 / 1 / 1 / 1 | 4 / 1 / 1 / 0 / 0 / 0 | 4 / 3 / 1 / 2 / 1 / 1 |
| Hypertension ‡ / atrial fibrillation / diabetes | 9 / 6 / 5 | 9 / 4 / 4 | 3 / 6 / 1 | 6 / 0 / 4 |
| Autoregulatory dysfunction flag, any posture | 7 (4 not assessed) | 6 (3 not assessed) | 0 (4 not assessed) | 7 (0 not assessed) |
| Holter mean heart rate, bpm, mean (SD) | 75 (9), n = 14 | 73 (9), n = 12 | 74 (9), n = 2 | 75 (10), n = 12 |
† PID 16 is excluded from the interval summary because its stroke-to-recording interval could not be verified from the de-identified source record. Aetiology was not recorded for one participant. ‡ Hypertension: Phase 1 count of 9/18 [8].
Table 2.
Physiological families: operationally distinct domains, their constructs and representative measures. Each family differs from every other in at least two of end-organ, efferent pathway, time scale and class of statistic, the families can share underlying mechanisms (for example, baroreflex and sympathetic vasomotor control). Corroborating measures share all four respects with the representative and are reported but not tested. Families 2-4 and the corroborating LF measure are derived from the optical cardiac pulse and assume a regular rhythm.
Table 2.
Physiological families: operationally distinct domains, their constructs and representative measures. Each family differs from every other in at least two of end-organ, efferent pathway, time scale and class of statistic, the families can share underlying mechanisms (for example, baroreflex and sympathetic vasomotor control). Corroborating measures share all four respects with the representative and are reported but not tested. Families 2-4 and the corroborating LF measure are derived from the optical cardiac pulse and assume a regular rhythm.
| Family | Construct and dominant pathway | Representative measure | Corroborating measures |
| 1 Mayer-band optical oscillation | Candidate autonomic/baroreflex contribution to 0.1-Hz optical power [17,18] | ln HbO power, 0.07-0.13 Hz | LF pulse-interval variability (cardiac arm of the same loop [41]) |
| 2 Optical vascular pulsatility | Potential sympathetic influence on optically measured pulsatility, source unconfirmed [19,43] | Optical pulse amplitude (% change) | — |
| 3 Cardiac chronotropic tone | Net vagal and sympathetic set-point of the sinoatrial node | Heart rate (bpm) | — |
| 4 Cardiac-haemodynamic coupling | Covariation of slow heart-rate and optical haemodynamic fluctuations [28,44] | HR-HbO excess coherence, 0.07-0.13 Hz | Raw HR-HbO coherence, HR-global excess coherence, 0.02-0.10 Hz |
| 5 Respiratory-haemodynamic coupling | Respiratory modulation of venous return and blood volume [21] | Slow global HbO variance explained by the respiratory envelope, above shifted controls | — |
| 6 Arterial CO₂ | Ventilation, chemoreflex and cerebrovascular CO₂ reactivity [20,45] | Block-mean tcCO₂ (mmHg) | — |
| 7 EEG-leading HR association | Predictive EEG-leading heart-rate asymmetry, common driver possible [22] | Net TRGC, EEG envelope to HR (z) | EEG-HR excess coherence |
| 8 EEG-haemodynamic coupling | EEG-envelope covariation with haemodynamics, cortical and global-state contributions unresolved [24,26] | EEG-local HbO excess coherence, reference specification | EEG-global HbO excess coherence, net TRGC, EEG to local HbO |
Table 7.
Physiological families with and without the participants with a history of atrial fibrillation (change from the same-posture baseline, participant means, 95% bootstrap CI, exact sign-flip p, unadjusted, BH q for all participants in Table 6, difference rows: no-AF minus AF participants, exact permutation p).
Table 7.
Physiological families with and without the participants with a history of atrial fibrillation (change from the same-posture baseline, participant means, 95% bootstrap CI, exact sign-flip p, unadjusted, BH q for all participants in Table 6, difference rows: no-AF minus AF participants, exact permutation p).
| Family | Measure | Participants | Stimulation vs baseline | First exposure (Optimal − later) | Optimal+1 − Optimal |
| Mayer-band optical oscillation | Mayer-band HbO power (ln) | All | +0.025 (−0.212 to +0.256), p 0.84, n = 16 | −0.493 (−0.812 to −0.143), p 0.015, n = 16 | +0.510 (+0.295 to +0.742), p < 0.001, n = 16 |
| Mayer-band optical oscillation | Mayer-band HbO power (ln) | No AF history | +0.057 (−0.264 to +0.348), p 0.73, n = 11 | −0.456 (−0.878 to +0.008), p 0.091, n = 11 | +0.491 (+0.274 to +0.719), p 0.003, n = 11 |
| Mayer-band optical oscillation | Mayer-band HbO power (ln) | Difference, no AF − AF (exact permutation p) | +0.101, p 0.72, n = 11 vs 5 | +0.119, p 0.77, n = 11 vs 5 | −0.062, p 0.82, n = 11 vs 5 |
| Optical vascular pulsatility | Optical pulse amplitude (%) | All | +2.92 (−2.31 to +7.69), p 0.29, n = 14 | −7.72 (−13.06 to −1.98), p 0.023, n = 14 | +2.29 (−1.31 to +5.59), p 0.23, n = 14 |
| Optical vascular pulsatility | Optical pulse amplitude (%) | No AF history | +6.27 (+1.76 to +10.02), p 0.023, n = 11 | −12.04 (−15.99 to −8.07), p < 0.001, n = 11 | +5.06 (+2.61 to +7.51), p 0.005, n = 11 |
| Optical vascular pulsatility | Optical pulse amplitude (%) | Difference, no AF − AF (exact permutation p) | +15.67, p 0.014, n = 11 vs 3 | −20.15, p 0.003, n = 11 vs 3 | +12.95, p 0.003, n = 11 vs 3 |
| Cardiac chronotropic tone | Heart rate (bpm) | All | −0.34 (−1.40 to +0.72), p 0.55, n = 14 | +0.08 (−0.63 to +0.99), p 0.89, n = 14 | +0.21 (−0.32 to +0.70), p 0.45, n = 14 |
| Cardiac chronotropic tone | Heart rate (bpm) | No AF history | −0.56 (−1.77 to +0.59), p 0.42, n = 11 | +0.16 (−0.66 to +1.23), p 0.86, n = 11 | +0.36 (−0.23 to +0.91), p 0.27, n = 11 |
| Cardiac chronotropic tone | Heart rate (bpm) | Difference, no AF − AF (exact permutation p) | −1.05, p 0.46, n = 11 vs 3 | +0.39, p 0.71, n = 11 vs 3 | +0.74, p 0.28, n = 11 vs 3 |
| Cardiac-haemodynamic coupling | HR-HbO excess coherence | All | −0.034 (−0.105 to +0.034), p 0.36, n = 14 | +0.043 (−0.002 to +0.085), p 0.082, n = 14 | +0.023 (−0.053 to +0.098), p 0.57, n = 14 |
| Cardiac-haemodynamic coupling | HR-HbO excess coherence | No AF history | −0.061 (−0.135 to +0.013), p 0.15, n = 11 | +0.052 (+0.005 to +0.096), p 0.063, n = 11 | +0.004 (−0.083 to +0.093), p 0.94, n = 11 |
| Cardiac-haemodynamic coupling | HR-HbO excess coherence | Difference, no AF − AF (exact permutation p) | −0.126, p 0.18, n = 11 vs 3 | +0.038, p 0.53, n = 11 vs 3 | −0.091, p 0.37, n = 11 vs 3 |
| Respiratory-haemodynamic coupling | Respiration-explained HbO variance | All | −0.038 (−0.109 to +0.027), p 0.31, n = 13 | +0.023 (−0.053 to +0.098), p 0.58, n = 13 | −0.040 (−0.127 to +0.039), p 0.40, n = 13 |
| Respiratory-haemodynamic coupling | Respiration-explained HbO variance | No AF history | −0.064 (−0.136 to +0.004), p 0.12, n = 11 | −0.001 (−0.073 to +0.068), p 0.99, n = 11 | −0.007 (−0.075 to +0.064), p 0.84, n = 11 |
| Respiratory-haemodynamic coupling | Respiration-explained HbO variance | Difference, no AF − AF (exact permutation p) | −0.169, p 0.090, n = 11 vs 2 | −0.152, p 0.21, n = 11 vs 2 | +0.209, p 0.10, n = 11 vs 2 |
| Arterial CO₂ | tcCO₂ (mmHg) | All | −0.73 (−1.53 to −0.02), p 0.12, n = 9 | +0.15 (−0.51 to +0.73), p 0.66, n = 9 | −0.35 (−0.68 to −0.01), p 0.086, n = 9 |
| Arterial CO₂ | tcCO₂ (mmHg) | No AF history | −0.89 (−1.69 to −0.15), p 0.10, n = 8 | +0.40 (−0.05 to +0.87), p 0.16, n = 8 | −0.47 (−0.76 to −0.17), p 0.023, n = 8 |
| Arterial CO₂ | tcCO₂ (mmHg) | Difference, no AF − AF (exact permutation p) | n = 8 vs 1 | n = 8 vs 1 | n = 8 vs 1 |
| EEG-leading HR association | EEG to HR Granger asymmetry (z) | All | +0.53 (+0.15 to +0.95), p 0.031, n = 13 | −0.29 (−1.08 to +0.71), p 0.57, n = 13 | +0.51 (−0.30 to +1.18), p 0.22, n = 13 |
| EEG-leading HR association | EEG to HR Granger asymmetry (z) | No AF history | +0.63 (+0.20 to +1.10), p 0.025, n = 11 | −0.16 (−1.09 to +0.99), p 0.79, n = 11 | +0.39 (−0.51 to +1.18), p 0.42, n = 11 |
| EEG-leading HR association | EEG to HR Granger asymmetry (z) | Difference, no AF − AF (exact permutation p) | +0.69, p 0.22, n = 11 vs 2 | +0.84, p 0.51, n = 11 vs 2 | −0.82, p 0.42, n = 11 vs 2 |
| EEG-haemodynamic coupling | EEG-local HbO excess coherence | All | +0.014 (−0.009 to +0.039), p 0.28, n = 14 | −0.009 (−0.042 to +0.026), p 0.63, n = 14 | −0.022 (−0.074 to +0.030), p 0.44, n = 14 |
| EEG-haemodynamic coupling | EEG-local HbO excess coherence | No AF history | +0.016 (−0.014 to +0.045), p 0.34, n = 11 | +0.002 (−0.034 to +0.038), p 0.93, n = 11 | −0.030 (−0.084 to +0.021), p 0.32, n = 11 |
| EEG-haemodynamic coupling | EEG-local HbO excess coherence | Difference, no AF − AF (exact permutation p) | +0.006, p 0.86, n = 11 vs 3 | +0.049, p 0.27, n = 11 vs 3 | −0.040, p 0.57, n = 11 vs 3 |
| Mayer-band optical oscillation (corroborating) | LF pulse-interval variability (ln) | All | +0.169 (−0.085 to +0.438), p 0.25, n = 14 | −0.284 (−0.562 to −0.020), p 0.073, n = 14 | +0.496 (+0.161 to +0.892), p 0.013, n = 14 |
| Mayer-band optical oscillation (corroborating) | LF pulse-interval variability (ln) | No AF history | +0.132 (−0.166 to +0.464), p 0.47, n = 11 | −0.201 (−0.511 to +0.100), p 0.26, n = 11 | +0.467 (+0.090 to +0.916), p 0.042, n = 11 |
| Mayer-band optical oscillation (corroborating) | LF pulse-interval variability (ln) | Difference, no AF − AF (exact permutation p) | −0.172, p 0.63, n = 11 vs 3 | +0.387, p 0.29, n = 11 vs 3 | −0.135, p 0.82, n = 11 vs 3 |
Table 8.
Four classes of EEG-HbO interaction, what each predicts and what this study shows.
| Interaction | Predicts | Evidence here | Reading |
| 1. Direct neuronal regulation of cerebral haemodynamics (cortical neurovascular coupling) | Coupling stronger at the ROI than in the global, unchanged or sharpened by GSR, oxygenation-type HbO-HbR signature, EEG leads HbO and survives cardiac conditioning, may track stimulus intensity | EEG-local ~ EEG-global (+0.034 versus +0.032), GSR left EEG-local unchanged (−0.006, −0.019 to 0.008), RETRAIN HbO and HbR positively correlated (local r = +0.47), EEG to HbO asymmetry after HR/PA conditioning +0.35 (Holm 0.065), no change with intensity or exposure | Not the dominant route, not excluded |
| 2. Common neural-autonomic state | Shared amplitude modulation, EEG leads both heart rate and HbO, similar coupling to local and global, stable across stimulation conditions, persists after cardiac conditioning | envelope normalisation removed 36-63% of coherence, EEG to HR z = +0.64 and EEG to HbO +0.38 during stimulation, EEG-global coupling persisted after HR/PA conditioning (+0.017), coupling stable across stimulation, intensity and exposure | Most consistent with the data, but not uniquely identified |
| 3. Vascular and systemic influences generating cross-modal association | Zero lag or HbO leading EEG, carried by HR, PA or Mayer waves, removed by cardiac conditioning or lagged GSR | Net asymmetry ran from EEG to haemodynamics, conditioned coupling persisted, lagged GSR reduced Mayer-band coupling in 2 of 24 trimmed tests | Possible, not separable from interaction 2 without independent cardiovascular measures |
| 4. A mixture | Partial support for each | Phase-consistent coupling remained after normalisation (+0.017 to +0.022), the conditioned HbO asymmetry was marginal | Likely, not separable without short channels and peripheral sympathetic measures |
Disclaimer/Publisher’s Note: The statements, opinions and data contained in all publications are solely those of the individual author(s) and contributor(s) and not of MDPI and/or the editor(s). MDPI and/or the editor(s) disclaim responsibility for any injury to people or property resulting from any ideas, methods, instructions or products referred to in the content. |
© 2026 by the authors. Licensee MDPI, Basel, Switzerland. This article is an open access article distributed under the terms and conditions of the Creative Commons Attribution (CC BY) license (http://creativecommons.org/licenses/by/4.0/).
Copyright: This open access article is published under a Creative Commons CC BY 4.0 license, which permit the free download, distribution, and reuse, provided that the author and preprint are cited in any reuse.