

Submitted:
13 November 2026
Posted:
17 November 2026
You are already at the latest version
Abstract
Mechanical connections govern load transfer, flexibility and survivability in modular offshore floating photovoltaic systems. This study experimentally characterised three connection systems: polyurethane hinges between adjacent photovoltaic modules, steel-wire-rope assemblies between floating-breakwater units, and flexible transition connections between the breakwater and the photovoltaic array. Polyurethane specimens and complete hinges were tested under tensile, compressive, shear and torsional loading. The wire-rope and transition assemblies were tested under monotonic quasi-static tension to failure.The polyurethane showed nonlinear elastomeric behaviour and high deformation capacity. Complete hinges reached a mean ultimate tensile load of 3.69 kN, while global buckling occurred at comparatively low compressive loads, identifying geometric stability as a critical design limitation. The shear and torsion tests provided stiffness and large-deformation data but were not continued to failure. The steel-wire-rope assemblies reached a mean ultimate load of 402 kN, with four of five failures governed by the terminations rather than the wire body. Five valid breakwater-to-module connection tests produced a mean ultimate load of 40.88 kN, approximately 2.7% below the 42 kN design requirement. Protection of the bracket-rope interface reduced local abrasion, and the final two specimens reached 43.7 and 42.9 kN, respectively.The results provide experimentally derived, direction-dependent stiffness data and identify the governing failure mechanisms of the complete connection assemblies. The findings demonstrate that nominal material or component capacities alone are insufficient for connection qualification because geometry, terminations and contact interfaces can govern performance. The polyurethane hinge requires redesign to improve tensile capacity and compression stability, while the wire-rope terminations and breakwater-to-module interface require further optimisation. Fatigue testing, marine ageing, combined-load assessment and testing with the final installed fixtures are required before offshore qualification.
Keywords:
offshore floating photovoltaics
; mechanical connections
; polyurethane hinge
; floating breakwater
; wire-rope assembly
; ultimate strength
; digital image correlation
; experimental characterisation
1. Introduction
Floating photovoltaic (FPV) systems are increasingly being considered as a complement to land-based solar generation because they avoid direct competition for land and can make productive use of reservoirs, lakes, coastal waters and other water surfaces. Most commercial FPV installations are currently located in sheltered inland environments, but growing interest in near-shore and offshore deployment has stimulated the development of larger and more robust floating structures. Offshore deployment offers access to extensive areas and potential co-location with offshore wind, substations and electrical export infrastructure. However, it also exposes FPV systems to more severe wind, wave and current loads, saltwater corrosion, ultraviolet radiation, biofouling and restricted maintenance access [1,2,3,4]. Recent reviews identify extreme-environment survivability and understanding of fluid–structure interaction as major challenges for the large-scale implementation of offshore FPV [1,2].
Existing FPV recommended practice provides lifecycle guidance covering system design, development, operation and decommissioning [4]. However, DNV-RP-0584 focuses primarily on sheltered inland waters and reasonably protected near-shore locations with significant wave heights up to approximately 2–3 m. Offshore sites and locations with harsher conditions are explicitly outside its principal scope, although parts of the document may be applied as general guidance [4]. Offshore FPV connection systems must therefore be qualified using engineering methods, environmental criteria and experimental evidence appropriate to the intended deployment site.
Offshore FPV farms are generally assembled from many buoyant modules connected into large arrays and secured by mooring and anchoring systems. Their global response cannot be determined solely from the behaviour of an individual floater because hydrodynamic interaction, structural coupling and load redistribution occur throughout the array. Multi-body interaction can alter module motions, connector forces and mooring tensions, and these effects may vary according to module position, wave period, wave direction and array size [5,6]. Numerical studies of multi-module FPV systems have shown that the largest connection loads may occur within the interior of an array and that releasing selected rotational constraints can reduce load transfer between adjacent floats [5]. Other investigations have demonstrated that the inclusion of multi-body interaction can increase local module motions while modifying and, in some cases, reducing maximum mooring tensions [6].
The mechanical characteristics of the connectors are therefore central to the hydrodynamic and structural performance of modular FPV arrays. Connector type, stiffness, degrees of freedom and spatial arrangement influence natural frequencies, array deformation, relative module motions and the forces transmitted between floating bodies [5,6,7,8,9]. Increasing connector stiffness may suppress some module motions, particularly within the interior or leeward region of an array, but it may also increase force transfer and local stress concentrations [7,8]. Conversely, highly flexible connectors may accommodate wave-induced motion but allow excessive relative displacement, impact, buckling or loss of array geometry. The connection system must consequently provide an appropriate compromise between flexibility, load-transfer capacity and fatigue resistance.
Studies comparing rigid, hinged and elastic connectors reinforce the importance of connection-specific characterisation. Numerical analysis of rigid connectors has shown that connector constraints influence both module motions and connection loads, with the response changing as the number of connected floats increases [5]. Analyses of elastically connected offshore FPV structures have likewise found that flexible connections can provide benefits under extreme waves, but may experience higher local tension demands that require careful design [9]. Such findings indicate that assumed connector stiffness or nominal material properties are insufficient for reliable system-level analysis. The load–deformation behaviour of the installed connection, including fixtures, fasteners, terminations and contact interfaces, must be represented in the numerical model.
Physical testing is also essential for validating numerical assumptions and identifying behaviours that simplified models may not capture. In the SUREWAVE project, 1:10-scale wave-basin experiments were performed on a multi-body FPV array protected by an external floating breakwater. The programme required careful scaling of the elastic properties of the joints connecting the PV modules because joint stiffness directly affected array motion and hinge loads [10]. The tests showed that the floating breakwater reduced high-frequency wave energy and associated hinge loads, while also identifying compression-induced hinge buckling as an important design issue. The experimental dataset subsequently supported hydrodynamic-model validation and redesign of the FPV connection system [10,11].
Connection testing must consider the complete load path rather than only the nominal strength of the constituent material. This consideration is especially important for wire-rope assemblies, in which the termination, socket, clamp or local bending region may govern the capacity of the assembled connection. Offshore wire ropes may experience stress concentration, relative wire movement, cyclic bending, wear, corrosion and termination-related damage [12,13]. Experimental research on marine rope systems has shown that termination configuration can materially affect tensile capacity and repeatability [12]. Consequently, qualification of a breakwater connection should include the complete rope-and-termination assembly under representative boundary conditions rather than relying solely on the manufacturer’s nominal rope rating.
A similar consideration applies to polymeric and elastomeric hinges. Polyurethane can accommodate large deformations and provide flexibility and energy dissipation, but its mechanical response is strongly nonlinear and may exhibit hysteresis, rate dependence, cyclic softening and different behaviour under tension, compression and shear [14]. Component geometry, fixture stiffness and manufacturing details can therefore influence hinge response independently of the bulk material properties. The absence of standardised methods for many custom flexible hinges further supports the use of adapted test procedures and bespoke fixtures to characterise stiffness over the required deformation range [15].
Digital image correlation (DIC) provides a useful complement to conventional load and crosshead-displacement measurements in such tests. DIC is a non-contact optical method that measures full-field surface displacement and strain and has been applied extensively in laboratory testing of structural components, joints, polymers and composite materials [16]. For highly deformable or geometrically complex connections, DIC can reveal localised strain, non-uniform deformation, slip and the onset of instability that may not be evident from global machine measurements alone.
The SUREWAVE1 concept combines a modular, low-profile FPV array with an external floating breakwater intended to attenuate incident wave energy and reduce environmental loading on the protected modules. The integrated architecture includes flexible connections between adjacent FPV modules, connections joining neighbouring breakwater units, and transition connections transferring loads between the breakwater and the internal FPV array. The project uses numerical simulations and wave-basin experiments to understand the coupled behaviour of these elements under offshore conditions.
Three connection types were identified as critical to the integrated system:
- Polyurethane hinges connecting adjacent FPV modules;
- Steel-wire-rope assemblies connecting neighbouring floating-breakwater units; and
- Purpose-designed flexible transition connections between the floating breakwater and the FPV array.
These connections perform different structural functions. The polyurethane hinges must permit relative rotation and displacement while transferring cyclic tensile, compressive and shear loads. The steel-wire assemblies maintain breakwater continuity and transfer comparatively high tensile forces. The transition connections must accommodate differences in the motion of the heavy breakwater and lightweight FPV array without transmitting excessive forces or moments to the solar modules. A failure in any of these systems could lead to load redistribution, loss of array geometry, local collision, separation of components or reduced system survivability.
Despite their importance, full-scale experimental data describing the directional stiffness, deformation capacity, ultimate resistance and governing failure modes of customised offshore FPV connections remain limited in the open literature. Most available studies concentrate on numerical hydrodynamics or scaled-array response, while connection properties are commonly represented using assumed linear or nonlinear stiffness values [5,6,7,8,9]. This creates uncertainty when transferring numerical predictions to prototype-scale design and limits confidence in component qualification.
The present study addresses this gap through experimental characterisation of the three critical connection systems developed for the SUREWAVE concept. Polyurethane material specimens and complete hinges were tested under tensile, compressive, shear and torsional loading. Tensile testing was continued to failure to determine ultimate capacity and deformation behaviour, whereas the shear and torsion tests primarily characterised stiffness and large-deformation response. The steel-wire-rope and breakwater-to-FPV assemblies were subjected to quasi-static tensile loading to establish their ultimate capacity and governing failure modes.
Standard procedures were used where directly applicable. However, two of the connection systems incorporated custom geometries and combinations of polymeric, metallic and rope components that could not be represented adequately using standard material tests alone. Adapted procedures and tailor-made fixtures were therefore developed to reproduce the intended load paths and boundary conditions. DIC and camera-based measurements were used during selected tests to quantify local deformation and supplement the conventional force and displacement measurements.
The specific objectives were to:
- characterise the tensile, compressive, shear and torsional response of the polyurethane hinges;
- measure the ultimate tensile resistance of the complete hinge, steel-wire and transition-connection assemblies;
- identify whether failure was governed by the principal material, fixture, termination or contact interface;
- compare measured capacities with the relevant predicted design demands;
- derive stiffness parameters for numerical modelling and scaled wave-basin testing; and
- identify connection modifications required before fatigue qualification and offshore deployment.
The study contributes full-scale component-level evidence for the engineering of modular offshore FPV systems. It also demonstrates why connection qualification must consider the complete assembly and installed load path, rather than relying exclusively on nominal material properties or component ratings. The results provide the experimental basis for subsequent hinge redesign, fatigue assessment and integrated wave-basin validation within SUREWAVE.
2. Materials and Methods
2.1. Connections Studied and Test Programme
Three connection systems considered critical to the structural performance of the SUREWAVE concept were investigated: polyurethane hinges between adjacent FPV modules, steel-wire-rope assemblies between neighbouring breakwater units, and flexible transition connections between the breakwater and FPV array.
2.1.1. Polyurethane Hinges Between FPV Modules
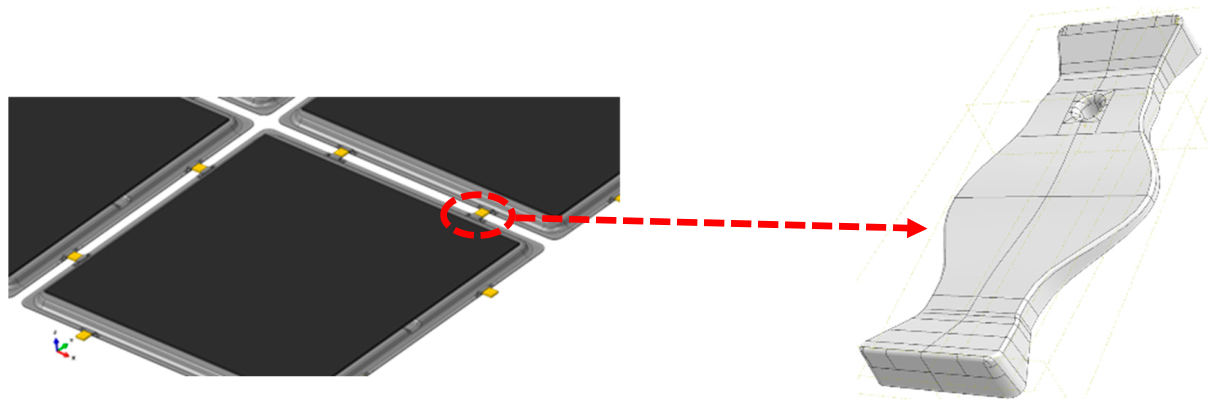
Adjacent FPV modules are connected by polyurethane (PU) hinges that provide load transfer while allowing relative motion between the floating bodies. Two hinges are installed along each side of a module, resulting in eight hinge connection points for an FPV module connected on all four sides.
The tested hinge was approximately 200 mm long and 100 mm wide. The central flexible region had a nominal thickness of approximately 5 mm, while the width and thickness increased towards the ends to accommodate attachment to the FPV-module fixtures. The non-uniform geometry was intended to provide flexibility in the central section while maintaining sufficient capacity at the attachment regions.
The hinge programme included material-level tensile testing and component-level testing under tension, compression, shear and torsion. The tensile tests were continued to failure to determine ultimate capacity and deformation behaviour. Compression testing was used to identify stiffness and loss of stability, while the shear and torsion tests primarily quantified directional stiffness and large-deformation response rather than ultimate strength.
Figure 1.
Polyurethane hinge connection between adjacent FPV modules and geometry of the tested hinge.
Figure 1.
Polyurethane hinge connection between adjacent FPV modules and geometry of the tested hinge.
2.1.2. Steel-Wire-Rope Connections Between Breakwater Units
Adjacent floating-breakwater units are connected by eight steel-wire-rope assemblies along each interface. Rubber pads positioned between the breakwater units maintain the required separation and reduce the likelihood of direct concrete-to-concrete impact. Because the pads were not identified as critical load-bearing components, the experimental programme focused on the steel-wire-rope assemblies.
Figure 2.
Steel-wire-rope assemblies connecting adjacent floating-breakwater units.
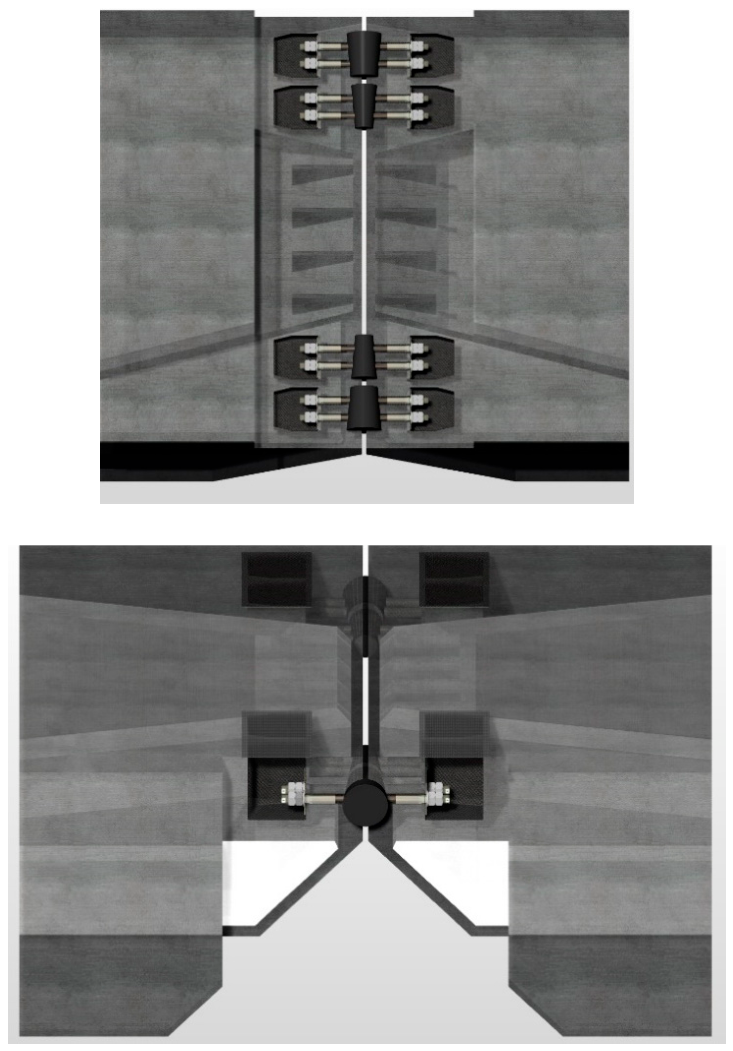
Each assembly comprised a six-strand steel wire rope with a bolted end fitting and insert at each extremity. The complete assembly, including the rope and terminations, was tested because the capacity of a marine rope connection may be governed by the socket, fastening arrangement or local stress concentration rather than by the nominal strength of the rope itself.
Quasi-static tensile tests were conducted to failure to establish the ultimate load and identify whether failure occurred within the wire rope, at the termination or at another part of the assembled connection.
2.1.3. Breakwater-to-FPV Transition Connection
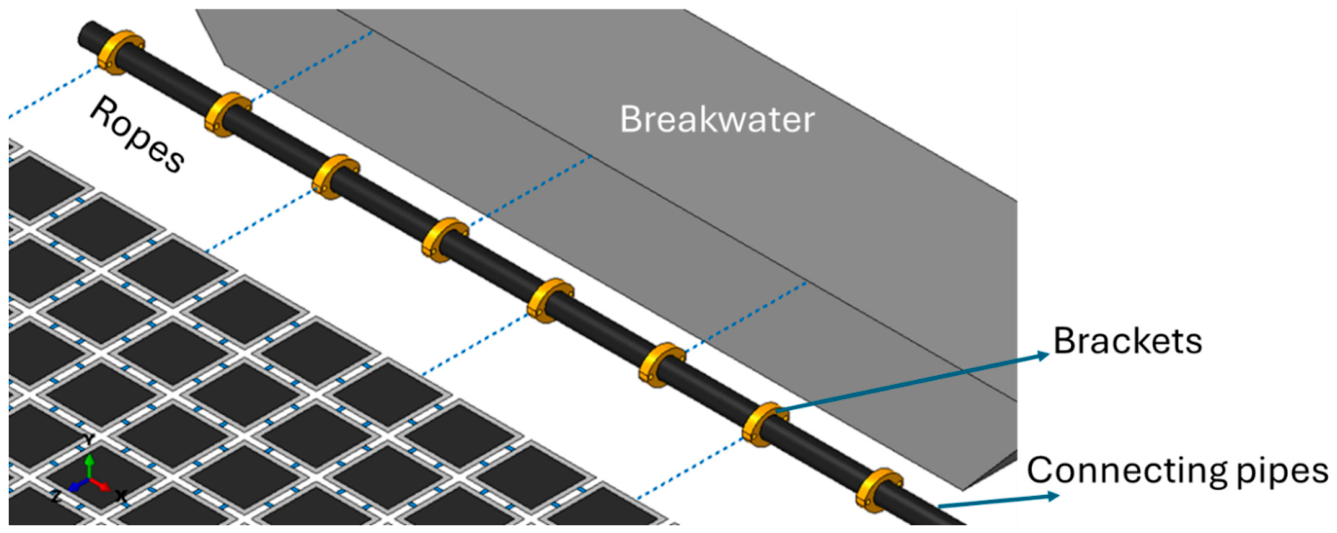
The transition system between the external floating breakwater and the internal FPV array consists of a polymer pipe positioned between the two floating systems. Brackets distributed along the pipe provide attachment points for flexible mooring lines connecting the transition element to either the breakwater or the FPV modules.
The transition element is intended to transfer horizontal loads while accommodating differences in the motions and natural periods of the comparatively heavy breakwater and lightweight FPV array. The complete bracket-rope assembly was therefore tested rather than evaluating the individual rope and bracket components separately. The geometry, material specifications and nominal capacities of the transition-system components are described in [5].
Six specimens were tested under quasi-static tensile loading. One test was excluded from the statistical evaluation because the specimen or test arrangement did not provide a valid representation of the intended connection behaviour. The reported sample therefore comprised five valid tests.
Figure 3.
Breakwater-to-FPV transition system, showing the polymer pipe, attachment brackets and flexible connecting ropes.
Figure 3.
Breakwater-to-FPV transition system, showing the polymer pipe, attachment brackets and flexible connecting ropes.
2.1.4. Test Matrix
Table 1 summarises the experimental programme. All tests were performed under monotonic, quasi-static loading. Three repetitions were conducted for each full-scale PU-hinge loading mode because of the limited number of available prototype components. The resulting sample sizes are suitable for preliminary engineering characterisation but are insufficient for deriving statistically established characteristic design resistances.
The loading rates were selected according to the applicable standard where available or, for custom connection geometries, to provide stable quasi-static loading and reliable measurement of deformation. Digital image correlation (DIC) was used in selected tests to obtain full-field surface displacement and strain measurements. Conventional extensometers or machine displacement measurements were used for the remaining tests.
The programme was designed to provide two types of experimental input. First, tests continued to failure established the ultimate capacity and governing failure mode of the tensile load paths. Second, the multi-directional PU-hinge tests provided stiffness and deformation parameters required for the numerical system models and the scaled wave-basin experiments. Because the connections incorporated custom combinations of elastomeric, metallic and rope components, bespoke fixtures were manufactured to reproduce the intended boundary conditions and load-transfer mechanisms as closely as practicable.
2.2. Tensile Tests on the Polyurethane Material
Dog-bone tensile specimens of ISO 527 type 1B, following ISO 527 [17], were machined from the uniform central region of the polyurethane hinges. Extracting the specimens directly from the manufactured hinges ensured that the measured response included the effects of the actual polyurethane formulation and manufacturing process.
The tests were performed using a Zwick Z030 universal testing machine equipped with a load cell suitable for a maximum force of 50 kN. Three nominal engineering strain rates were investigated to evaluate the strain-rate sensitivity of the polyurethane:
10−3s−1, corresponding to a crosshead speed of 0.025 mm/s;
10−2s−1, corresponding to 0.25 mm/s; and
10−1s−1, corresponding to 2.5 mm/s.
Seven specimens were tested in total: one at 10−3s−1, three at 10−2s−1, and three at 10−1s−1. The lowest strain rate was represented by one specimen only and was therefore used to indicate the response trend rather than to establish statistically representative material properties.
Full-field deformation measurement
Surface strains and displacements were measured using two-dimensional digital image correlation (DIC) [18]. Before testing, a high-contrast random speckle pattern was applied to the visible surface of each specimen. Images were acquired using a Basler camera at 2 frames per second, with an average image resolution of approximately 900 × 2,980 pixels. The camera acquisition was synchronised with the force and crosshead-displacement records from the testing machine.
The recorded images were processed using the eCorr DIC software [19]. Identical virtual extensometers were defined for all specimens to ensure consistent comparison. A longitudinal virtual extensometer extended across the gauge length, while a transverse virtual extensometer measured the change in specimen width. Small offsets resulting from specimen positioning, initial alignment and load take-up were removed before evaluating the stress–strain response.
The engineering elongation, e, was calculated as:
where l0 is the initial length of the longitudinal virtual extensometer and l is its instantaneous length.
The longitudinal true strain was calculated as:
The transverse true strain was obtained from the change in specimen width:
where w0 and w are the initial and instantaneous widths measured by the transverse virtual extensometer.
The instantaneous Poisson’s ratio was then evaluated as:
The true stress was calculated from:
where F is the instantaneous tensile force and A is the estimated instantaneous cross-sectional area. The instantaneous cross-sectional area was estimated by assuming incompressibility and equal transverse contraction in the width and thickness directions. The reported true-stress values are therefore estimates based on this assumption.
Because polyurethane exhibits nonlinear elastomeric behaviour, a single constant Young’s modulus does not adequately represent the complete response. An apparent secant modulus was therefore evaluated at selected strain levels:
This definition enables comparison of material stiffness at common strain levels while recognising the nonlinear and strain-rate-dependent behaviour of the polyurethane.
2.3. Tests on the Full Polyurethane Hinges
Full-scale hinge components were tested under tensile, compressive, shear and torsional loading. Three nominally identical hinges were tested in each loading mode. Bespoke fixtures were manufactured because the hinge thickness and width vary towards the attachment regions and conventional flat grips could not reproduce the installed boundary conditions.
2.3.1. Tensile Loading
The hinge tensile tests were performed using an Instron universal testing machine with a 250 kN capacity. The specimens were loaded at a constant crosshead speed of 1.44 mm/s until failure.
The custom clamping system restrained the enlarged hinge extremities while leaving the flexible central region free to deform. The fixture geometry is shown in Appendix A, Figure A1. The DIC arrangement described in Section 2.2 was used to obtain full-field displacement and strain measurements and to identify any localisation of deformation before rupture.
The tensile secant stiffness at a specified displacement, u, was calculated as:
where F(u) is the measured tensile force at displacement u. Because the force–displacement response was nonlinear, stiffness values were evaluated at defined displacement or deformation levels rather than represented by a single constant value.
The tests provided:
the complete force–displacement relationship;
deformation localisation within the flexible hinge region;
secant stiffness values for system-level modelling;
ultimate tensile load;
displacement at failure; and
the governing tensile failure mode.
2.3.2. Compressive Loading
Compression tests were conducted using the same 250 kN Instron machine and the same end-restraint arrangement as in the tensile tests. The specimens were loaded at 15 mm/min, equivalent to 0.25 mm/s.
The objective was to characterise the initial compressive stiffness and identify the onset of geometric instability. Because the hinge is thin and flexible, the observed maximum load represents the load at which the component lost stability through global buckling, rather than an intrinsic compressive strength of the polyurethane.
The compressive secant stiffness was calculated as:
where Fc(u) is the compressive force at displacement u. Stiffness was evaluated at defined deformation levels before significant buckling occurred. The response after instability was interpreted with caution because it was strongly influenced by hinge geometry, fixture alignment and out-of-plane deformation.
2.3.3. Shear Loading
A dedicated shear fixture was manufactured to restrain the two enlarged hinge extremities while imposing relative transverse displacement between them. The tests were conducted using the 250 kN Instron machine at a crosshead speed of 30 mm/min.
Based on the dimensions of the central hinge region, the selected displacement rate corresponded to an approximate nominal shear-strain rate of 10−3s−1. A DIC speckle pattern was applied to the specimens to quantify the deformation field and detect localised shear strain.
The nominal engineering shear strain was estimated as:
where Δ the relative transverse displacement and h is the effective distance between the constrained hinge regions.
The corresponding secant shear stiffness was defined as:
where Fs is the measured shear force.
The shear tests were stopped before specimen failure. Consequently, the results provide stiffness and large-deformation characterisation but should not be interpreted as measurements of ultimate shear strength.
2.3.4. Torsional Loading
Torsion tests were conducted using an Instron biaxial testing machine. The same connection fixtures used for the tensile and compression tests were adapted to apply controlled relative rotation to the hinge ends.
The specimens were rotated at 50°/min to the machine limit of 150°. The axial positions of the grips were prescribed during rotation. Because the hinge geometry couples rotational and axial deformation, tensile axial force developed as the hinge was twisted.
The torsional secant stiffness was evaluated as:
where M is the measured torque and θ is the relative rotation expressed in radians.
As the specimens did not fail before reaching the machine rotation limit, the reported results represent torsional stiffness, axial-force development and deformation behaviour up to 150°, rather than ultimate torsional capacity.
2.4. Tests on the Steel-Wire-Rope Assemblies
Five complete steel-wire-rope assemblies were tested under quasi-static tension. Each specimen included the main six-strand wire rope and its end fittings so that the capacity and failure mode of the complete load path could be evaluated.
The measured rope diameters ranged from 26.95 to 27.84 mm. The specimens had a mean length of 448.4 mm and a nominal mean cross-sectional area of 586.9 mm². The nominal cross-sectional area of 586.9 mm² was calculated from the measured outside diameter by treating the rope envelope as a solid circle. It does not represent the metallic cross-sectional area of the individual wires. The method used to calculate the rope cross-sectional area should be specified, particularly whether the area represents the circumscribed circular area, nominal metallic area or another equivalent value.
Testing was performed using an Instron servo-hydraulic machine with a 500 kN capacity. A constant displacement rate of 2 mm/min was selected to maintain quasi-static loading and reduce the safety risks associated with sudden dynamic release at failure.
A purpose-built fixture consisting of two steel plates and a machined insert restrained one bolted end fitting at the upper side of the test frame. At the opposite end, the bolt was removed and the rope was held directly in the hydraulic grip. The arrangement is illustrated in Appendix A, Figure A2.
Force and actuator displacement were recorded continuously until failure. The experimental assessment considered:
- initial seating and slip within the end fittings;
- axial stiffness of the complete assembly;
- maximum tensile load;
- displacement at maximum load;
- failure location; and
- whether failure was governed by the rope body, socket or termination interface.
Because four of the five specimens subsequently failed by loosening or pull-out at the sockets, the measured capacity primarily represents the behaviour of the assembled termination system, rather than the intrinsic tensile strength of the steel wire rope alone.
2.5. Tests on the Breakwater-to-FPV Transition Connection
The tested assembly represented a section of the flexible transition system between the floating breakwater and the FPV array. Each specimen consisted of:
- a high-density polyethylene pipe with an outside diameter of 225 mm and a wall thickness of 20.5 mm;
- an 18 mm-diameter polyester mooring line; and
- a steel attachment bracket fixed around the pipe.
The pipe represented the buoyant transition element, while the bracket and rope reproduced the load-transfer path between the transition element and the neighbouring floating structures.
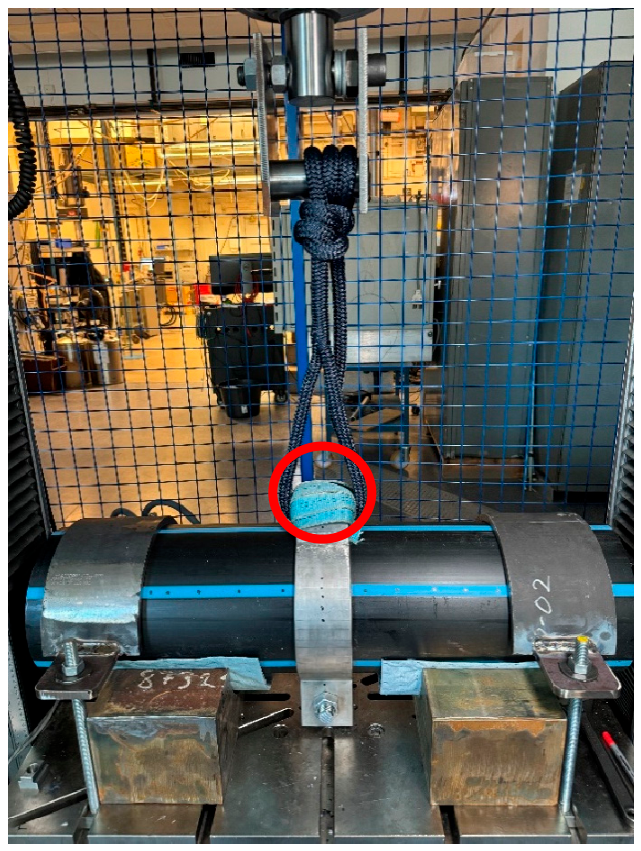
The two ends of the pipe were restrained at the base of the tensile-testing machine using a bespoke clamping arrangement. The clear distance between the pipe clamps was 500 mm. The polyester rope was connected to the moving machine traverse through a second custom fixture that permitted limited rotation, reducing unintended bending caused by minor alignment differences. The complete arrangement is shown in Appendix A, Figure A3.
Tests were conducted at a constant crosshead speed of 50 mm/min. Force and traverse displacement were recorded continuously until failure. Crosshead displacement was used as a global measure of connection deformation and therefore included rope extension, bracket deformation, pipe deformation, fixture compliance, seating and any local slip.
Six assemblies were tested. Early tests showed local rope wear at the bracket-rope contact region. To reduce premature abrasion and more closely represent a protected installed interface, a soft fabric insert was placed between the bracket and rope for Tests 4–6.
Six assemblies were tested. Connection 3 was excluded from the primary statistical summary because premature rope wear at the unprotected bracket interface caused failure outside the intended load-transfer condition. The result is reported separately for transparency, while the statistical analysis is based on the five remaining tests. The exclusion criterion was the occurrence of premature interface damage before development of the representative assembly response..
- The evaluation considered:
- the initial seating behaviour;
- global connection stiffness;
- maximum tensile load;
- displacement at maximum load;
- rope damage at the bracket interface;
- pipe or bracket deformation;
- failure location; and
- the effect of the protective fabric insert.
Testing the complete assembly was essential because the connection capacity could be governed by local bracket-rope contact, abrasion, bending or pipe deformation rather than by the nominal tensile capacity of the polyester rope. The results were therefore used to assess both the overall strength of the transition concept and the need for improvements to the bracket geometry and contact protection.
3. Results
3.1. Tensile Behaviour of the PU Material
Digital image correlation showed that deformation remained broadly uniform over the specimen gauge length during most of the tensile tests. No pronounced necking or local instability was observed before the onset of final rupture. The force–elongation and true stress–true strain curves in Figure 4 exhibit the highly nonlinear response expected for an elastomeric polyurethane. The response is characterised by a relatively compliant initial region, progressive strain hardening and large deformation before failure.
The pre-failure curves obtained at the three nominal strain rates were generally similar. This suggests that the polyurethane’s stiffness and overall stress–strain response were not strongly rate-sensitive within the investigated range of 10−3 to 10−1s−1. However, this conclusion should be treated as preliminary because only one specimen was tested at 10−3s−1, and considerable scatter was observed in the failure properties at 10−1s−1. The available results therefore do not support a formal statistical assessment of strain-rate effects on ultimate strength or elongation at break.
Evolution of Apparent Stiffness
The apparent secant modulus varied between approximately 20 and 70 MPa, confirming that the polyurethane cannot be represented by a single constant elastic modulus over its full deformation range. The modulus initially increased up to a strain of approximately 0.05, subsequently decreased towards a relatively stable intermediate-strain region, and increased again as strain hardening became dominant before failure.
For numerical modelling, the modulus should therefore be selected for the deformation range relevant to the intended loading condition. Alternatively, the measured nonlinear stress–strain curves should be used directly in an appropriate hyperelastic or nonlinear constitutive formulation.
At 5% strain, the mean apparent modulus was:
The corresponding coefficient of variation was approximately:
The comparatively low coefficient of variation indicates good repeatability of the material stiffness at small-to-moderate strain.
The measured Poisson’s ratio remained close to 0.5 over most of the evaluated deformation range, indicating approximately incompressible behaviour, as commonly observed in elastomeric materials. This result supports the use of a nearly incompressible constitutive model. Nevertheless, values close to 0.5 are sensitive to DIC resolution and transverse-strain measurement, and the assumptions used to estimate instantaneous thickness and cross-sectional area should be stated explicitly.
Failure Properties
The specimens exhibited high deformation capacity. The mean engineering elongation at break was 2.97, corresponding to a final gauge length of approximately 3.97l0. The mean true strain at break was 1.36. Even the lowest recorded elongation, 2.26, corresponded to a true strain of 1.18, confirming substantial ductility.
The mean true stress at break was:
The relatively large standard deviation corresponds to a coefficient of variation of approximately 32.8%. In comparison, the coefficient of variation for elongation at break was approximately 13.8%. Failure strength was therefore considerably more variable than the initial stiffness.
Specimens Rep6 and Rep7 failed at lower forces, elongations and true stresses than the remaining specimens. Their true stresses at break were 36.43 and 41.40 MPa, respectively, compared with 80.70–104.60 MPa for the other five specimens. This difference may indicate premature failure caused by machining damage, edge defects, local thickness variation or another specimen-specific imperfection. However, no specimen should be classified as an outlier or excluded without documented post-test examination and a predefined exclusion criterion.
The results in Table 2 indicate that material stiffness was repeatable, while ultimate strength was more sensitive to local defects and specimen preparation. This distinction is important for hinge design: the measured stress–strain curves provide useful constitutive input for modelling, but component qualification should account for manufacturing variability and should not rely solely on the mean material strength.
The polyurethane combines relatively low initial stiffness with large deformation capacity and pronounced strain hardening. These properties are beneficial for an FPV hinge because the component must accommodate relative motion between modules without transferring excessive loads during ordinary operation. At larger deformation, the increasing stiffness can provide additional resistance against excessive separation.
However, the material-level tensile results should not be interpreted directly as the strength of the complete hinge. The full component includes geometric transitions, enlarged attachment regions, fixtures and possible manufacturing imperfections. Its response under compression, shear and torsion is also governed by geometry and stability rather than by uniaxial tensile properties alone. The complete-hinge tests presented in the next section are therefore required to determine the actual connection stiffness, capacity and governing failure modes.
3.2. PU Hinges in Tension
The strain field in the hinges is not homogeneous because of their geometry (Figure 5). The full hinges exhibited a strongly non-uniform strain field because of the variation in width and thickness along the component. In all three tests, deformation progressively concentrated in the narrow central section. Failure occurred consistently within this minimum-width region, confirming that the geometric transition created the governing stress concentration. The repeatable failure location indicates that the tensile resistance of the original hinge was controlled primarily by its geometry rather than by the attachment fixtures.
The hinges underwent substantial deformation before rupture, consistent with the highly extensible behaviour observed in the polyurethane material tests. The force–displacement and force–elongation curves in Figure 6 show a repeatable nonlinear response with three principal regimes:
- Initial loading: The force increased rapidly to approximately 1 kN at a displacement of about 7 mm, corresponding to approximately 5% elongation.
- Intermediate deformation: Between approximately 5% and 100% elongation, the force continued to increase, but at a progressively lower secant stiffness.
- Large deformation and failure: Beyond approximately 100% elongation, the force increased more gradually until rupture occurred in the narrow central section.
The three curves were closely grouped during the initial and intermediate loading stages, indicating consistent stiffness among the specimens. Greater dispersion developed near failure, particularly in displacement and elongation at break. This behaviour is consistent with the greater sensitivity of ultimate failure to local material or geometric variations.
Ultimate Tensile Response
The three hinges reached ultimate tensile loads of 3.36, 3.64 and 4.08 kN, (see Table 3) giving a mean value of:
The coefficient of variation was approximately:
The mean displacement at break was 265.97 ± 48.30 mm, while the mean engineering elongation at break was 1.74 ± 0.31. An elongation of 1.74 means that the hinge gauge length increased by approximately 174% relative to its initial value before rupture.
The coefficients of variation for displacement and elongation at break were both approximately 18%, showing that failure deformation was more variable than ultimate load. Nevertheless, all specimens displayed high deformation capacity, with elongations at break ranging from 1.49 to 2.09.
Because only three specimens were tested, these results should be interpreted as preliminary sample statistics. They do not constitute a statistically established characteristic resistance or design capacity.
Tensile Stiffness
The secant tensile stiffness was evaluated at engineering elongations of 5%, 10%, 50% and 100%. The results confirm that hinge stiffness depends strongly on deformation level (see Table 4).
The mean secant stiffness decreased from 0.1148 kN/mm at 5% elongation to 0.0198 kN/mm at 100% elongation, representing a reduction of approximately:
This reduction does not indicate material degradation during the monotonic tests. Rather, it reflects the nonlinear geometry and elastomeric response of the complete hinge, for which displacement increases more rapidly than force over the intermediate deformation range.
The stiffness measurements were highly repeatable. The coefficients of variation were approximately:
- 7.1% at 5% elongation;
- 5.7% at 10% elongation;
- 4.9% at 50% elongation; and
- 4.0% at 100% elongation.
The decreasing scatter indicates that the large-deformation response was consistent among the three tested hinges.
The results demonstrate that the original polyurethane hinge combined high deformation capacity with a relatively repeatable nonlinear stiffness response. The measured stiffness values provide direct input for hydrodynamic and structural models of the multi-body FPV array. However, using a single constant stiffness would not reproduce the observed response. A piecewise nonlinear force–displacement relationship, or an appropriately calibrated nonlinear connector model, is more suitable.
The mean ultimate tensile load of 3.69 kN was substantially below the predicted connection demand of approximately 8–10 kN. Relative to this range, the measured mean capacity was approximately:
below the lower demand estimate and:
below the upper estimate. The original hinge therefore did not provide adequate tensile capacity for the anticipated loading conditions.
The consistent rupture within the narrow central section further indicates that increasing material strength alone would not necessarily resolve the limitation. Appropriate modifications include increasing the effective load-bearing width, smoothing the geometric transition, increasing the central cross-sectional area, distributing the load over multiple hinges, or introducing a reinforcing element while preserving the flexibility required for relative module motion.
3.3. PU Hinges in Compression, Shear and Torsion
The compressive load capacity of the hinges was substantially lower than their tensile capacity because global buckling governed the response (Figure 7). The hinges buckle very early, after about 2 mm displacement, which leads to a complete loss of load-carrying capacity. The initial compressive stiffness is around 0.12 kN/mm, very comparable to the value in tension (0.1148 kN/mm at 5% elongation), and decreases progressively to 0.02 kN/mm as the buckled hinge loses its structural capacity. The mean maximum compressive force is 0.171 kN, and the stiffness at 1% and 4% elongation is 0.080 and 0.029 kN/mm, respectively, with good repeatability (Table 5).
In shear, only shear strain was present at the start of the tests; as the tests progressed, the specimens rotated and a combination of shear and tensile strain developed, particularly close to the grips. The force–displacement response was linear over the range investigated, and the tests were stopped before failure. The mean shear stiffness is 0.00894 kN/mm, much lower than in tension and compression, with low scatter (Table 5).
In torsion, the torque response was almost linear over the full range of 0 to 150°, and no failure was observed. The mean rotational stiffness is 0.029 kN·mm/deg at 50° and 0.047 kN·mm/deg at 150°, and the corresponding mean torques are 1.437 and 6.994 kN·mm (Table 5).
3.4. Steel Wire Rope Assemblies
All wire rope assemblies showed the same behaviour (Figure 8): a first stiff increase from 0 to 8 mm displacement, followed by a more pronounced increase until failure. Between 8 and 30 mm, frequent drops in force occurred, caused by the release of torsional forces in the rope and its twisting during the test. This effect did not influence the ultimate strength.
Two failure mechanisms were observed: loosening of the wire from the end socket (wires 1, 2, 4 and 5) and fracture in the free length of the wire (wire 3). The mean ultimate strength is 402.0 kN (standard deviation 16.0 kN), slightly lower than the rated capacity of 450 kN; the corresponding mean stress at break is 686.0 MPa and the mean elongation at break 7.2% (Table 6).
3.5. Breakwater–Module Connection
Connection 3 failed prematurely because of early wear and is excluded from the results. The force–displacement curves of the remaining five tests (Figure 9) are nearly flat up to 50–80 mm, reflecting the tensioning of the assembly, and then increase linearly until failure. The displacement at failure is large, approximately 400 mm, mainly because of the deformation of the rope, the pipe and bracket being much stiffer.
The mean failure load is 40.88 kN with a standard deviation of 2.23 kN, and the mean stiffness is 0.11 kN/mm (Table 7). Failure always occurred in the rope. In tests 1 and 2, the rope failed at the interface with the bracket because of extensive tearing at this location, at loads of 38.50 and 38.20 kN. With the soft fabric insert at the interface (tests 4 to 6), failure moved to the main body of the rope and the failure loads increased to 41.10, 43.70 and 42.90 kN.
4. Discussion
4.1. Capacity of the Connections Relative to Design Levels
Table 8 compares the measured capacities with the relevant reference levels. The three connection types differ markedly in their margin with respect to these levels.
PU hinges. The mean tensile capacity of the hinges, 3.69 kN, is well below the 8–10 kN load expected in the hinges from numerical analyses of the system [10-11]. Even allowing for the scatter, the hinges in their current form do not meet this requirement, and a redesign is needed. The DIC results show that failure is governed by the hinge geometry rather than by an intrinsic weakness of the material: the PU itself reaches a true stress at break of 75.45 MPa and an elongation at break of 2.97, whereas the hinges rupture at the narrowest section, where strain concentrates, at a lower elongation at break (1.74). This suggests that the redesign should focus on the cross-section and shape of the narrow region of the hinge, while the material appears suitable in terms of strength and ductility under monotonic loading.
The very low compressive capacity (0.171 kN) caused by early buckling means that the hinges provide practically no resistance against modules moving towards each other. In operation, this may lead to collisions between modules and, when hinges that have gone slack are suddenly re-tensioned, to snap loads. The high deformability of the hinges could also cause them to loosen from the module fixtures under large wave-induced motions; the hinge–module fixture itself was not tested here, and this mechanism should be verified. Tensile rupture governed the tests continued to material failure, while compression-induced buckling governed the stability response. Because the shear and torsion tests were stopped before failure, no overall governing failure mode can be established across all loading directions.
A full redesign of the hinge concept could address both the insufficient tensile strength and the lack of compressive resistance.
Steel wire rope assemblies. The mean capacity of 402.0 kN is somewhat below the rated capacity of 450 kN. Four of the five assemblies failed by loosening in the end socket rather than by fracture of the rope, and the only rope fracture (wire 3) occurred at 409.2 kN. The measured capacity therefore reflects the efficiency of the end termination rather than the breaking strength of the rope itself, and the termination should be considered explicitly when the capacity of the assemblies is used in design. The force drops caused by the untwisting of the rope are consistent with the well-known tendency of stranded ropes to rotate under tension and did not affect the ultimate strength. The assembled connections reached a mean ultimate load of 402 kN, with termination performance governing four of five tests. Adequacy must be assessed against the applicable design load, fatigue requirements and resistance factors.
Breakwater–module connection. The five valid tests produced a mean ultimate load of 40.88 kN, approximately 2.7% below the 42 kN design requirement. The tests identified the bracket-rope contact as the governing interface. Without protection, the rope tore at the bracket at loads of 38.50 and 38.20 kN. After introducing a soft protective insert, the three specimens reached 41.10, 43.70 and 42.90 kN, with the final two exceeding the design requirement. The concept is therefore technically feasible, but bracket geometry, contact protection and rope specification require further optimisation and qualification.
4.2. Implications for Numerical Modelling of the Hinges
The hinge tests show that a single linear spring is not an adequate representation of the hinge. The tensile secant stiffness decreases from 0.1148 kN/mm at 5% elongation to 0.0198 kN/mm at 100% elongation, the response is strongly asymmetric in tension and compression owing to buckling, the shear stiffness (0.00894 kN/mm) is much lower than the axial stiffness, and the rotational stiffness at 150° is higher than at 50°. The latter may be related to the tensile axial force that develops because the axial displacement was constrained during the torsion tests; the present data do not allow these contributions to be separated. Nonlinear, direction-dependent connector models are therefore recommended, and the secant stiffness values in Table 4 and Table 5 can be used as input. The near-incompressibility (Poisson's ratio of about 0.5) and the strongly nonlinear stress–strain response of the PU are characteristic of thermoplastic polyurethanes and elastomers and would also allow the hinge behavior to be modelled with a hyperplastic material law calibrated on Figure 4.
The breakwater–module connection also shows a slack phase of 50–80 mm before the load builds up, followed by an approximately linear response with a stiffness of about 0.11 kN/mm. This compliance should be represented in global models of the array, since it affects the relative motions between the breakwater and the modules.
4.3. Limitations
The following limitations should be considered when using the results:
- All tests were monotonic and quasi-static. Wave-induced loading is cyclic and partly dynamic; fatigue, cyclic softening of the PU, and the effect of higher loading rates on the connection capacities were not investigated. The material tests covered strain rates up to 10-1 s-1 only.
- The number of repetitions is small (three per hinge loading mode, five for the wire ropes and for the breakwater–module connection), so the standard deviations are indicative, and characteristic (design) values cannot be derived with confidence.
- The two ISO 527 specimens with the lowest elongation at break (Rep6 and Rep7) were both tested at 10-1 s-1, whereas the third specimen at this rate (Rep5) had the highest. The scatter has been attributed to machining defects, but with this number of specimens a rate effect on the failure properties cannot be fully excluded.
- The specimens were new; ageing in the marine environment (seawater, ultraviolet radiation, temperature) of the PU, the polyester rope and the HDPE pipe was not considered.
- The shear tests were stopped before failure and the torsion tests were limited to 150°; combined loading, which will occur in service, was not tested.
- The breakwater–module connection was tested as a portion of the full system with one bracket and a short pipe segment, and the boundary conditions of the clamps may differ from those in the field. One of six tests was excluded because of premature failure due to early wear.
- The hinge–module and wire–breakwater fixtures were not part of the tested specimens, except for the wire end fittings.
5. Conclusions
The mechanical behaviour of three critical connection systems for an offshore FPV installation was experimentally characterised. The programme determined the tensile capacity and failure modes of the complete connection assemblies and quantified the multidirectional stiffness of the polyurethane hinges. The main conclusions are:
- The polyurethane exhibited highly deformable, nonlinear elastomeric behaviour. The mean apparent modulus at 5% strain was 41.33 MPa, the mean estimated true stress at break was 75.45 MPa, and the mean engineering elongation at break was 2.97. The pre-failure response showed limited sensitivity to strain rates between 10−3 and 10−1??s−1, although the limited and unequal specimen numbers do not permit a definitive statistical assessment of rate effects.
- The complete polyurethane hinges reached a mean ultimate tensile load of 3.69 kN, with rupture consistently occurring in the narrowest section. This value was below the anticipated 8–10 kN connection demand. Under compression, global buckling occurred after approximately 2 mm of displacement, with a mean maximum load of only 0.171 kN. Tensile rupture governed the tests taken to material failure, while compression-induced buckling governed the stability response. Because the shear and torsion tests were stopped before failure, no overall governing failure mode can be established for all loading directions.
- Hinge stiffness was strongly nonlinear and direction-dependent. The mean tensile secant stiffness decreased from 0.1148 kN/mm at 5% elongation to 0.0198 kN/mm at 100% elongation, while the mean shear stiffness was 0.00894 kN/mm. Numerical analyses should therefore use nonlinear and direction-dependent connector models rather than a single linear spring.
- The steel-wire-rope assemblies reached a mean ultimate load of 402.0 kN, approximately 11% below the nominal 450 kN rating. Four of the five assemblies failed through loosening or pull-out at the end sockets, demonstrating that termination performance governed the capacity of most specimens. Suitability for the intended application should be assessed against the relevant design load, fatigue requirements and resistance factors rather than the nominal rope capacity alone.
- The five valid breakwater-to-module connection tests reached a mean ultimate load of 40.88 kN, approximately 2.7% below the 42 kN design requirement. The unprotected rope-bracket interface caused premature abrasion and failure. Following the introduction of a protective insert, the final two specimens reached 43.7 and 42.9 kN, exceeding the requirement. The concept is therefore technically feasible, but the bracket geometry, contact protection and rope specification require further optimisation and qualification.
Overall, the results demonstrate that connection performance must be evaluated at assembly level because geometry, terminations and contact interfaces can govern behaviour independently of nominal material or component properties. The original polyurethane hinge requires redesign to increase tensile capacity and prevent compression-induced buckling. Future work should address cyclic and dynamic loading, combined loading, seawater and ultraviolet ageing, statistically representative specimen numbers, and testing of redesigned hinges together with their actual module fixtures.
Author Contributions
Conceptualization, Virgile Delhaye; methodology, Virgile Delhaye; investigation, Virgile Delhaye; formal analysis, Virgile Delhaye; data curation, Virgile Delhaye; visualization, Virgile Delhaye; writing, original draft preparation, Virgile Delhaye; validation, Virgile Delhaye and Balram Panjwani; writing, review and editing, Virgile Delhaye and Balram Panjwani; supervision, Virgile Delhaye; project administration and coordination, Balram Panjwani. All authors have read and agreed to the published version of the manuscript.
Funding
This research was funded by the European Union through the Horizon Europe project SUREWAVE, grant agreement No. 101083342.
Institutional Review Board Statement
Not applicable.
Informed Consent Statement
Not applicable.
Data Availability Statement
The experimental data supporting this study are reported in the public SUREWAVE Deliverable D6.1, Ultimate Strength Capacity of Critical Connections, available at [https://zenodo.org/records/22830589]. Additional data may be made available by the corresponding author subject to partner ownership and confidentiality requirements.
Acknowledgments
The authors acknowledge Sunlit Sea for providing the FPV hinges and associated design information, and CLEMENT for providing the breakwater wire-rope and breakwater-to-FPV transition-connection components and requirements. The authors also acknowledge CEIT and ACCIONA for their structural, fatigue and breakwater-interface inputs.
Conflicts of Interest
The authors declare no conflicts of interest.
Appendix A
Figure A1.
Set-up for the tests on the PU hinges: test machine (left), hinge specimen (middle) and clamping device (right).
Figure A1.
Set-up for the tests on the PU hinges: test machine (left), hinge specimen (middle) and clamping device (right).
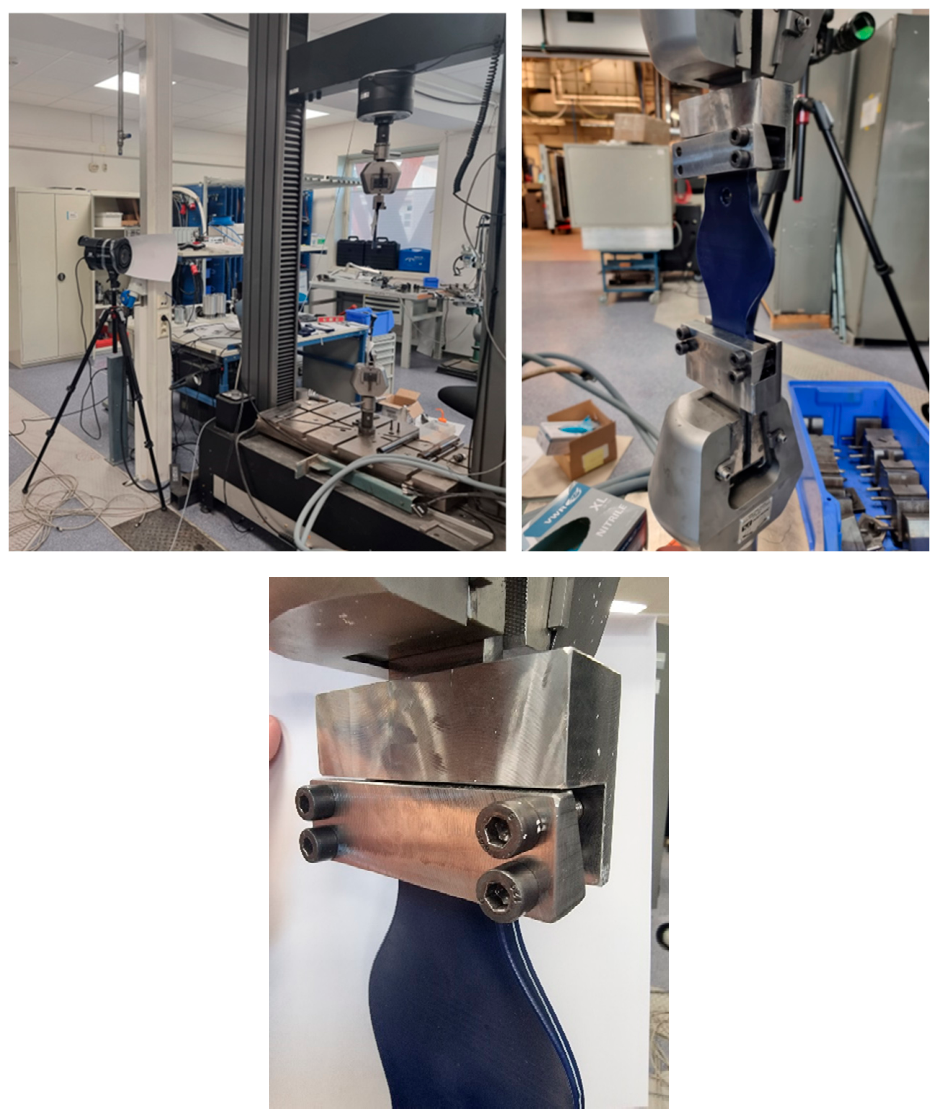
Figure A2.
Set-up for the tests on the steel wire rope assemblies, with safety grids around the machine: full set-up (left), upper fixture with machined insert (middle) and lower end clamped in the hydraulic grip (right).
Figure A2.
Set-up for the tests on the steel wire rope assemblies, with safety grids around the machine: full set-up (left), upper fixture with machined insert (middle) and lower end clamped in the hydraulic grip (right).
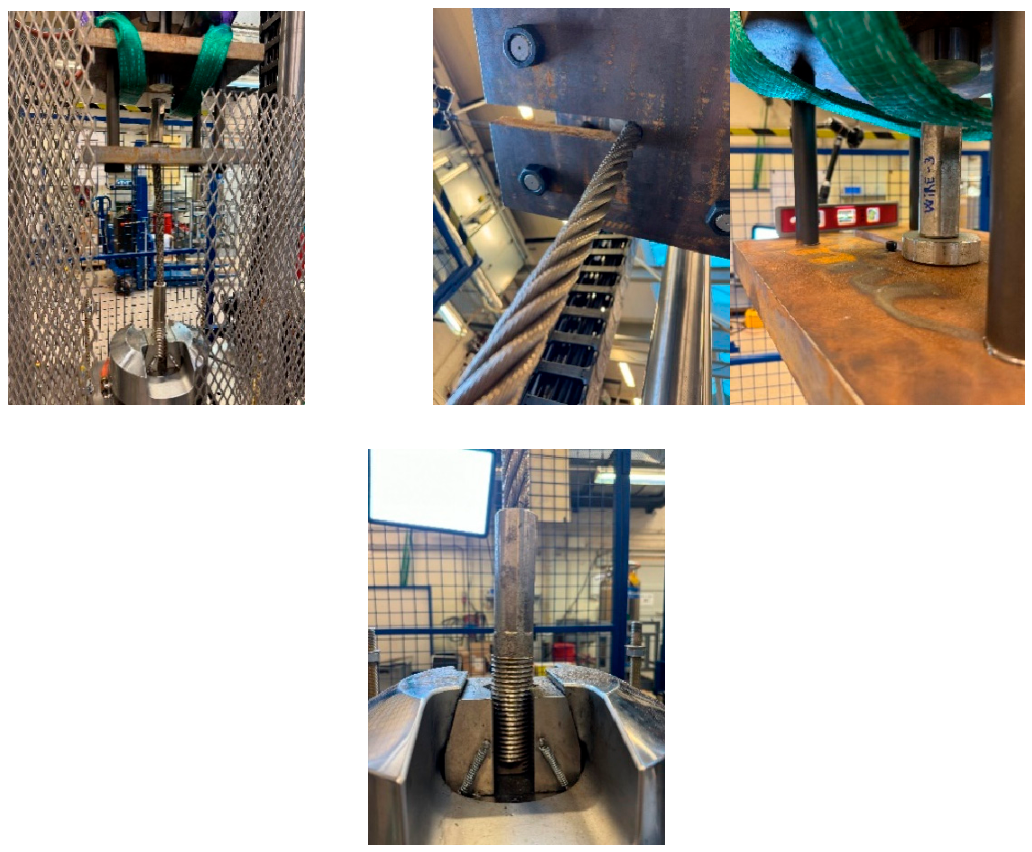
Figure A3.
Set-up for the tests on the breakwater–module connection. The red circle marks the position of the soft insert used in tests 4 to 6.
Figure A3.
Set-up for the tests on the breakwater–module connection. The red circle marks the position of the soft insert used in tests 4 to 6.
References
- Jin, R.; Geng, B.; Zhao, X.; He, M. An overview for offshore floating photovoltaic structures and their fluid dynamic issues. Phys. Fluids 2025, 37, 061301. [Google Scholar] [CrossRef]
- Dellosa, J.T.; Palconit, E.V.; Enano, N.H., Jr. Risk assessment and policy recommendations for a floating solar photovoltaic system. IEEE Access 2024, 12, 30452–30471. [Google Scholar] [CrossRef]
- Daroen, I.A. Risk Assessment of Offshore Floating Photovoltaic Systems: Methodology for Technological Risks. MSc Thesis, Delft University of Technology, Delft, The Netherlands, 2021. [Google Scholar]
- DNV. DNV-RP-0584; Design, Development and Operation of Floating Solar Photovoltaic Systems. Edition March 2021, amended October 2021.
- Ma, G.; Zhang, C.; Chen, H.; Hou, W.; Wang, W.; Zhang, J. Hydrodynamic analysis of floating photovoltaic system constrained with rigid connectors. Sci. Rep. 2024. [Google Scholar] [CrossRef]
- Li, Y.; Li, G.; Cui, Y.; Deng, W.; Wang, B.; Li, H.; Feng, Y.; Meng, H. The influence of multi-body interaction on the hydrodynamic performance of a hexagon-type floating photovoltaic system. Ocean Eng. 2024, 312, 119302. [Google Scholar] [CrossRef]
- Li, Y.; Li, X.; Chen, D.; et al. Numerical investigation on the effect of flexible connector configurations on the hydrodynamic behaviour of floating photovoltaics. J. Mar. Sci. Eng. 2026, 14, 876. [Google Scholar] [CrossRef]
- Zhang, G.; Lian, J.; Zhang, J.; et al. Experimental study on hydrodynamic response characteristics of a novel pontoon-type array offshore floating photovoltaic structure. J. Mar. Sci. Eng. 2026, 14, 322. [Google Scholar] [CrossRef]
- Yao, Y.; Zhang, X.; Deng, Z.; Ren, X.; Song, J.; Yang, X. Hydrodynamic analysis of offshore floating photovoltaic structure with elastic connection. Mar. Energy Res. 2025, 2, 10011. [Google Scholar] [CrossRef]
- van der Zanden, J.; Bunnik, T.; Cortés, A.; Delhaye, V.; Kegelart, G.; Pehlke, T.; Panjwani, B. Wave basin tests of a multi-body floating PV system sheltered by a floating breakwater. Energies 2024, 17, 2059. [Google Scholar] [CrossRef]
- van der Zanden, J. Wave basin tests to demonstrate an integrated floating breakwater and solar farm concept. MARIN Report. 2024, 139. [Google Scholar]
- Saidpour, H.; Li, L.; Vaseghi, R. The effect of rope termination on the performance of polyester mooring ropes for marine applications. Ocean Eng. 2020, 195, 106705. [Google Scholar] [CrossRef]
- Martinez, M.; Montalvo, S. Detailed finite-element modelling of a high-capacity mooring steel-wire rope: calculation of stress concentration near the connection. In Proceedings of the ASME 2020 39th International Conference on Ocean, Offshore and Arctic Engineering, 2020; ASME; pp. Paper OMAE2020–18170. [Google Scholar] [CrossRef]
- Qi, H.J.; Boyce, M.C. Stress–strain behaviour of thermoplastic polyurethane. Mech. Mater. 2005, 37, 817–839. [Google Scholar] [CrossRef]
- Meyer, P.; Finder, J.; Hühne, C. Test methods for the mechanical characterisation of flexure hinges. In Experimental Mechanics; 2023. [Google Scholar] [CrossRef]
- Mousa, M.A.; Yussof, M.M.; Hussein, T.S.; Assi, L.N.; Ghahari, S.A. A digital image correlation technique for laboratory structural tests and applications: a systematic literature review. Sensors 2023, 23, 9362. [Google Scholar] [CrossRef]
- ISO 527-1:2019; Plastics—Determination of Tensile Properties—Part 1: General Principles. International Organization for Standardization: Geneva, Switzerland, 2019.
- Sutton, M.A.; Orteu, J.-J.; Schreier, H.W. Image Correlation for Shape, Motion and Deformation Measurements: Basic Concepts, Theory and Applications; Springer: New York, NY, USA, 2009. [Google Scholar] [CrossRef]
- Fagerholt, E. eCorr Digital Image Correlation Software, Version 4.0; NTNU: Trondheim, Norway, 2017. [Google Scholar]
| 1 | [surewave.eu], [ cordis.europa.eu] |
Figure 4.
Tensile response of polyurethane specimens machined from the FPV hinges at nominal strain rates of 10−3, 10−2 and 10−1s−1: force versus engineering elongation (left), and true stress and apparent secant modulus versus true strain (right).
Figure 4.
Tensile response of polyurethane specimens machined from the FPV hinges at nominal strain rates of 10−3, 10−2 and 10−1s−1: force versus engineering elongation (left), and true stress and apparent secant modulus versus true strain (right).
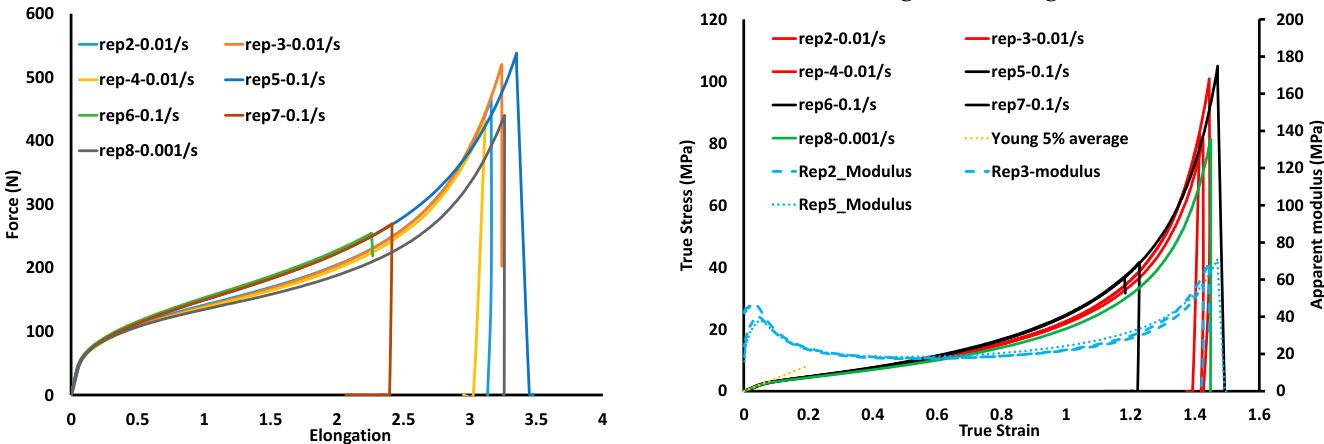
Figure 5.
Longitudinal strain field measured by DIC at successive stages of the tensile tests on the PU hinges, and fracture surfaces after the tests.
Figure 5.
Longitudinal strain field measured by DIC at successive stages of the tensile tests on the PU hinges, and fracture surfaces after the tests.
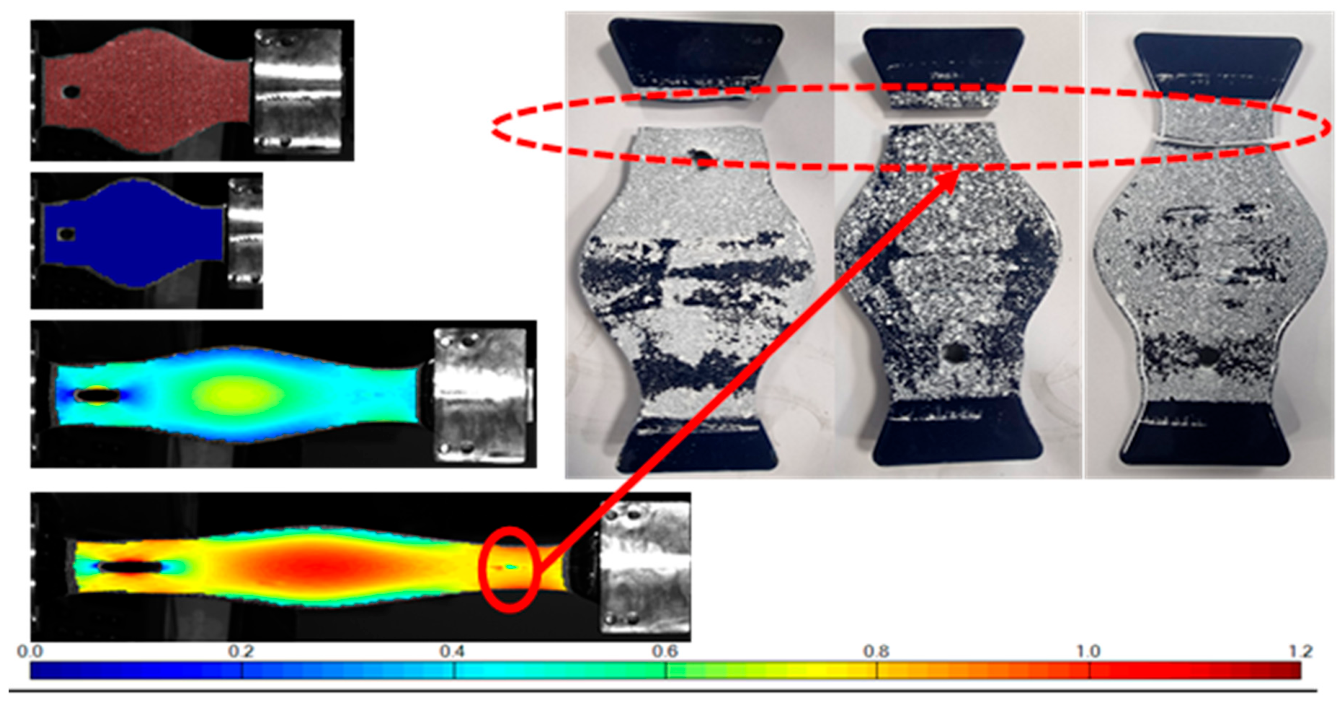
Figure 6.
Tensile response of the full polyurethane hinges: force versus displacement (left) and force versus engineering elongation (right).
Figure 6.
Tensile response of the full polyurethane hinges: force versus displacement (left) and force versus engineering elongation (right).
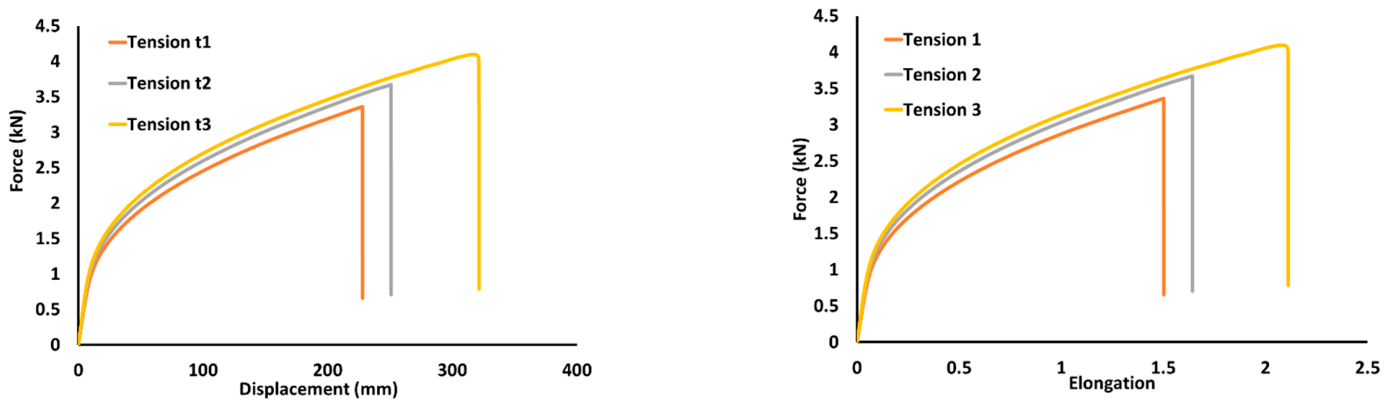
Figure 7.
Force–displacement curves of the PU hinges in compression (middle), buckled hinge (right), and comparison with the tensile curves.
Figure 7.
Force–displacement curves of the PU hinges in compression (middle), buckled hinge (right), and comparison with the tensile curves.
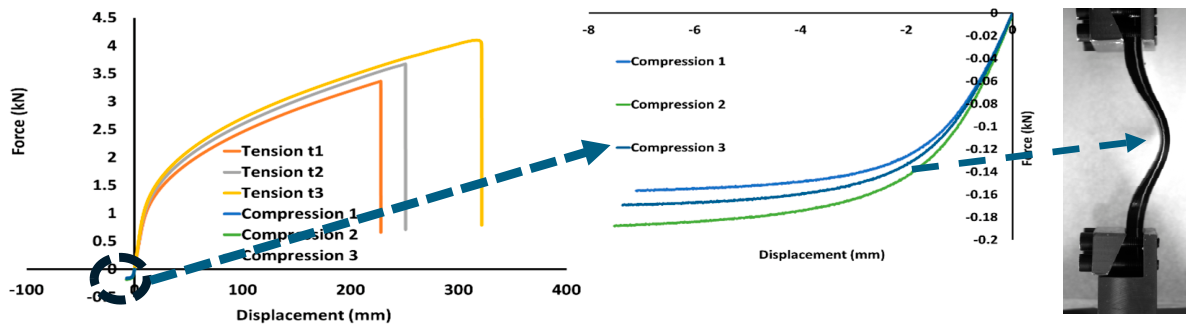
Figure 8.
Force–displacement response of the steel wire rope assemblies in tension.
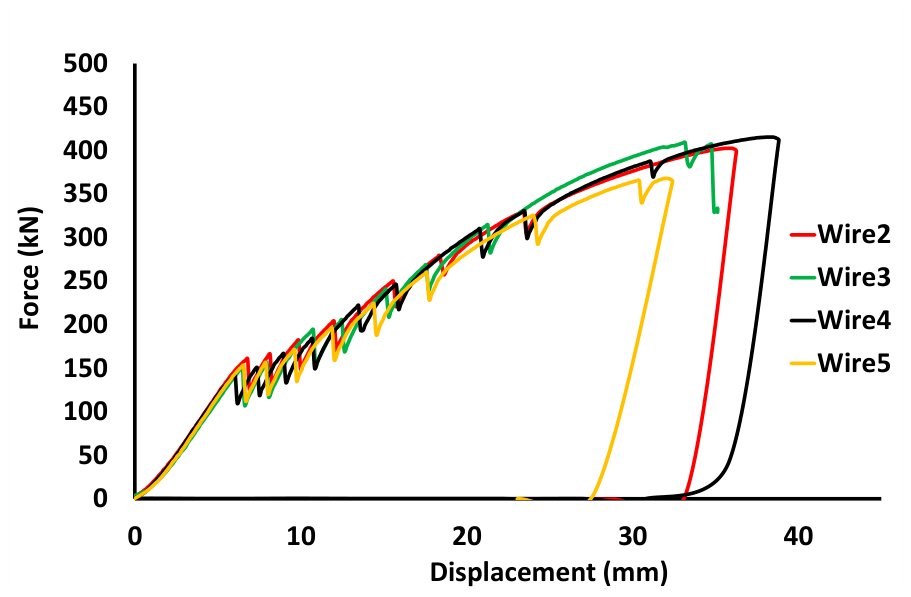
Figure 9.
Force–displacement curves of the breakwater–module connection tests.
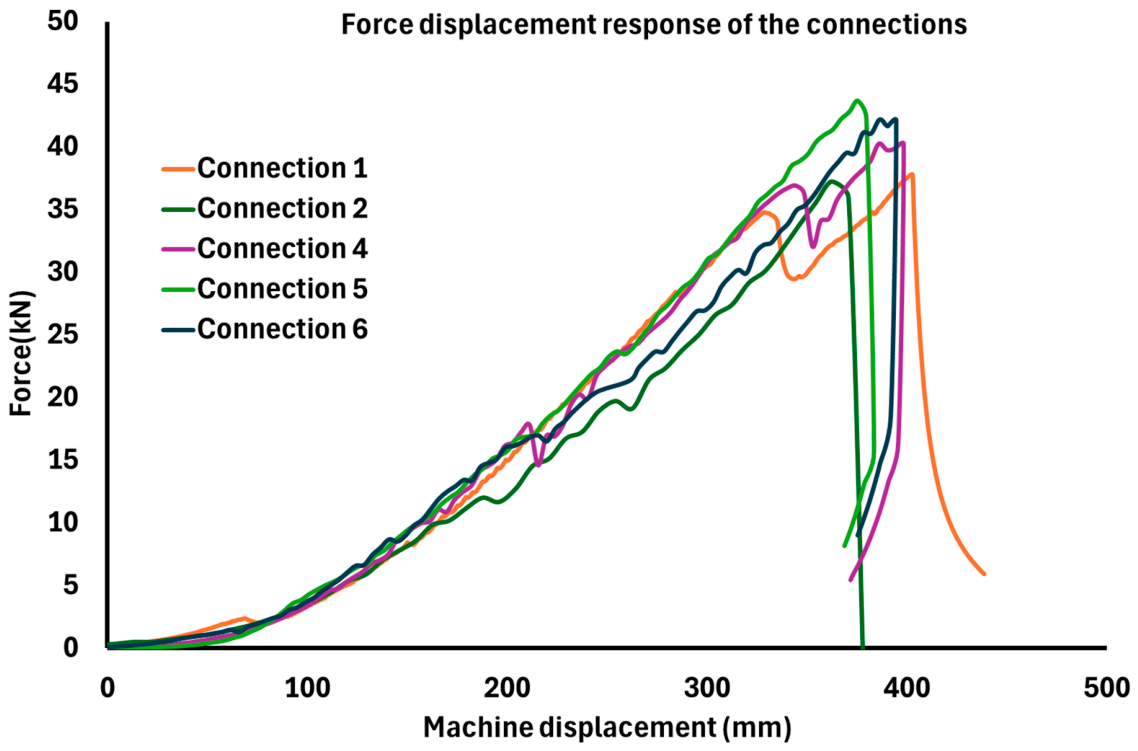

Table 1.
Experimental test programme. Here,n denotes the number of valid tests included in the analysis.
Table 1.
Experimental test programme. Here,n denotes the number of valid tests included in the analysis.
| Specimen | Loading mode | n | Loading rate | Test machine | Instrumentation |
| PU material, ISO 527 specimens machined from hinges | Tension to failure | 7 | 10-3, 10-2 and 10-1 s-1 | Zwick Z030 | DIC |
| PU hinge | Tension to failure | 3 | 1.44 mm/s | Instron, 250 kN | DIC |
| PU hinge | Compression | 3 | 15 mm/min (0.25 mm/s) | Instron, 250 kN | Extensometer |
| PU hinge | Shear (stopped before failure) | 3 | 30 mm/min | Instron, 250 kN | DIC |
| PU hinge | Torsion up to 150° | 3 | 50 deg/min | Instron biaxial | Extensometer |
| Steel wire rope assembly | Tension to failure | 5 | 2 mm/min | Instron servo-hydraulic, 500 kN | Not reported |
| Breakwater–module connection | Tension to failure | 5 (6 tested) | 50 mm/min | Tensile machine | Traverse displacement |
Table 2.
Results of the tensile tests on the ISO 527 PU specimens. Rep2–Rep4: 10-2 s-1; Rep5–Rep7: 10-1 s-1; Rep8: 10-3 s-1.
Table 2.
Results of the tensile tests on the ISO 527 PU specimens. Rep2–Rep4: 10-2 s-1; Rep5–Rep7: 10-1 s-1; Rep8: 10-3 s-1.
| ID | Nominal strain rate (s−1) | Eappat 5% strain (MPa) | Force at break (N) | Engineering elongation at break | True strain at break | True stress at break (MPa) |
| Rep2 | 10−2 | 43.91 | 465 | 3.15 | 1.42 | 81.30 |
| Rep3 | 10−2 | 39.60 | 519 | 3.23 | 1.44 | 100.90 |
| Rep4 | 10−2 | 41.31 | 427 | 3.12 | 1.42 | 82.80 |
| Rep5 | 10−1 | 37.81 | 531 | 3.34 | 1.47 | 104.60 |
| Rep6 | 10−1 | 42.62 | 251 | 2.26 | 1.18 | 36.43 |
| Rep7 | 10−1 | 42.52 | 269 | 2.41 | 1.23 | 41.40 |
| Rep8 | 10−3 | 41.54 | 440 | 3.26 | 1.44 | 80.70 |
| Mean | — | 41.33 | 414.57 | 2.97 | 1.36 | 75.45 |
| Standard deviation | — | 1.90 | 104.03 | 0.41 | 0.11 | 24.77 |
| Minimum | — | 37.81 | 251 | 2.26 | 1.18 | 36.43 |
| Maximum | — | 43.91 | 531 | 3.34 | 1.47 | 104.60 |
Table 3.
Tensile failure results for the full polyurethane hinges.
| Specimen | Ultimate tensile load (kN) | Displacement at break (mm) | Engineering elongation at break |
| Ten1 | 3.36 | 227.0 | 1.49 |
| Ten2 | 3.64 | 250.9 | 1.64 |
| Ten3 | 4.08 | 320.0 | 2.09 |
| Mean | 3.69 | 265.97 | 1.74 |
| Standard deviation | 0.36 | 48.30 | 0.31 |
| Minimum | 3.36 | 227.0 | 1.49 |
| Maximum | 4.08 | 320.0 | 2.09 |
Table 4.
Secant tensile stiffness of the polyurethane hinges at selected elongations.
| Specimen | 5% elongation (kN/mm) | 10% elongation (kN/mm) | 50% elongation (kN/mm) | 100% elongation (kN/mm) |
| Ten1 | 0.1063 | 0.0790 | 0.0292 | 0.0189 |
| Ten2 | 0.1156 | 0.0843 | 0.0308 | 0.0199 |
| Ten3 | 0.1224 | 0.0886 | 0.0322 | 0.0206 |
| Mean | 0.1148 | 0.0839 | 0.0307 | 0.0198 |
| Standard deviation | 0.0081 | 0.0048 | 0.0015 | 0.0008 |
Table 5.
Summary of the PU hinge results in compression (C1–C3), shear (S1–S3) and torsion (T1–T3); mean and standard deviation of three tests. Stiffness values are secant values.
Table 5.
Summary of the PU hinge results in compression (C1–C3), shear (S1–S3) and torsion (T1–T3); mean and standard deviation of three tests. Stiffness values are secant values.
| Loading mode | Quantity | Mean | Std. dev. |
| Compression | Maximum force (kN) | 0.171 | 0.016 |
| Compression | Maximum displacement (mm) | 7.327 | 0.209 |
| Compression | Stiffness at 1% elongation (kN/mm) | 0.080 | 0.005 |
| Compression | Stiffness at 4% elongation (kN/mm) | 0.029 | 0.002 |
| Shear | Average stiffness (kN/mm) | 0.00894 | 0.00053 |
| Torsion | Rotational stiffness at 50° (kN·mm/deg) | 0.029 | 0.006 |
| Torsion | Rotational stiffness at 150° (kN·mm/deg) | 0.047 | 0.004 |
| Torsion | Torque at 50° (kN·mm) | 1.437 | 0.304 |
| Torsion | Torque at 150° (kN·mm) | 6.994 | 0.604 |
Table 6.
Results of the tensile tests on the steel wire rope assemblies.
| Ultimate strength (kN) | Stress at break (Mpa) | Displacement at break (mm) | Elongation at break (%) |
Stiffness at 6.5mm displacement (kN/mm) |
Stiffness at break (kN/mm) | Main failure mode | |
| W1 | 414.6 | 707.5 | 21.9 | 4.9 | 29.4 | 18.9 | Loosened in the lower socket |
| W2 | 402.6 | 687.1 | 35.9 | 8.0 | 23.7 | 11.2 | Loosened in the lower socket |
| W3 | 409.2 | 698.3 | 32.5 | 7.2 | 23.5 | 12.6 | Fracture on the Wire |
| W4 | 415.4 | 708.9 | 38.3 | 8.5 | 23.4 | 10.8 | Loosened in the upper socket |
| W5 | 368.1 | 628.1 | 32 | 7.1 | 21.8 | 11.5 | Loosened in the upper socket |
| mean | 402.0 | 686.0 | 32.1 | 7.2 | 24.4 | 13.0 | |
| std dev | 16.0 | 27.3 | 5.1 | 1.1 | 2.4 | 2.8 |
Table 7.
Results of the tensile tests on the breakwater–module connection.
| Specimen ID | Length | Diameter | Thickness | Load (kN) max | displacement at failure (mm) | Stiffness (kN/mm) |
| Connection - 1 | 85 cm | 225 mm | 20.5 mm | 38.50 | 402.00 | 0.10 |
| Connection - 2 | 85 cm | 225 mm | 20.5 mm | 38.20 | 362.00 | 0.11 |
| Connection - 4 | 85 cm | 225 mm | 20.5 mm | 41.10 | 398.00 | 0.10 |
| Connection - 5 | 85 cm | 225 mm | 20.5 mm | 43.70 | 375.00 | 0.12 |
| Connection - 6 | 85 cm | 225 mm | 20.5 mm | 42.90 | 394.00 | 0.11 |
| mean | 40.88 | 386.20 | 0.11 | |||
| deviation | 2.23 | 15.24 | 0.01 | |||
Table 8.
Measured ultimate capacities compared with reference load levels.
| Connection | n | Mean ultimate load (kN) | Std. dev. (kN) | Reference level (kN) | Observed failure mode |
| PU hinge (module–module) | 3 | 3.69 | 0.36 | 8–10 (expected load from numerical analyses) | Tensile rupture at the narrowest section |
| Steel wire rope assembly (breakwater–breakwater) | 5 | 402.0 | 16.0 | 450 nominal rated capacity; not a design resistance | Loosening in the end socket (4 tests); wire fracture (1 test) |
| Breakwater–module connection | 5 | 40.88 | 2.23 | 42 (design requirement) | Rope failure at the bracket interface (tests 1–2) or in the rope body (tests 4–6) |
Disclaimer/Publisher’s Note: The statements, opinions and data contained in all publications are solely those of the individual author(s) and contributor(s) and not of MDPI and/or the editor(s). MDPI and/or the editor(s) disclaim responsibility for any injury to people or property resulting from any ideas, methods, instructions or products referred to in the content. |
© 2026 by the authors. Licensee MDPI, Basel, Switzerland. This article is an open access article distributed under the terms and conditions of the Creative Commons Attribution (CC BY) license.
Copyright: This open access article is published under a Creative Commons CC BY 4.0 license, which permit the free download, distribution, and reuse, provided that the author and preprint are cited in any reuse.