

Submitted:
13 November 2026
Posted:
16 November 2026
You are already at the latest version
Abstract
Predicted retention times can narrow candidate lists in liquid chromatography–high-resolution mass spectrometry (LC–HRMS). Deep-learning models report errors near the variability between repeated measurements, but their credibility depends on the evaluation design. We reviewed deep-learning retention-time prediction for non-polymeric small molecules in reversed-phase liquid chromatography (RP-LC). Searches of PubMed, Scopus, and Web of Science through August 3, 2026, identified 594 records; 33 studies were eligible. Fifteen studies reported mean absolute errors (MAEs) on the METLIN Small Molecule Retention Time (SMRT) dataset across at least seven differently filtered subsets. Among 13 models evaluated under a broad retained-only convention, the spread from best to worst was 18 s, compared to the 36 s mean repeat-measurement variability observed on SMRT reference standards. Unseen chromatographic methods were rarely tested; one model’s error rose from 29.3 s internally to 596.8 s on a held-out gradient. Random molecular partitions remained common, including in studies using cross-validation or transfer-set deduplication. Risk of bias was low in 18 studies for model development and 19 for performance evaluation, but in only seven for leakage control and one for generalizability. Reported accuracy depends as much on benchmark construction as on architecture. To support reliable compound identification, these models need structure-aware and method-aware validation with uncertainty estimates.
Keywords:
retention-time prediction
; quantitative structure–retention relationship (QSRR)
; reversed-phase liquid chromatography (RPLC)
; deep learning
; chemometrics
; metabolomics
1. Introduction
Liquid chromatography coupled with high-resolution mass spectrometry (LC–HRMS) can detect large numbers of small-molecule features, but assigning a chemical structure to each feature remains difficult. Accurate mass and tandem mass spectrometry (MS/MS) data narrow the search space, yet they often leave several plausible candidates [1,2]. LC separation also assigns each feature a retention time (tR), obtained during the same analysis and largely orthogonal to precursor mass [1,3]. Agreement between measured and predicted tR can then help filter or reprioritize candidates when the prediction-error threshold is validated for the target method [2,4,5]. Such filtering has been applied in untargeted metabolomics, environmental suspect screening, and forensic toxicology [3,6,7].
The value of tR as identification evidence is inseparable from its principal limitation: unlike molecular mass, retention time is not an intrinsic molecular constant. It reflects both the interactions of a molecule with the mobile and stationary phases and the conditions under which the separation is performed, including column chemistry, gradient profile, flow rate, temperature, and instrument configuration [8,9]. A useful predictor must therefore learn a structure–retention relationship and place that relationship on the time scale of the intended chromatographic method. Early quantitative structure–retention relationship (QSRR) studies in reversed-phase liquid chromatography (RPLC) combined calculated molecular descriptors with multilayer perceptrons (MLPs). These models showed that predicted retention could help screen pharmaceutical residues and emerging contaminants, but they were developed from comparatively small, method-specific data sets [3,7,10].
The 2019 release of the METLIN Small Molecule Retention Time (SMRT) data set changed the available data scale. It provided 80,038 experimental records acquired under a single RP-LC method [11]. On this benchmark, subsequent studies learned representations directly from molecular strings [12,13] and graphs [2,4], while other work explored weighted-autoencoder pretraining, graph transformers, and hybrid transformer–recurrent architectures [1,9,14]. Researchers also pursued adaptation through fine-tuning on local data [1,12,15], joint learning across chromatographic systems [16,17], and explicit encoding of column and operating conditions [9,17,18,19].
Rapid algorithmic progress, however, does not by itself establish analytical validity. Random molecular partitions can place close structural analogues in both training and test sets, yielding an internal error that does not represent performance on a new scaffold [11,20,21]. Likewise, performance within one chromatographic method does not establish transport to a method with different columns, gradients, or mobile phases [9]. Even results attributed to the same SMRT benchmark depend on the handling of nonretained molecules [5,11,22] and the partitioning design [21]. Reported outcomes also span absolute and relative errors, correlation, and tolerance windows. These measures are not interchangeable: the same absolute error has different practical meanings on short and long gradients, while correlation or R2 alone does not quantify error magnitude [11,16,23]. The central question is therefore not which architecture reported the smallest number, but whether the evaluation supports use on new molecules and chromatographic methods.
Existing narrative and critical reviews have synthesized retention prediction broadly, artificial intelligence in QSRR modeling, molecular descriptors, pharmaceutically relevant QSRR studies, LC–HRMS annotation, high-performance liquid chromatography (HPLC) method development, and retention prediction in metabolomics and exposomics [8,24,25,26,27,28,29]. A 2024 review focused specifically on deep-learning retention prediction in the five years following the SMRT release [30]. Building on this literature, the present review adds a reproducible systematic search and study flow, explicit full-text eligibility criteria, and a study-level appraisal of bias in reported performance for deep-learning models evaluated against experimental RP-LC retention times. It therefore evaluates the credibility and applicability of the evidence rather than offering another catalogue of architectures.
Accordingly, the primary objective was to determine how accurately eligible deep-learning models predicted absolute or quantitatively normalized tR for non-polymeric small molecules measured by RP-LC in peer-reviewed English-language studies published from 2015 through August 3, 2026. Secondary objectives were to characterize model families and molecular representations. Specifically, we (i) determined how chromatographic conditions were incorporated, (ii) distinguished internal, external, adaptation, and zero-shot transfer evaluations, (iii) assessed evidence of practical benefit in annotation or method development, and (iv) identified threats to reproducibility and biased performance.
2. Methods
The review was designed as a systematic review of prediction-model studies, and reporting follows the Preferred Reporting Items for Systematic Reviews and Meta-Analyses (PRISMA) 2020 statement [31]. The review protocol was prospectively registered on the Open Science Framework (OSF) under registration ID 9qxwt (https://osf.io/9qxwt). Details of the sources, search process, inclusion criteria, study selection, and data extraction are provided below.
2.1. Eligibility Criteria
Studies were eligible when all of the following conditions were satisfied: (1) an English-language, peer-reviewed original journal article was published from January 1, 2015 through the final search date; (2) analytes were non-polymeric small organic molecules, metabolites, xenobiotics, environmental contaminants, natural products, or non-peptide pharmaceuticals; (3) the chromatographic evaluation used RP-LC, RP-HPLC, or RP-UHPLC, with separately extractable RP results accepted from mixed-mode studies; (4) the index model was a documented deep-learning architecture rather than conventional machine learning or a single-hidden-layer network; (5) the target was absolute tR or a quantitatively defined normalized or calibrated tR; and (6) performance was evaluated against experimentally measured RP-LC data with at least one extractable quantitative result.
Reviews, perspectives, editorials, conference papers, preprints, theses, patents, and secondary reports without additional eligible results were excluded. Peptides, proteins, proteomic samples, intact oligonucleotides, polysaccharides, and synthetic polymers were excluded. We also omitted studies of gas chromatography, hydrophilic interaction liquid chromatography (HILIC), normal-phase LC, ion-exchange chromatography, size-exclusion chromatography, or supercritical-fluid chromatography unless eligible RP-LC results were reported separately. Models were regarded as ineligible if they predict elution order, retention index without a quantitative time target, peak properties, chromatogram alignment, compound class, MS/MS spectra, isotope patterns, logD, or nonchromatographic process residence time.
2.2. Information Sources and Search Strategy
PubMed/MEDLINE, Scopus, and Web of Science Core Collection were searched using aligned concept blocks for deep learning, prediction, retention time, and chromatography. Corrective searches were executed on August 3, 2026, and returned 126 PubMed, 231 Scopus, and 237 Web of Science records. Reversed-phase mode, molecular target, and network depth were often unavailable in titles and abstracts and were therefore confirmed at full text. Complete database search strategies are provided in Supplementary Table S1. Search construction was checked against prespecified seed studies.
2.3. Record Management and Study Selection
Database exports were normalized into a common schema and deduplicated deterministically using DOI and PMID matches followed by normalized title, author, and year comparisons. Probable duplicates and metadata conflicts were retained in an audit table for manual review. Objective date, language, publication-type, and article-type filters were applied before topical screening.
Title-and-abstract screening was performed independently in duplicate under a three-state decision: include, exclude, or uncertain. Discrepancies and uncertain records were resolved by consensus; all provisional includes and uncertain records advanced to full-text retrieval.
At full text, each report was evaluated against the complete eligibility criteria and assigned the first applicable reason in a controlled hierarchy; ineligible prediction target (EC-1), ineligible analyte (EC-2), no eligible deep-learning model (EC-3), ineligible chromatography (EC-4), clearly out of scope (EC-5), or no experimental RP-LC evaluation (EC-6). One report could not be retrieved and was not counted among reports assessed for eligibility. Report-level exclusion reasons are provided in Supplementary Table S2.
2.4. Data Extraction
The extraction into a study-level evidence table was performed for bibliographic metadata, molecular domain, chromatographic scope, target definition, molecular representation, model family, data-set size, validation design, reported performance, transfer setting, and availability of software or data. Performance values were retained in their original units. Exact conversion between minutes and seconds was used only when the underlying target definition was unchanged. Where a paper reported multiple models or data sets, interpretation prioritized the most independent test reported and preserved study-specific context rather than selecting the numerically smallest error.
When a study reported results under more than one convention, both were recorded. This included retention-time errors evaluated with and without non-retained molecules, and separate training and test results.
2.5. Risk of Biased Performance and Reporting Completeness
Risk of biased performance was appraised with a review-specific framework informed by PROBAST+AI, while recognizing that PROBAST+AI was designed for clinical prediction models rather than analytical retention-time models [32]. As detailed in Supplementary Section S3, the appraisal addressed five core domains:
- Data provenance and representativeness (D1): Evaluates clarity of retention-time measurement, compound curation and cleaning, replicate and stereoisomer handling, and chromatographic condition completeness.
- Partitioning and leakage control (D2): Evaluates whether evaluation sets were protected from training data, hyperparameter selection, feature filtering, and structural or analogue overlap across partitions.
- Model development and tuning (D3): Evaluates architectural transparency, hyperparameter search protocols, stopping rules, and stochastic seed sensitivity.
- Performance evaluation (D4): Evaluates metric validity, scale awareness, uncertainty and dispersion reporting, and comparison fairness against relevant baselines.
- Generalizability and applicability (D5): Evaluates whether validation designs empirically test claimed cross-column, cross-gradient, cross-laboratory, or downstream candidate-filtering applications.
Ratings were anchored to three standard tiers: low, moderate, and high risk of biased performance, alongside unclear when reporting was insufficient. Domain-specific operational decision rules governing each tier across data provenance (D1), partitioning (D2), development (D3), evaluation (D4), and generalizability (D5) are detailed in Supplementary Section S3.
No pooled numerical score was computed across domains because the five dimensions represent non-exchangeable sources of bias. Instead, overall risk of bias was determined via an evidence-weighted narrative synthesis governed by explicit decision rules: an overall low risk required low risk in partitioning (D2) and performance evaluation (D4) with at least moderate generalizability (D5) and no domain at high risk; studies with random splits on SMRT and sound development typically resolved to moderate risk; and severe design flaws (such as direct analyte leakage, non-reproducible architectures, or unsupported transportability claims) resulted in overall high risk. Each study received a domain-by-domain narrative rationale citing the underlying passage; ratings are tabulated in Table 2 and, with full single-line rationales, in Supplementary Table S3. Reporting of code, trained weights, data identifiers, and applicability domains was recorded as reproducibility information and was not substituted for risk-of-bias assessment.
2.6. Synthesis
Meta-analysis was not undertaken because chromatographic systems, molecular populations, target normalization, data partitions, and performance metrics differed substantially. Results were synthesized narratively and grouped by architecture and representation, method conditioning, validation setting, and application. Head-to-head comparisons within a study or benchmark were weighted more heavily than absolute metric values across papers, and correlation and absolute-error statistics were interpreted separately.
3. Results
3.1. Study Selection
The searches identified 594 records. Deduplication removed 278 records, leaving 316 unique records; objective bibliographic filters removed 46, and 270 records underwent title-and-abstract screening. Two hundred three records were excluded at that stage. Sixty-seven reports were sought for retrieval, comprising 36 provisional includes and 31 uncertain records. Sixty-six reports were retrieved and assessed. Thirty-three retrieved reports were excluded, and 33 studies were included in the synthesis.
Among the 33 exclusions after retrieval, 16 predicted an ineligible target (EC-1), two concerned ineligible analytes (EC-2), 14 lacked an eligible deep-learning model (EC-3), and one used ineligible chromatography (EC-4). Citations, identifiers, and one primary reason for all 34 nonincluded reports are supplied in Supplementary Table S2. Figure 1 summarizes identification, screening, retrieval, eligibility assessment, and inclusion.
3.2. Characteristics of Included Studies
Table 1 lists every included study with its model or setting and its principal reported result. Supplementary Table S4 presents 14 extracted fields for each included study. The 33 studies were published from 2015 to 2026. Publication accelerated after the release of SMRT: 28 studies (84.8%) appeared from 2021 onward, including nine in 2025 (Figure 2A). Sixteen articles were recorded as freely accessible and 17 required subscription access in the frozen retrieval table. The corpus covered environmental contaminants, pharmaceuticals, metabolites, pesticides, new psychoactive substances, and general small-molecule benchmarks. Applications included suspect screening, metabolite annotation, candidate filtering, industrial drug-discovery chromatography, purification and method selection, and transfer to laboratory-specific gradients.
Architectures overlapped and did not form mutually exclusive categories. For descriptive counting, each study was assigned one primary family according to its principal eligible model; graph neural networks (GNNs) and descriptor-based multilayer perceptrons or other deep neural networks (DNNs) were the two largest groups (Figure 2B). Descriptor-based deep MLPs remain common, particularly in early environmental and pharmaceutical studies [3,7,10,23,33]. Sequence models learned from strings encoded using the simplified molecular-input line-entry system (SMILES) using convolutional, recurrent, or transformer components [12,13,14]. Graph-based models included graph convolutional networks (GCNs), graph isomorphism networks (GINs), message-passing neural networks (MPNNs), and architectures based on graph attention, atom–bond co-learning, or graph transformers [2,4,9,15,19,20,34,35,36,37]. Other studies combined autoencoding, multiple descriptor spaces, three-dimensional structure, meta-learning, and explicitly vectorized chromatographic conditions [1,5,17,21,38].
3.3. Predictive Performance and Architecture Comparisons
The common SMRT benchmark made several within-data-set comparisons possible, but even these were sensitive to preprocessing and split definitions. The one-dimensional convolutional neural network (CNN) reported a mean absolute error (MAE) of 34.7 s [13]. An MPNN reported mean and median absolute errors of 32 and 16 s [2], while DeepGCN-RT reported 26.55 s after increasing graph-convolution depth to 16 layers with residual connections [34]. ABCoRT and the hybrid transformer–LSTM reported 25.75 and 26.23 s, respectively, under their stated preprocessing and evaluation designs [14,36]. RT-Transformer reported 27.30 s after removing non-retained molecules [22]. Figure 3 displays these together with every other SMRT mean absolute error reported by an included study in absolute time units, fifteen values in total, as descriptive quantities. For each study, the plotted value reflects the primary index deep-learning model’s headline mean absolute error on the held-out SMRT test partition. Where authors evaluated multiple random seeds or cross-validation folds and reported dispersion, error bars depict author-reported standard deviations (specifically, Kwon et al. [15] ±0.66 s across 3 seeds; García et al. [5] ±1.20 s across test splits); studies without uncertainty intervals are shown as single point estimates. The originating SMRT report gives the largest values in that distribution, 57 s over all molecules and a 35 s median [11].
Three observations recovered at full text show why these values cannot be ranked. First, the reference experimental measurements are themselves subject to analytical variability: in the originating SMRT report, an internal quality-control subset of 198 reference standards analyzed across batches separated by at least 30 days exhibited a mean retention-time variation of 36 s and a median of 18 s [2,11]. Although single-compound measurement variability and aggregate test-set MAEs represent distinct statistical quantities, this 36 s repeat-measurement figure provides valuable analytical context: among the thirteen models scored under a broad retained-only convention, the spread separating the best from the worst published result is approximately 18 s, smaller than the observed multi-day chromatographic drift on that reference subset. The originating report also contextualized error against an average chromatographic peak width of 20 to 30 s at half maximum [11]. Both reference quantities are drawn in Figure 3 as descriptive guides rather than formal equivalence thresholds. Second, the nominally shared benchmark is not one data set. Studies removed non-retained molecules using different rules and thresholds, and the corpus contains at least seven distinct filtered subsets: 80,038 molecules unfiltered [11], 77,983 [13], 77,980 [4,14,34,36], 77,977 [2,22], 77,899 [15,41], 77,898 [1,38], and 77,318 [21]. Third, two studies quantified the consequence directly by testing the identical model under both preprocessing conventions. RT-Transformer reported 27.30 s with nonretained molecules removed and 33.41 s without, a 22% difference attributable to filtering alone that exceeds the spread separating most plotted architectures [22]. The regularized DNN similarly reported 39.2 ± 1.2 s over all molecules and 34.0 ± 0.9 s over retained molecules only [5]. The originating SMRT report separately illustrated the skewed, heavy-tailed error distribution caused by early eluting species: on an identical set of predictions, its mean absolute error of 57 s dropped to a 35 s median, prompting the authors to exclude nonretained compounds from subsequent analysis [11]. A reader comparing a retained-only value with an all-molecule value is therefore measuring a preprocessing decision, not an architecture. The plot is not a meta-analysis or a performance ranking.
Two further comparisons reinforce this. The hybrid transformer–LSTM reported a seed-to-seed standard deviation of 0.69 s while claiming a 0.32 s improvement over DeepGCN-RT, and its median absolute error (13.20 s) was worse than DeepGCN-RT’s (12.38 s) [14,34]. ABCoRT’s improvement over the same comparator was 3.01% in MAE [36]. Where a study tested formally, Chemprop and a graph-attention network were statistically indistinguishable at the 95% confidence level [37]. A subset of these values is directly comparable: DeepGCN-RT, the Kensert GCN, DNNpwa and GNN-RT were evaluated on an identical SMRT test partition and can be compared with one another, though not with the remaining points [1,4,34,35]. On that common partition the four models span 26.55 to 39.87 s, a wider gap than separates most of the points that cannot be compared at all.
Graph representation was advantageous in several head-to-head evaluations. GNN-RT outperformed random forest, Bayesian ridge, CNN, and a descriptor-based deep model on its SMRT comparison, with mean and median relative errors of 4.9% and 3.2% [4]. Two GCN variants were reported to reduce MAE by 5–25% relative to benchmarks across chromatographic data sets [35]. DeepGCN-RT found that greater depth was useful only when residual connections and edge information mitigated over smoothing and optimization difficulty [34]. These findings support learned graph representations, but they do not establish universal superiority because descriptor construction, hyperparameter budgets, and split similarity were not standardized across papers.
Sequence models also remained competitive. Self-supervised pretraining on approximately one million SMILES strings supported transfer to small RP data sets, although reported MAEs of 88–248 s showed that representation pretraining alone did not eliminate method shift [12]. The hybrid transformer–LSTM used multiple transformer layers and bidirectional sequence processing and reported SMRT-scale error comparable with recent graph models [14]. Weighted-autoencoder pretraining and transfer likewise achieved low relative errors [1]. The evidence therefore favors matching representation and transfer design to the target domain rather than assuming that a single molecular encoding is uniformly best.
Conventional models remained competitive. XGBoost outperformed the ANN in AI-SNPS2 [42]. It also achieved lower median absolute error than an adaptive multi-representation network on two of fourteen data sets [38]. In RT-Pred, the largest single performance gain, raising R2 from 0.92 to 0.97, came from a gradient-boosted classifier separating void, retained and eluted compounds [40]. These comparisons support retaining well-tuned conventional baselines when evaluating deep models.
3.4. Chromatographic Conditioning and Transfer Learning
The principal obstacle to operational use was method dependence. A model integrating multiple LC systems achieved R2 = 0.942 and MAE 0.583 min on a 193-compound test set and correctly distinguished laboratory systems through categorical method encoding, although the model is bound to the nine encoded laboratories and cannot predict for an unseen system without retraining [16]. A cross-column model encoded hydrophobic-subtraction-model parameters so that retention could be predicted on stationary phases with no prior retention data. A simple direct-mapping baseline gave lower prediction error than either the ANN or a PLS model for most column pairs, and the learned model was advantageous specifically where the two columns were dissimilar (linear R2 < 0.8) [18]. RT-Pred extended customized prediction to 20 chromatographic methods, of which 13 were reversed-phase, reaching test R2 of 0.86–0.98 on the reversed-phase subset [40]. Graphormer-RT trained across 191 RP methods using gradient profiles, Tanaka and hydrophobic-subtraction parameters, additives, and pH as explicit inputs and achieved 29.3 ± 0.6 s test MAE [9].
That last study is one of only two in the corpus to test zero-shot transport directly, and the only one to do so by withholding entire chromatographic methods. Six complete chromatographic methods were withheld from training, so predictions for them involved no fine-tuning. On the three held-out reversed-phase methods the model achieved MAEs of 42.7 and 43.9 s but failed entirely on the third, a complex gradient, with an MAE of 596.8 s; reintroducing 80% of that method’s retention times into training reduced its error to 65.6 ± 21.0 s [9]. Internal cross-validated error was therefore a poor guide to transport for one method in three. The same pattern appears elsewhere. RT-Transformer, evaluated after fine-tuning across 41 external data sets, produced R2 below −0.5 on some of them, and its authors state that the model “cannot be migrated to some datasets” [22]. A pretrained GIN applied to normal-phase systems well outside its source domain reached R2 × 100 of only 7.59 under its best transfer strategy and −37.13 under projection [15].
Transfer learning was the most consistent response to small local data sets. SMILES pretraining, weighted-autoencoder pretraining, MPNN and GIN pretraining, multiple-data-set learning, and adaptive representation selection all reported improvements after fine-tuning [1,2,12,15,38]. A GIN transferred from SMRT to 1,051 environmental pollutants increased R2 from 0.816 for the best conventional comparator to 0.894 [41]. CPORT used three-dimensional structure and applied the pretrained model to 45 external RPLC data sets without fine-tuning, finding Spearman correlation above 0.5 in 30 of them when the model was trained with a scaffold split and in 22 when it was trained with a random split [21]. RT-Transformer extended evaluation to 41 external retention-time data sets after fine-tuning [22]. In one multitarget QSRR study, both deep models trained from scratch achieved negative R2, that is, worse than predicting the mean, and were beaten by a plain support vector machine; transfer learning raised R2 to 0.66 and reduced MSE roughly fourfold [43].
Condition-aware learning reduced but did not remove domain shift. A model that vectorized the gradient program, eluent composition and column parameters and pretrained on the union of many small data sets, rather than on SMRT, outperformed five deep and four conventional comparators on most of 14 external RPLC data sets; pooling only four data sets totaling 1,309 compounds was already sufficient to beat SMRT-pretrained transfer methods [17]. Multitarget QSRR treated multiple RP systems jointly [43], and MC-Retention modeled column chemistry and buffer pH with calibrated uncertainty. Its aggregate cross-validation MAE was 15.5 s, falling to 8.2 s when the same analytes were represented under another column condition during training [19]. That improvement is practically useful, but it also illustrates why the relation between training and validation chemistry must be reported explicitly.
3.5. Practical Applications
Several studies have moved beyond error metrics to candidate identification. A combined RT–collision cross section (CCS) MLP placed 88.6% of predicted retention times within 2 min and used orthogonal RT and ion-mobility tolerances to retain plausible candidates; applied to real samples it retained the true compound in 96.7% of cases but at a false-positive rate of 84.1%, removing a potential false positive in 23.3% of identifications [3]. DeepGCN-RT reduced candidate sets by approximately 30% and increased top-1 identification by about 11% on the RIKEN-PlaSMA evaluation, using a filtering threshold of three times the validation MAE [34]. The MPNN study reported removal of up to 50% of false isomer identities using thresholds obtained from receiver-operating-characteristic curves [2]. GNN-RT set its threshold at two standard deviations of the validation error distribution and stated the resulting false-negative rate of approximately 4.5% [4]. Retip applied a ±1 min window against a 320,919-compound predicted database and removed on average 68% of candidate structures, rising to 84% for formula groups containing seven isomers [6]. Bayesian projection of DNN predictions placed the correct structure among the top three candidates in 68% of evaluated cases, ranking by z-scores that propagate the uncertainty of the projection rather than its point estimate alone [5].
Environmental and forensic applications extended candidate filtering to specific analyte groups. Early ANN models predicted most contaminants within a 2 min tolerance for broad-scope screening [7]. Later work targeted emerging pollutants with descriptor DNNs and graph-transfer models [33,41]. AI-SNPS2 combined molecular networking, spectral similarity, and an RT predictor for controlled and new psychoactive substances [42].
Industrial and routine-analysis studies emphasized stability and deployment. Molecular graph networks were evaluated on 7,552 internal drug-discovery compounds, with ChemProp and AttentiveFP outperforming XGBoost and a regular neural network and retaining accuracy on new chemical series over time [20]. A graph-attention model for a 120 s routine LC–MS method reported MAE 2.48 s [37]. Chrompredict and RT-Pred packaged models into user-facing software [39,40], while other work used predicted retention in pesticide analysis, metabolite annotation, and new-psychoactive-substance screening [6,16,23].
3.6. Risk of Biased Performance and Reporting Completeness
Per-study ratings across the five appraisal domains are given in Table 2 and summarized by domain in Figure 4. Model development and tuning was assessed at low risk of bias in 18 of 33 studies and performance evaluation in 19 of 33, whereas data provenance was low risk in 14, partitioning and leakage control reached low risk in 7, and generalizability in 1 (with 1 study unclear on partitioning due to an omitted split protocol). High risk of bias was concentrated in generalizability (11 studies) and partitioning and leakage control (6 studies), while data provenance and performance evaluation each had 3 studies at high risk, and model development only 1. Overall, 6 studies were rated at low risk of bias, 24 at moderate risk, and 3 at high risk (Pasin et al. [16], Belaid et al. [39], and Lee et al. [42]). The corpus is therefore not weak in the construction or measurement of models; it is weak in the design of the evaluations that license claims about new methods and new chemistry.
The principal risk was optimistic validation. Random molecular or record-level allocation was common. Supplementary Table S4 records the partition and validation design for each study. Random allocation was also used alongside nested cross-validation, source–target de-duplication, or property stratification. These safeguards address different sources of bias and do not by themselves test unseen scaffolds or chromatographic methods. One study did not report its partitioning protocol in the article body [17]. Several studies nonetheless applied stronger designs. One industrial study used scaffold splitting for both its held-out test set and its cross-validation folds and constructed a temporal split in which the earliest half of the data trained the model and ten chronologically later windows tested it. Nearest-neighbour Tanimoto similarity was used to measure how far the test chemistry drifted from the training set in each window [20]. CPORT trained under both random and scaffold splits and reported the difference [21]. MC-Retention stratified by chemical space using cluster-based downsampling so that no analyte structure appeared in both partitions, a control made necessary because each analyte carried retention times under eight conditions [19]. A pollutant study stratified on MACCS fingerprint clusters so that all 136 clusters were represented in training [33], Retip stratified on lipophilicity [6], and a transfer-learning study used the DeepChem scaffold and maximum-diversity splitters as an explicit stress test [12]. Nested cross-validation, which separates hyperparameter selection from performance estimation, was used in at least three studies rather than one: a probabilistic annotation study using stratified outer and inner loops [5], an autoencoder-pretraining study using nested ten-fold cross-validation repeated ten times [1], and a pollutant transfer study fitting all preprocessing parameters inside the inner training folds [41].
Multi-data-set testing was stronger evidence of transportability, but it frequently involved fine-tuning on the target system; such experiments estimate adaptation performance, not zero-shot external validity. Only two studies evaluated genuine zero-shot transport to an unseen chromatographic method, and both reported partial failure [9,21]. Four studies directly quantified related dimensions of data contamination, structural memorization, and similarity-dependent generalization. First, Kang et al. [34] quantified exact analyte leakage between pre-training and downstream evaluation: removing 14 training and 1 test duplicate shared between the pre-training corpus and the target test set raised test MAE from 21.45 to 24.43 s. Second, Beck et al. [19] demonstrated multi-condition identity leakage: allowing analyte structures to appear under another column condition during training halved aggregate cross-validation error from 15.5 to 8.2 s, showing that multi-condition models memorize compound-specific retentivity rather than learning purely condition-general rules. Third, Zaretckii et al. [21] evaluated structural partition shift: moving from random to scaffold splitting caused only a modest 2–4 s difference in internal validation MAE but drastically altered external transportability across 45 external RPLC data sets, the number on which the three-dimensional model substantially outperformed DNN and GNN baselines rose from 10 to 23, and those achieving Spearman correlation above 0.5 rose from 22 to 30. Finally, the originating SMRT study [11] characterized continuous similarity decay rather than discrete leakage, showing across nearest-neighbour Tanimoto tiers that prediction error trended higher as test molecules diverged from training chemistry. Duplicate records sharing an InChI were explicitly reconciled in only one study [15], while most literature left overlap between pre-training and downstream targets unverified.
Data representativeness was often unclear. SMRT enabled reproducible comparison on a scale, but it represents one chromatographic method and a particular chemical distribution. Performance on SMRT therefore cannot by itself establish accuracy for pesticides, emerging contaminants, proprietary pharmaceutical series, or short routine gradients; one industrial study showed that its internal library covered a larger region of chemical space than SMRT [37].
Reproducibility improved over time but remained uneven, and not monotonically: source code was released with a 2015 study [7], while several later studies deposited none. Source code or pretrained models were reported as available in 20 of 33 studies; the remainder described proprietary data or software, offered code on request, or gave no repository. Reporting replicate training runs, hyperparameter search boundaries, preprocessing exclusions, nonretained compounds, stereochemistry, and chromatographic metadata was inconsistent. Chromatographic conditions in particular were frequently absent from the article body and deferred to supplementary tables or to the originating data set, so that method context could not be assessed from the report itself; the clearest counterexample tabulates column, eluents, additives, molecule count and retention-time range for all 24 of its evaluation systems [15]. Because missing reporting was not interpreted as low risk, confidence in cross-study architecture rankings was limited even where individual papers reported strong internal performance.
4. Discussion
4.1. Principal Findings
Across the 33 included studies, deep learning supported retention-time prediction and adaptation to local RP-LC methods, while evidence for reliable prediction on unseen chemical scaffolds and chromatographic methods remains limited. Only 7 studies were rated at low risk of bias for partitioning and leakage control, and only 1 for generalizability. SMRT enabled large-scale representation learning, but differences in filtering, test composition, and training repeats prevent a general architecture ranking from published point estimates. Preprocessing effects can exceed the reported gains between models [5,22]. Experimental variability provides context for assessing the practical value of small improvements but does not establish statistical equivalence between models [11]. Architecture comparisons require a shared test set, identical preprocessing, paired predictions, and uncertainty estimates.
The most consistent positive finding, supported with moderate confidence, is that fine-tuning pretrained models improved adaptation to method-specific data in within-study comparisons [1,2,12,15,38]. Small target sets and incomplete separation of fine-tuning, model selection, and final evaluation limit confidence. Explicit chromatographic conditioning supported multi-method learning [16,17,19], but evidence for zero-shot transport remains limited. The two zero-shot studies assessed different endpoints, absolute-time prediction on withheld methods and rank correlation across external data sets [9,21]. Their results do not justify treating successful adaptation as evidence of transport without target-method data.
Graph-based representation learning was competitive and sometimes superior to conventional baselines, also with moderate confidence [4,20,35]. Differences in comparator tuning, chemical splits, and method information prevent a claim of universal superiority over sequence or descriptor models. Mean performance can also conceal failures: one comparison found that GCNs had lower MAE but more predictions with relative errors above 50% than descriptor baselines [35]. Error distributions are therefore needed alongside MAE.
Evidence that predicted retention improves molecular identification is promising but limited. Several studies reported that smaller candidate sets, fewer false identities, or better top-k rankings, outcomes that are closer to analytical utility than MAE alone [2,4,5,6,34]. However, thresholds were derived and evaluated retrospectively, and prospective evaluations under routine laboratory candidate distributions were scarce. Confidence in broad analytical, toxicological, or regulatory utility is therefore limited.
4.2. Implications for Model Development and Evaluation
Validation should match the intended use. Authors should distinguish interpolation within a known method, adaptation using target-method calibration data, and zero-shot transport without such data. Scaffold or similarity splits test new chemistry, while chronological test sets assess later chemical series [20,21]. Zero-shot evaluations should reserve entire methods or laboratories for final testing [9]. Overlap between pre-training and target corpora should be removed and its effect reported [34].
Authors should report stationary phase, column dimensions, particle size, mobile phases and additives, pH, gradient program, flow, temperature, measured dead volume, dwell or delay volume where relevant, and target units or normalization [11,15,19]. Models that use these parameters should document their encoding and handling of missing values [9]. Public data resources should retain the metadata in machine-readable form.
Performance reporting should include MAE and median absolute error, an error distribution or tolerance curve, and a scale-aware measure such as normalized error relative to gradient duration. One study defined its primary metric as root mean square error (RMSE) divided by the maximum measured retention time because an RMSE of 1 min has different implications on 10 and 40 min gradients [23]; another reported errors as percentages of gradient length [19]; and a third analyzed the heteroscedasticity of MAE and favored mean absolute percentage error for cross-method comparison [9]. Correlation or R2 should not be reported alone, and training fit should be distinguished from held-out performance [40]. Repeated training, bootstrap intervals, or formal paired comparisons are needed when small numerical differences support superiority claims. Formal between-model testing was rare. One study found no statistically significant differences between some models after adjusting for multiple comparisons [20], while another reported seed-to-seed variation larger than its claimed MAE improvement [14]. Applicability should be analyzed by chemical similarity, scaffold, ionization class, molecular size, and chromatographic regime. Predictive uncertainty is especially useful when a model rejects candidate structures or selects purification conditions. The corpus includes a variance-head and Monte Carlo-dropout implementation for aleatoric and epistemic uncertainty [19], and a separate Bayesian projection evaluated interval quality and propagated uncertainty into candidate ranking [5].
Candidate-filtering studies should report candidate counts before and after RT filtering, false exclusion of the true structure, top-k identification, threshold calibration, and inference time. Existing studies reported parts of this pipeline [3,4,5,6], but none reported the complete set. Prospective evaluations should test performance under routine laboratory candidate distributions. Method-development studies should also quantify avoided experiments and unsuccessful recommendations; chronological evaluation of compounds synthesized after training provides a precedent [20].
4.3. Limitations of the Evidence and Review
This review was restricted to English-language journal articles published from 2015 through August 3, 2026, and one report could not be retrieved; relevant evidence may therefore have been missed, and publication bias may favor positive findings. Risk-of-bias appraisal was not independently duplicated, leaving potential appraisal errors despite source checks. Although reporting followed PRISMA 2020, differences in datasets, chromatographic conditions, and evaluation metrics precluded meta-analysis. Performance estimates were not directly comparable because validation protocols, dataset sizes, and chemical distributions varied, and many studies relied on internal validation. Finally, the emphasis on established benchmarks may not capture the diversity of compounds and chromatographic methods encountered in routine laboratory practice.
5. Conclusions
Across 33 studies, the evidence most consistently supported transfer learning for adaptation to local RP-LC methods. Explicit chromatographic conditioning showed promise, but zero-shot transport remained weakly tested. Graph models were competitive, although heterogeneous evaluations prevented a reliable architecture ranking. On SMRT, studies using the broad retained-only scoring convention reported mean absolute errors of approximately 26–44 s, with differences in molecule filtering and test partitions. The 36 s mean repeat-measurement variability in the 198-compound quality-control subset provides experimental context, but it is distinct from prediction error and does not establish equivalence between models. Small improvements require matched evaluation and evidence of downstream analytical benefit.
Validation remains the main limitation. Only 7 of 33 studies had low risk of bias for partitioning and leakage control, and only 1 for generalizability. Future studies should use structure-aware and temporal splits, test unseen chromatographic methods, and report complete method metadata and calibrated uncertainty. Prospective evaluations should measure candidate-identification gains and false exclusions to establish when predicted retention can support routine analytical decisions.
Supplementary Materials
The supporting information can be downloaded at the website of this paper posted on Preprints.org. The Supplementary Information PDF contains the complete database searches, full-text exclusion reasons, the per-study risk-of-bias matrix, and 14 extracted fields for each included study.
Author Contributions
Conceptualization, data curation, formal analysis, investigation, methodology, software, visualization, and writing—original draft, S.M.; supervision, project administration, and resources, Y.K.; writing—review and editing, S.M. and Y.K. All authors have read and agreed to the published version of the manuscript.
Funding
This work was supported by a Research Grant of Pukyong National University (2025).
Institutional Review Board Statement
Not applicable.
Informed Consent Statement
Not applicable.
Data Availability Statement
The search strategies, full-text exclusion decisions, extracted study characteristics, and risk-of-bias ratings are provided in the Supplementary Information PDF. The pre-registered protocol is accessible on the Open Science Framework at https://osf.io/9qxwt/?view_only=97b7ddfaeecb4feab652ac5b8cf065e5.
Use of Artificial Intelligence
During the preparation of this manuscript, ChatGPT (OpenAI) was used for grammar checking, language editing, and improving readability. Following the use of these tools, the authors reviewed, revised, and verified all content and take full responsibility for the final published text.
Conflicts of Interest
The authors declare no conflicts of interest.
References
- Ju, R.; Liu, X.; Zheng, F.; Lu, X.; Xu, G.; Lin, X. Deep Neural Network Pretrained by Weighted Autoencoders and Transfer Learning for Retention Time Prediction of Small Molecules. ANALYTICAL CHEMISTRY 2021. [CrossRef]
- Osipenko, S.; Nikolaev, E.; Kostyukevich, Y. Retention Time Prediction with Message-Passing Neural Networks. SEPARATIONS 2022. [CrossRef]
- Mollerup, C.B.; Mardal, M.; Dalsgaard, P.W.; Linnet, K.; Barron, L.P. Prediction of collision cross section and retention time for broad scope screening in gradient reversed-phase liquid chromatography-ion mobility-high resolution accurate mass spectrometry. JOURNAL OF CHROMATOGRAPHY A 2018. [CrossRef]
- Yang, Q.; Ji, H.; Lu, H.; Zhang, Z. Prediction of Liquid Chromatographic Retention Time with Graph Neural Networks to Assist in Small Molecule Identification. ANALYTICAL CHEMISTRY 2021. [CrossRef]
- García, C.A.; Gil-de-la Fuente, A.; Barbas, C.; Otero, A. Probabilistic metabolite annotation using retention time prediction and meta-learned projections. JOURNAL OF CHEMINFORMATICS 2022. [CrossRef]
- Bonini, P.; Kind, T.; Tsugawa, H.; Barupal, D.K.; Fiehn, O. Retip: Retention Time Prediction for Compound Annotation in Untargeted Metabolomics. ANALYTICAL CHEMISTRY 2020. [CrossRef]
- Bade, R.; Bijlsma, L.; Miller, T.H.; Barron, L.P.; Sancho, J.V.; Hernández, F. Suspect screening of large numbers of emerging contaminants in environmental waters using artificial neural networks for chromatographic retention time prediction and high resolution mass spectrometry data analysis. SCIENCE OF THE TOTAL ENVIRONMENT 2015. [CrossRef]
- Haddad, P.R.; Taraji, M.; Szűcs, R. Prediction of Analyte Retention Time in Liquid Chromatography. Analytical Chemistry 2021, 93, 228–256. [CrossRef]
- Stienstra, C.M.K.; Nazdrajić, E.; Hopkins, W.S. From Reverse Phase Chromatography to HILIC: Graph Transformers Power Method-Independent Machine Learning of Retention Times. ANALYTICAL CHEMISTRY 2025. [CrossRef]
- Munro, K.; Miller, T.H.; Martins, C.P.; Edge, A.M.; Cowan, D.A.; Barron, L.P. Artificial neural network modelling of pharmaceutical residue retention times in wastewater extracts using gradient liquid chromatography-high resolution mass spectrometry data. JOURNAL OF CHROMATOGRAPHY A 2015. [CrossRef]
- Domingo-Almenara, X.; Guijas, C.; Billings, E.; Montenegro-Burke, J.R.; Uritboonthai, W.; Aisporna, A.E.; Chen, E.; Benton, H.P.; Siuzdak, G. The METLIN small molecule dataset for machine learning-based retention time prediction. NATURE COMMUNICATIONS 2019. [CrossRef]
- Osipenko, S.; Botashev, K.; Nikolaev, E.; Kostyukevich, Y. Transfer learning for small molecule retention predictions. JOURNAL OF CHROMATOGRAPHY A 2021. [CrossRef]
- Fedorova, E.S.; Matyushin, D.D.; Plyushchenko, I.V.; Stavrianidi, A.N.; Buryak, A.K. Deep learning for retention time prediction in reversed-phase liquid chromatography. JOURNAL OF CHROMATOGRAPHY A 2022. [CrossRef]
- Mazraedoost, S.; Sedigh Malekroodi, H.; Žuvela, P.; Yi, M.; Liu, J.J. Prediction of Chromatographic Retention Time of a Small Molecule from SMILES Representation Using a Hybrid Transformer-LSTM Model. JOURNAL OF CHEMICAL INFORMATION AND MODELING 2025. [CrossRef]
- Kwon, Y.; Kwon, H.; Han, J.; Kang, M.; Kim, J.Y.; Shin, D.; Choi, Y.S.; Kang, S. Retention Time Prediction through Learning from a Small Training Data Set with a Pretrained Graph Neural Network. ANALYTICAL CHEMISTRY 2023. [CrossRef]
- Pasin, D.; Mollerup, C.B.; Rasmussen, B.S.; Linnet, K.; Dalsgaard, P.W. Development of a single retention time prediction model integrating multiple liquid chromatography systems: Application to new psychoactive substances. ANALYTICA CHIMICA ACTA 2021. [CrossRef]
- Li, Y.; Dong, K.; Yu, D.; Huang, D.; Liu, X.; Xu, G.; Lin, X. Prediction of Retention Time by Combining Multiple Data Sets with Chromatographic Parameter Vectorization and Transfer Learning. ANALYTICAL CHEMISTRY 2025. [CrossRef]
- Shi, Z.; Yi, Y.; Madrigal, E.; Hrovat, F.; Zhang, K.; Lin, J. A generalizable methodology for predicting retention time of small molecule pharmaceutical compounds across reversed-phase HPLC columns. JOURNAL OF CHROMATOGRAPHY A 2025. [CrossRef]
- Beck, A.G.; Jones, G.; Singh, A.; Fine, J.; Shrestha, R.; Barrientos, R.C.; Sherer, E.C.; Williams, K.B.; Regalado, E.L.; Aggarwal, P. Uncertainty-Aware Learning of Multiple Conditions as a Framework for Streamlined Retention Time Prediction to Accelerate Method Development. ANALYTICAL CHEMISTRY 2026. [CrossRef]
- Vik, D.; Pii, D.; Mudaliar, C.; Nørregaard-Madsen, M.; Kontijevskis, A. Performance and robustness of small molecule retention time prediction with molecular graph neural networks in industrial drug discovery campaigns. SCIENTIFIC REPORTS 2024. [CrossRef]
- Zaretckii, M.; Bashkirova, I.; Osipenko, S.; Kostyukevich, Y.; Nikolaev, E.; Popov, P. 3D chemical structures allow robust deep learning models for retention time prediction. DIGITAL DISCOVERY 2022. [CrossRef]
- Xue, J.; Wang, B.; Ji, H.; Li, W. RT-Transformer: retention time prediction for metabolite annotation to assist in metabolite identification. BIOINFORMATICS 2024. [CrossRef]
- Parinet, J. Predicting reversed-phase liquid chromatographic retention times of pesticides by deep neural networks. Heliyon 2021. [CrossRef]
- Xie, J.; Chen, S.; Zhao, L.; Dong, X. Application of artificial intelligence to quantitative structure–retention relationship calculations in chromatography. Journal of Pharmaceutical Analysis 2025, 15, 101155. [CrossRef]
- Bandini, E.; Kajtazi, A.; Szűcs, R.; Lynen, F. The role and choice of molecular descriptors for predicting retention times in HPLC: A comprehensive review. TrAC Trends in Analytical Chemistry 2025, 187, 118207. [CrossRef]
- Rahman, M.S.; Khan, M.K.H.; Kawakami, J.; Wang, K.; Diaz, A.; Riley, F. Recent applications of liquid chromatography-based QSRR models for pharmaceutically relevant small molecules: A review. Journal of Pharmaceutical Sciences 2026, 115, 104047. [CrossRef]
- Hupatz, H.; Rahu, I.; Wang, W.C.; Peets, P.; Palm, E.H.; Kruve, A. Critical review on in silico methods for structural annotation of chemicals detected with LC/HRMS non-targeted screening. Analytical and Bioanalytical Chemistry 2025, 417, 473–493. [CrossRef]
- Alves, E.; Gurupadayya, B.M.; Prabhakaran, P. Artificial Intelligence in HPLC Method Development: A Critical Review of Technological Integration, Limitations, and Future Directions. Critical Reviews in Analytical Chemistry 2025. Advance online publication, . [CrossRef]
- Sille, F.C.M.; Prasse, C.; Luechtefeld, T.; Hartung, T. AI redefines mass spectrometry chemicals identification: retention time prediction in metabolomics and for a Human Exposome Project. Frontiers in Public Health 2025, 13, 1687056. [CrossRef]
- Liu, Y.; Yoshizawa, A.C.; Ling, Y.; Okuda, S. Insights into predicting small molecule retention times in liquid chromatography using deep learning. Journal of Cheminformatics 2024, 16, 113. [CrossRef]
- Page, M.J.; McKenzie, J.E.; Bossuyt, P.M.; Boutron, I.; Hoffmann, T.C.; Mulrow, C.D.; Shamseer, L.; Tetzlaff, J.M.; Akl, E.A.; Brennan, S.E.; et al. The PRISMA 2020 statement: An updated guideline for reporting systematic reviews. BMJ 2021, 372, n71. [CrossRef]
- Moons, K.G.M.; et al. PROBAST+AI: An updated quality, risk of bias, and applicability assessment tool for prediction models using regression or artificial intelligence methods. BMJ 2025, 388, e082505. [CrossRef]
- He, Q.; Li, H.; Jin, B.; Li, W.; Shao, B.; Zhang, L. QSRR model for identification and screening of emerging pollutants based on artificial intelligence algorithms. ENVIRONMENTAL POLLUTANTS AND BIOAVAILABILITY 2022. [CrossRef]
- Kang, Q.; Fang, P.; Zhang, S.; Qiu, H.; Lan, Z. Deep graph convolutional network for small-molecule retention time prediction. JOURNAL OF CHROMATOGRAPHY A 2023. [CrossRef]
- Kensert, A.; Bouwmeester, R.; Efthymiadis, K.; Van Broeck, P.; Desmet, G.; Cabooter, D. Graph Convolutional Networks for Improved Prediction and Interpretability of Chromatographic Retention Data. ANALYTICAL CHEMISTRY 2021. [CrossRef]
- Cheng, G.; Wang, B.; Bai, N.; Li, W. ABCoRT: Retention Time Prediction for Metabolite Identification via Atom-Bond Co-Learning. JOURNAL OF CHEMICAL INFORMATION AND MODELING 2025. [CrossRef]
- Dymura, S.A.; Viniichuk, O.O.; Melnykov, K.P.; Radchenko, D.S.; Grygorenko, O.O. Machine Learning-Based Retention Time Prediction Tool for Routine LC-MS Data Analysis. JOURNAL OF CHEMICAL INFORMATION AND MODELING 2025. [CrossRef]
- Wang, X.; Zheng, F.; Sheng, M.; Xu, G.; Lin, X. Retention time prediction for small samples based on integrating molecular representations and adaptive network. JOURNAL OF CHROMATOGRAPHY B-ANALYTICAL TECHNOLOGIES IN THE BIOMEDICAL AND LIFE SCIENCES 2023. [CrossRef]
- Belaid, W.F.; Dekhira, A.; Lesot, P.; Ferroukhi, O. Development of deep learning software to improve HPLC and GC predictions using a new crown-ether based mesogenic stationary phase and beyond. JOURNAL OF CHROMATOGRAPHY A 2025. [CrossRef]
- Zakir, M.; LeVatte, M.A.; Wishart, D.S. RT-Pred: A web server for accurate, customized liquid chromatography retention time prediction of chemicals. Journal of Chromatography A 2025. [CrossRef]
- Deng, J.; Chen, J.; Wang, J.; Li, X.; Liu, S.; Ge, L.; Ying, G.G.; Chen, C.E. Retention time prediction of emerging contaminants via transfer learning with graph neural networks. JOURNAL OF HAZARDOUS MATERIALS 2026. [CrossRef]
- Lee, S.Y.; Lee, J.; Song, J.; Lee, M.; Ok, H.J.; Han, E.; Hong, Y.; Oh, H.B. AI-SNPS2: A Multi-Layered LC-MS/MS Platform Integrating Molecular Networking and Retention Time Prediction for Identifying Controlled and New Psychoactive Substances. ANALYTICAL CHEMISTRY 2025. [CrossRef]
- Kumari, P.; Guilherme, M.S.R.; Choudhary, P.; Van Laethem, T.; Fillet, M.; Hubert, P.; Sacre, P.Y.; Hubert, C. Transfer Learning Approach to Multitarget QSRR Modeling in RPLC. JOURNAL OF CHEMICAL INFORMATION AND MODELING 2024. [CrossRef]
Figure 1.
PRISMA 2020 flow diagram for study selection. Objective bibliographic filters comprised date, language, publication-type, and article-type restrictions. The single report not retrieved was not counted among the 33 full-text exclusions. EC-1, ineligible prediction target; EC-2, ineligible analyte; EC-3, no eligible deep-learning model; EC-4, ineligible chromatography.
Figure 1.
PRISMA 2020 flow diagram for study selection. Objective bibliographic filters comprised date, language, publication-type, and article-type restrictions. The single report not retrieved was not counted among the 33 full-text exclusions. EC-1, ineligible prediction target; EC-2, ineligible analyte; EC-3, no eligible deep-learning model; EC-4, ineligible chromatography.
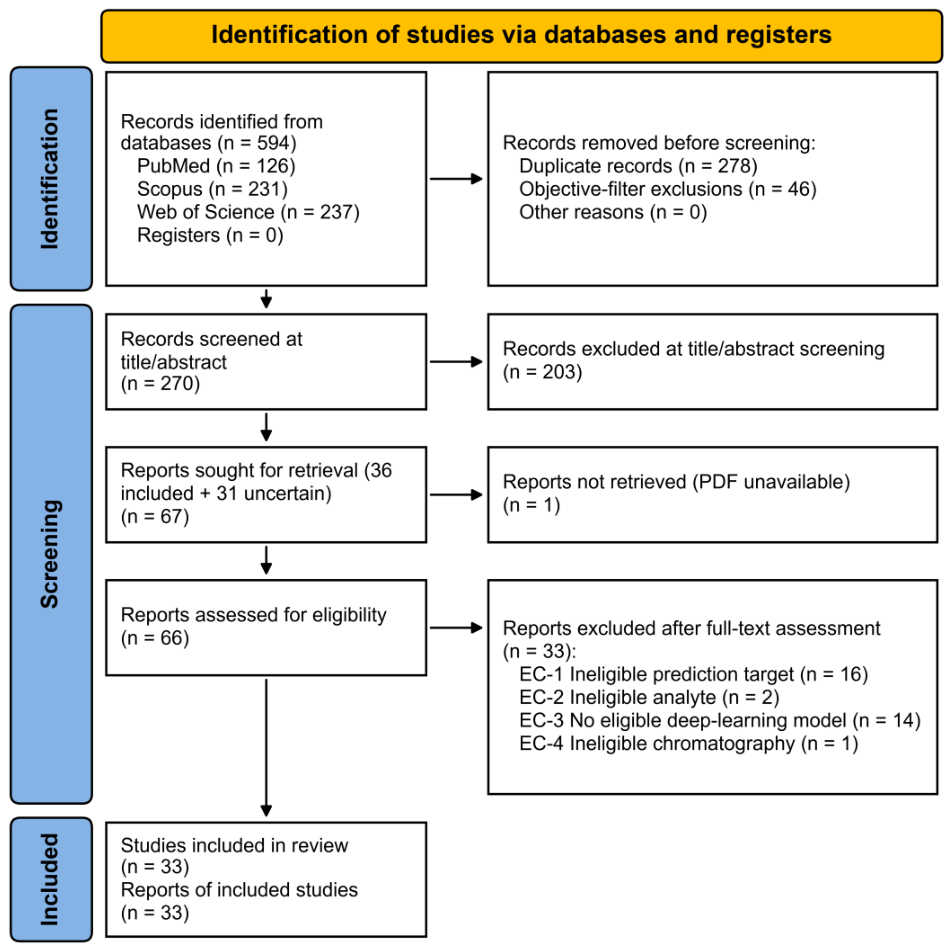
Figure 2.
Overview of included evidence and selection results. (A) Publication timeline of the 33 included studies. (B) Distribution of included studies by primary deep-learning model family. (C) Distribution of full-text exclusions by primary hierarchy code (n = 33 retrieved reports).
Figure 2.
Overview of included evidence and selection results. (A) Publication timeline of the 33 included studies. (B) Distribution of included studies by primary deep-learning model family. (C) Distribution of full-text exclusions by primary hierarchy code (n = 33 retrieved reports).
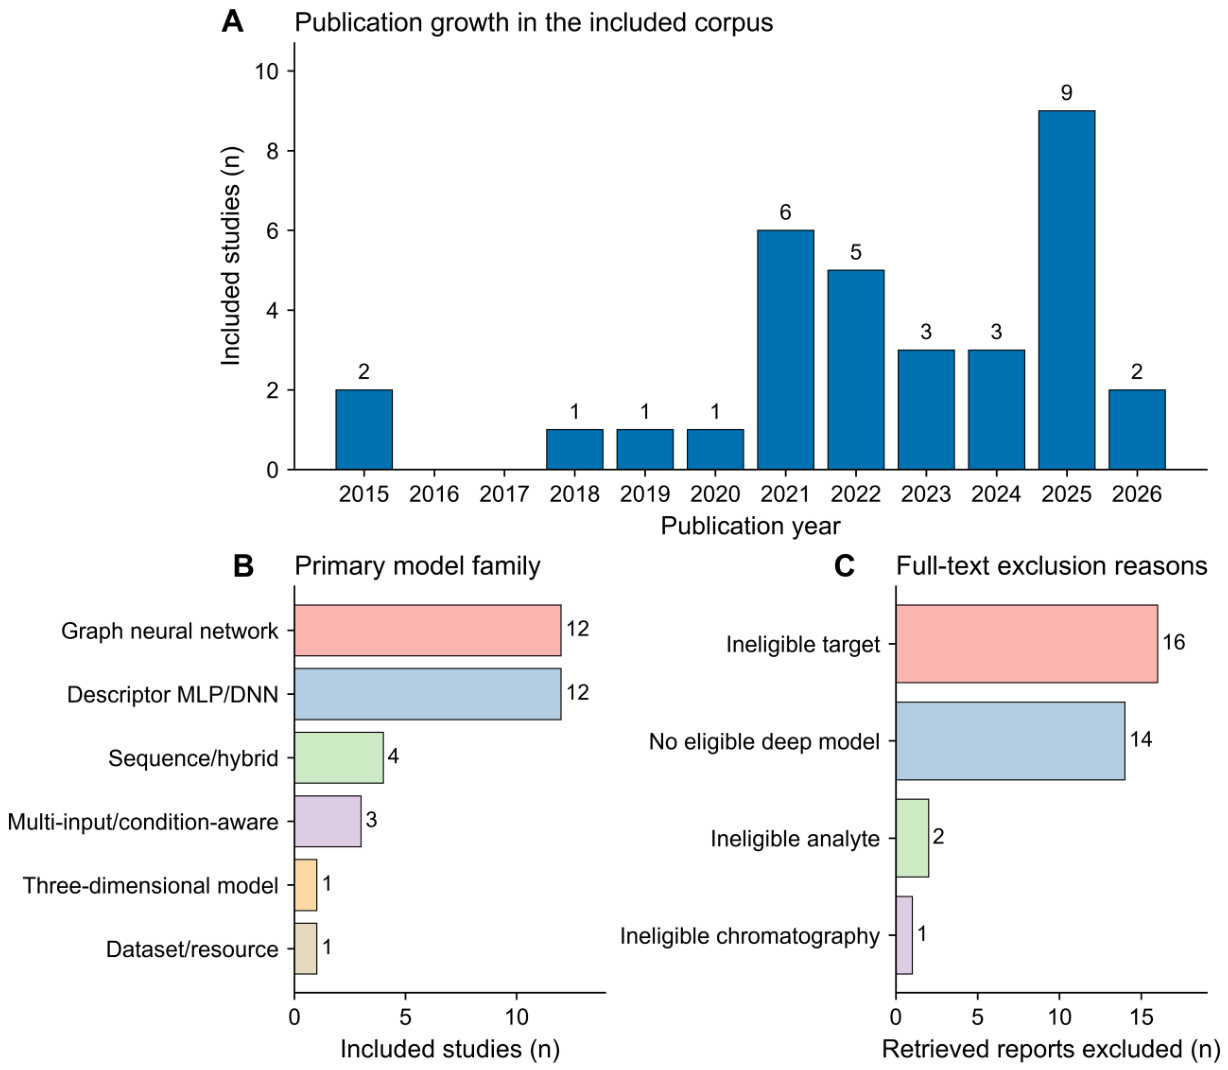
Figure 3.
Reported test MAE on METLIN SMRT for 15 models. Filled markers indicate retained-only evaluations (n = 13); open markers include all molecules (n = 2). Error bars show reported standard deviations. The shaded band marks peak width (20–30 s), and the dashed line marks mean repeat-measurement variability (36 s); neither defines model equivalence. Differences in filtering and validation prevent a direct performance ranking.
Figure 3.
Reported test MAE on METLIN SMRT for 15 models. Filled markers indicate retained-only evaluations (n = 13); open markers include all molecules (n = 2). Error bars show reported standard deviations. The shaded band marks peak width (20–30 s), and the dashed line marks mean repeat-measurement variability (36 s); neither defines model equivalence. Differences in filtering and validation prevent a direct performance ranking.
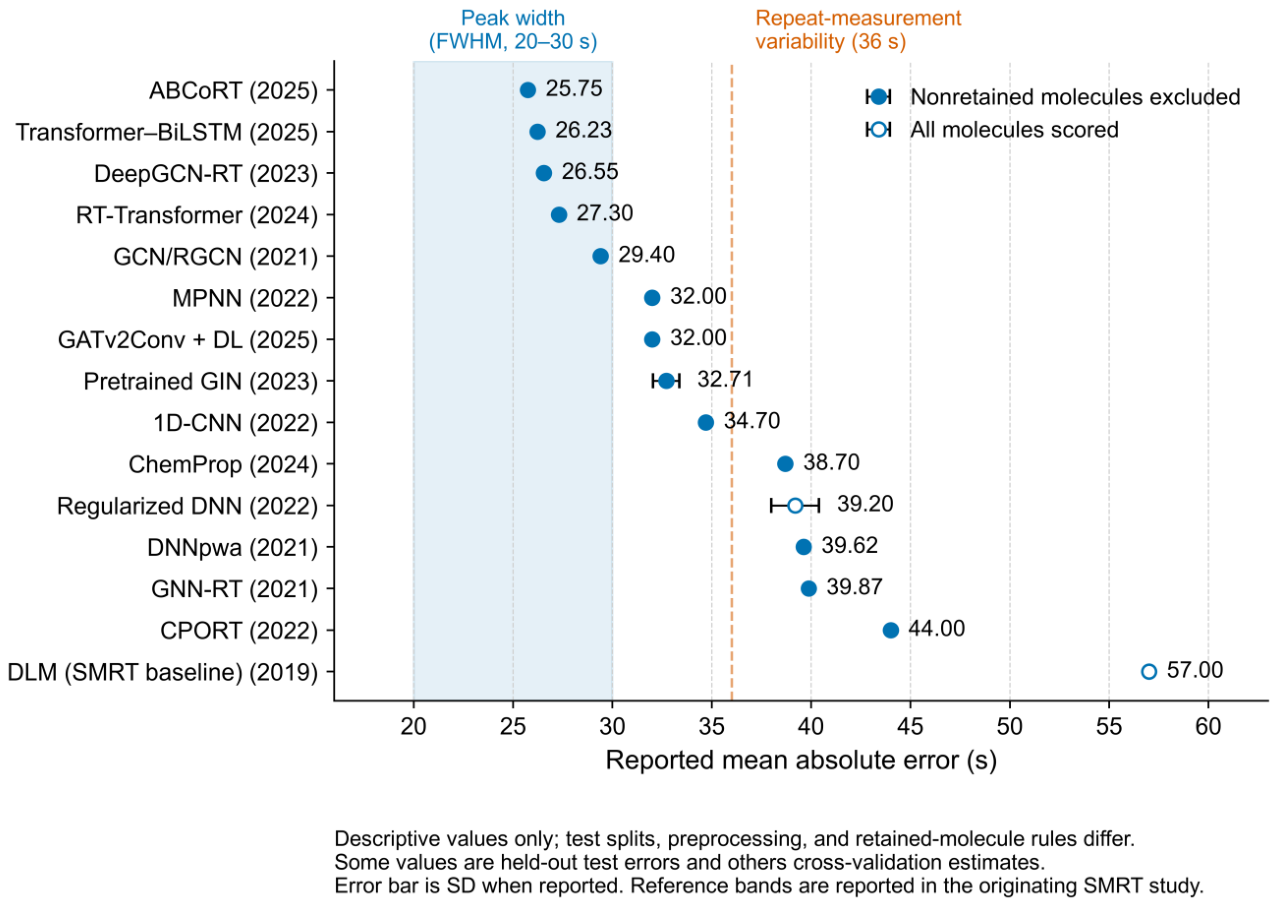
Figure 4.
Risk of biased performance across the five appraisal domains and overall, as a share of the 33 included studies. Segment labels give study counts. Development and evaluation are predominantly low risk, whereas generalizability is predominantly moderate or high. Unclear denotes information absent from the report rather than an intermediate rating and was not treated as favourable. No pooled numerical score was computed across domains; the overall row is a per-study narrative assessment, not a sum.
Figure 4.
Risk of biased performance across the five appraisal domains and overall, as a share of the 33 included studies. Segment labels give study counts. Development and evaluation are predominantly low risk, whereas generalizability is predominantly moderate or high. Unclear denotes information absent from the report rather than an intermediate rating and was not treated as favourable. No pooled numerical score was computed across domains; the overall row is a per-study narrative assessment, not a sum.
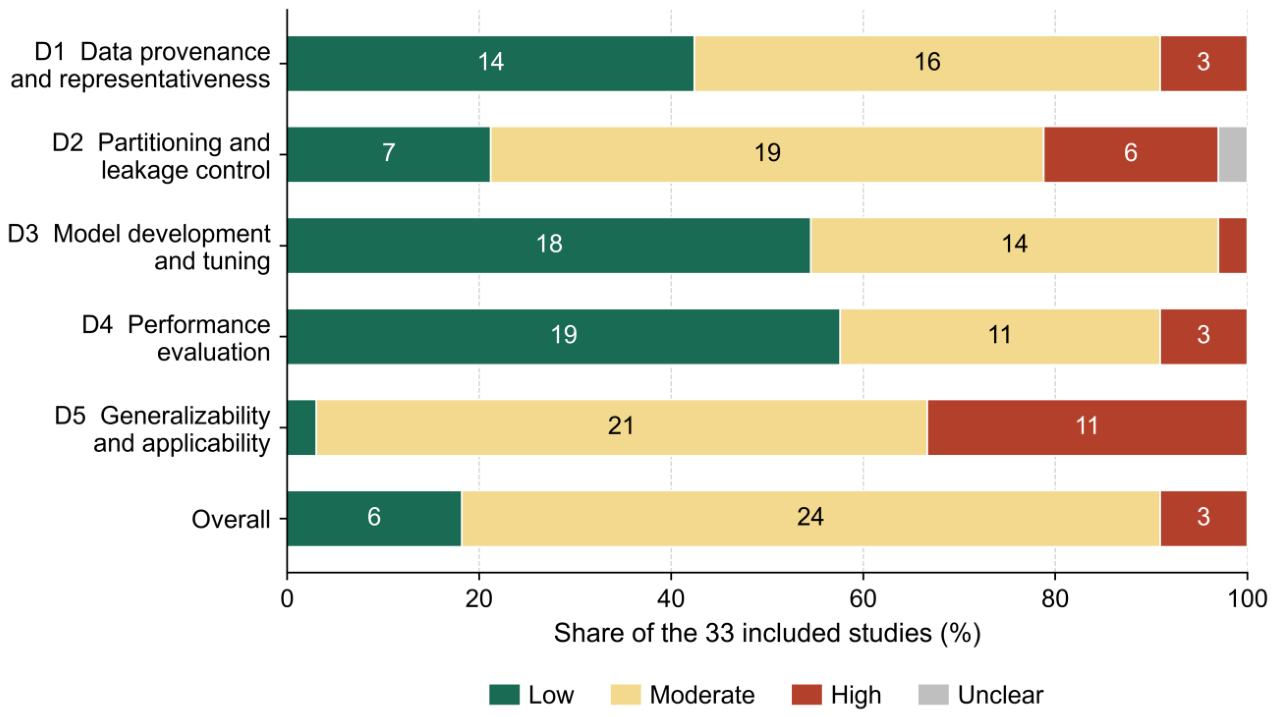

Table 1.
Included studies and principal reported evidence.
| Study | Model or setting | Principal reported result |
| Pasin et al. (2021) [16] | Multi-system descriptor MLP | Test R2 = 0.942 and MAE 0.583 min (n = 193). |
| Munro et al. (2015) [10] | Generalized regression neural network for wastewater residues | Seventy-fifth-percentile error approximately 1.3 min; the reported network was a GRNN that outperformed the three- and four-layer MLPs also tested. |
| Mollerup et al. (2018) [3] | Four-layer RT–CCS MLP | 88.6% of 827 predictions within 2 min. |
| Osipenko et al. (2021) [12] | Self-supervised SMILES transfer | RP data-set MAE range 88–248 s. |
| Fedorova et al. (2022) [13] | One-dimensional CNN | Mean and median absolute errors 34.7 and 18.7 s. |
| Kang et al. (2023) [34] | 16-layer residual DeepGCN-RT | SMRT MAE 26.55 s and MAPE 3.3%. |
| Belaid et al. (2025) [39] | Configurable deep-learning software | R2 > 0.75 with ±7.8 s error on a 1,023-molecule reversed-phase METLIN subset; the R2 = 0.95 headline refers to the author’s crown-ether phase run in both normal and reversed mode. |
| Shi et al. (2025) [18] | Cross-column ANN | Outperformed direct mapping only for dissimilar column pairs (linear R2 < 0.8); direct mapping gave lower RMSEP in most pairs. |
| Zakir et al. (2025) [40] | Customized web-server models | Reversed-phase test R2 0.86–0.98 with MAE 0.18–1.66 min; the R2 = 0.95 figure is a training-set mean over 13 RP and 7 HILIC methods. |
| Parinet (2021) [23] | DNN for pesticides | Validation R2 = 0.82, RMSE 0.67 min, 6% error normalized to gradient duration (n = 198). |
| Deng et al. (2026) [41] | GIN transfer to pollutants | Target-domain R2 = 0.894 versus 0.816 for the best conventional model. |
| Bade et al. (2015) [7] | Four-layer back-propagation MLP | 85% within 2 min in training and verification; 95% in an additional test. |
| Yang et al. (2021) [4] | GNN-RT | Mean and median relative errors are 4.9% and 3.2%. |
| Kensert et al. (2021) [35] | Graph convolutional networks | MAE 5–25% lower than benchmarks or within 5% of them. |
| Ju et al. (2021) [1] | Weighted-autoencoder pretraining | Mean and median relative errors 4.9% and 3.1%. |
| Stienstra et al. (2025) [9] | Method-independent Graphormer-RT | Internal test MAE 29.3 ± 0.6 s across 191 methods; zero-shot MAE on three held-out methods 42.7, 43.9 and 596.8 s. |
| Li et al. (2025) [17] | Condition vectorization and transfer | Beat five deep and four conventional comparators on most of 14 external RPLC sets (e.g. MAE 147.77 s versus 244–324 s). |
| Lee et al. (2025) [42] | ANN within AI-SNPS2 | ANN test R2 = 0.948, MAE 0.797 min; XGBoost achieved the best reported accuracy (R2 = 0.964, MAE 0.585). |
| Beck et al. (2026) [19] | Uncertainty-aware multi-condition GNN | Cross-validation R2 = 0.86, MAE 15.5 s; selective training MAE 8.2 s. |
| Bonini et al. (2020) [6] | Retip/Keras model | RPLC MAE 0.57 min. |
| Kumari et al. (2024) [43] | Multitarget transfer QSRR | Multitarget transfer reduced MSE from 60.83 to 15.15 and raised R2 from −0.38 to 0.66; both models trained from scratch were worse than the mean. |
| Cheng et al. (2025) [36] | Atom–bond co-learning | MAE 25.75 s and mean relative error 3.24%. |
| Mazraedoost et al. (2025) [14] | Hybrid transformer–BiLSTM | MAE 26.23 s, MAPE 3.25%, and R2 = 0.91. |
| Dymura et al. (2025) [37] | GATv2-based routine LC–MS tool | MAE 2.48 s for a 120 s method (2.1% of the run); 32 s on SMRT under 10-fold cross-validation. |
| Domingo-Almenara et al. (2019) [11] | METLIN SMRT data resource and baseline | Released 80,038 measured records; repeat measurement of the same molecule varied by 36 s (mean) and 18 s (median). Projection to four external methods gave median errors of 5.7–210 s. |
| He et al. (2022) [33] | Descriptor DNN for pollutants | Reported R2 = 0.913. |
| Xue et al. (2024) [22] | GAT plus one-dimensional transformer | Absolute error 27.30 s after removal of nonretained molecules; transfer tested broadly. |
| Osipenko et al. (2022) [2] | Message-passing neural network | SMRT mean/median errors 32/16 s; transfer improved accuracy by up to 30%. |
| Wang et al. (2023) [38] | Adaptive multi-representation network | Outperformed comparison methods on most metrics across 14 small data sets. |
| Kwon et al. (2023) [15] | Pretrained GIN for small samples | Best average rank (1.17 of seven transfer strategies) across 24 systems; SMRT MAE 32.71 ± 0.66 s. |
| Vik et al. (2024) [20] | ChemProp and AttentiveFP in industry | ChemProp SMRT mean error 38.70 s and stable performance on new series. |
| Zaretckii et al. (2022) [21] | Three-dimensional CPORT model | Zero-shot correlation above 0.5 in 30 of 45 external RPLC data sets using a scaffold split (22 of 45 with a random split). |
| García et al. (2022) [5] | Regularized DNN plus Bayesian meta-learning | SMRT MAE 39.2 ± 1.2 s over all molecules and 34.0 ± 0.9 s over retained molecules only; correct candidate in top three for 68% of cases. |
Table 2.
Risk of biased performance for each included study across five appraisal domains.
| Study | D1 | D2 | D3 | D4 | D5 | Overall |
| Pasin et al. (2021) [16] | M | H | M | M | H | H |
| Munro et al. (2015) [10] | L | M | M | L | H | M |
| Mollerup et al. (2018) [3] | L | M | L | L | H | M |
| Osipenko et al. (2021) [12] | M | M | M | M | M | M |
| Fedorova et al. (2022) [13] | L | H | L | L | M | M |
| Kang et al. (2023) [34] | L | M | L | L | M | M |
| Belaid et al. (2025) [39] | H | H | H | H | H | H |
| Shi et al. (2025) [18] | M | L | M | M | M | M |
| Zakir et al. (2025) [40] | M | M | M | H | M | M |
| Parinet (2021) [23] | H | M | M | M | H | M |
| Deng et al. (2026) [41] | M | L | L | L | M | L |
| Bade et al. (2015) [7] | L | M | M | L | H | M |
| Yang et al. (2021) [4] | L | M | M | L | M | M |
| Kensert et al. (2021) [35] | M | M | L | L | M | M |
| Ju et al. (2021) [1] | L | M | L | M | M | M |
| Stienstra et al. (2025) [9] | L | L | L | L | M | L |
| Li et al. (2025) [17] | M | U | M | H | M | M |
| Lee et al. (2025) [42] | M | H | M | M | H | H |
| Beck et al. (2026) [19] | L | L | L | L | M | L |
| Bonini et al. (2020) [6] | L | M | L | L | M | M |
| Kumari et al. (2024) [43] | M | H | M | M | H | M |
| Cheng et al. (2025) [36] | M | H | L | M | M | M |
| Mazraedoost et al. (2025) [14] | M | M | L | M | M | M |
| Dymura et al. (2025) [37] | L | M | L | L | H | M |
| Domingo-Almenara et al. (2019) [11] | L | M | M | L | H | M |
| He et al. (2022) [33] | H | M | M | M | H | M |
| Xue et al. (2024) [22] | M | M | L | L | M | M |
| Osipenko et al. (2022) [2] | M | M | M | L | M | M |
| Wang et al. (2023) [38] | M | M | L | M | M | M |
| Kwon et al. (2023) [15] | L | M | L | L | M | M |
| Vik et al. (2024) [20] | M | L | L | L | L | L |
| Zaretckii et al. (2022) [21] | L | L | L | L | M | L |
| García et al. (2022) [5] | M | L | L | L | M | L |
D1, data provenance and representativeness; D2, partitioning and leakage control; D3, model development and tuning; D4, performance evaluation; D5, generalizability and applicability. L, low; M, moderate; H, high; U, unclear. Judgements follow the review-specific framework described in the Methods; missing information was judged unclear rather than favourable, and no pooled score was computed across domains. Studies judged low risk: D1 14, D2 7, D3 18, D4 19, D5 1 of 33. The reason for each judgement is given in Supplementary Table S3.
Disclaimer/Publisher’s Note: The statements, opinions and data contained in all publications are solely those of the individual author(s) and contributor(s) and not of MDPI and/or the editor(s). MDPI and/or the editor(s) disclaim responsibility for any injury to people or property resulting from any ideas, methods, instructions or products referred to in the content. |
© 2026 by the authors. Licensee MDPI, Basel, Switzerland. This article is an open access article distributed under the terms and conditions of the Creative Commons Attribution (CC BY) license (http://creativecommons.org/licenses/by/4.0/).
Copyright: This open access article is published under a Creative Commons CC BY 4.0 license, which permit the free download, distribution, and reuse, provided that the author and preprint are cited in any reuse.