

Submitted:
03 November 2026
Posted:
16 November 2026
You are already at the latest version
Abstract
Flowering in sugarcane is essential for genetic improvement but can reduce cane and sugar yield in commercial production. Experimental studies, including Australian work, have demonstrated flowering-associated yield losses, yet weak genetic correlations between flowering propensity, cane yield and commercial cane sugar have been interpreted as grounds for assigning little negative selection weight to flowering. We argue that these findings address different questions: genetic correlations describe associations among genotypes, whereas the physiological penalty is the yield foregone when a genotype flowers rather than remaining vegetative. A weak genetic correlation therefore cannot exclude a substantial causal penalty. We propose a developmental sink-strength hypothesis in which reproductive commitment both terminates the production of new vegetative phytomers and establishes reproductive carbon demand that may constrain biomass accumulation in internodes still developing at floral initiation. Reduced internode dimensions or functional storage tissue could subsequently limit sucrose mass even where sucrose concentration is maintained or temporarily increased. The contribution of this proposed mechanism to observed yield losses remains unquantified. We identify controlled within-genotype comparisons, internode-resolved measurements and field assessments across flowering and harvest conditions as priorities for separating physiological mechanisms and estimating commercial losses. Sugarcane selection should account for losses in harvestable cane biomass and recoverable sugar without compromising access to reproductively competent parents.
Keywords:
sugarcane
; floral initiation
; sink strength
; carbon allocation
; growth respiration
; internode morphology
; pithiness
; genetic correlation
; sucrose yield
1. Introduction
Few traits in sugarcane illustrate the tension between crop physiology and plant breeding as clearly as flowering. For commercial production, flowering is frequently regarded as undesirable because the transition from vegetative to reproductive development terminates the production of new vegetative phytomers, alters carbon allocation and may be followed by pithiness, side-shooting, canopy senescence and deterioration in recoverable sugar [1]. For the breeder, however, flowering is indispensable. Sexual recombination requires fertile inflorescences and sufficiently synchronised flowering among selected parents. Consequently, elite genotypes that flower poorly may be difficult to incorporate into breeding programmes [1,2].
These contrasting requirements have contributed to two apparently opposing approaches to flowering in sugarcane improvement. One favours selection against flowering because reproductive development can reduce cane and sugar yield [3]. The other questions the value of imposing substantial negative selection pressure on flowering propensity, particularly where genetic correlations between flowering and economically important traits, including cane yield and commercial cane sugar (CCS), are weak [4]. Strong selection against flowering may also reduce the availability of valuable parental germplasm for subsequent crossing.
The disagreement turns on an important difference in inference. Controlled comparisons can establish the yield foregone when flowering occurs, whereas correlations among genotypes describe relationships between inherited traits. Weak genetic correlations cannot, by themselves, establish that flowering is physiologically or commercially inconsequential. The distinction is particularly important when extensive flowering occurs in commercial crops.
An additional consideration is that flowering represents a developmental transition rather than simply the appearance of an inflorescence. Floral initiation changes the developmental programme of the shoot apex and establishes reproductive carbon demand while portions of the culm may still be undergoing substantial growth and biomass accumulation. The physiological consequences may therefore extend beyond the visible reproductive structures and the deterioration sometimes observed after flowering. In particular, reproductive development may influence the final dimensions and biomass of developing internodes, with consequences for their subsequent capacity to accumulate sucrose. Although this interpretation is consistent with established principles of sugarcane sink physiology [5,6], its quantitative contribution to flowering-associated yield losses remains to be demonstrated.
The objective of this paper is to examine the experimental evidence for flowering-associated yield losses and propose a developmental sink-strength hypothesis to explain how reproductive development may influence culm biomass and sucrose accumulation. We distinguish the physiological consequences of flowering from genetic associations between flowering propensity and yield, consider the implications for sugarcane breeding and identify measurements needed to test the proposed mechanism. We argue that demonstrated flowering-associated yield losses must not be discounted on the basis of weak genetic correlations, while the magnitude, developmental mechanism and appropriate selection response require evaluation under defined production conditions.
2. Experimental Evidence for Flowering-Associated Yield Losses
The effect of flowering on sugarcane productivity has been investigated through both field observations and experiments in which reproductive development was manipulated. These approaches do not provide equivalent evidence of causation. Comparisons between naturally flowering and non-flowering stalks can be informative, but the two groups may differ in vigour, developmental stage or exposure to environmental conditions before flowering occurs. Such comparisons cannot, by themselves, establish how the same genotype would have performed had floral initiation been prevented [1].
Stronger evidence comes from experiments that suppress or induce flowering within otherwise comparable material. In their synthesis of flowering and yield, Berding and Hurney [3] report an Australian experiment in which night-break lighting was used to manipulate flowering. The flowering treatment was associated with reductions of 6.8% in cane yield, 3.0% in sugar content and 9.4% in sugar yield relative to the non-flowering comparison. These values demonstrate that flowering can impose a measurable penalty on both biomass production and recoverable sugar under the conditions tested. They should not, however, be interpreted as universal effect sizes: responses depend on genotype, crop development and the production environment [1,3].
Earlier field studies also reported benefits from suppressing flowering, although the magnitude and sometimes the direction of the response varied [1,7,8,9]. These reports encompass different response variables, including cane yield, sugar yield, juice quality and fibre content. They should not be treated as interchangeable measures of a single flowering effect: a change in juice composition need not imply a corresponding change in harvestable cane mass, and an increase in sucrose concentration does not necessarily increase sugar yield per unit area. The earlier investigations of yield and quality by Rao [7] and juice quality and fibre by Rao and Naresh Kumar [8] are therefore relevant to distinct components of the commercial response, rather than direct tests of a single carbon-allocation mechanism. An important reason is that flowering is not a single event occurring at the time the panicle becomes visible. Floral initiation precedes visible arrowing by a substantial interval, during which reproductive structures develop and vegetative growth is altered [1]. Thus, the interval between initiation and harvest, rather than flowering status recorded only at harvest, is likely to influence the observed outcome. A culm induced shortly before harvest has less opportunity to express the consequences of reproductive development than one induced while substantial vegetative growth remains possible.
The response of sucrose concentration further complicates interpretation. Following reproductive commitment, the cessation of new vegetative phytomer production may reduce demand for assimilates from newly initiated leaves and internodes. Under some conditions, this can be accompanied by an initial increase in sucrose concentration or apparent ripening [1]. Such a response does not necessarily indicate an increase in total sucrose produced per culm or per hectare. Sugar concentration and sugar mass are distinct outcomes: a reduction in cane biomass can outweigh an increase in concentration. Conversely, with increasing time after flowering, canopy ageing, side-shoot development, pithiness and stalk deterioration may reduce cane quality or recoverable sugar, with the severity depending on genotype and environment [1].
The importance of distinguishing the induction process from later crop deterioration is also illustrated by interventions that modify flowering incidence or timing. For example, Endres et al. [10] investigated foliar calcium treatments that reduced or delayed flowering. Such interventions are relevant to flowering management, but their effects on yield cannot automatically be attributed solely to reproductive suppression unless other treatment effects are excluded. Similarly, broader syntheses of floral regulation in grasses help explain the environmental and developmental control of flowering, without independently establishing the size of its biomass penalty in sugarcane [2].
The timing of induction and harvest therefore helps explain variation among studies, but does not negate experimental evidence that flowering can reduce cane and sugar yield.
The evidence establishes a physiological problem but does not yet resolve its mechanism. Whole-crop cane yield, sugar content and sugar yield integrate several possible effects, including cessation of further phytomer production, carbon demand associated with reproductive development, changes in the growth of existing internodes and subsequent deterioration of storage tissues. The available yield comparisons do not independently quantify the contribution of each pathway. In particular, they do not establish whether flowering reduces the final volume and dry mass of internodes that were still developing at floral initiation. This unresolved question motivates the developmental sink-strength hypothesis developed in Section 3.
3. A Developmental Sink-Strength Hypothesis for the Flowering Penalty
3.1. Developmental Organisation of the Sugarcane Culm
The sugarcane culm consists of a succession of phytomeric units, each comprising a leaf, node, internode and associated axillary bud. These structures are initiated sequentially by the shoot apical meristem, with the youngest internodes located immediately below the apex and progressively older internodes towards the base of the culm [11,12].
An important distinction must be made between the conventional numbering of sugarcane internodes and their actual developmental status. In the widely adopted system described by van Dillewijn [13], the youngest leaf with a visible dewlap is designated leaf +1, and the internode immediately below its node of attachment is designated internode +1. Successively older internodes are numbered +2, +3 and so forth. However, several younger internodes, designated 0, -1, -2 and so forth, are located above internode +1 and remain enclosed within the overlapping leaf sheaths. Consequently, internode +1 does not represent the youngest internode of the culm.
This distinction is particularly important when considering the cellular processes responsible for internode growth. Internode development involves two fundamentally different processes: cell division, which establishes the cellular population and structural framework of the internode, and subsequent cell enlargement, which determines much of its final length and volume.
Cell division occurs predominantly in the youngest internodes enclosed within the leaf sheaths. By the time an internode reaches the conventional +1 position, the principal phase of cell proliferation in the storage parenchyma is likely to be largely completed. Subsequent increases in internode length are therefore primarily attributable to enlargement of existing cells rather than the production of additional parenchyma cells.
Rae et al. [14] demonstrated that parenchyma cell length increases rapidly between conventional internodes +1 and +3, with cell expansion largely completed by approximately internode +5 in the cultivar examined. These observations support the interpretation that substantial internode elongation continues after the principal phase of cellular proliferation.
The developmental sequence therefore comprises three overlapping but physiologically distinct processes: establishment of the cellular framework through division in the youngest internodes, enlargement of existing cells to establish final internode dimensions, and progressive maturation associated with sucrose accumulation. Although sucrose accumulation begins during internode development, its relative importance increases as structural growth declines [14].
The distinction between cell number and cell size has important consequences for understanding the effects of flowering. Once the principal phase of cell proliferation has been completed, the subsequent growth potential of an internode depends predominantly on the capacity of existing cells to enlarge. Internode volume, in turn, establishes an important structural component of the capacity for sucrose storage.
Thus, any developmental or physiological disturbance that restricts cell enlargement during this period may permanently reduce the final dimensions of the affected internodes. Subsequent sucrose accumulation may increase the concentration of stored sucrose, but cannot necessarily compensate for a reduction in the volume of storage tissue.
Importantly, the developmental consequences of flowering may differ according to the stage of internode development. The youngest enclosed internodes may still be establishing their cellular framework, whereas internodes +1 to approximately +5 are primarily enlarging existing cells. Older internodes have largely completed structural development, although sucrose accumulation and other metabolic processes may continue.
This developmental framework provides the basis for examining how the transition from vegetative to reproductive growth may influence internode dimensions, biomass accumulation and ultimately sucrose yield.
3.2. Reproductive Carbon Demand and Termination of Vegetative Development
Floral initiation creates a developing reproductive structure with a requirement for imported carbon. Its total carbon demand includes carbon retained in reproductive tissues as well as carbon oxidised during their construction and maintenance (Figure 1B). The final dry mass of the inflorescence is consequently not an adequate measure of its cumulative carbon cost. Studies of rapidly growing sugarcane internodes demonstrate that respiratory expenditure can be substantial [5]; however, the corresponding respiratory fraction for sugarcane reproductive structures has not been directly established by the evidence considered here and must not be assumed to be the same.
The developing reproductive sink may compete with elongating internodes for current assimilate supply. Where assimilate supply or transport capacity constrains simultaneous sink demand, this competition could reduce carbon available for internode construction and subsequent storage. The size of the effect will depend on source activity, competing sinks, genotype and the timing of induction. In addition, reproductive commitment terminates the shoot apex’s production of new vegetative phytomers [1]. This is a separate developmental consequence, not itself a carbon sink: it removes opportunities for further leaf and internode production, even if carbon supply to already formed tissues subsequently improves.
These mechanisms should not be treated as independently additive quantities. Carbon diverted to reproductive development, changes in upper-internode construction and foregone vegetative growth can interact, and a carbon-budget analysis must avoid counting the same assimilate twice. Later pithiness, side-shooting, senescence and stalk deterioration may impose further losses, but their incidence and severity depend on genotype, environment and the interval between flowering and harvest [1,3].
3.3. Predicted Consequences for Internode Biomass and Sucrose Mass
Our central prediction is that flowering can lower the final biomass and sucrose mass of the upper culm even where sucrose concentration is unchanged or temporarily increased (Figure 1C). A smaller internode may have a similar sucrose concentration to a larger internode but contain less total sucrose because its tissue mass is lower. Likewise, a reduction in functional storage parenchyma associated with pithiness may lower recoverable sucrose without a proportionate change in external dimensions. These effects must be distinguished from changes in concentration caused by water content or accelerated ripening.
The conceptual curves in Figure 1C illustrate the kinds of internode-resolved differences that would support the hypothesis; they are not fitted data, estimates of effect size or evidence that every internode responds in the manner shown. The strongest developmental differences are predicted in internodes undergoing expansion or substantial biomass accumulation at induction. Internodes already structurally mature should exhibit smaller direct effects on final geometry, although their sucrose content can still respond to altered assimilate supply, maintenance costs and post-flowering deterioration. A whole-stalk Brix or commercial cane sugar measurement alone cannot discriminate among these mechanisms.
These internode-level predictions are not established by whole-crop yield comparisons. Section 6 identifies measurements that could distinguish changes in storage capacity from changes in assimilate allocation.
4. Why Genetic Correlations May Obscure Physiological Yield Losses
Experimental evidence that flowering can reduce cane and sugar yield (Section 2) predates the Australian genetic analysis of Jackson et al. [4]. The apparent disagreement is not whether the experiments recorded losses, but whether weak genetic correlations between flowering propensity and yield justify assigning little or no negative weight to flowering in commercial selection. These are different questions. The first concerns the yield foregone when a culm undergoes reproductive development; the second concerns the association between inherited flowering propensity and relative genetic performance across clones. Confusing them risks treating the absence of a genetic association as evidence for the absence of a physiological cost.
4.1. What Jackson and Colleagues Measured
Jackson et al. [4] examined approximately 42–50 relatively unselected clones across 26 site-by-crop-year environments at 14 sites. Flowering was recorded as the percentage of mature stalks showing flowering in each plot, and genetic correlations with cane yield and commercial cane sugar (CCS) were estimated within environments. The reported mean genetic correlations were approximately 0.00 for cane yield and 0.03 for CCS. Individual estimates varied in sign and magnitude and some were imprecise. These findings are important: flowering propensity was not a consistent linear predictor of genetic yield performance in the material and environments evaluated [4].
The scope of those measurements also matters. Flowering was assessed by visible evidence before harvest, rather than by the date of floral initiation or the duration of reproductive development. The Burdekin was not represented in the direct flowering–yield correlation dataset because reliable flowering assessments could not be obtained there, although other northern environments were included [4]. Neither point invalidates the analysis; both delimit the inference that can be drawn from it.
A separate parental analysis related flowering frequency to breeding values estimated from progeny. This addresses the capacity of flowering parents to transmit favourable yield characteristics. It does not estimate the biomass or sugar that the parent itself loses when it flowers as a commercial crop. Parental breeding value, realised field yield and the causal effect of flowering are not interchangeable quantities.
4.2. Why a Physiological Penalty Can Coexist with Weak Genetic Correlations
A physiological penalty is most directly defined by a counterfactual comparison: the yield of a genotype when flowering occurs relative to the yield of that same genotype, under otherwise comparable conditions, when flowering is prevented or delayed. A genetic correlation instead compares different genotypes that may vary in intrinsic growth potential, developmental timing, sucrose-storage capacity and numerous other traits. Consequently, the two analyses need not produce corresponding results.
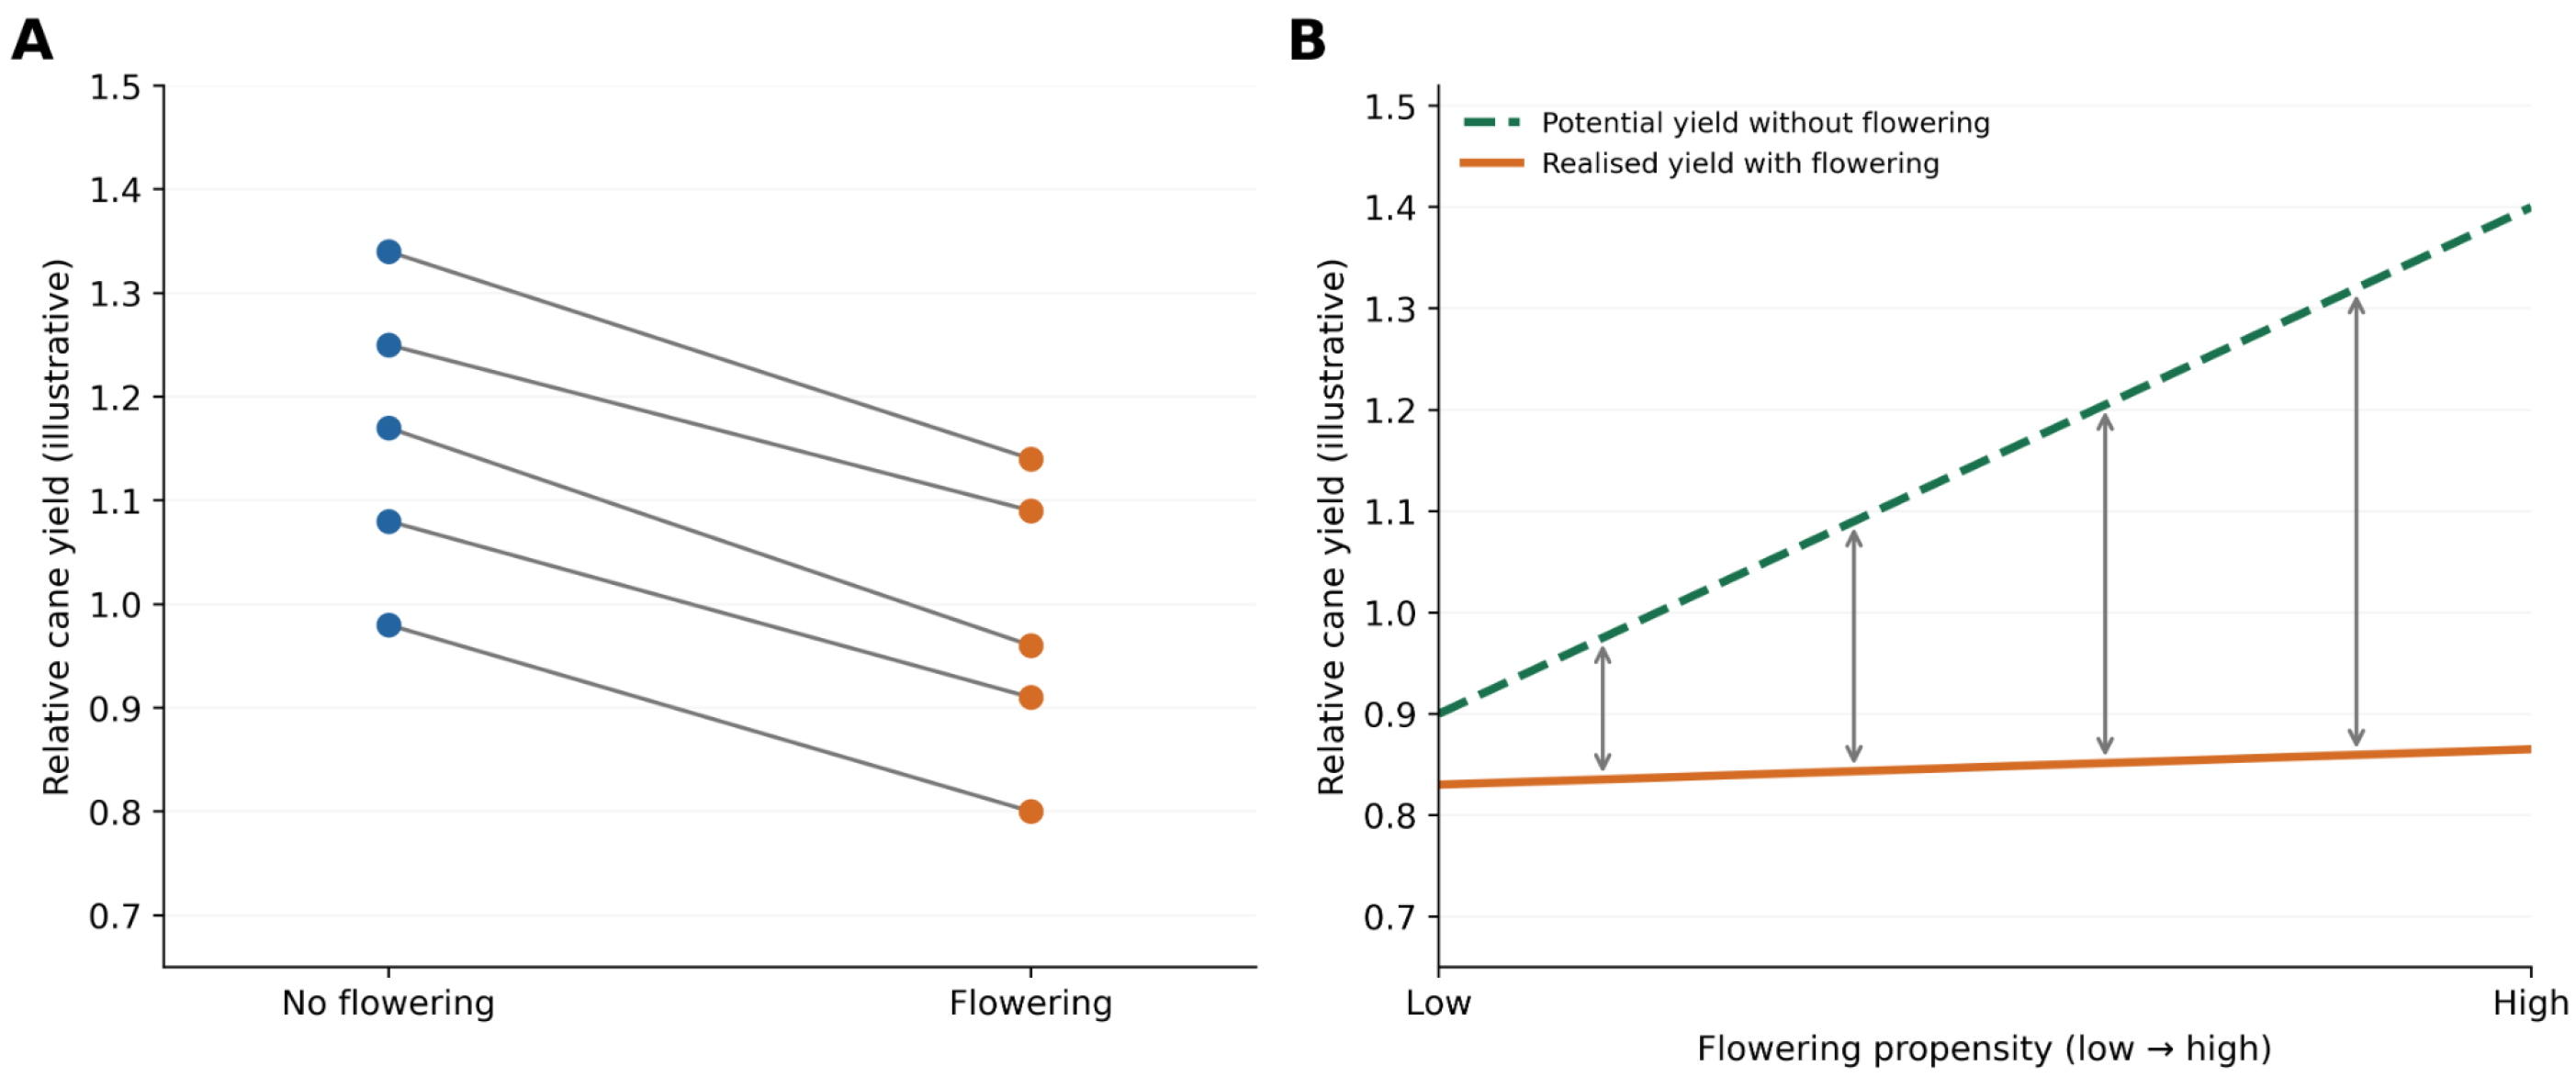
Figure 2 illustrates this distinction. Panel A depicts hypothetical within-genotype reductions in cane yield associated with flowering. Panel B shows one possible explanation for a weak across-genotype relationship: differences in potential yield could offset flowering-associated losses in realised yield. The upward trend in hypothetical potential yield in Panel B is an illustrative assumption, not a relationship demonstrated by Jackson et al. Nor do the plotted values estimate the magnitude of flowering penalties in sugarcane.
Jackson et al. [4] recognised that weak correlations could arise either because direct flowering effects were relatively small or because other genetic influences counteracted adverse effects. Their data could not distinguish these alternatives. The controlled flowering experiments reviewed in Section 2 establish that adverse physiological effects can occur; the correlation analysis cannot determine how much yield each flowering clone would have produced in the absence of flowering. Equally, the existence of a flowering penalty does not imply that flowering propensity must show a negative genetic correlation with yield in every population.
4.3. Limits of the Inference for Commercial Selection
The genetic analysis does not establish that early or extensive flowering is economically inconsequential. In particular, visible flowering recorded near harvest does not measure the duration of reproductive development or the biomass that would have accumulated had flowering been prevented. This limitation does not invalidate the reported correlations; it defines the question they cannot answer.
The central implication is that weak genetic correlations should not be used to dismiss experimental evidence of flowering-associated yield losses. Conversely, those experimental losses do not, by themselves, determine the optimal genetic selection weight for flowering propensity. That decision requires evidence about flowering incidence and associated economic losses in the environments for which varieties are selected.
5. Consequences for Sugarcane Breeding and Selection
5.1. Commercial Consequences of Flowering in Released Varieties
Commercial variety evaluation must distinguish the genetic merit of a clone from the yield it actually delivers when flowering occurs. The latter is the quantity relevant to growers and mills. Where a large proportion of stalks undergoes reproductive development sufficiently early, reductions in stalk biomass and subsequent deterioration may have substantial consequences for mill-delivered cane and recoverable sugar [1,3]. These costs cannot be excluded on the basis of a weak genetic correlation between flowering propensity and yield. Equally, the prevalence of flowering in released varieties, and any historical effect of breeding policy on that prevalence, require direct documentation rather than inference from the Jackson analysis alone.
The appropriate commercial assessment is therefore the realised loss under the target production and harvest conditions. Flowering incidence, developmental timing and the interval to harvest should be interpreted alongside cane yield and quality. A genotype may retain acceptable sucrose concentration after flowering yet deliver less stalk biomass and total recoverable sugar. Selection decisions that consider concentration without biomass risk overlooking this component of loss.
5.2. Preserving Reproductive Competence Without Accepting Commercial Losses
Breeding requires fertile, sufficiently synchronised inflorescences, whereas commercial production benefits from avoiding flowering that compromises yield. These requirements need not be expressed in the same environment. A genotype may flower infrequently in its target production region yet remain capable of flowering under deliberately managed crossing conditions. Photoperiod facilities, specialised crossing locations and hybridisation gardens illustrate ways breeding programmes can maintain reproductive access to valuable parents [1].
Strong exclusion of flowering genotypes can reduce the pool of usable parents, but this legitimate concern does not justify disregarding the commercial losses incurred when flowering occurs. The breeding objective is to preserve reproductive competence while reducing economically damaging flowering in the production environment.
5.3. Implications for Commercial Variety Selection
A more informative evaluation would record not only the proportion of stalks with visible inflorescences, but also flowering timing, crop age, harvest interval and the associated changes in cane biomass and recoverable sugar. These observations would permit commercial flowering risk to be evaluated separately from the capacity of a clone to flower under crossing conditions.
The appropriate selection weight should depend on the frequency and magnitude of flowering-associated losses in the target region, balanced against genetic merit for other traits and the practical ability to use the genotype as a parent. This is not a recommendation to eliminate flowering from breeding populations. It is a recommendation to avoid treating weak genetic correlations as evidence that flowering can be ignored in commercial selection. The measurements needed to implement this approach are considered in Section 6.
6. Testable Predictions and Priorities for Experimental Validation
Published experiments establish that flowering can reduce cane and sugar yield, but do not apportion the losses among termination of vegetative development, reproductive carbon demand, changes in internode construction and later deterioration. Three complementary research priorities would resolve the outstanding physiological and commercial questions.
6.1. Testing the Developmental Sink-Strength Hypothesis
Controlled comparisons within genotypes should identify internode cohorts present at floral initiation and follow their subsequent development. Measurements should include internode number, length, diameter, volume, fresh and dry mass, sucrose concentration and sucrose mass. The youngest enclosed internodes and those undergoing expansion at initiation are predicted to be more vulnerable to changes in final geometry than mature internodes. This prediction must be tested rather than inferred from whole-stalk measurements.
To evaluate competition for assimilates, measurements should also quantify reproductive tissue production and, where feasible, its construction and maintenance respiration and carbon import. Termination of vegetative phytomer production must be accounted for separately: it represents foregone growth, not a second reproductive carbon sink. A factorial comparison of flowering treatment and developmental stage, with controls for any direct photoperiod-treatment effects, would help distinguish these processes.
6.2. Quantifying Losses in Harvestable Biomass and Cane Quality
Replicated field experiments should estimate the counterfactual difference in harvestable stalk biomass and recoverable sugar between flowering and non-flowering treatments of the same genotype. Stalk number, mass per unit area, cane quality and sugar yield should be measured at multiple harvest dates. Flowering incidence and the interval between floral initiation and harvest should be recorded, so that losses can be expressed for defined commercial conditions rather than a binary flowering score at harvest.
Measurements should distinguish changes in sucrose concentration from changes in sucrose mass and separate reduced stalk growth from subsequent pithiness, side-shooting or deterioration wherever possible. Trials spanning a range of flowering incidence would establish how culm-level penalties translate into losses in cane delivered to the mill.
6.3. Quantifying Variation Among Genotypes
A multi-genotype study with manipulated flowering treatments, replicated across relevant environments and harvest dates, could estimate flowering propensity and the yield penalty incurred when flowering occurs as distinct characteristics. Where direct manipulation is infeasible, comparisons among naturally flowering and non-flowering culms should be interpreted cautiously because pre-existing differences in vigour and developmental status may confound the result.
The critical outputs are genotype- and environment-specific estimates of flowering-associated losses in harvestable cane and recoverable sugar, with uncertainty. Such estimates could establish whether accounting explicitly for flowering losses improves commercial selection decisions while retaining valuable parents for crossing. The historical contribution of breeding policy to flowering prevalence in released Australian varieties would require a separate analysis of variety release and flowering records.
7. Conclusions
Experimental studies have demonstrated that flowering can reduce cane yield, sugar content and sugar yield in sugarcane. The magnitude of these losses varies with genotype, developmental timing, environment and the interval between floral initiation and harvest, but their occurrence cannot be discounted simply because genetic correlations between flowering propensity and yield are weak. Those correlations describe associations among genotypes; they do not estimate the yield foregone when an individual genotype flowers.
We propose that the physiological penalty includes more than the visible cost of inflorescence production or subsequent deterioration of the stalk. Reproductive commitment terminates further vegetative phytomer production, while the carbon requirements of reproductive development may constrain the enlargement and biomass accumulation of internodes still developing at floral initiation. A reduction in their final dimensions or functional storage tissue could lower sucrose mass even where sucrose concentration is maintained or temporarily increased. This developmental sink-strength mechanism remains a hypothesis requiring direct experimental testing, and its contribution must be distinguished from other flowering-associated losses.
For commercial production, the relevant outcomes are harvestable cane biomass and recoverable sugar per hectare, not flowering propensity or sucrose concentration considered in isolation. Breeding programmes should therefore evaluate flowering-associated losses under the environments and harvest schedules for which varieties are intended, while preserving the reproductive competence needed for crossing. Controlled within-genotype comparisons, internode-resolved measurements and replicated field estimates of economic loss offer a route to quantifying the penalty and incorporating it more appropriately into variety selection.
References
- Moore, P.H.; Berding, N. Flowering. In Sugarcane: Physiology, Biochemistry, and Functional Biology; Moore, P.H., Botha, F.C., Eds.; Wiley-Blackwell, 2013; pp. 379–410. [Google Scholar]
- Pavani, G.; Malhotra, P.K.; Verma, S.K. Flowering in Sugarcane—Insights from the Grasses. 3 Biotech 2023, 13, 154. [Google Scholar] [CrossRef] [PubMed]
- Berding, N.; Hurney, A.P. Flowering and Lodging, Physiological-Based Traits Affecting Cane and Sugar Yield: What Do We Know of Their Control Mechanisms and How Do We Manage Them? Field Crops Res. 2005, 92, 261–275. [Google Scholar] [CrossRef]
- Jackson, P.; Wei, X.; Atkin, F. Genetic Correlations between Flowering Propensity and Cane Yield and CCS and Implications for Sugarcane Breeding Programs. In Proceedings of the Australian Society of Sugar Cane Technologists, 2012; Vol. 34. [Google Scholar]
- Botha, F.C.; Scalia, G.; Marquardt, A.; Wathen-Dunn, K. Sink Strength during Sugarcane Culm Growth: Size Matters. Sugar Tech An. Int. J. Sugar Crops Relat. Ind. 2023, 25, 1047–1060. [Google Scholar] [CrossRef]
- Botha, F.C.; Marquardt, A. Metabolic Control of Sugarcane Internode Elongation and Sucrose Accumulation. Agronomy 2024, 14, 1487. [Google Scholar] [CrossRef]
- Rao, J.T. Effects of Flowering on Yield and Quality of Sugarcane. Exp. Agric. 1977. [Google Scholar] [CrossRef]
- Rao, P.G.; Naresh Kumar, K. Effect of Flowering on Juice Quality and Fibre Content in Sugarcane. Sugar Tech 2003, 5, 185–187. [Google Scholar] [CrossRef]
- Moore, P.H.; Osgood, R.V. Prevention of Flowering and Increasing Sugar Yield of Sugarcane by Application of Ethephon (2-Chloroethylphosphonic Acid). J. Plant Growth Regul. 1989, 8, 205–210. [Google Scholar] [CrossRef]
- Endres, L.; da Cruz, S.J.S.; Vilela, R.D.; dos Santos, J.M.; Barbosa, G.V.d.S.; Silva, J.A.C. Foliar Applications of Calcium Reduce and Delay Sugarcane Flowering. BioEnergy Res. 2016, 9, 98–108. [Google Scholar] [CrossRef]
- Rae, A.; Martinelli, A.; Dornelas, M. Anatomy and Morphology. In Sugarcane: Physiology, Biochemistry, and Functional Biology; Moore, P.H., BOTHA, F., Eds.; John Wiley & Sons Ltd, 2013; pp. 19–34. [Google Scholar] [CrossRef]
- Bonnett, G.D. Developmental Stages (Phenology). In Sugarcane: Physiology, Biochemistry, and Functional Biology; Moore, P.H., Botha, F., Eds.; John Wiley & Sons Ltd: New York, 2013; pp. 35–53. [Google Scholar] [CrossRef]
- van Dillewijn, C. Botany of Sugarcane; Chronica Botanica Co: Waltham, USA, 1952. [Google Scholar]
- Rae, A.; Bonnett, G.; Karno, K. Understanding Stem Development and Sucrose Accumulation to Increase CCS. Proc. Aust. Soc. Sugarcane Technol. 2006, 28, 2–5. [Google Scholar]
Figure 1.
Developmental sink-strength hypothesis for the flowering-associated reduction in sugarcane biomass and sucrose yield. (A) Developmental state of successive internodes at floral initiation. The upper approximately six to seven internodes are principally involved in elongation, while biomass accumulation and sucrose storage continue in older internodes; the indicated ranges are approximate and genotype- and environment-dependent. (B) Floral initiation establishes reproductive carbon demand for tissue construction and respiration, while reproductive commitment separately terminates the production of new vegetative phytomers. Competition for assimilates may alter construction of developing upper internodes and their subsequent functional storage capacity. These pathways interact and should not be interpreted as independent additive carbon losses. (C) Hypothesised consequences for internode volume, sucrose concentration and total sucrose mass in flowering and non-flowering culms. The curves are schematic predictions, not observed measurements or quantitative estimates. A reduction in internode biomass or functional storage tissue may lower total sucrose mass even where sucrose concentration is similar or higher. Later pithiness, side-shooting and senescence may contribute additional genotype- and environment-dependent losses.
Figure 1.
Developmental sink-strength hypothesis for the flowering-associated reduction in sugarcane biomass and sucrose yield. (A) Developmental state of successive internodes at floral initiation. The upper approximately six to seven internodes are principally involved in elongation, while biomass accumulation and sucrose storage continue in older internodes; the indicated ranges are approximate and genotype- and environment-dependent. (B) Floral initiation establishes reproductive carbon demand for tissue construction and respiration, while reproductive commitment separately terminates the production of new vegetative phytomers. Competition for assimilates may alter construction of developing upper internodes and their subsequent functional storage capacity. These pathways interact and should not be interpreted as independent additive carbon losses. (C) Hypothesised consequences for internode volume, sucrose concentration and total sucrose mass in flowering and non-flowering culms. The curves are schematic predictions, not observed measurements or quantitative estimates. A reduction in internode biomass or functional storage tissue may lower total sucrose mass even where sucrose concentration is similar or higher. Later pithiness, side-shooting and senescence may contribute additional genotype- and environment-dependent losses.
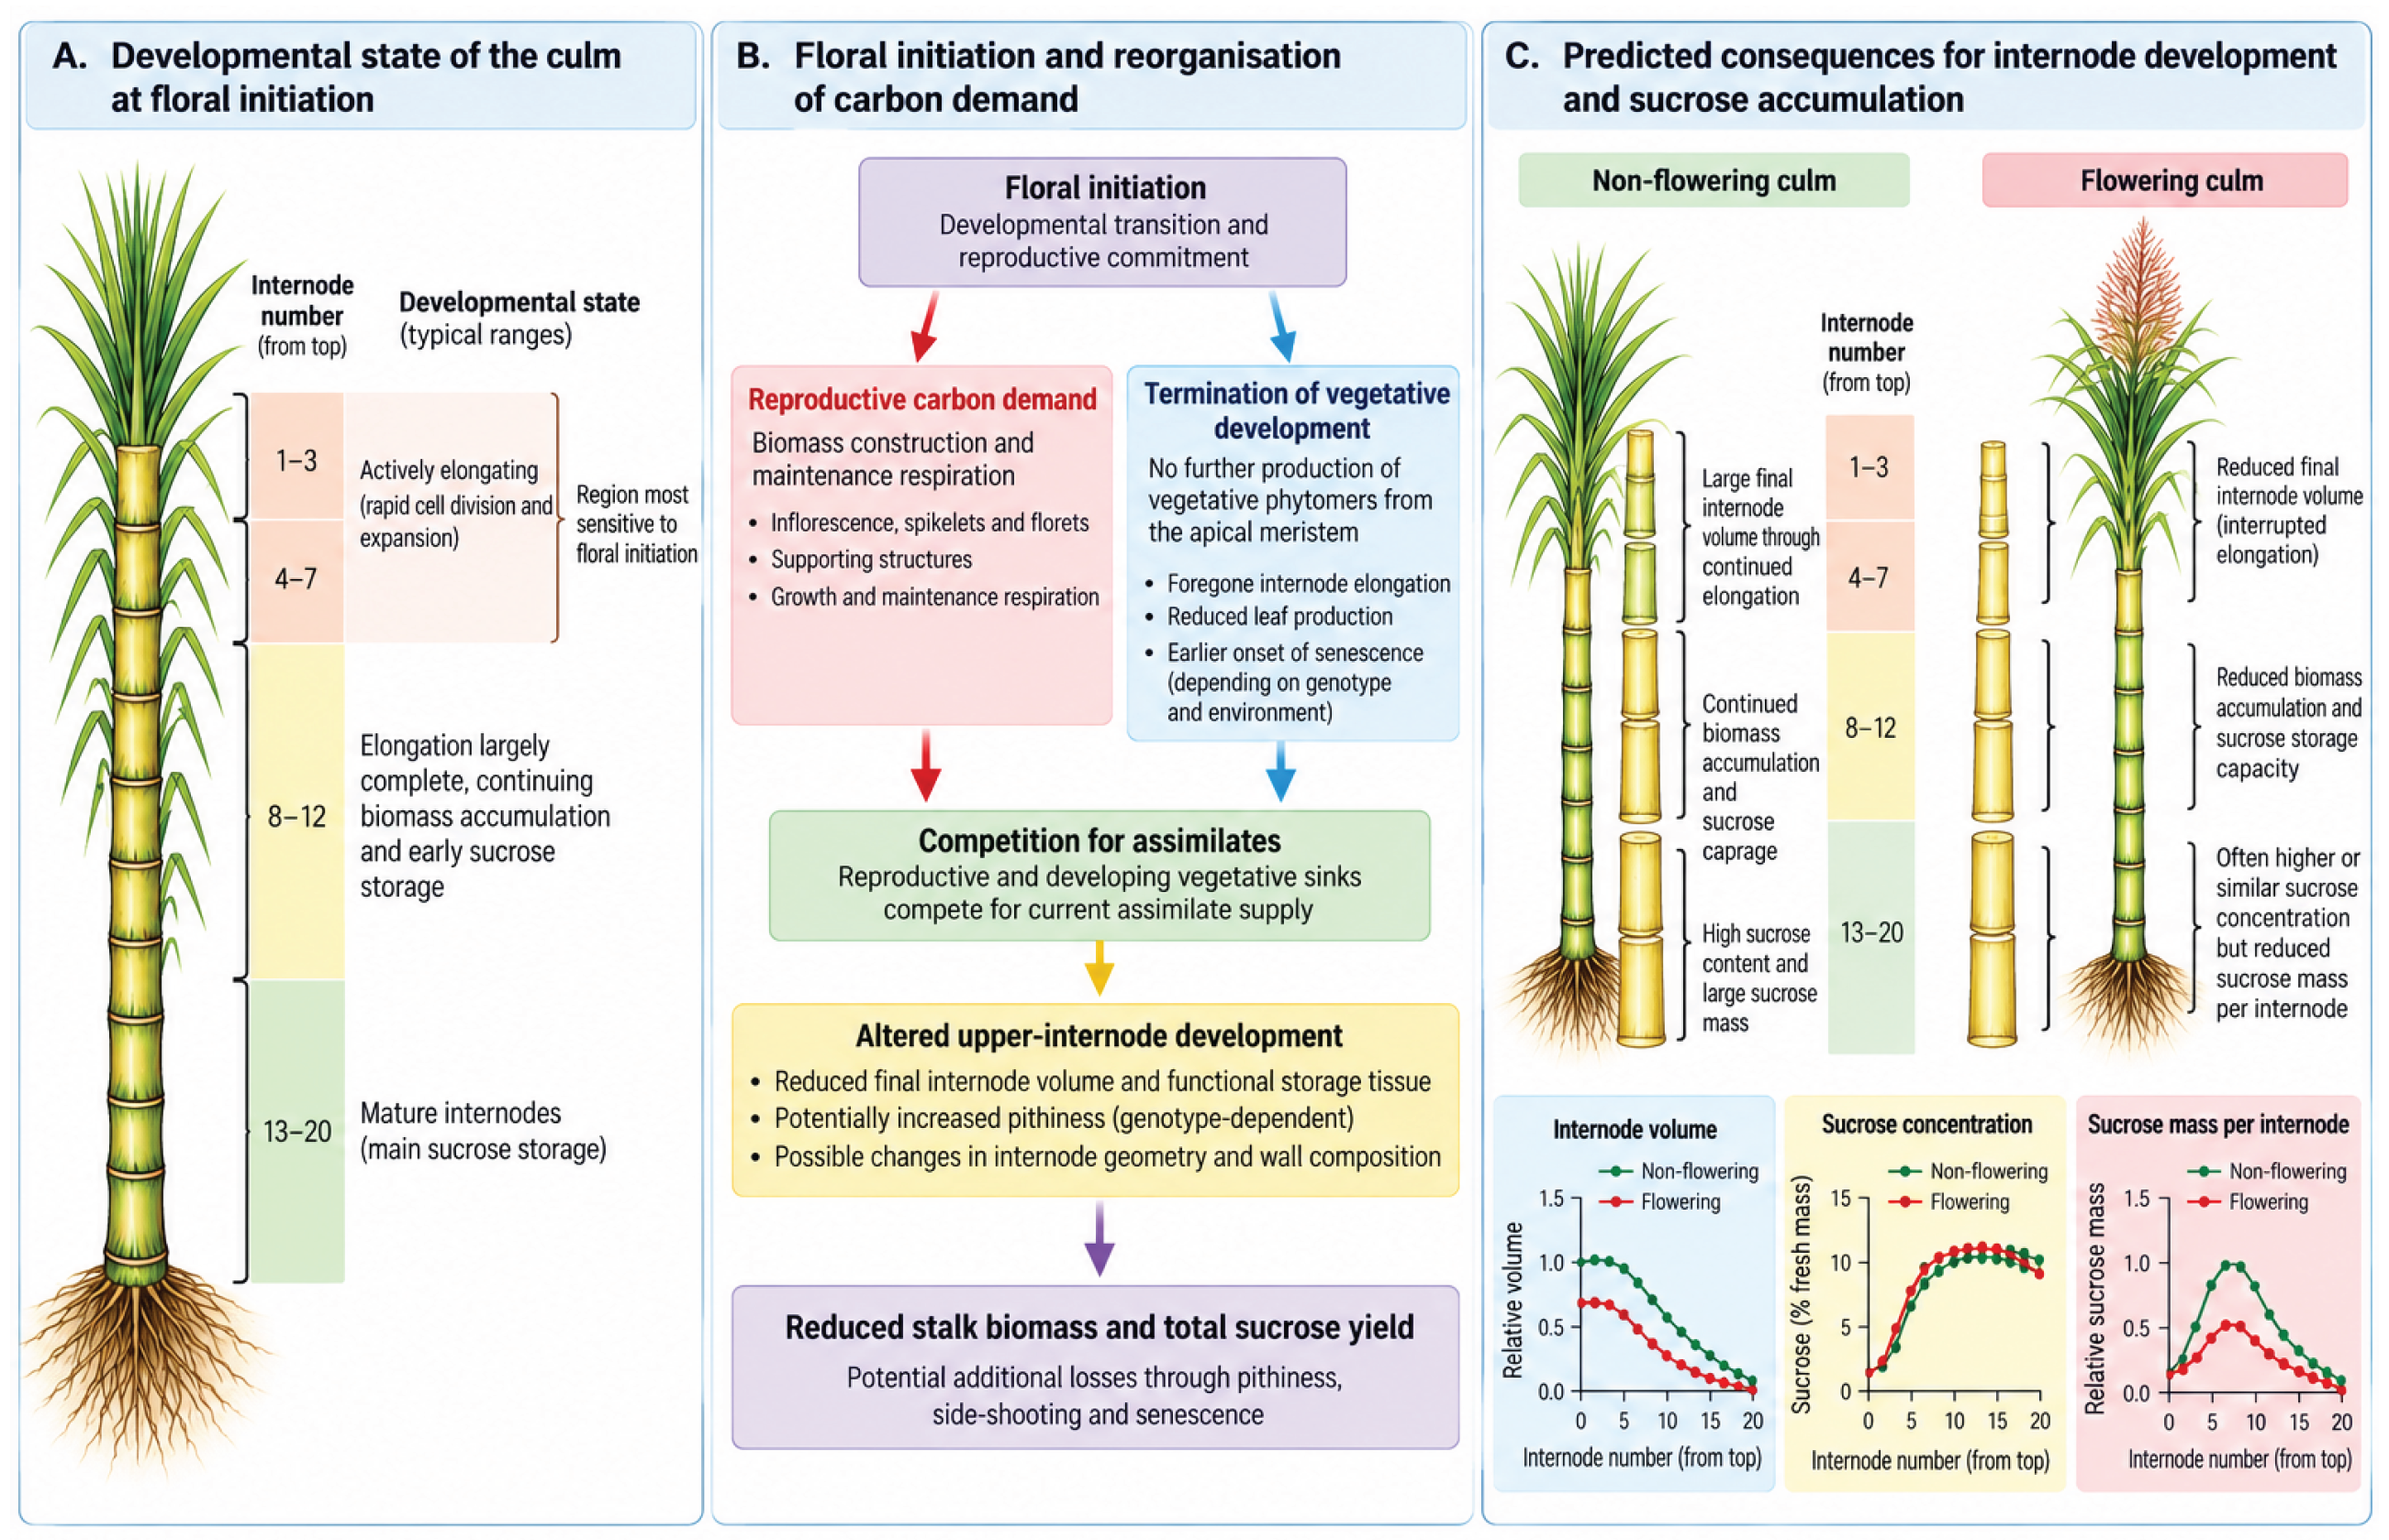
Figure 2.
Conceptual illustration of why a physiological yield penalty associated with flowering need not produce a strong negative genetic correlation between flowering propensity and cane yield. (A) Hypothetical paired comparisons within genotypes, each showing lower realised cane yield when flowering occurs. (B) One hypothetical scenario in which variation in potential yield offsets flowering-associated losses, leaving little apparent relationship between flowering propensity and realised yield. The positive relationship between potential yield and flowering propensity in panel B is an illustrative assumption, not an established biological relationship. All values are schematic; neither panel represents observations or effect-size estimates from Jackson et al. [4] or Berding and Hurney [3].
Figure 2.
Conceptual illustration of why a physiological yield penalty associated with flowering need not produce a strong negative genetic correlation between flowering propensity and cane yield. (A) Hypothetical paired comparisons within genotypes, each showing lower realised cane yield when flowering occurs. (B) One hypothetical scenario in which variation in potential yield offsets flowering-associated losses, leaving little apparent relationship between flowering propensity and realised yield. The positive relationship between potential yield and flowering propensity in panel B is an illustrative assumption, not an established biological relationship. All values are schematic; neither panel represents observations or effect-size estimates from Jackson et al. [4] or Berding and Hurney [3].
Disclaimer/Publisher’s Note: The statements, opinions and data contained in all publications are solely those of the individual author(s) and contributor(s) and not of MDPI and/or the editor(s). MDPI and/or the editor(s) disclaim responsibility for any injury to people or property resulting from any ideas, methods, instructions or products referred to in the content. |
© 2026 by the authors. Licensee MDPI, Basel, Switzerland. This article is an open access article distributed under the terms and conditions of the Creative Commons Attribution (CC BY) license (http://creativecommons.org/licenses/by/4.0/).
Copyright: This open access article is published under a Creative Commons CC BY 4.0 license, which permit the free download, distribution, and reuse, provided that the author and preprint are cited in any reuse.