
Submitted:
13 November 2026
Posted:
16 November 2026
You are already at the latest version
Abstract
Disparities in breast cancer between African American (AA) and European American (EA) women persist. However, it remains unclear whether endocrine-disrupting chemicals (EDCs), including 2,3,7,8-tetrachlorodibenzo-p-dioxin (TCDD) and bisphenol A (BPA), are associated with different gene regulatory patterns across ancestry groups. We used a multi-module network toxicology approach to assess whether EDC-associated genes in breast cancer have similar expression patterns in AA and EA patients. Intersecting EDC targets with breast cancer-associated genes in the Comparative Toxicogenomics Database identified 9,588 candidate genes, and protein–protein interaction analysis revealed ten hub genes. In TCGA-BRCA data (AA n = 189; EA n = 867), three hub genes were significantly downregulated in AA patients: ESR1 (padj = 4.03×10⁻⁹), EP300 (padj = 1.13×10⁻¹³), and ARID1A (padj = 2.14×10⁻⁸). These genes were enriched in chromatin remodeling and estrogen response processes. Transcription factor analysis identified TP53, the most central hub gene, as a high-confidence activator of ESR1. These associative findings suggest that EDC-linked gene expression varies by ancestry and identify the TP53–ESR1 axis as a candidate mechanism that requires experimental validation. They also highlight the need for ancestry-stratified analyses in environmental chemical research.
Keywords:
breast cancer
; endocrine-disrupting chemicals
; Bisphenol A
; TCDD
; network toxicology
; ancestry disparities
; ESR1
; EP300
; ARID1A
; TP53
1. Introduction
Breast cancer is a leading cause of death among women worldwide. Many clinical trials and research studies have focused on women of European descent, especially Caucasian American women. Limited research on non-White groups, including people of African, Asian, Latino/Hispanic, and Indigenous descent, leaves a gap in our understanding of other vulnerable ethnicities. [1]. African American (AA) women experience the most disproportionate breast cancer burden. AA women are disproportionately affected by aggressive breast cancer subtypes and have significantly worse clinical outcomes than European American women. Between 2016 and 2020, Black women had a 40% higher mortality rate than white women, despite a lower overall incidence [2]. Although breast cancer incidence is slightly higher overall among European American women, AA women are more likely to be diagnosed at a younger age and with more advanced disease. They also have higher breast cancer-specific mortality rates [3]. These disparities persist even after accounting for differences in socioeconomic status, healthcare access, and treatment quality, suggesting that biological differences in tumor characteristics independently contribute to the outcome gap. This is especially evident in triple-negative breast cancer (TNBC), an aggressive subtype diagnosed more often in AA women than in their European American counterparts [3]. Despite well-documented clinical disparities, the molecular mechanisms driving differences in breast cancer progression between AA and European American women remain incompletely understood. In particular, it is unclear how environmental exposures interact with ancestry-based gene regulatory differences to shape tumor biology [4]. A growing body of evidence identifies endocrine-disrupting chemicals (EDCs) as important contributors to breast cancer progression. However, how EDC exposure interacts with ancestry-specific molecular contexts in breast cancer remains underexplored [5]. Two EDCs of particular concern are 2,3,7,8-tetrachlorodibenzo-p-dioxin (TCDD) and bisphenol A (BPA). Both are widespread environmental contaminants with documented effects on estrogen signaling and breast cancer biology. TCDD, commonly called dioxin, is a persistent organochlorine compound produced as a byproduct of industrial chemical manufacturing and combustion. People are exposed to TCDD mainly by consuming high-fat foods, such as poultry, dairy products, and eggs, in which it bioaccumulates through the food chain. At the molecular level, TCDD acts primarily by binding to the aryl hydrocarbon receptor (AhR). Once activated, the receptor induces epigenetic changes and disrupts estrogen receptor signaling, altering gene expression programs relevant to breast cancer progression [6]. Bisphenol A (BPA) is a synthetic chemical commonly used to make polycarbonate plastics and epoxy resins, resulting in widespread human exposure through food and beverage containers. It is considered a weak environmental estrogen because it can bind to estrogen receptor alpha (ERα) and estrogen receptor beta (ERβ), activating ER-dependent transcription [7,8]. Epidemiological and experimental evidence links BPA exposure, particularly during early developmental windows, to a higher risk of benign lesions in the human reproductive tract, some of which may develop into breast cancer [9]. BPA has also been shown to increase tumor aggressiveness in breast cancer patients, highlighting its role in breast cancer progression at the molecular level [10].
Although TCDD and BPA have each been studied for their effects on breast cancer biology, how they differentially influence gene regulatory networks across ancestry groups remains poorly understood. Many studies examining EDC effects on breast cancer have not stratified their analyses by ancestry or race. Consequently, it is unclear whether EDC exposure leads to equivalent molecular consequences across populations or whether ancestry-specific differences in gene regulation shape responses to these chemicals. Current evidence suggests that biological, genetic, environmental, and socioeconomic factors strongly influence breast cancer disparities among AA women. Understanding how these factors interact at the molecular level, particularly the role of EDCs such as TCDD and BPA could provide critical insight into the mechanisms underlying ancestry-associated differences in breast cancer progression and outcomes. [5].
2. Results
2.1. Network Toxicology and Hub Gene Identification
Intersecting BPA target genes, TCDD target genes, and breast cancer-associated genes from the Comparative Toxicogenomics Database (CTD) identified 1,432 candidate genes associated with both EDCs and breast cancer (Figure 1A). The interaction of the combined EDCs (BPA and TCDD) with breast cancer-associated genes in the CTD yielded 9,588 genes (Figure 1B). Of these, 6,615 genes were unique to breast cancer, and 1,567 were unique to the EDC targets. A total of 1,432 genes were shared among all three sets (TCDD, BPA, and breast cancer). PPI network construction using the STRING database (confidence score ≥ 0.700), followed by topological analysis in Cytoscape, identified ten hub genes: TP53, MYC, BRCA1, CCND1, ESR1, BRCA2, ERBB2, PARP1, EP300, and ARID1A (Figure 2). TP53 ranked highest in both degree and closeness centrality, and the rankings were consistent across these metrics for all ten hub genes.
2.2. Ancestry-Stratified Transcriptomic Analysis
Differential expression analysis of African American (AA, n=189) and European American (EA, n=867) breast cancer patients in the TCGA-BRCA dataset identified three of the ten EDC-associated hub genes as statistically significant after Benjamini-Hochberg false discovery rate correction (Table 1, Figure 3A, Figure 4, Figure 5 and Figure 6). ESR1 expression was significantly higher in EA than in AA patients (mean AA = 10.09, mean EA = 11.92, padj = 4.03×10⁻⁹). EP300 expression was also significantly higher in EA patients (mean AA = 10.76, mean EA = 11.26, padj = 1.13×10⁻¹³) and showed the strongest statistical significance among all ten hub genes. ARID1A expression was likewise significantly higher in EA patients (mean AA = 11.23, mean EA = 11.52, padj = 2.14×10⁻⁸). Bootstrap resampling confirmed that the 95% confidence intervals for all three mean expression differences were entirely above zero, indicating that the observed differences are robust and unlikely to result from sampling variability (Figure 3B). The remaining seven hub genes TP53, MYC, BRCA1, CCND1, BRCA2, ERBB2, and PARP1 showed no statistically significant expression differences between ancestry groups (all padj > 0.05, Table 1).
2.3. Functional Pathway Enrichment Analysis
GO enrichment analysis identified 282 significant terms across the Biological Process, Molecular Function, and Cellular Component ontologies (padj < 0.05; Figure 7). The most significantly enriched biological processes were transcription initiation at the RNA polymerase II promoter, DNA-templated transcription initiation, chromatin remodeling, response to estrogen, the nuclear receptor-mediated steroid hormone signaling pathway, and positive regulation of epigenetic gene expression. KEGG pathway enrichment analysis identified one statistically significant pathway: thyroid hormone signaling (hsa04919; padj = 0.045; Figure 8).
2.4. Transcription Factor Regulatory Analysis
DoRothEA regulon analysis (confidence levels A, B, and C) identified 33 TF-target regulatory relationships involving the three ancestry-significant hub genes (Figure 9, Table 2). ESR1 had 17 TFs, 25 activators, and 2 repressors; ARID1A had 14 TFs, 12 activators, and 2 repressors; and EP300 had 2 TFs, 2 activators, and no repressors.
Cross-referencing TF regulators against the complete hub gene list revealed one intra-network regulatory connection: TP53 was identified as a high-confidence (DoRothEA level A) transcriptional activator of ESR1. Other high-confidence (level A) activators of ESR1 included FOXA1, GATA3, STAT1, STAT3, STAT5A, STAT5B, PGR, FOXM1, FOXO3, TFAP2C, and SP1. TWIST1 and RUNX2 were identified as high-confidence repressors of ESR1. EP300 was regulated by EGR1 and YY1, both level A activators. FOXP1 was identified as a medium-confidence (level B) repressor of ARID1A.
2.5. Genetic Variant Analysis
ClinVar analysis identified 4,659 germline variants across the three ancestry-significant hub genes (Table 3). ClinVar records included breast cancer-associated conditions for all three genes (Table 3). ESR1 variants were submitted in the context of familial breast cancer, whereas EP300 variants were documented under hereditary breast and ovarian cancer syndrome. Three ARID1A variants were identified in breast cancer contexts, although none had a confirmed breast cancer condition label. EP300 had the most variants (2,446), followed by ARID1A (1,953) and ESR1 (260). EP300 also had the highest pathogenic burden, with 200 pathogenic and 123 likely pathogenic variants. ARID1A had 94 pathogenic and 60 likely pathogenic variants, while ESR1 had 25 pathogenic variants. Missense variants were most common in EP300 (n=1,198) and ARID1A (n=1,047); ESR1 had equal numbers of missense and UTR variants (101 each).
2.6. Integrated Analysis
Integrating the findings identified three EDC-associated hub genes, ESR1, EP300, and ARID1A, that showed consistently and significantly lower expression in African American breast cancer patients than in European American patients. TP53 ranked first in the hub gene network for both degree and closeness centrality and was identified as a high-confidence transcriptional activator of ESR1. Among the three significant genes, EP300 had the highest burden of pathogenic variants, with 323 pathogenic or likely pathogenic variants. The thyroid hormone signaling pathway was the only statistically significant KEGG pathway identified. These integrated findings are shown in Figure 10.
3. Discussion
This study applied a multi-module network toxicology framework to assess whether gene regulatory patterns linked to TCDD and Bisphenol A in breast cancer show similar associations in AA and EA populations. Integrating PPI network analysis, ancestry-stratified transcriptomic analysis, pathway enrichment, transcription factor regulatory analysis, and clinical variant characterization, the study identified three EDC-associated hub genes, ESR1, EP300, and ARID1A, that were consistently and significantly downregulated in AA breast cancer patients. These findings suggest that the molecular effects of EDC exposure in breast tissue may vary across ancestry groups and could contribute to the well-documented disparities in breast cancer outcomes between AA and EA women.
Identifying TP53 as the most central gene in the EDC-breast cancer hub-gene network is consistent with its established role as the genome’s master guardian and its status as one of the most frequently mutated genes in human cancers. TP53 is mutated in approximately 50% of breast cancers, with higher rates in triple-negative breast cancer, which disproportionately affects African American women [11]. The high-confidence finding that TP53 directly activates ESR1 establishes a mechanistic link between the network’s most central node and its most statistically significant ancestry-associated gene [12]. This TP53-to-ESR1 regulatory axis suggests that EDC-mediated disruption of TP53 transcriptional activity could reduce downstream ESR1 expression, contributing to the lower estrogen receptor expression observed in African American breast tumors. Both TCDD and BPA have been shown to alter TP53 activity through epigenetic mechanisms, providing a plausible pathway by which chemical exposure could disrupt this regulatory axis [13,14].
The finding that ESR1 expression is significantly lower in AA breast cancer patients aligns with the well-established observation that AA women are more likely than European American women to have estrogen receptor-negative breast cancer [11]. Estrogen receptor-negative tumors tend to be more aggressive and carry a poorer prognosis, contributing to a breast cancer mortality rate among African American women that is twice that of non-Hispanic white women [15]. The findings suggest that reduced ESR1 expression in AA breast tumors may stem from weaker transcriptional activation along the TP53-to-ESR1 axis, as well as ancestry-associated differences in FOXA1 and GATA3 activity. Both factors contribute to breast cancer subtype development and ESR1 activation [4]. The lack of significant ESR1 eQTLs in GTEx breast mammary tissue further suggests that these expression differences are driven not primarily by germline genetic variants, but by epigenetic and transcriptional regulatory mechanisms.
EP300 and ARID1A, two of the ten hub genes, differed significantly between AA and EA patients. Both are epigenetic regulators: EP300 acts as a histone acetyltransferase and transcriptional coactivator [16], while ARID1A encodes a component of the SWI/SNF chromatin-remodeling complex [17]. Their significant downregulation in African American breast cancer patients suggests that epigenetic regulatory capacity may be broadly reduced in AA tumors compared with EA tumors. EP300’s high burden of pathogenic variants (323 pathogenic or likely pathogenic variants in ClinVar) underscores its clinical significance as a cancer gene. However, the absence of breast mammary tissue eQTLs and ARID1A’s predominantly somatic mutation profile suggest that expression differences in both genes are more likely driven by tumor-specific epigenetic changes than by inherited germline variants. The enrichment of chromatin remodeling and transcription initiation GO terms among the three significant genes further supports the hypothesis that ancestry-associated differences in epigenetic regulation are the key molecular disparity between AA and EA breast cancer.
Identifying the thyroid hormone signaling pathway as the only statistically signifi-cant KEGG pathway offers mechanistic context for understanding how TCDD and BPA may differentially affect breast cancer biology across ancestry groups. Both chemicals are known to disrupt thyroid hormone signaling: TCDD activates the aryl hydrocarbon re-ceptor, which interferes with thyroid hormone receptor activity [18], while BPA may compete with thyroid hormone for receptor binding [19]. Thyroid hormone and estrogen receptors are both nuclear receptors and share transcriptional coactivators, including EP300 [20], linking thyroid hormone disruption to estrogen receptor signaling.
3.1 Limitations
Several limitations of this study should be acknowledged. First, ancestry stratification was based on self-reported race in TCGA clinical metadata, which may not capture the full genetic and environmental complexity of ancestry. Second, because the TCGA-BRCA dataset was not specifically designed to investigate EDC exposure, individual-level exposure data were unavailable. The EDC-gene associations examined here were drawn from the CTD database, which compiles literature-reported associations rather than direct exposure measurements. Third, the small number of ancestry-significant genes (n=3) limited the statistical power of pathway enrichment analyses, as reflected in the identification of only one significant KEGG pathway. Fourth, DoRothEA TF regulatory relationships are curated literature-based associations, not experimentally validated interactions specific to breast cancer. The TP53 to ESR1 axis identified here requires experimental validation in breast cancer cell lines or patient samples to confirm its functional relevance.
4. Materials and Methods
4.1. Collection of Targets for BPA and TCDD
Chemical structures and SMILES notations for BPA and TCDD were downloaded from PubChem (https://pubchem.ncbi.nlm.nih.gov/). Predicted gene targets for these compounds were identified using Comparative Toxicogenomics Database (https://ctdbase.org/), with “Homo sapiens” selected as the species. Target names were standardized using UniProt and genenames.org in accordance with HGNC nomenclature.
4.2. Identifying Breast Cancer-Related Targets for BPA and TCDD
Genes associated with breast cancer were identified using GeneCards (https://www.genecards.org/), COSMIC (cancer.sanger.ac.uk), and OMIM (omim.org), using the search terms “breast cancer” and “breast neoplasm.”
4.3. Generating a PPI Network and Screening for Key Targets
PPI network construction was performed using the STRING database (string-db.org), accessed in June 2026. Genes were submitted in “Multiple Proteins” mode, with the organism set to “Homo sapiens” and the minimum interaction confidence score set to 0.700 (high confidence) to retain only well-supported molecular interactions. The resulting network was exported as a tab-separated value (TSV) edge list and imported into Cytoscape (version 3.10.4) for visualization and topological analysis. Cytoscape’s built-in Network Analyzer tool was used to assess network topology by calculating degree and closeness centrality for each node. The two metrics yielded concordant rankings, supporting the robustness of hub gene prioritization. The 10 genes with the highest composite ranks were designated as hub genes in the discovery network.
4.4. Acquisition of RNA-Seq Gene Expression Data
The TCGA Breast Invasive Carcinoma (TCGA-BRCA) dataset was downloaded from the UCSC Xena Browser (xenabrowser.net) using the IlluminaHiSeqRNA-seq V2 dataset to obtain RNA-seq gene expression data. Clinical metadata was obtained from the NIH Genomic Data Commons with the TCGAbiolinks R package’s GDCquery_clinic() function.
4.5. Ancestry-Based Stratification
Ancestry stratification was based on the self-reported race field in the TCGA clinical metadata. Gene expression matrix sample barcodes were matched to clinical records using the first 12 characters of each TCGA barcode. Samples were assigned to two ancestry groups: African American (AA; n=189, race = “black or african american”) and European American (EA; n=867, race = “white”). Samples from all other ancestry groups were excluded. The UCSC Xena phenotype file was not used for stratification because it contains no race or ancestry information.
4.6. Extraction of Hub Gene Expression
Gene expression matrices were filtered to include only the 10 EDC-associated hub genes. Separate matrices were then generated for the AA (10 genes × 189 samples) and EA (10 genes × 867 samples) patient groups.
4.7. Statistical Analysis
For each hub gene, ancestry-associated expression differences were evaluated using the Wilcoxon rank-sum test. Multiple comparisons were corrected with the Benjamini-Hochberg (BH) false discovery rate (FDR) method, and genes with an adjusted p-value (padj) < 0.05 were considered statistically significant. Mean expression levels were compared between the AA and EA groups to establish the direction of differential expression. Uncertainty in these differences was quantified by calculating 95% bootstrap confidence intervals for the mean log2 expression difference (EA minus AA) for each ancestry-significant gene, using 1,000 resampling iterations with replacement in R (set.seed(42)).
4.8. GO and KEGG Functional Pathway Enrichment Analysis of Potential Targets
Before enrichment analysis, gene symbols for the three ancestry-significant hub genes and the complete EDC-BC overlap gene set were converted to NCBI Entrez Gene identifiers with the bitr() function in the clusterProfiler R package. HGNC gene symbols were mapped using the org.Hs.eg.db human genome annotation database. GO and KEGG enrichment analyses were conducted to characterize the biological functions and chemical-disease signaling pathways associated with the identified EDC-BC hub genes. GO analysis covered biological processes (BP), cellular components (CC), and molecular functions (MF), using the enrichGO() function and the org.Hs.eg.db annotation database as the background universe. KEGG analysis identified key signaling pathways regulated by BPA and TCDD exposure in relation to breast cancer. This analysis used the enrichKEGG() function with the organism code “hsa” (Homo sapiens) and the same gene list and background universe as the GO analysis.
4.9. Transcription Factor Data Source Acquisition
The DoRothEA database [21], accessed through the dorothea R package, was used to analyze transcription factor (TF) regulatory networks. Its interactions were collected and curated from the literature, chromatin immunoprecipitation (ChIP)-seq peaks, TF binding-site motifs, and interactions inferred directly from gene expression. The database contains 20,244 genes, 1,395 transcription factors, and 486,676 interactions. Each TF-target interaction is assigned a confidence level based on the strength and reproducibility of its supporting evidence, ranging from A (highest confidence) to E (lowest confidence). We included only interactions with confidence levels A, B, or C.
4.10. Transcription Factor Identification
TFs regulating the three ancestry-significant EDC hub genes were identified by filtering the DoRothEA database for interactions whose target gene matched one of the three genes of interest. The mode of regulation (mor) field was then used to classify each TF as either a transcriptional activator (mor = +1) or a repressor (mor = -1) of its target gene.
4.11. Intra-Network Gene Cross-Reference Hub
The complete list of identified TF regulators was cross-referenced with the full hub gene list (n=10) to identify direct regulatory connections within the EDC-BC hub gene network. This identified instances where a hub gene also acted as a TF regulating another hub gene.
4.12. Integration Analysis
To synthesize the findings, a master integration summary table was created in R using the dplyr package. For each of the ten EDC-associated hub genes, the table compiled network centrality rank; the direction and adjusted p-value of ancestry-associated expression differences; transcription factor regulatory connections; and the burden of ClinVar pathogenic variants and breast cancer association status. We retrieved clinically documented genetic variants for ESR1, EP300, and ARID1A from the NCBI ClinVar database [22]. Genes were considered ancestry-significant if they met the pre-specified threshold of padj < 0.05 in the Wilcoxon rank-sum test, with Benjamini-Hochberg correction for the false discovery rate.
4.13. Integration Visualization
A bubble plot was created in the ggplot2 R package to bring all findings together in one figure. The ten hub genes were plotted along the x-axis by network centrality rank, with -log10(adjusted p-value) from the ancestry-stratified expression analysis on the y-axis. Bubble size represented the number of pathogenic or likely pathogenic ClinVar variants identified for each gene, and color indicated whether genes were ancestry-significant (padj < 0.05, green) or non-significant (gray). A horizontal red dashed line marked the significance threshold (padj = 0.05). A directional arrow illustrated the TP53-to-ESR1 transcriptional activation axis, connecting the most central hub gene to the gene with the most statistically significant ancestry association.
5. Conclusions
This study shows that EDC-associated gene regulatory patterns differ significantly between African American and European American breast cancer patients, with ESR1, EP300, and ARID1A consistently downregulated in AA patients. The TP53-to-ESR1 transcriptional activation axis emerges as the most compelling mechanistic explanation for ancestry-associated differences in ESR1 expression. These findings underscore the importance of incorporating ancestry-stratified analyses into EDC research and suggest that the effects of TCDD and BPA exposure in breast tissue may be shaped by ancestry-specific transcriptional and epigenetic contexts. Future studies should experimentally investigate the TP53-to-ESR1 axis in ancestry-matched breast cancer cell lines and examine whether ancestry-specific differences in EP300 and ARID1A activity contribute to differences in chromatin accessibility and gene regulation in AA versus EA breast tumors.
Supplementary Materials
The following supporting information can be downloaded at the website of this paper posted on Preprints.org.
Author Contributions
For research articles with several authors, a short paragraph specifying their individual contributions must be provided. The following statements should be used “Conceptualization, A.M. and K.N.C.; methodology, A.M. and K.N.C. ; software, A.M. and K.N.C.; validation, A.M..; formal analysis, A.M. and K.N.C.; investigation, A.M.; resources, K.N.C.; data curation, A.M. and K.N.C; writing—original draft preparation, A.M. and K.N.C; writing—review and editing, A.M. and K.N.C; visualization, A.M. and K.N.C; supervision, K.N.C.; project administration, K.N.C.; funding acquisition, K.N.C. All authors have read and agreed to the published version of the manuscript.”.
Funding
This research received no external funding.
Institutional Review Board Statement
Ethical review and approval were waived because this study used existing datasets and did not involve experiments with human subjects or animals.
Informed Consent Statement
Not applicable.
Data Availability Statement
Publicly available datasets were analyzed in this study.
Conflicts of Interest
The authors declare no conflicts of interest.
Abbreviations
The following abbreviations are used in this manuscript:
| AA | African American |
| ARID1A | AT-Rich Interaction Domain 1A |
| BPA | Bisphenol A |
| ClinVar EA EDC EP300 ESR1 FOXA1 FOXM1 FOXO3 |
Clinical Variation (database) European American Endocrine-Disrupting Chemical / Endocrine-Disruptor Compound E1A Binding Protein P300 Estrogen Receptor 1 Forkhead Box A1 Forkhead Box M1 Forkhead Box O3 |
| GATA3 | GATA Binding Protein 3 |
| PGR | Progesterone Receptor |
| SNV | Single Nucleotide Variant |
| SP1 | Sp1 Transcription Factor |
| STAT1 | Signal Transducer and Activator of Transcription 1 |
| TCGA-BRCA | The Cancer Genome Atlas – Breast Invasive Carcinoma |
| TCDD | 2,3,7,8-Tetrachlorodibenzo-p-dioxin |
| TF | Transcription Factor |
| TP53 | Tumor Protein P53 |
| UTR | Untranslated Region |
References
- Aldrighetti, C.M.; Niemierko, A.; Van Allen, E.; Willers, H.; Kamran, S.C. Racial and Ethnic Disparities Among Participants in Precision Oncology Clinical Studies. JAMA Netw. Open 2021, 4, e2133205. [Google Scholar] [CrossRef]
- Giaquinto, A.N.; Sung, H.; Miller, K.D.; Kramer, J.L.; Newman, L.A.; Minihan, A.; Jemal, A.; Siegel, R.L. Breast Cancer Statistics, 2022. CA Cancer J. Clin. 2022, 72, 524–541. [Google Scholar] [CrossRef]
- Foy, K.C.; Fisher, J.L.; Lustberg, M.B.; Gray, D.M.; DeGraffinreid, C.R.; Paskett, E.D. Disparities in Breast Cancer Tumor Characteristics, Treatment, Time to Treatment, and Survival Probability among African American and White Women. npj Breast Cancer 2018, 4, 7. [Google Scholar] [CrossRef]
- Martini, R.; Newman, L.; Davis, M. Breast Cancer Disparities in Outcomes; Unmasking Biological Determinants Associated with Racial and Genetic Diversity. Clin. Exp. Metastasis 2022, 39, 7–14. [Google Scholar] [CrossRef]
- Santaliz Casiano, A.; Lee, A.; Teteh, D.; Madak Erdogan, Z.; Treviño, L. Endocrine-Disrupting Chemicals and Breast Cancer: Disparities in Exposure and Importance of Research Inclusivity. Endocrinology 2022, 163, bqac034. [Google Scholar] [CrossRef]
- Safe, S.H. Modulation of Gene Expression and Endocrine Response Pathways by 2,3,7,8-Tetrachlorodibenzo-p-Dioxin and Related Compounds. Pharmacol. Ther. 1995, 67, 247–281. [Google Scholar] [CrossRef]
- Kuiper, G.G.J.M.; Lemmen, J.G.; Carlsson, B.; Corton, J.C.; Safe, S.H.; Van Der Saag, P.T.; Van Der Burg, B.; Gustafsson, J.-Å. Interaction of Estrogenic Chemicals and Phytoestrogens with Estrogen Receptor β. Endocrinology 1998, 139, 4252–4263. [Google Scholar] [CrossRef]
- Lemmen, J.G.; Arends, R.J.; Van Der Saag, P.T.; Van Der Burg, B. In Vivo Imaging of Activated Estrogen Receptors in Utero by Estrogens and Bisphenol A. Environ. Health Perspect. 2004, 112, 1544–1549. [Google Scholar] [CrossRef]
- Dumitrascu, M.; Mares, C.; Petca, R.-C.; Sandru, F.; Popescu, R.-I.; Mehedintu, C.; Petca, A. Carcinogenic Effects of Bisphenol A in Breast and Ovarian Cancers (Review). Oncol. Lett. 2020, 20, 1–1. [Google Scholar] [CrossRef]
- Dairkee, S.H.; Seok, J.; Champion, S.; Sayeed, A.; Mindrinos, M.; Xiao, W.; Davis, R.W.; Goodson, W.H. Bisphenol A Induces a Profile of Tumor Aggressiveness in High-Risk Cells from Breast Cancer Patients. Cancer Res. 2008, 68, 2076–2080. [Google Scholar] [CrossRef]
- Huo, D.; Hu, H.; Rhie, S.K.; Gamazon, E.R.; Cherniack, A.D.; Liu, J.; Yoshimatsu, T.F.; Pitt, J.J.; Hoadley, K.A.; Troester, M.; et al. Comparison of Breast Cancer Molecular Features and Survival by African and European Ancestry in The Cancer Genome Atlas. JAMA Oncol. 2017, 3, 1654. [Google Scholar] [CrossRef]
- Rasti, M.; Arabsolghar, R.; Khatooni, Z.; Mostafavi-Pour, Z. P53 Binds to Estrogen Receptor 1 Promoter in Human Breast Cancer Cells. Pathol. Oncol. Res. 2012, 18, 169–175. [Google Scholar] [CrossRef]
- Qin, X.-Y.; Fukuda, T.; Yang, L.; Zaha, H.; Akanuma, H.; Zeng, Q.; Yoshinaga, J.; Sone, H. Effects of Bisphenol A Exposure on the Proliferation and Senescence of Normal Human Mammary Epithelial Cells. Cancer Biol. Ther. 2012, 13, 296–306. [Google Scholar] [CrossRef]
- Singh, D.D. Epigenetic Mechanisms of Endocrine-Disrupting Chemicals in Breast Cancer and Their Impact on Dietary Intake. J. Xenobiotics 2024, 15, 1. [Google Scholar] [CrossRef]
- Prakash, O.; Hossain, F.; Danos, D.; Lassak, A.; Scribner, R.; Miele, L. Racial Disparities in Triple Negative Breast Cancer: A Review of the Role of Biologic and Non-Biologic Factors. Front. Public Health 2020, 8, 576964. [Google Scholar] [CrossRef]
- Attar, N.; Kurdistani, S.K. Exploitation of EP300 and CREBBP Lysine Acetyltransferases by Cancer. Cold Spring Harb. Perspect. Med. 2017, 7, a026534. [Google Scholar] [CrossRef]
- Bitler, B.G.; Aird, K.M.; Garipov, A.; Li, H.; Amatangelo, M.; Kossenkov, A.V.; Schultz, D.C.; Liu, Q.; Shih, I.-M.; Conejo-Garcia, J.R.; et al. Synthetic Lethality by Targeting EZH2 Methyltransferase Activity in ARID1A-Mutated Cancers. Nat. Med. 2015, 21, 231–238. [Google Scholar] [CrossRef]
- Han, D.T.; Zhao, W.; Powell, W.H. Dioxin Disrupts Thyroid Hormone and Glucocorticoid Induction of Klf9, a Master Regulator of Frog Metamorphosis. Toxicol. Sci. 2022, 187, 150–161. [Google Scholar] [CrossRef]
- Kim, M.J.; Park, Y.J. Bisphenols and Thyroid Hormone. Endocrinol. Metab. 2019, 34, 340. [Google Scholar] [CrossRef]
- Bommi-Reddy, A.; Park-Chouinard, S.; Mayhew, D.N.; Terzo, E.; Hingway, A.; Steinbaugh, M.J.; Wilson, J.E.; Sims, R.J.; Conery, A.R. CREBBP/EP300 Acetyltransferase Inhibition Disrupts FOXA1-Bound Enhancers to Inhibit the Proliferation of ER+ Breast Cancer Cells. PLoS ONE 2022, 17, e0262378. [Google Scholar] [CrossRef]
- Garcia-Alonso, L.; Holland, C.H.; Ibrahim, M.M.; Turei, D.; Saez-Rodriguez, J. Benchmark and Integration of Resources for the Estimation of Human Transcription Factor Activities. Genome Res. 2019, 29, 1363–1375. [Google Scholar] [CrossRef]
- Landrum, M.J.; Lee, J.M.; Benson, M.; Brown, G.R.; Chao, C.; Chitipiralla, S.; Gu, B.; Hart, J.; Hoffman, D.; Jang, W.; et al. ClinVar: Improving Access to Variant Interpretations and Supporting Evidence. Nucleic Acids Res. 2018, 46, D1062–D1067. [Google Scholar] [CrossRef]
Figure 1.
(a) Venn diagram showing the overlap among BPA target genes, TCDD target genes, and breast cancer-associated genes retrieved from the Comparative Toxicogenomics Database (CTD). BPA exclusively targeted 1,203 genes, TCDD exclusively targeted 289 genes, and 75 genes were shared only by BPA and TCDD. In total, 1,432 genes were shared across all three sets (BPA, TCDD, and breast cancer); 917 genes were shared by TCDD and breast cancer, and 7,239 by BPA and breast cancer. These intersections informed the combined EDC gene set used in subsequent network analysis. (b) Venn diagram showing the intersection of the combined EDC target gene set (BPA + TCDD, n=11,155) and breast cancer-associated genes (n=16,203) retrieved from CTD. The overlap of 9,588 genes represents the candidate EDC-breast cancer gene set used to construct the protein-protein interaction network. In total, 6,615 genes were unique to breast cancer, and 1,567 were unique to EDC targets.
Figure 1.
(a) Venn diagram showing the overlap among BPA target genes, TCDD target genes, and breast cancer-associated genes retrieved from the Comparative Toxicogenomics Database (CTD). BPA exclusively targeted 1,203 genes, TCDD exclusively targeted 289 genes, and 75 genes were shared only by BPA and TCDD. In total, 1,432 genes were shared across all three sets (BPA, TCDD, and breast cancer); 917 genes were shared by TCDD and breast cancer, and 7,239 by BPA and breast cancer. These intersections informed the combined EDC gene set used in subsequent network analysis. (b) Venn diagram showing the intersection of the combined EDC target gene set (BPA + TCDD, n=11,155) and breast cancer-associated genes (n=16,203) retrieved from CTD. The overlap of 9,588 genes represents the candidate EDC-breast cancer gene set used to construct the protein-protein interaction network. In total, 6,615 genes were unique to breast cancer, and 1,567 were unique to EDC targets.
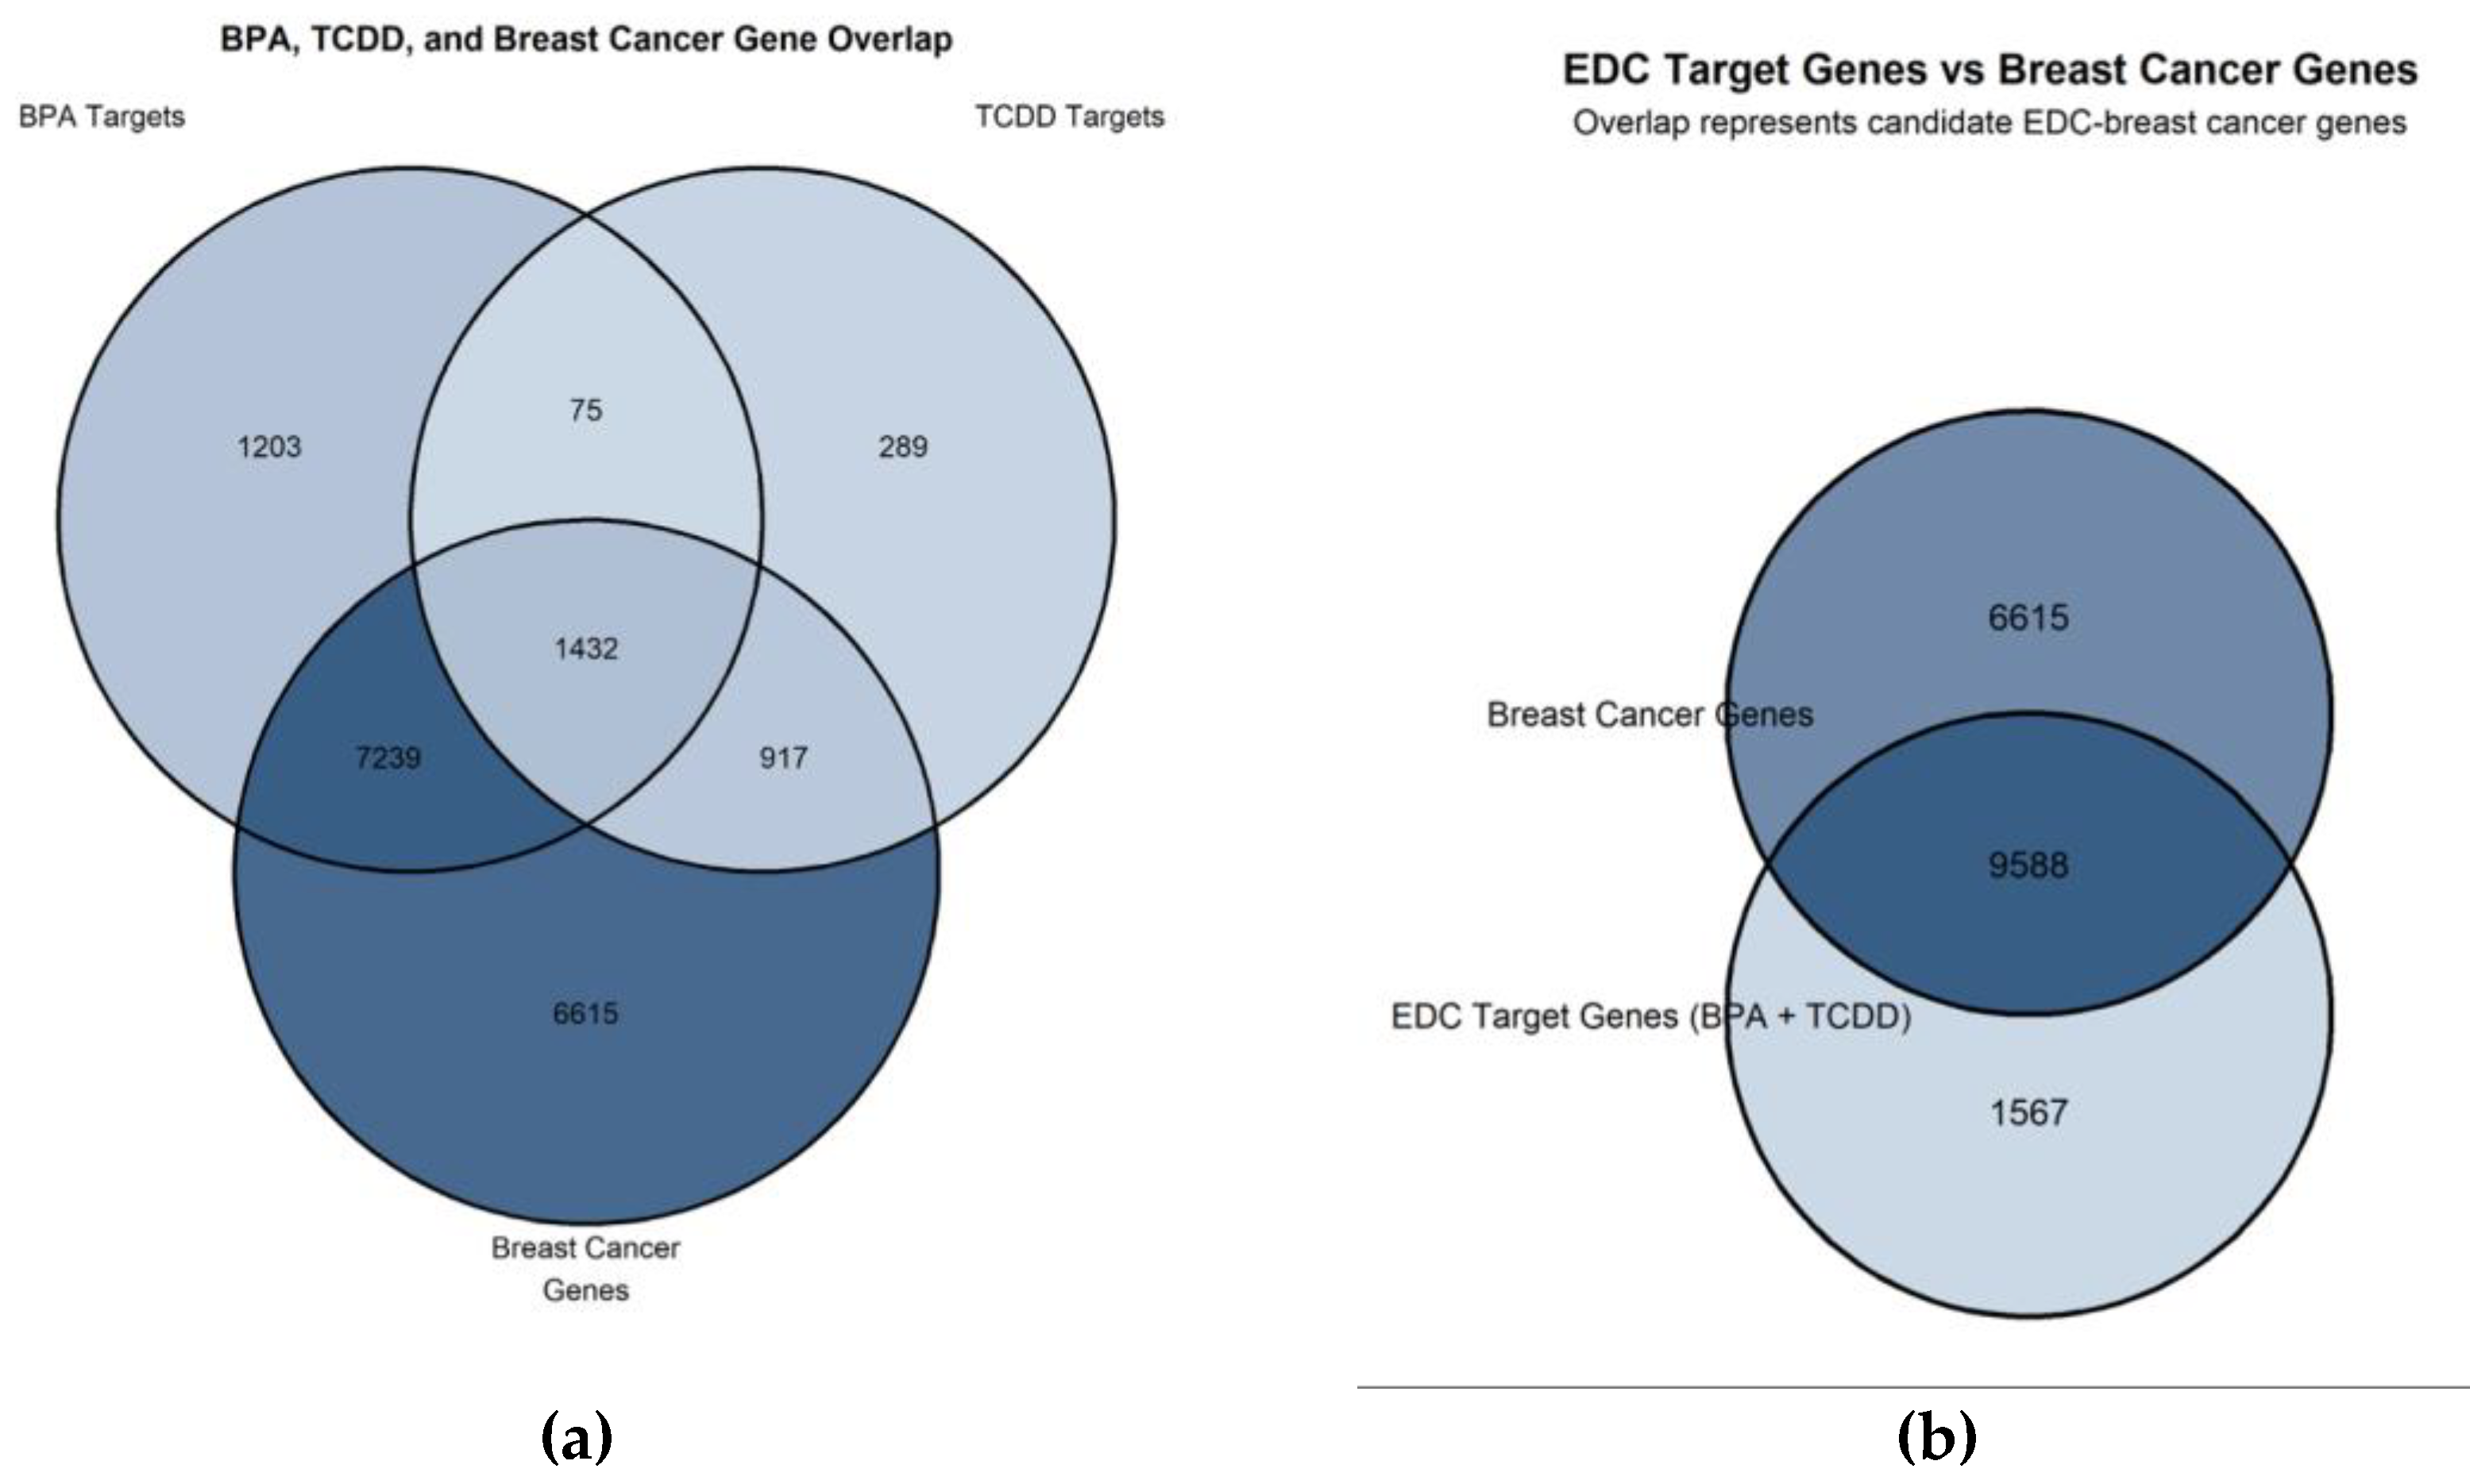
Figure 2.
Protein-protein interaction network of EDC-breast cancer hub genes visualized using Cytoscape (version 3.10.4). Yellow nodes indicate the top 10 hub genes, identified by degree and closeness centrality with Cytoscape’s built-in Network Analyzer tool: TP53, MYC, BRCA1, CCND1, ESR1, BRCA2, ERBB2, PARP1, EP300, and ARID1A. Pink nodes indicate interacting network partners. Edge thickness corresponds to the STRING interaction confidence score (minimum score = 0.700).
Figure 2.
Protein-protein interaction network of EDC-breast cancer hub genes visualized using Cytoscape (version 3.10.4). Yellow nodes indicate the top 10 hub genes, identified by degree and closeness centrality with Cytoscape’s built-in Network Analyzer tool: TP53, MYC, BRCA1, CCND1, ESR1, BRCA2, ERBB2, PARP1, EP300, and ARID1A. Pink nodes indicate interacting network partners. Edge thickness corresponds to the STRING interaction confidence score (minimum score = 0.700).
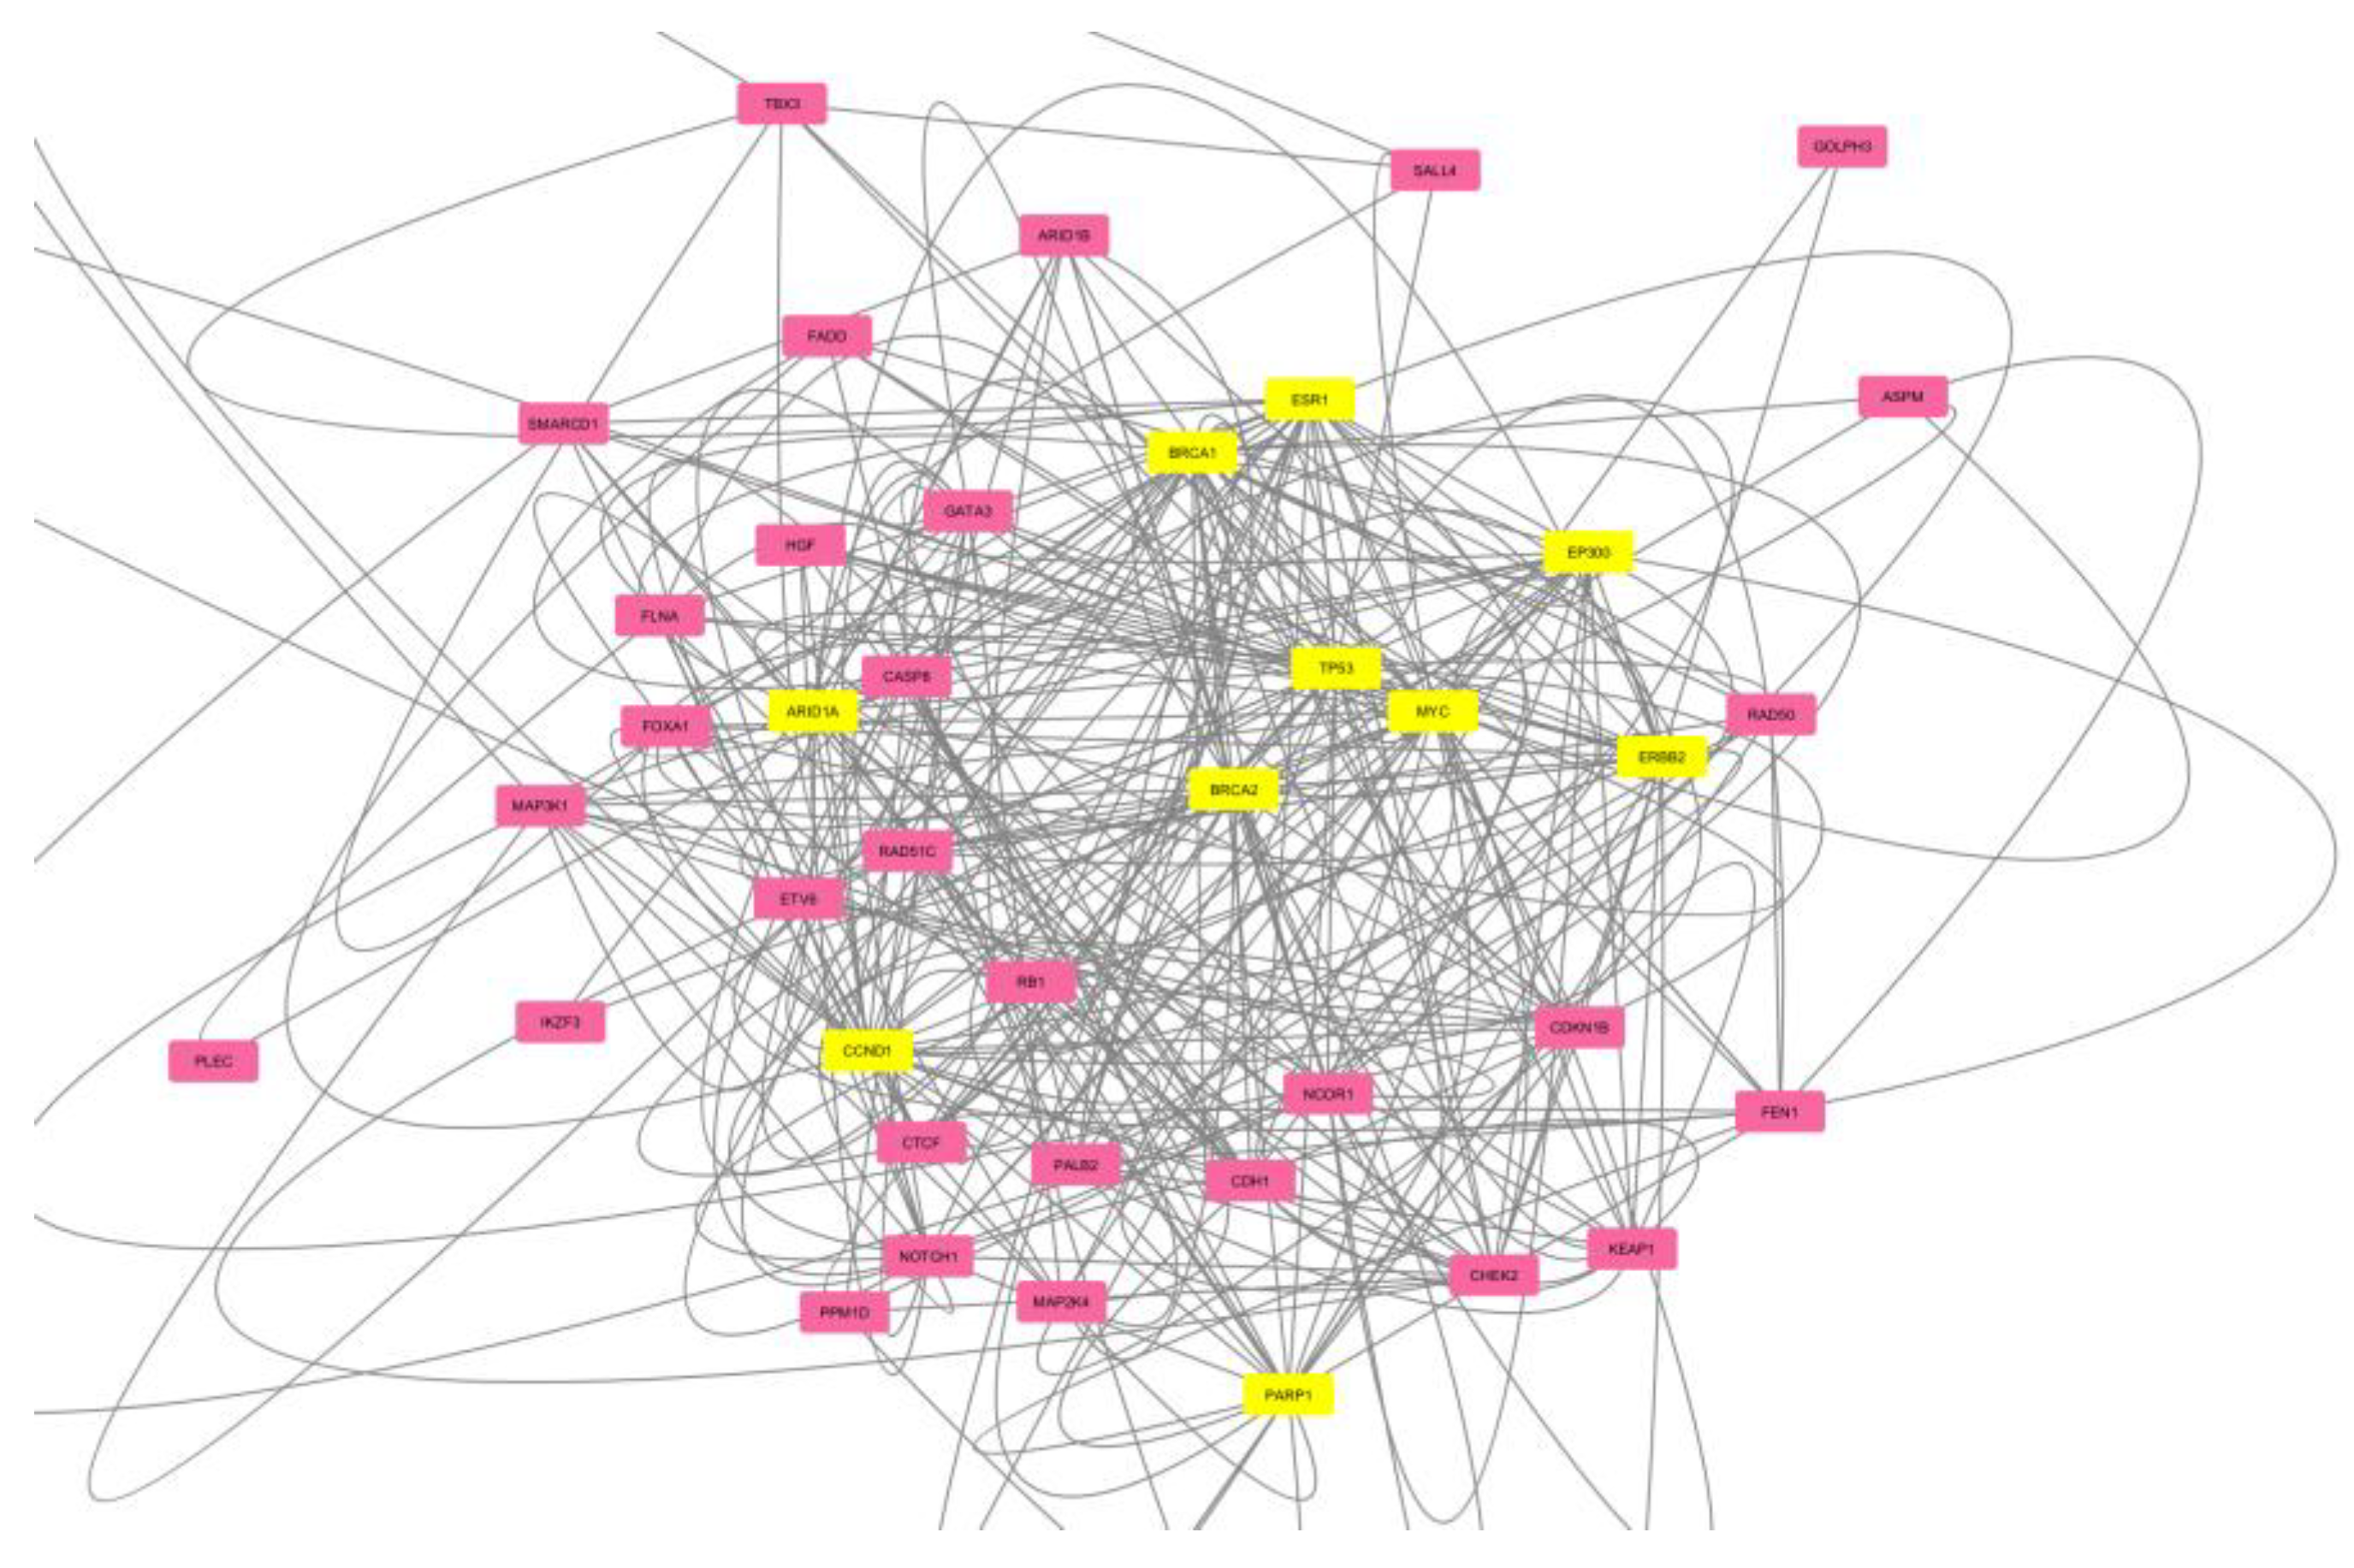
Figure 3.
(a) Heatmap showing the three significant hub genes ESR1, EP300, and ARID1A in AA (n=189) and EA (n=867) breast cancer patients from the TCGA-BRCA dataset. Color intensity reflects expression level: darker green indicates higher expression, while darker blue indicates lower expression. (b) Forest plot showing the mean log2 expression difference (EA minus AA) for the three ancestry-significant EDC hub genes (ESR1, EP300, and ARID1A) in the TCGA-BRCA dataset (AA n=189; EA n=867). Points indicate the mean expression difference between European American and African American breast cancer patients. Horizontal lines show 95% confidence intervals calculated by bootstrap resampling (n=1,000 iterations, seed=42). The vertical dashed line at x=0 marks no difference between ancestry groups. All three genes have expression differences entirely to the right of zero, indicating consistently higher expression in EA patients. Adjusted p-values from the Wilcoxon rank-sum test, corrected for false discovery rate using the Benjamini-Hochberg method, are annotated for each gene.
Figure 3.
(a) Heatmap showing the three significant hub genes ESR1, EP300, and ARID1A in AA (n=189) and EA (n=867) breast cancer patients from the TCGA-BRCA dataset. Color intensity reflects expression level: darker green indicates higher expression, while darker blue indicates lower expression. (b) Forest plot showing the mean log2 expression difference (EA minus AA) for the three ancestry-significant EDC hub genes (ESR1, EP300, and ARID1A) in the TCGA-BRCA dataset (AA n=189; EA n=867). Points indicate the mean expression difference between European American and African American breast cancer patients. Horizontal lines show 95% confidence intervals calculated by bootstrap resampling (n=1,000 iterations, seed=42). The vertical dashed line at x=0 marks no difference between ancestry groups. All three genes have expression differences entirely to the right of zero, indicating consistently higher expression in EA patients. Adjusted p-values from the Wilcoxon rank-sum test, corrected for false discovery rate using the Benjamini-Hochberg method, are annotated for each gene.
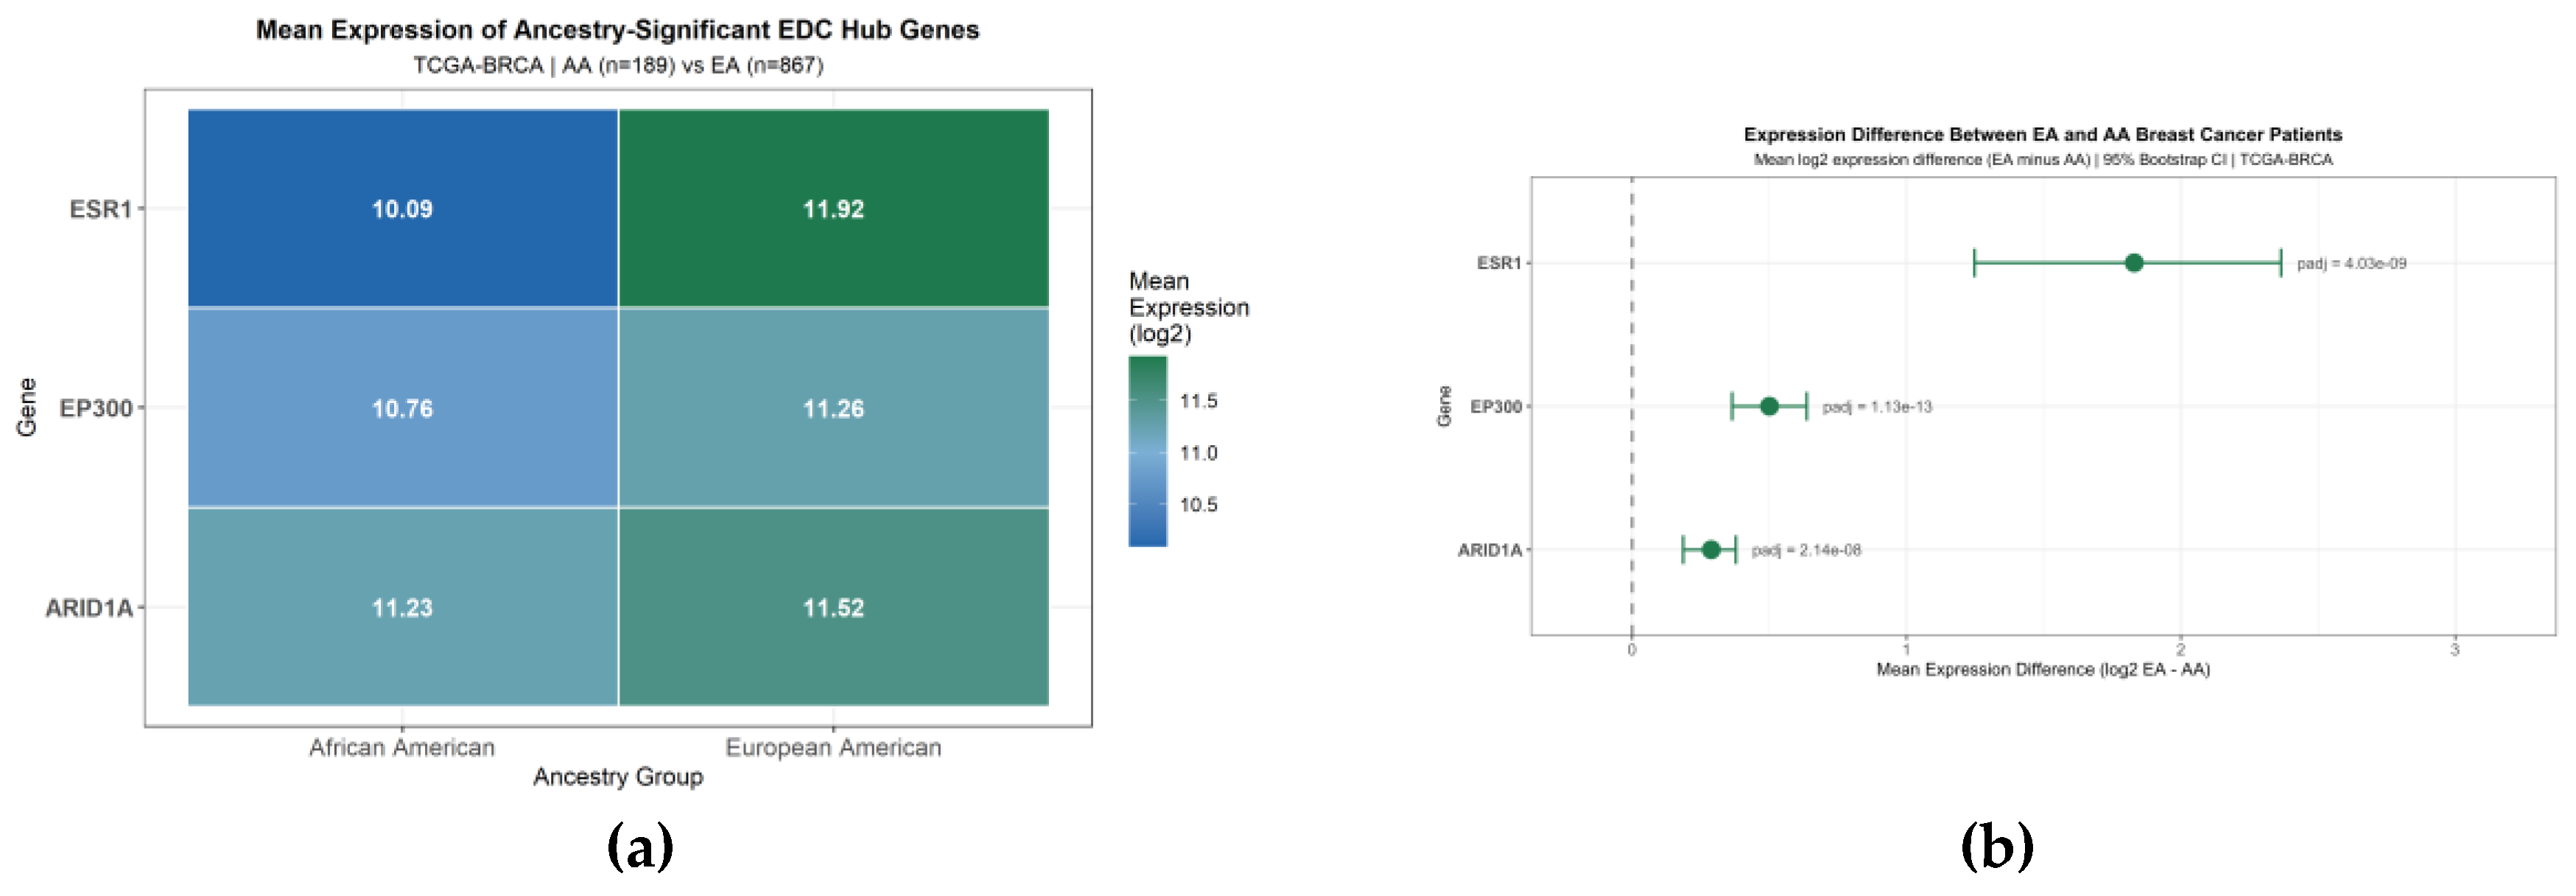
Figure 4.
Boxplot comparing expression levels of 10 EDC-associated hub genes in African American (AA, n=189, red) and European American (EA, n=867, blue) breast cancer patients from the TCGA-BRCA dataset. Three genes, ESR1, EP300, and ARID1A, had significantly higher expression in EA patients (Wilcoxon rank-sum test with Benjamini-Hochberg FDR correction; padj < 0.05). ESR1 showed the most visually prominent difference, consistent with its role in estrogen receptor-positive breast cancer, which is more prevalent in EA patients.
Figure 4.
Boxplot comparing expression levels of 10 EDC-associated hub genes in African American (AA, n=189, red) and European American (EA, n=867, blue) breast cancer patients from the TCGA-BRCA dataset. Three genes, ESR1, EP300, and ARID1A, had significantly higher expression in EA patients (Wilcoxon rank-sum test with Benjamini-Hochberg FDR correction; padj < 0.05). ESR1 showed the most visually prominent difference, consistent with its role in estrogen receptor-positive breast cancer, which is more prevalent in EA patients.
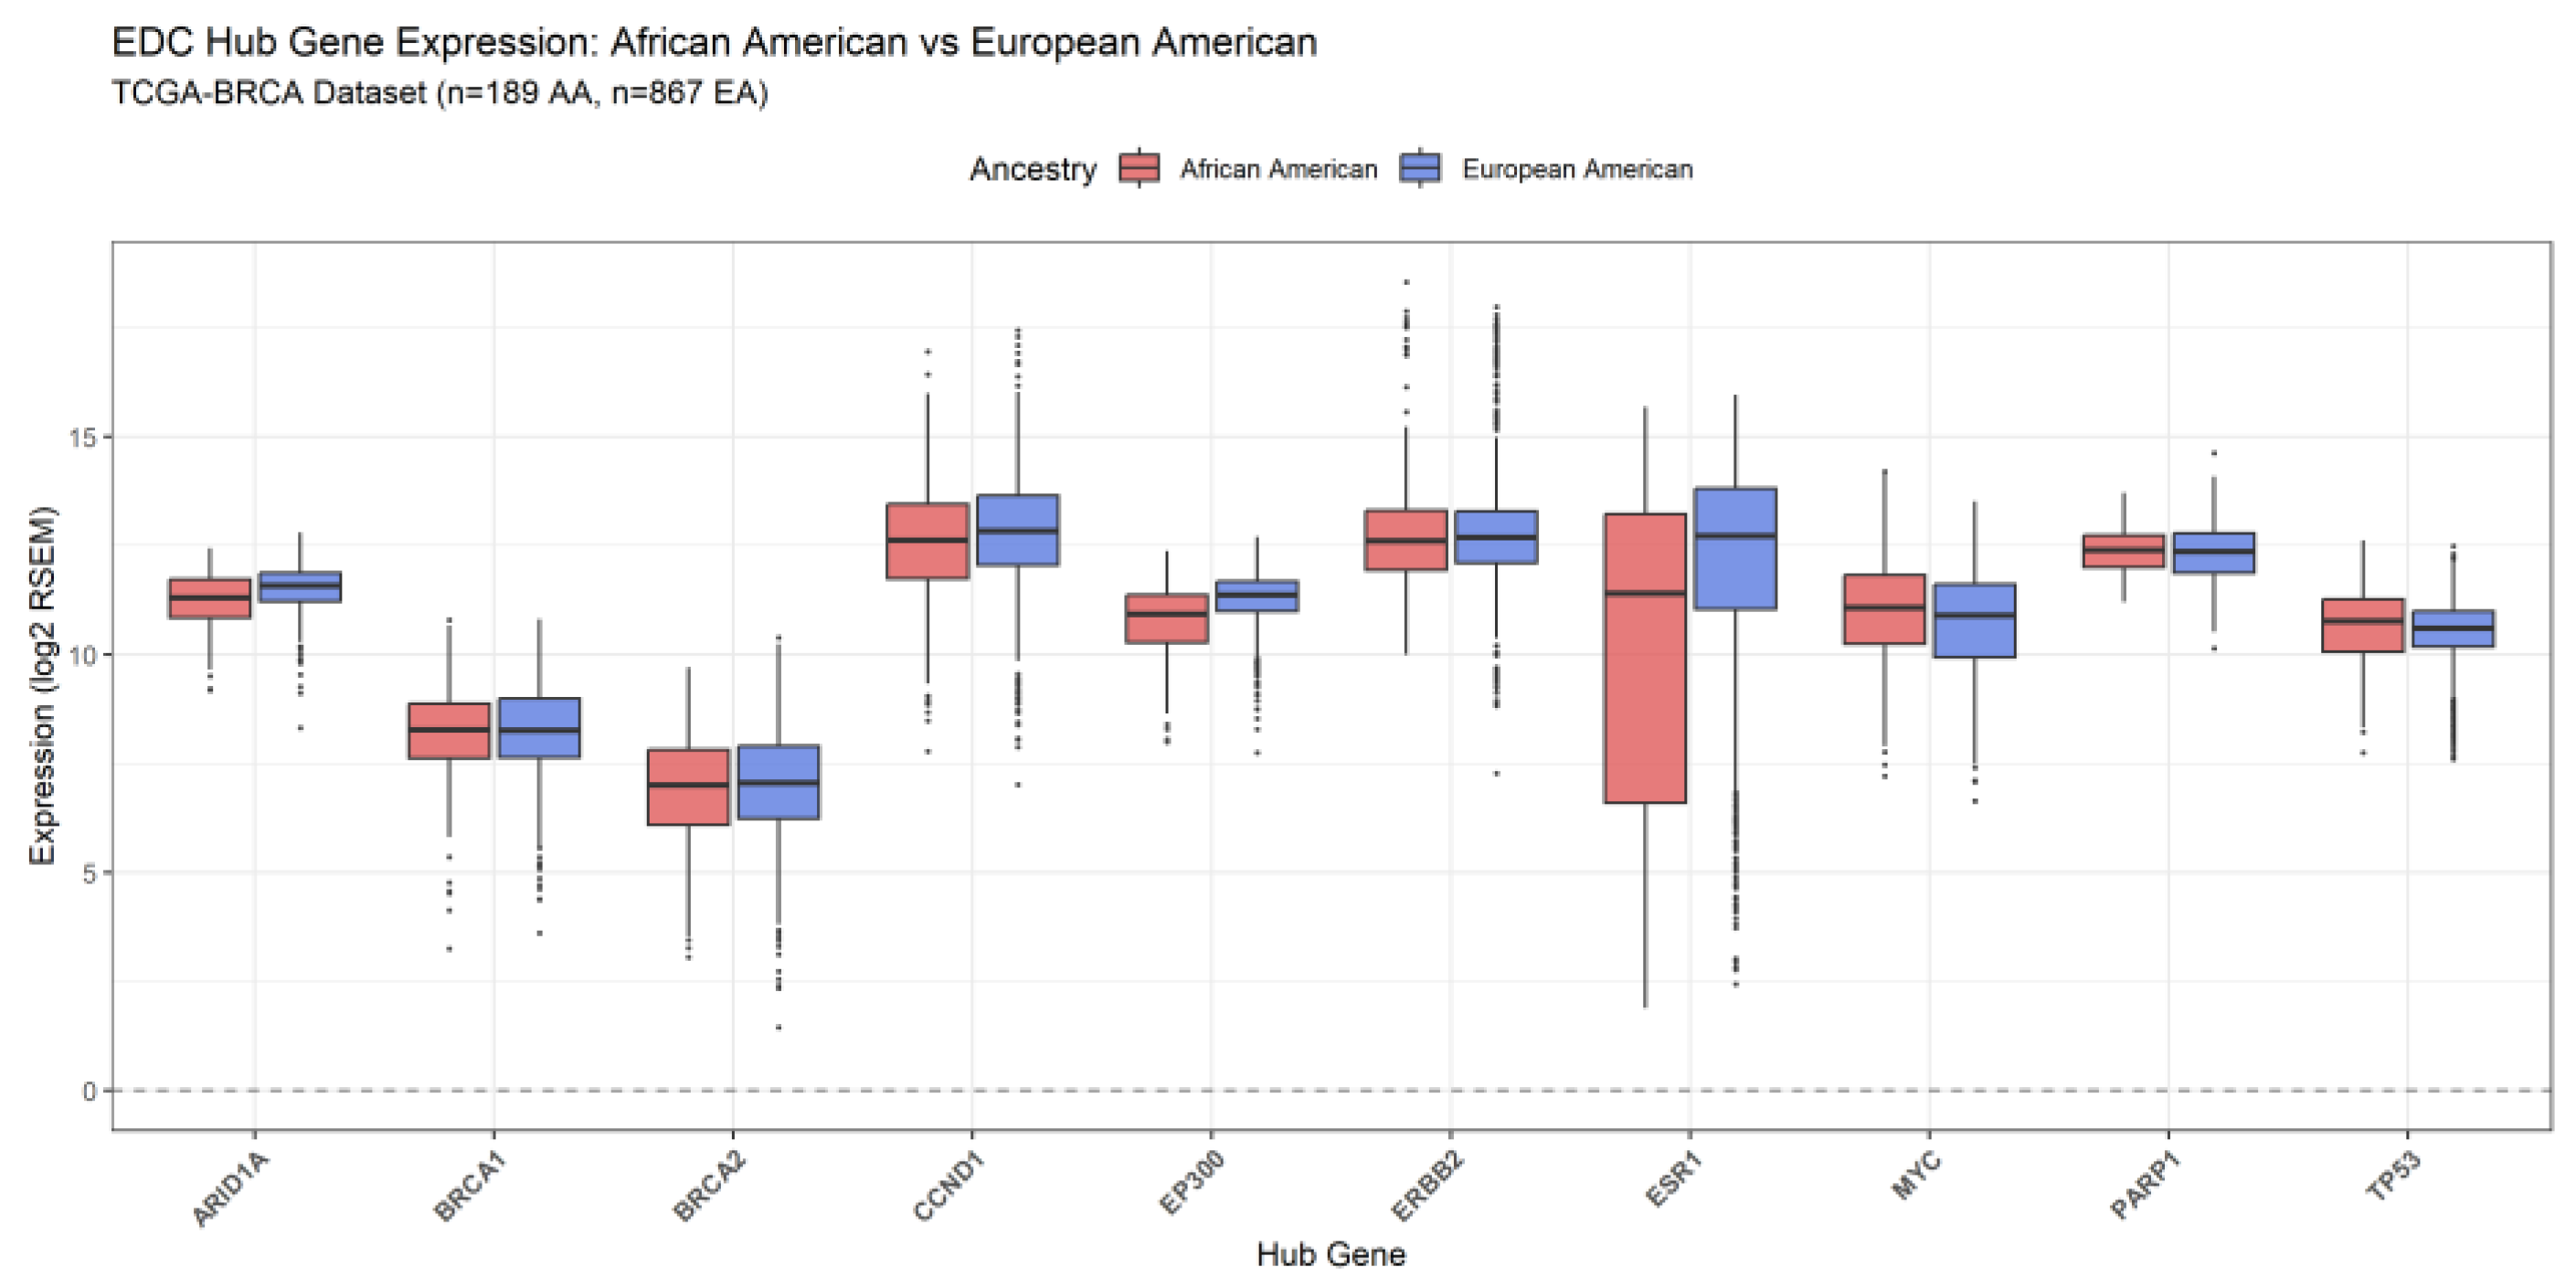
Figure 5.
The volcano plot shows ancestry-associated expression differences among the ten EDC-associated hub genes in the TCGA-BRCA dataset. The y-axis shows –log10(adjusted p-value), while the x-axis indicates the direction of differential expression between AA (n = 189) and EA (n = 867) breast cancer patients. The red dashed horizontal line marks the significance threshold (padj = 0.05). Green points indicate genes with significantly higher expression in EA patients (padj < 0.05), and gray points indicate non-significant genes. ESR1, EP300, and ARID1A were the only statistically significant genes, and all had higher expression in EA patients. Statistical testing used the Wilcoxon rank-sum test with the BH FDR correction.
Figure 5.
The volcano plot shows ancestry-associated expression differences among the ten EDC-associated hub genes in the TCGA-BRCA dataset. The y-axis shows –log10(adjusted p-value), while the x-axis indicates the direction of differential expression between AA (n = 189) and EA (n = 867) breast cancer patients. The red dashed horizontal line marks the significance threshold (padj = 0.05). Green points indicate genes with significantly higher expression in EA patients (padj < 0.05), and gray points indicate non-significant genes. ESR1, EP300, and ARID1A were the only statistically significant genes, and all had higher expression in EA patients. Statistical testing used the Wilcoxon rank-sum test with the BH FDR correction.
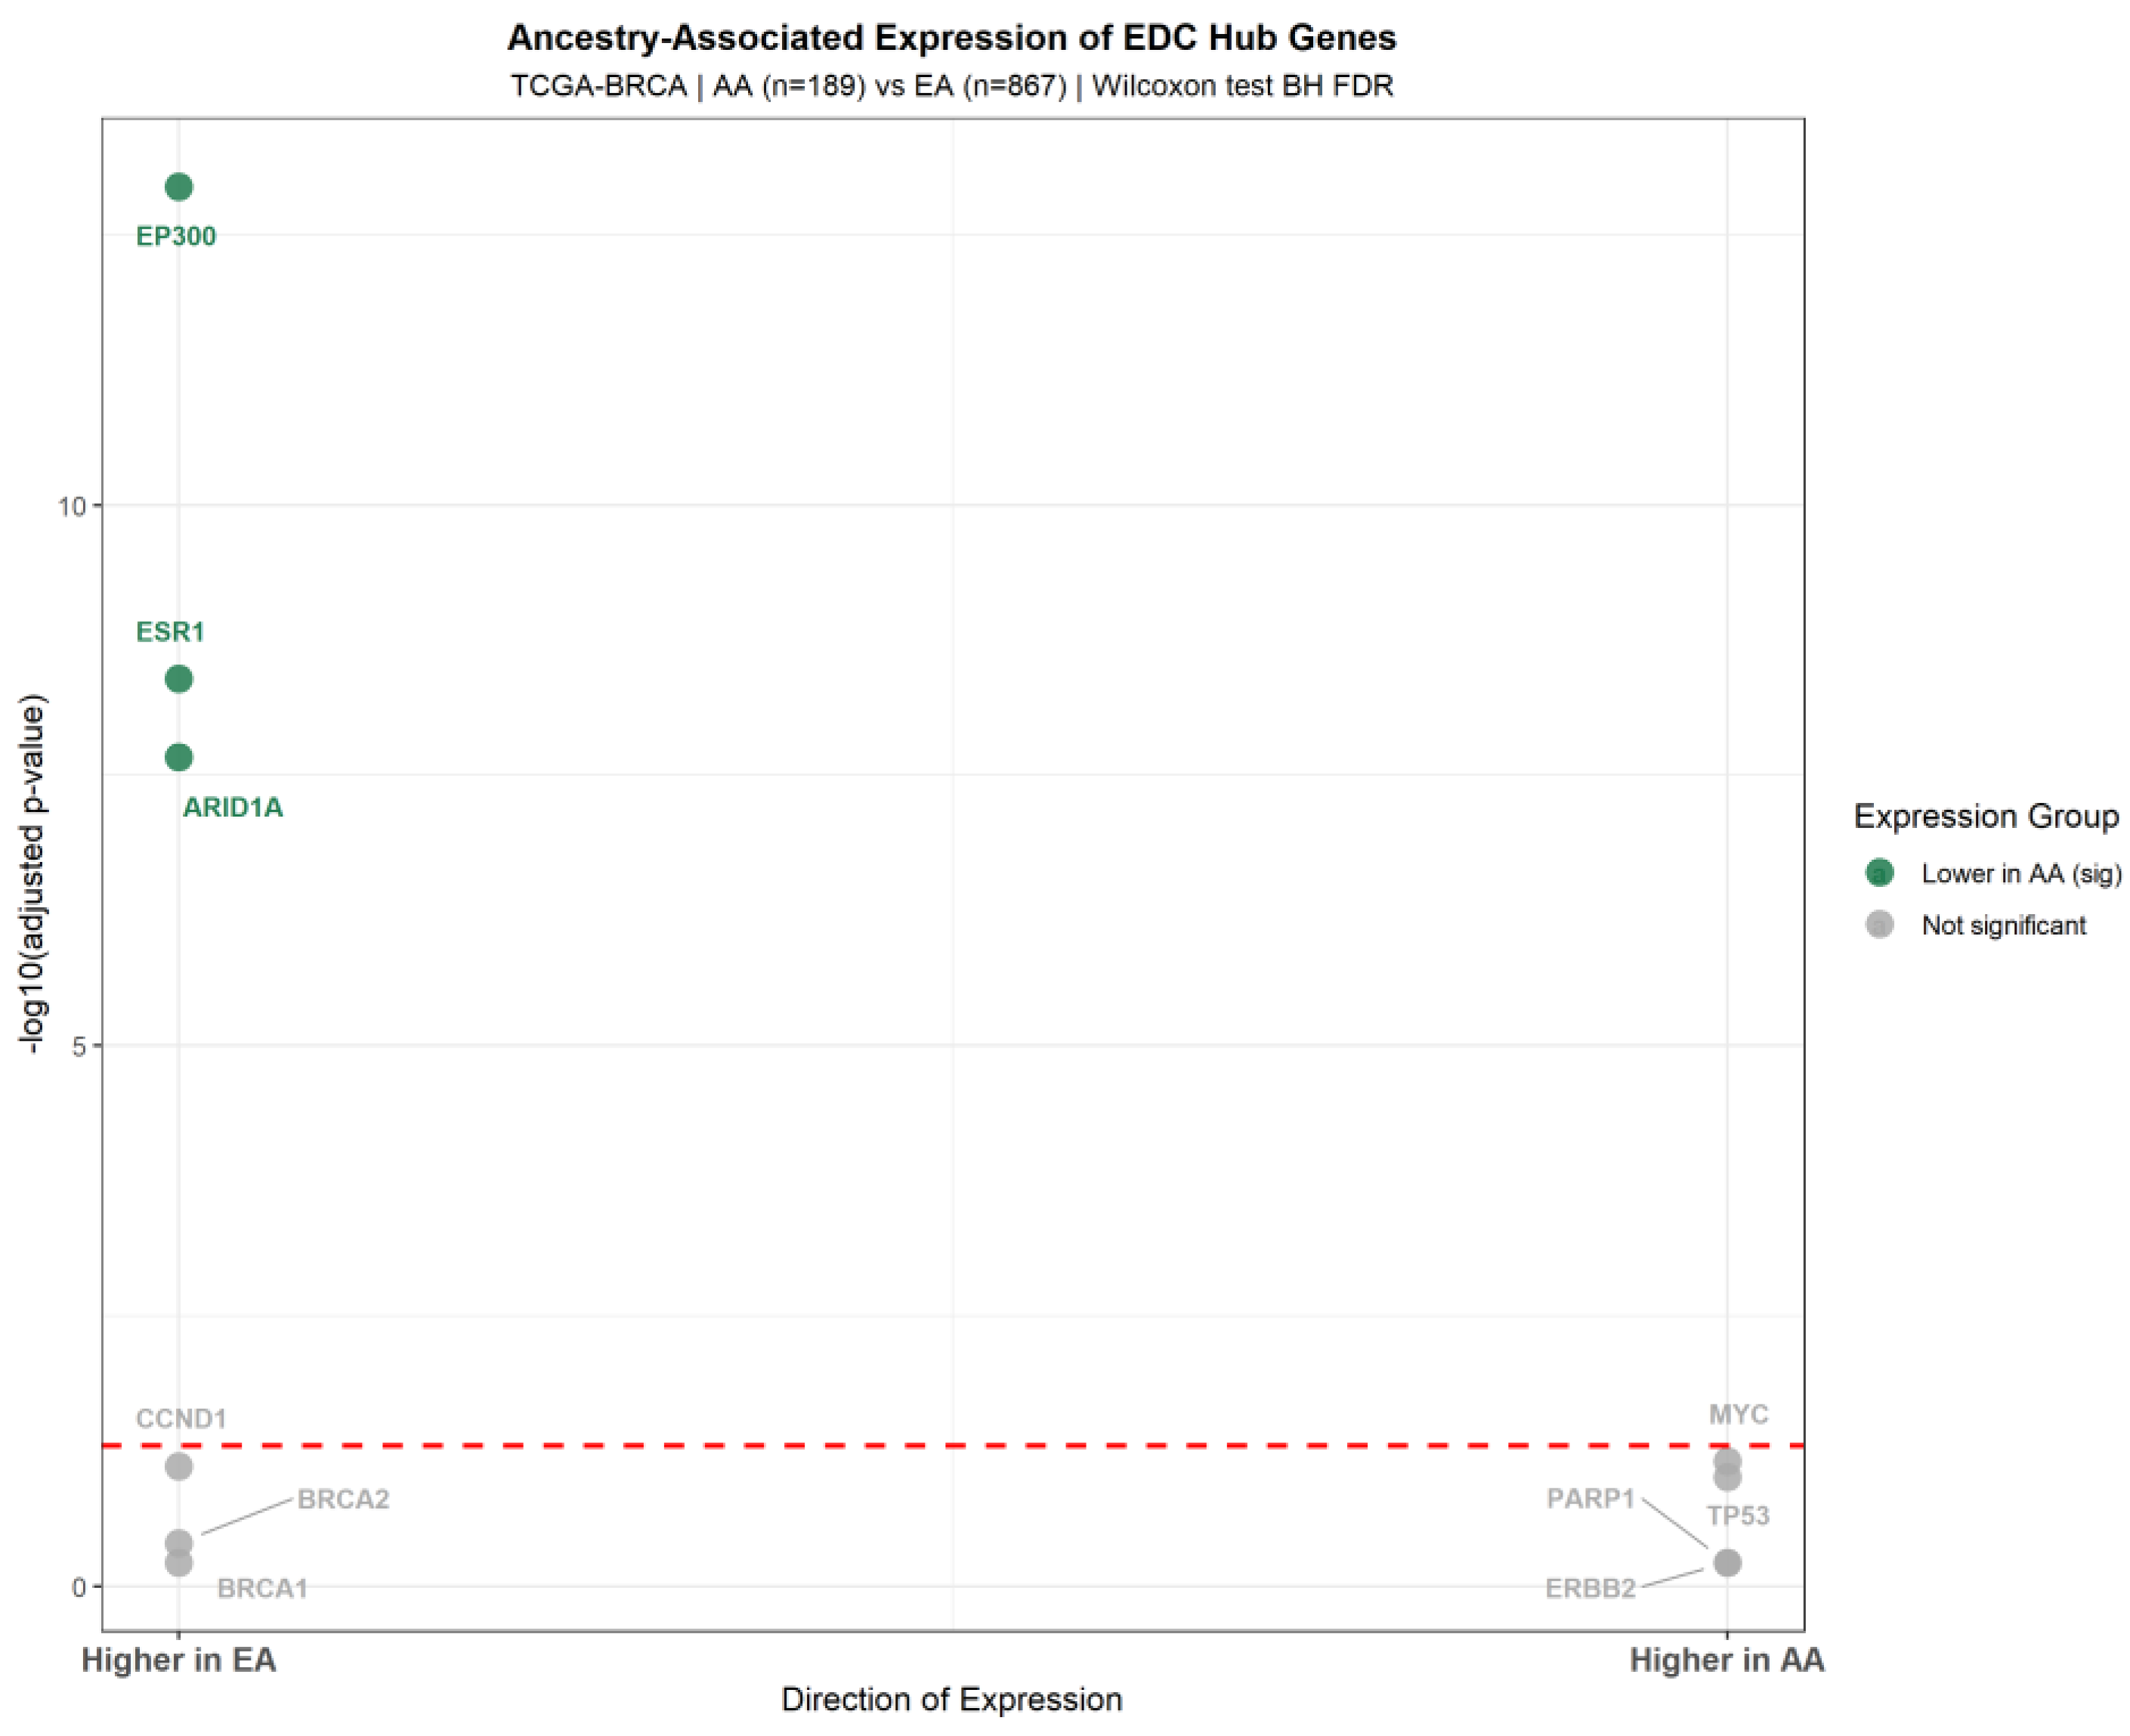
Figure 6.
Bar chart comparing expression levels of the three ancestry-significant EDC hub genes in breast cancer patients from the TCGA-BRCA dataset: AA (n=189, red) and EA (n=867, blue). Error bars show the standard error of the mean. Horizontal brackets marked with three asterisks (***) indicate statistically significant differences between ancestry groups (padj < 0.05, Wilcoxon rank-sum test with Benjamini-Hochberg false discovery rate correction). ESR1 showed the greatest expression difference between groups.
Figure 6.
Bar chart comparing expression levels of the three ancestry-significant EDC hub genes in breast cancer patients from the TCGA-BRCA dataset: AA (n=189, red) and EA (n=867, blue). Error bars show the standard error of the mean. Horizontal brackets marked with three asterisks (***) indicate statistically significant differences between ancestry groups (padj < 0.05, Wilcoxon rank-sum test with Benjamini-Hochberg false discovery rate correction). ESR1 showed the greatest expression difference between groups.
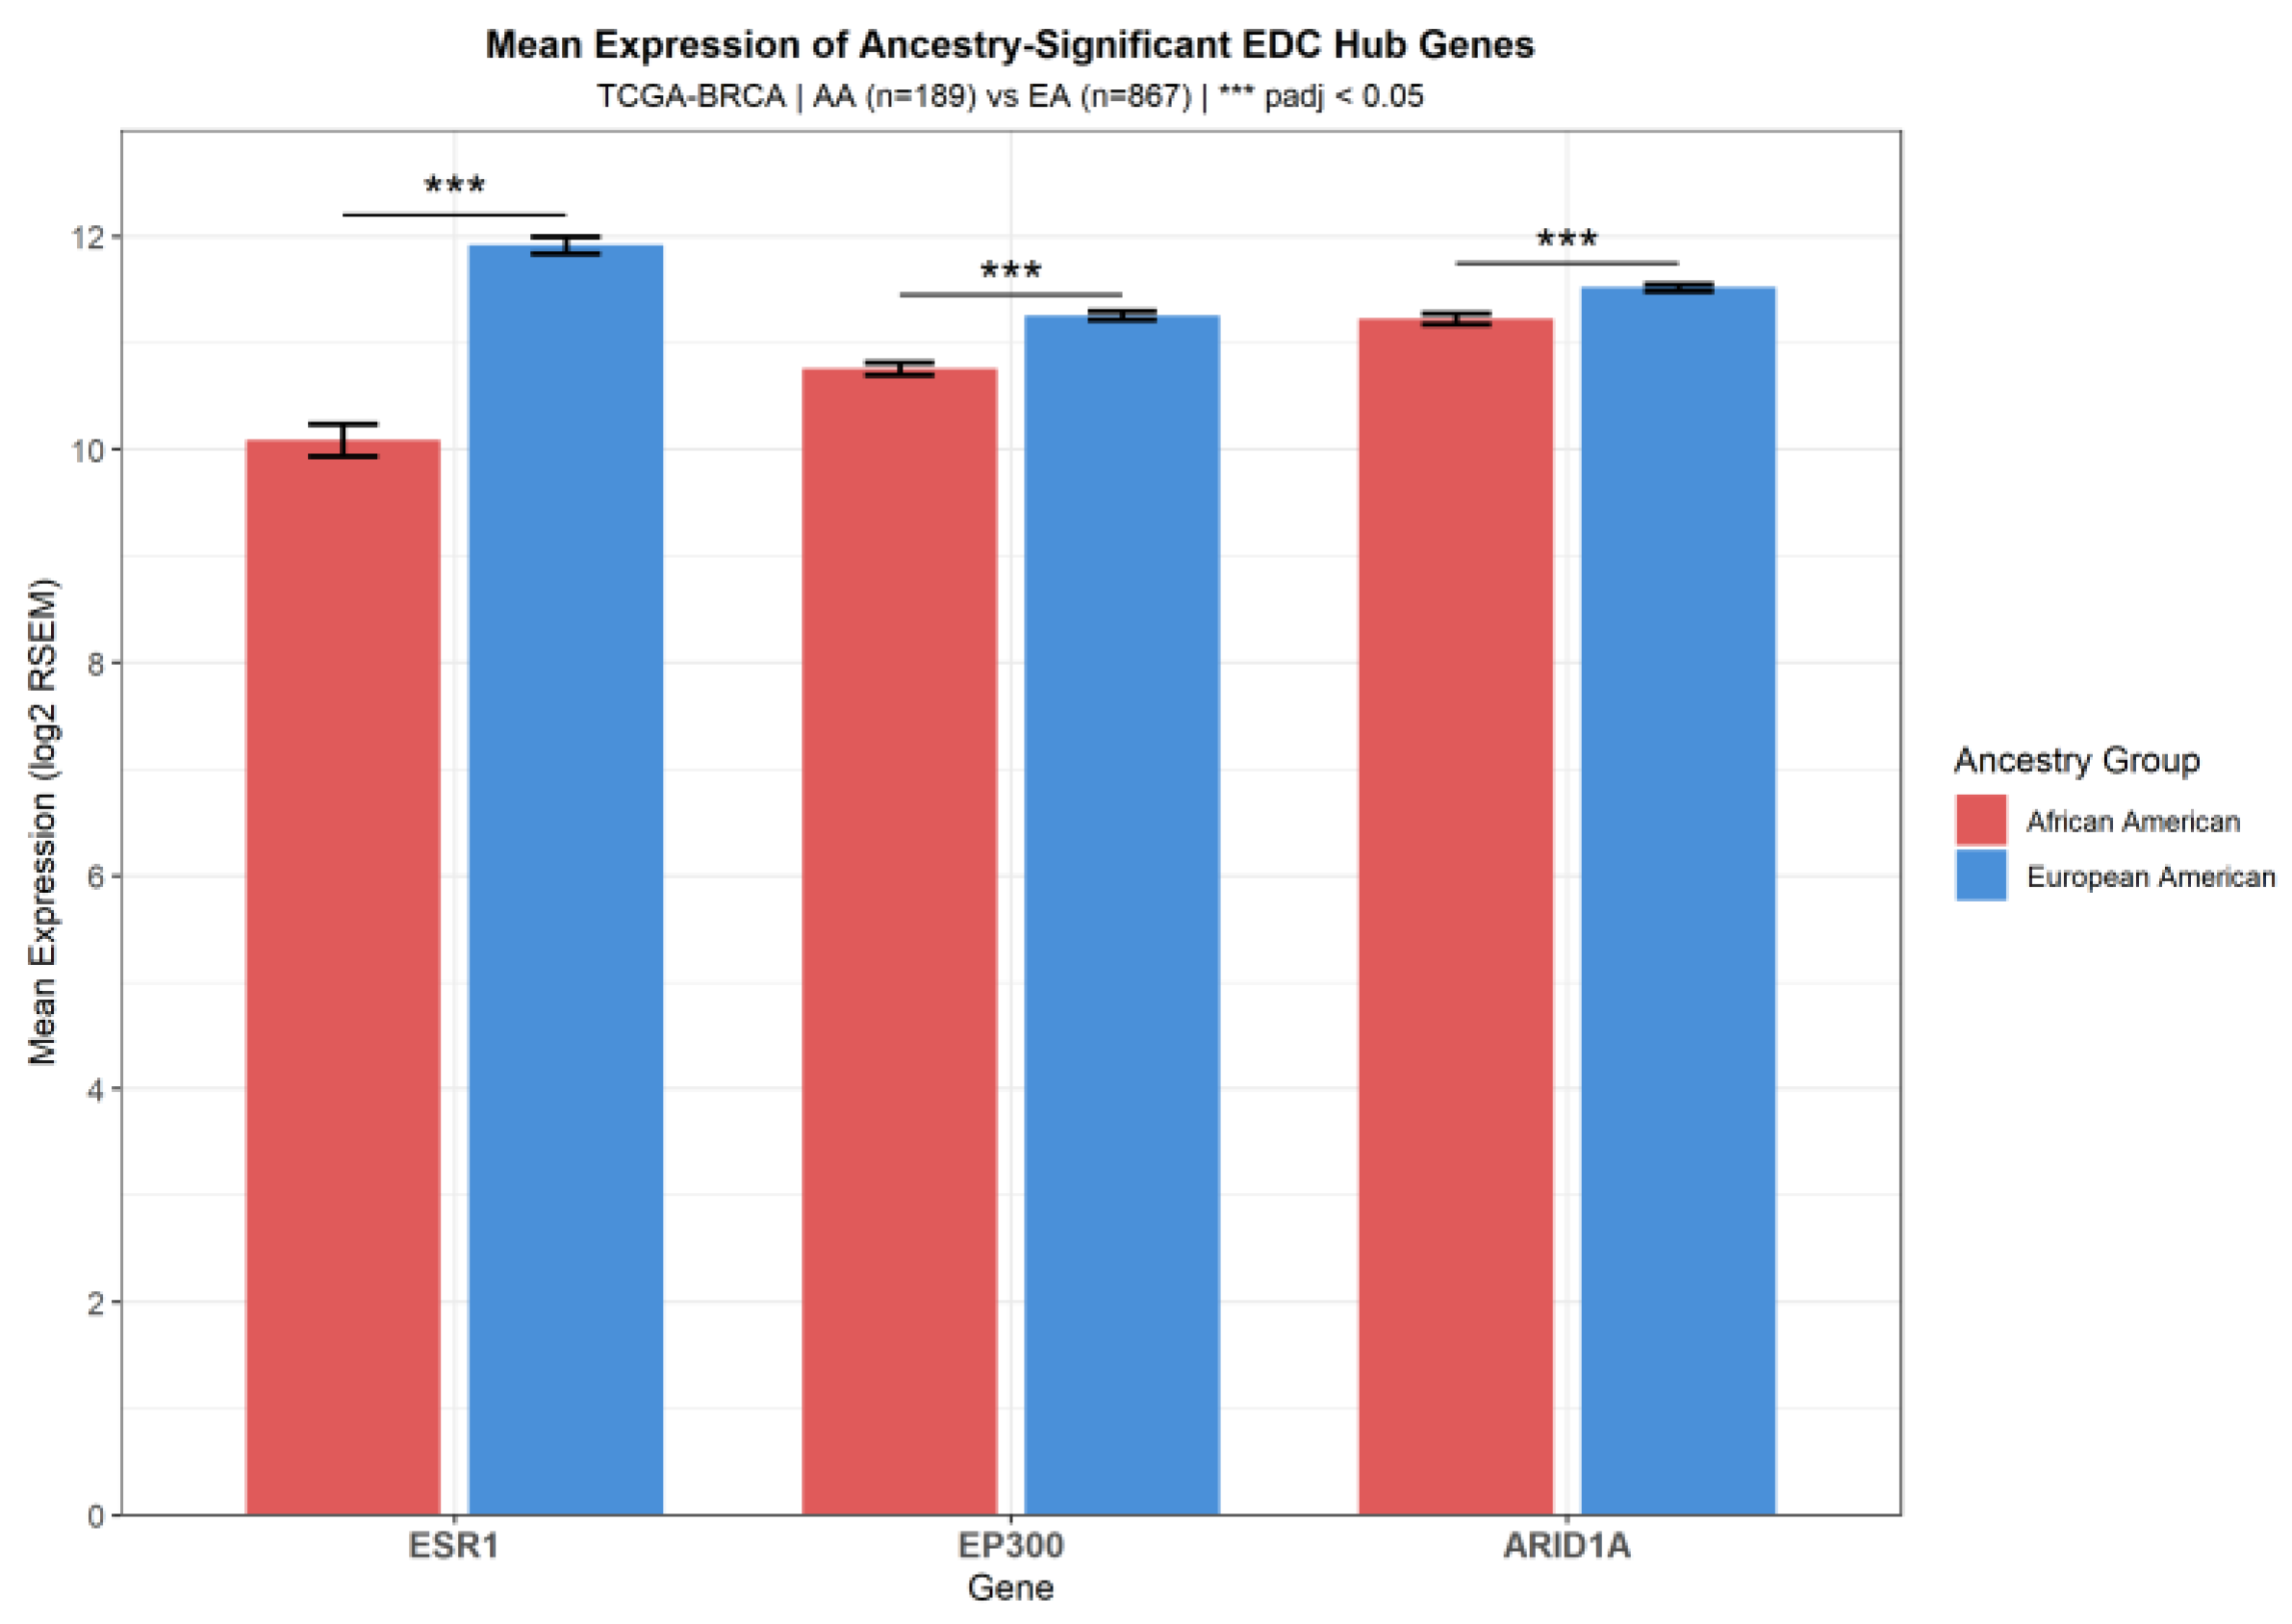
Figure 7.
Gene Ontology (GO) enrichment dot plot for the three ancestry-significant EDC hub genes (ESR1, EP300, and ARID1A), generated with the clusterProfiler R package. Dot size indicates gene count, and color indicates the adjusted p-value (red = most significant). The top enriched biological processes include transcription initiation at the RNA polymerase II promoter, DNA-templated transcription initiation, and chromatin remodeling. These findings align with the known roles of EP300 as a transcriptional coactivator and ARID1A as a chromatin remodeler. Response to estrogen is also enriched, reflecting ESR1’s role in estrogen signaling.
Figure 7.
Gene Ontology (GO) enrichment dot plot for the three ancestry-significant EDC hub genes (ESR1, EP300, and ARID1A), generated with the clusterProfiler R package. Dot size indicates gene count, and color indicates the adjusted p-value (red = most significant). The top enriched biological processes include transcription initiation at the RNA polymerase II promoter, DNA-templated transcription initiation, and chromatin remodeling. These findings align with the known roles of EP300 as a transcriptional coactivator and ARID1A as a chromatin remodeler. Response to estrogen is also enriched, reflecting ESR1’s role in estrogen signaling.
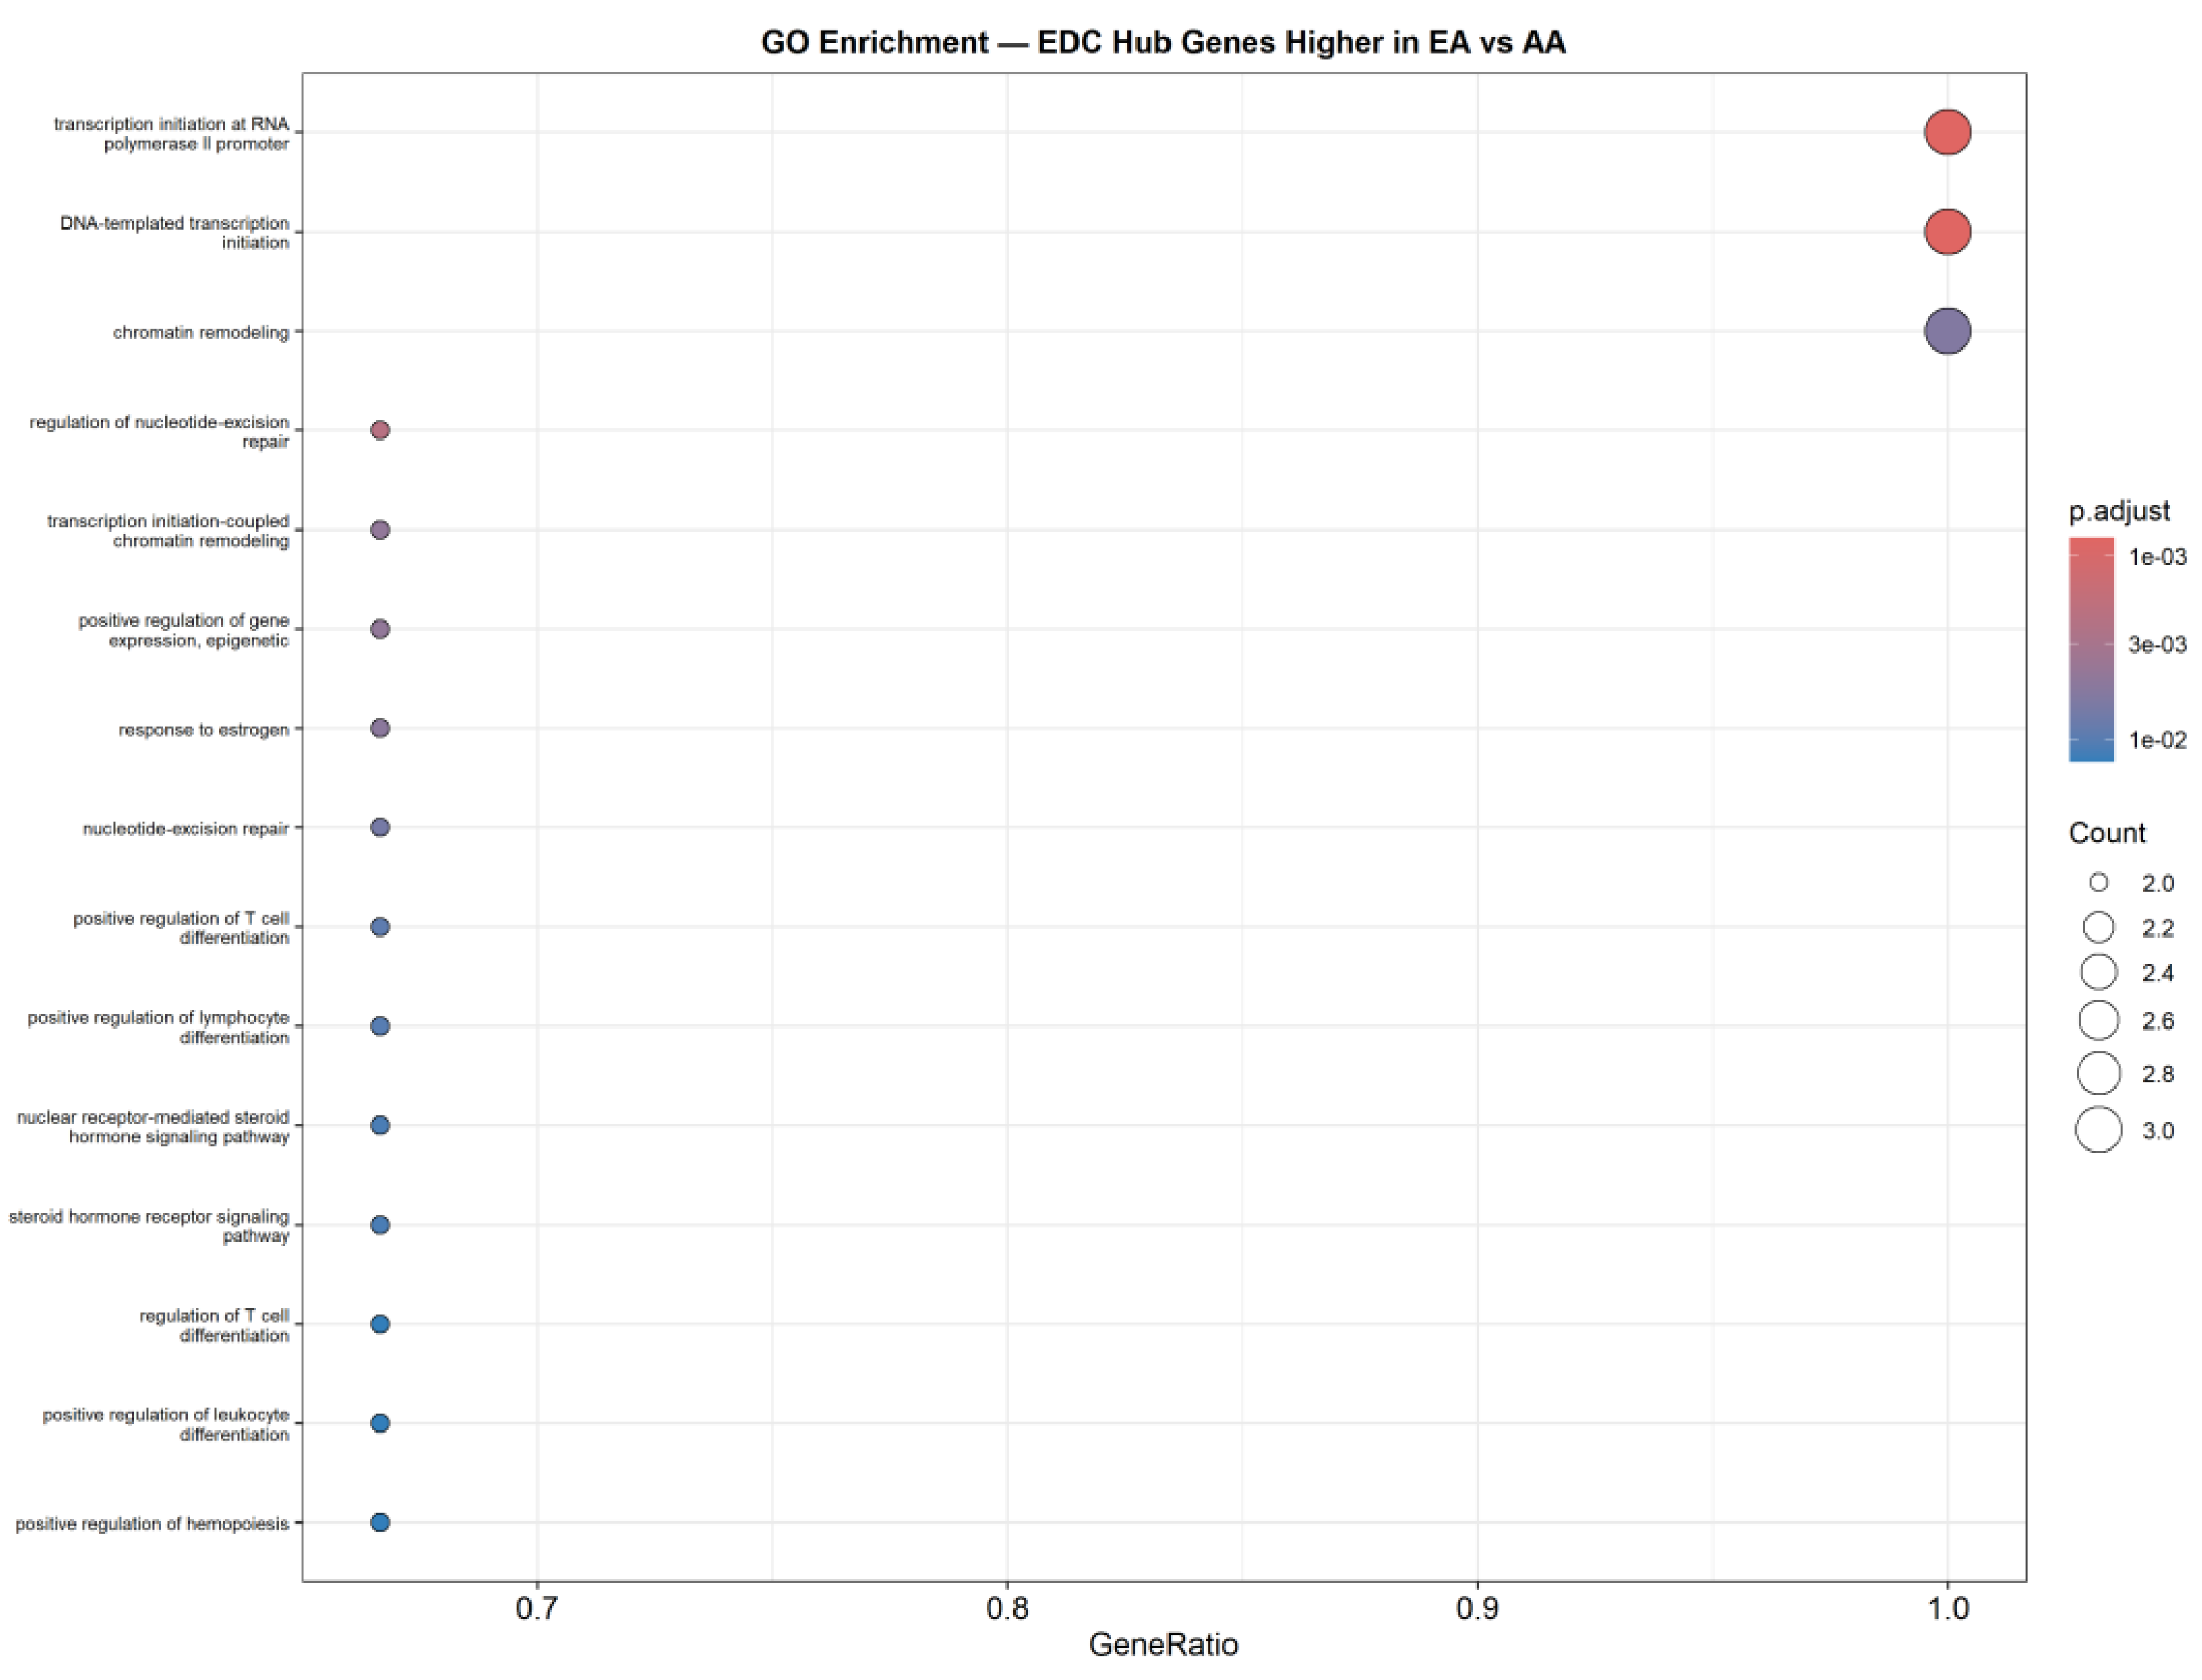
Figure 8.
KEGG pathway enrichment analysis of the three ancestry-significant EDC hub genes (ESR1, EP300, and ARID1A) in the TCGA-BRCA dataset. The x-axis shows –log10 (adjusted p-value), and the bars show the 15 KEGG pathways with the highest statistical significance. The red dashed vertical line marks the significance threshold (padj = 0.05). The thyroid hormone signaling pathway was the only statistically significant pathway identified (padj = 0.045; shown in green), consistent with the known role of TCDD and BPA in disrupting nuclear receptor signaling pathways shared by thyroid hormone and estrogen receptor biology. All other pathways were not statistically significant (padj > 0.05; shown in gray). Enrichment analysis was performed using the enrichKEGG() function in the clusterProfiler R package, with Benjamini-Hochberg false discovery rate correction.
Figure 8.
KEGG pathway enrichment analysis of the three ancestry-significant EDC hub genes (ESR1, EP300, and ARID1A) in the TCGA-BRCA dataset. The x-axis shows –log10 (adjusted p-value), and the bars show the 15 KEGG pathways with the highest statistical significance. The red dashed vertical line marks the significance threshold (padj = 0.05). The thyroid hormone signaling pathway was the only statistically significant pathway identified (padj = 0.045; shown in green), consistent with the known role of TCDD and BPA in disrupting nuclear receptor signaling pathways shared by thyroid hormone and estrogen receptor biology. All other pathways were not statistically significant (padj > 0.05; shown in gray). Enrichment analysis was performed using the enrichKEGG() function in the clusterProfiler R package, with Benjamini-Hochberg false discovery rate correction.
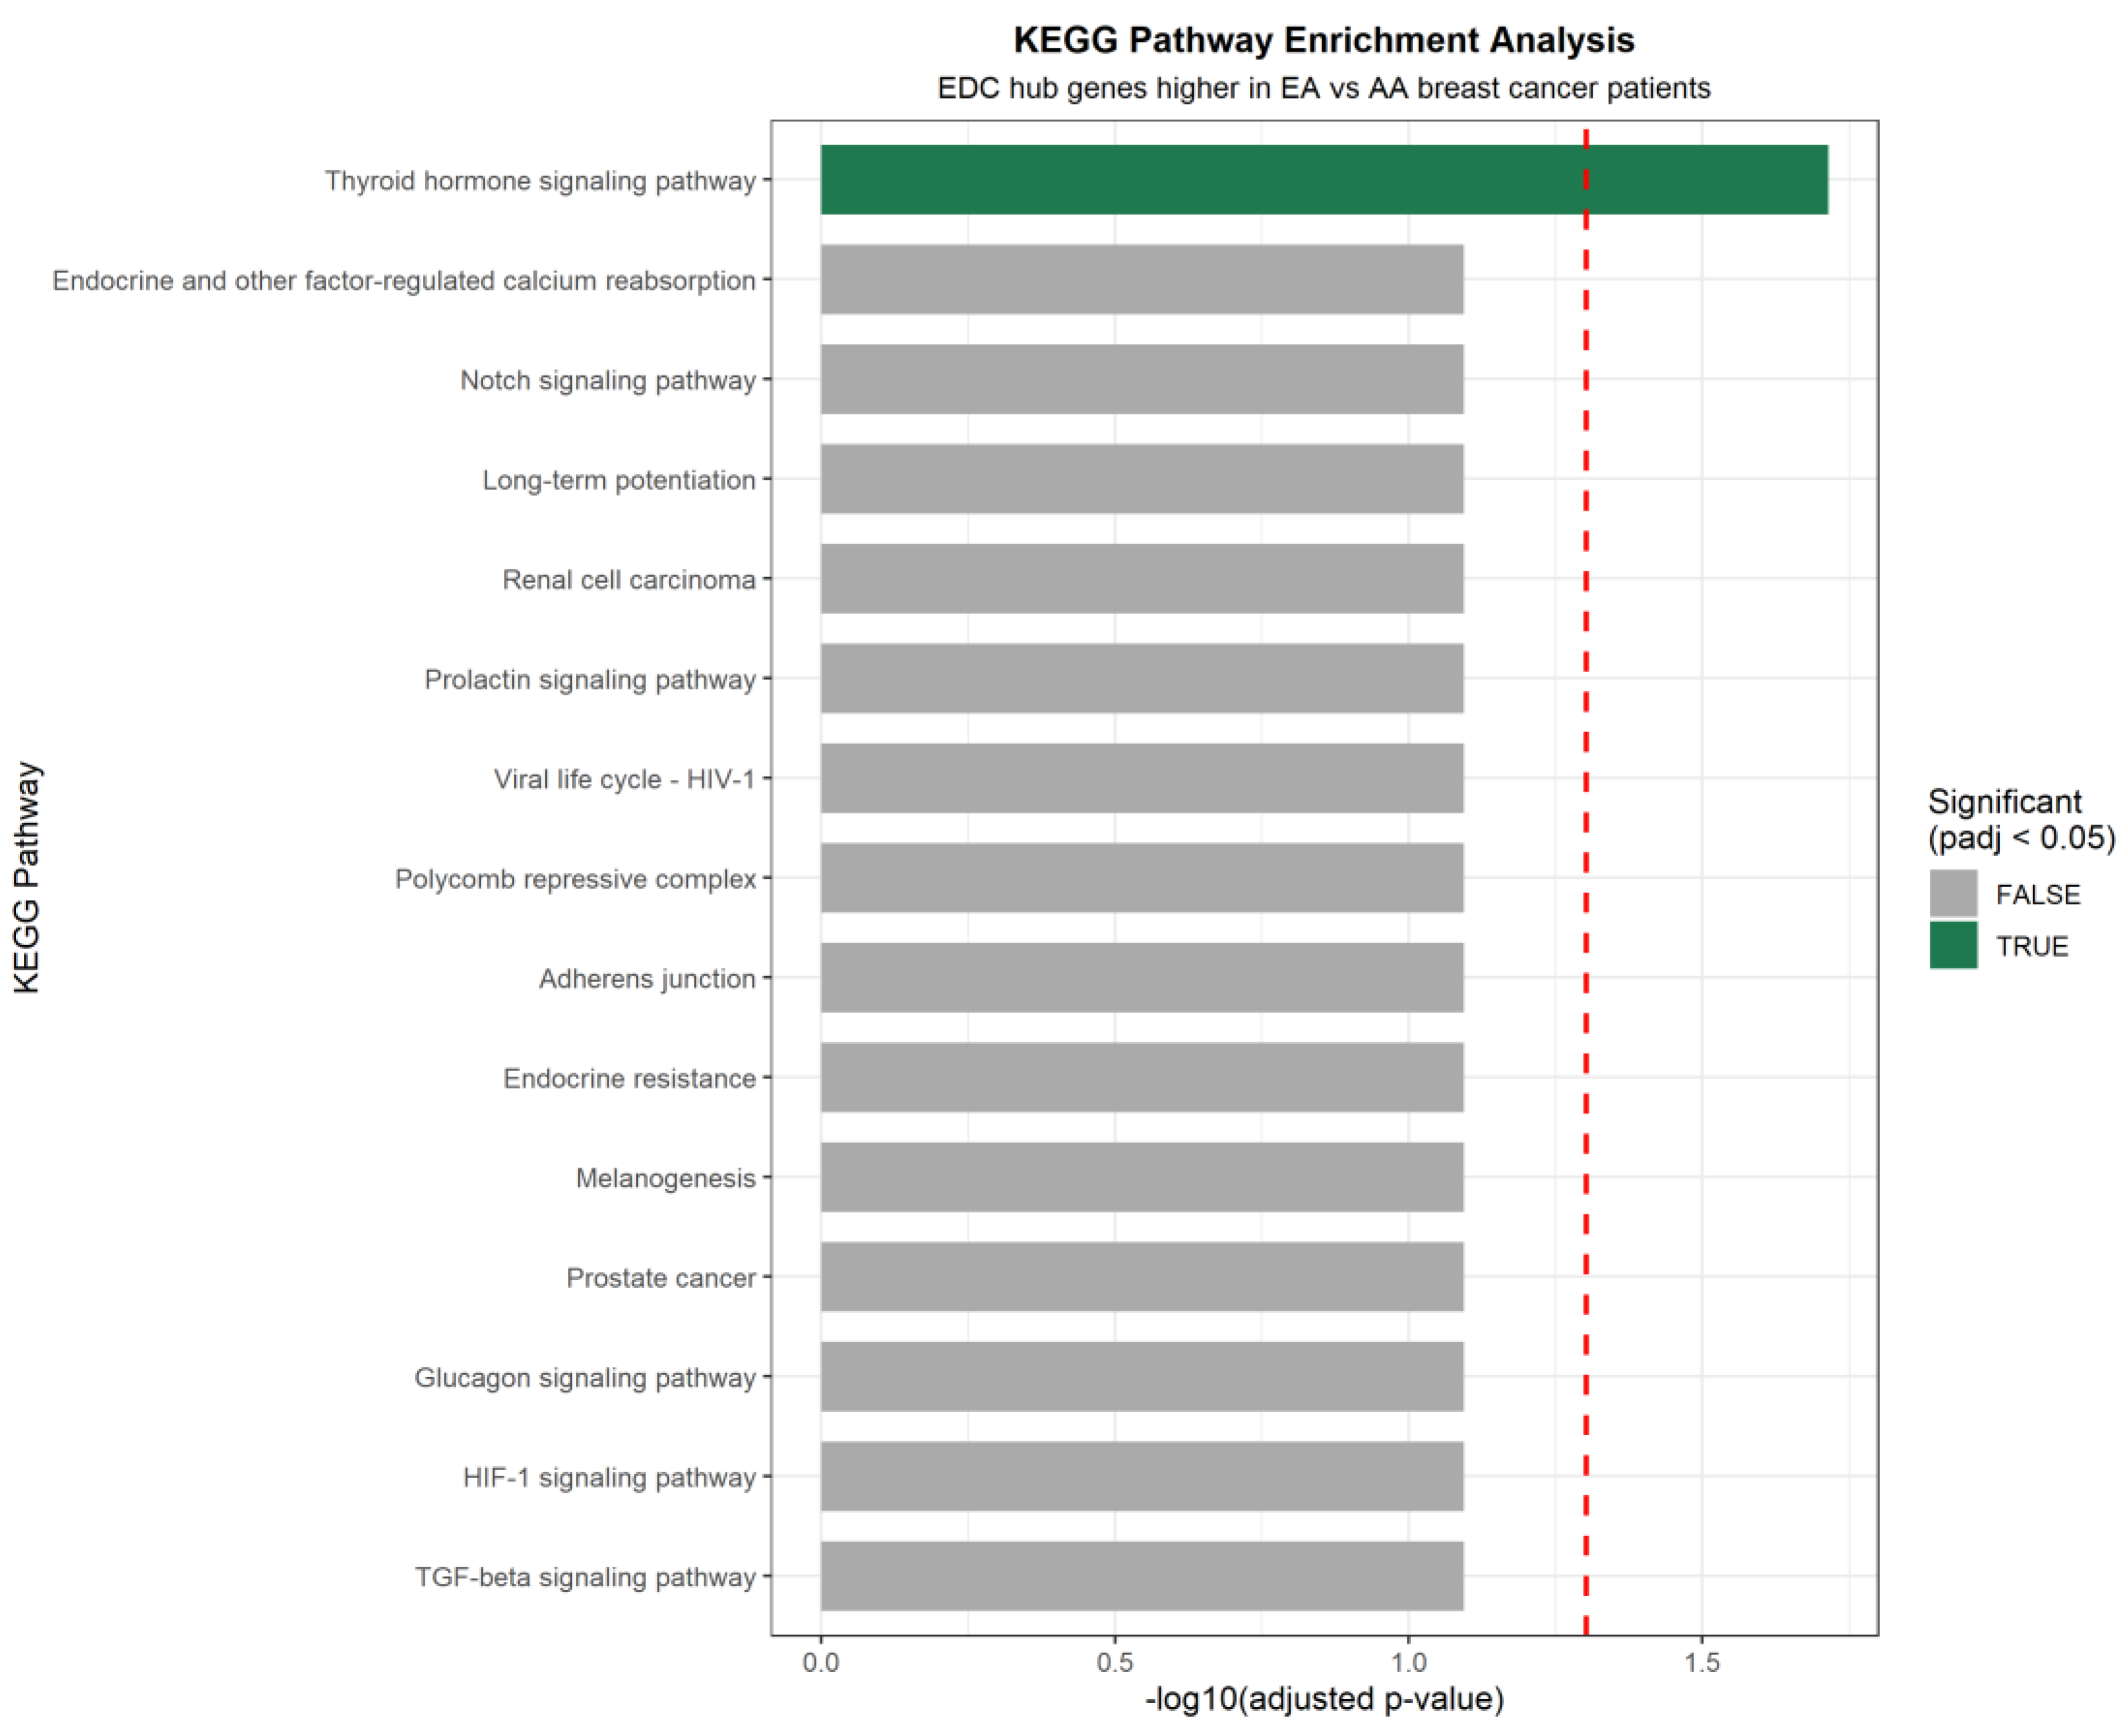
Figure 9.
Dot plot showing transcription factor (TF) regulatory relationships for the three ancestry-significant EDC hub genes (ESR1, EP300, and ARID1A), identified using the DoRothEA regulon database (confidence levels A, B, and C). Point color indicates regulatory mode (green = activator; red/pink = repressor), shape indicates DoRothEA confidence (circle = A; triangle = B; square = C), and size indicates TF status (large = EDC hub gene; small = non-hub). Notably, the top centrality hub, TP53, directly activates ESR1 with high confidence (level A).
Figure 9.
Dot plot showing transcription factor (TF) regulatory relationships for the three ancestry-significant EDC hub genes (ESR1, EP300, and ARID1A), identified using the DoRothEA regulon database (confidence levels A, B, and C). Point color indicates regulatory mode (green = activator; red/pink = repressor), shape indicates DoRothEA confidence (circle = A; triangle = B; square = C), and size indicates TF status (large = EDC hub gene; small = non-hub). Notably, the top centrality hub, TP53, directly activates ESR1 with high confidence (level A).
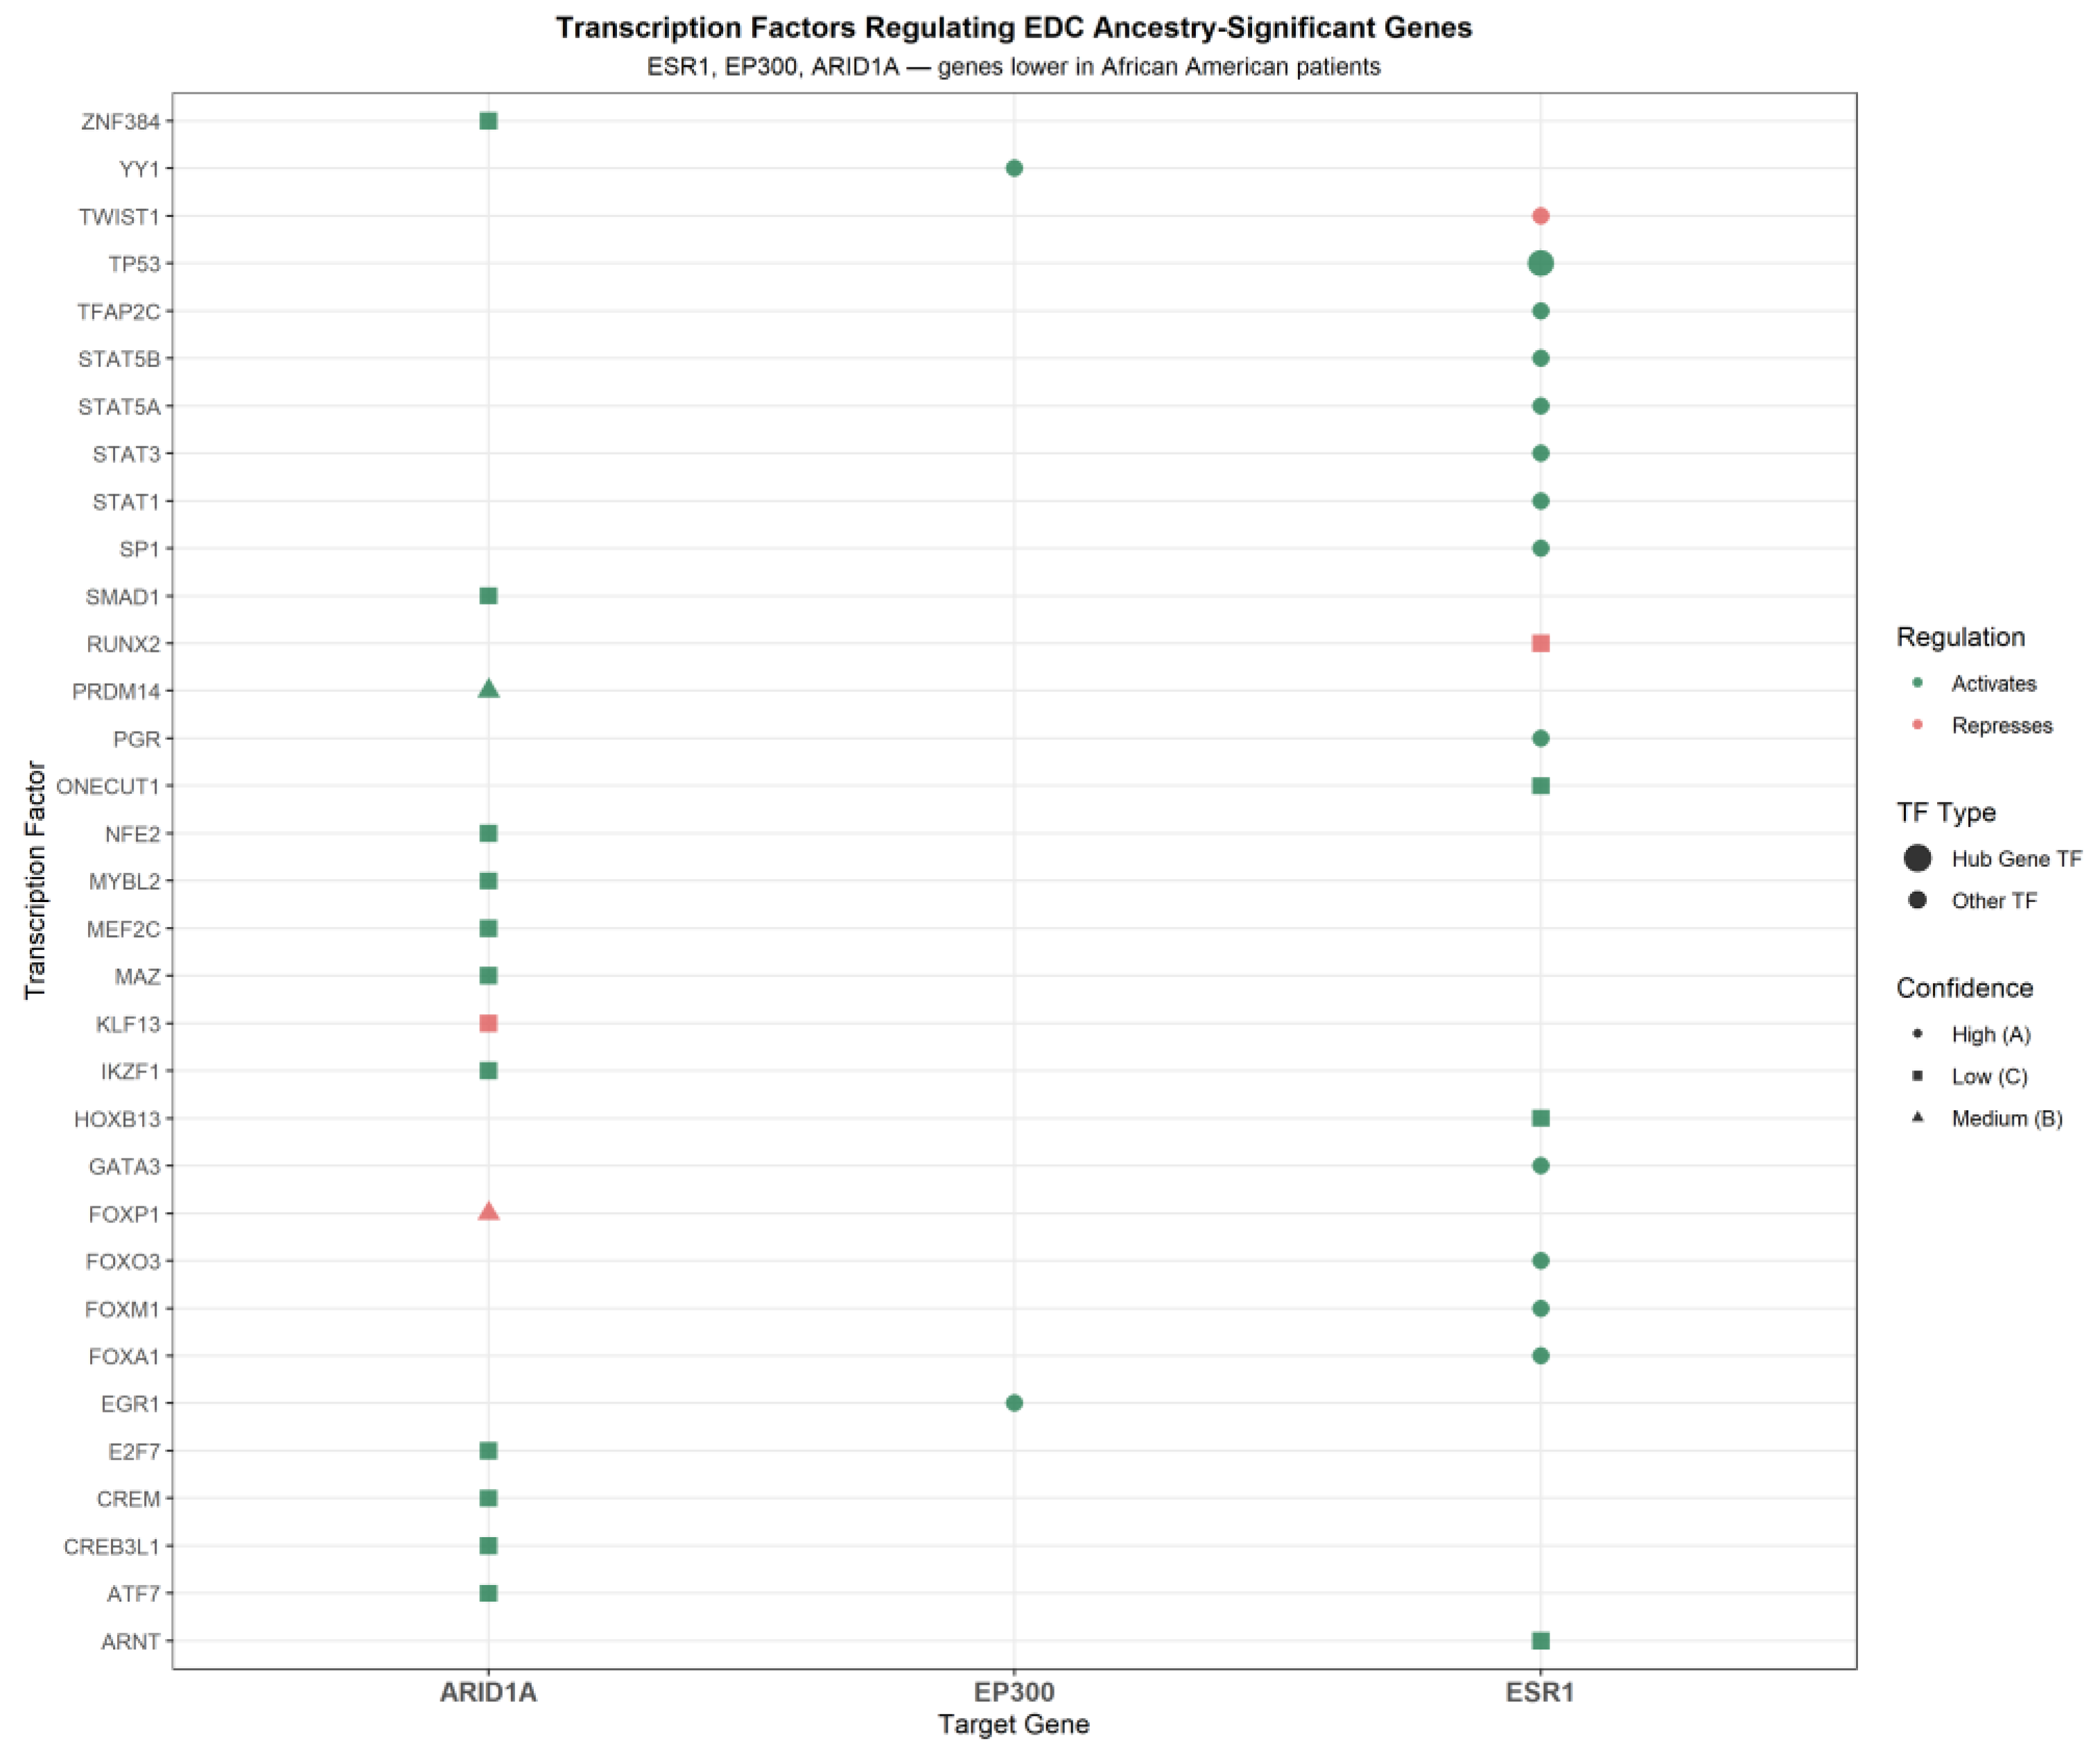
Figure 10.
Integration bubble plot summarizing findings from all analytical modules for the 10 EDC-associated hub genes. The x-axis ranks genes by network centrality (hub rank), while the y-axis shows -log10(adjusted p-value) from ancestry-stratified expression analysis. Bubble size indicates the number of pathogenic or likely pathogenic ClinVar variants, and color denotes ancestry significance (green = padj < 0.05; gray = not significant). The red dashed line marks the significance threshold (padj = 0.05). The annotated arrow shows the TP53→ESR1 transcriptional activation axis identified in Module 4, highlighting the key mechanistic connection in the hub gene network.
Figure 10.
Integration bubble plot summarizing findings from all analytical modules for the 10 EDC-associated hub genes. The x-axis ranks genes by network centrality (hub rank), while the y-axis shows -log10(adjusted p-value) from ancestry-stratified expression analysis. Bubble size indicates the number of pathogenic or likely pathogenic ClinVar variants, and color denotes ancestry significance (green = padj < 0.05; gray = not significant). The red dashed line marks the significance threshold (padj = 0.05). The annotated arrow shows the TP53→ESR1 transcriptional activation axis identified in Module 4, highlighting the key mechanistic connection in the hub gene network.
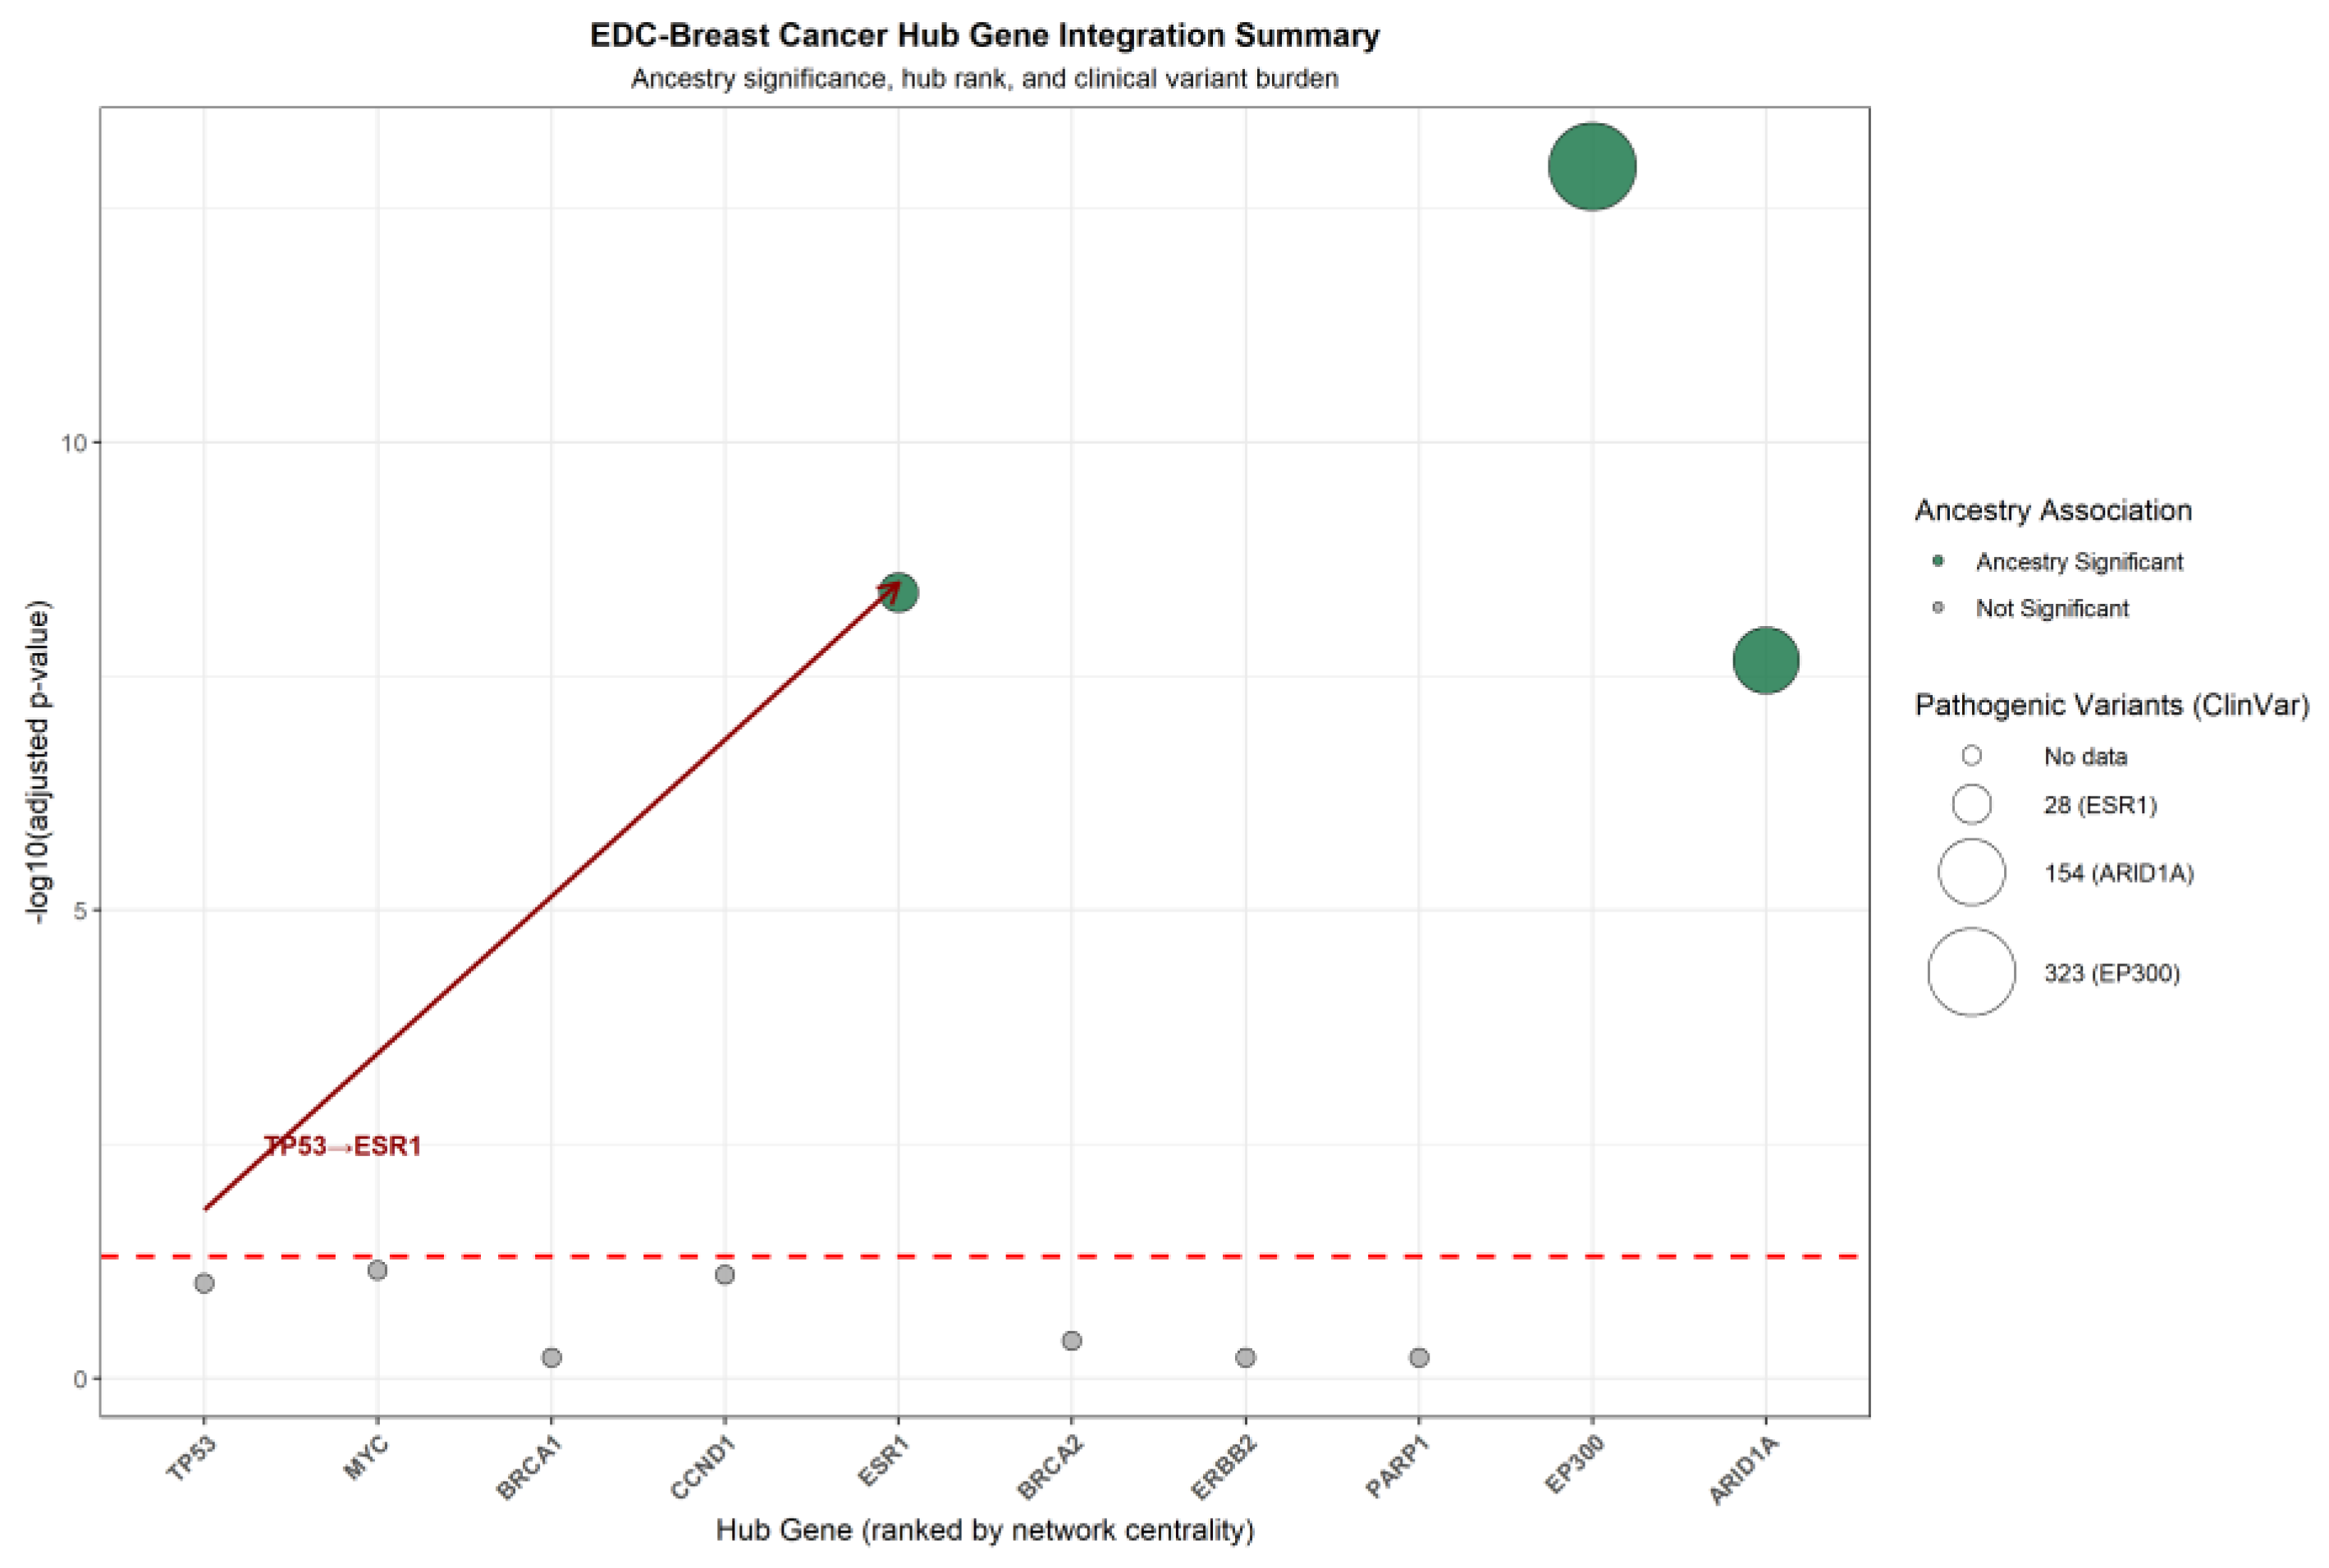

Table 1.
Ancestry-Stratified Differential Expression of EDC-Associated Hub Genes.
| Gene | Mean AA expression | Direction | Direction | Adjusted p-value | Significant |
|---|---|---|---|---|---|
| TP53 | 12.41 | 12.28 | Higher in AA | 0.0975 | No |
| MYC | 11.87 | 11.69 | Higher in AA | 0.0704 | No |
| BRCA1 | 10.23 | 10.31 | Higher in EA | 0.6078 | No |
| CCND1 | 11.54 | 11.72 | Higher in EA | 0.0785 | No |
| ESR1 | 10.09 | 11.92 | Higher in EA | 4.03 × 10⁻⁹ | Yes |
| BRCA2 | 10.45 | 10.52 | Higher in EA | 0.4002 | No |
| ERBB2 | 10.98 | 10.91 | Higher in AA | 0.6078 | No |
| PARP1 | 11.12 | 11.08 | Higher in AA | 0.6073 | No |
| EP300 | 10.76 | 11.26 | Higher in EA | 1.13 × 10⁻¹³ | Yes |
| ARID1A | 11.23 | 11.52 | Higher in EA | 2.14 × 10⁻⁸ | Yes |
Differential expression between African American (AA, n=189) and European American (EA, n=867) breast cancer patients was evaluated using the Wilcoxon rank-sum test, with Benjamini-Hochberg correction for the false discovery rate. Mean expression values are reported as log2-normalized RSEM counts.
Table 2.
Transcription Factor Regulatory Relationships for Ancestry-Significant EDC Hub Genes.
| Transcription factor | Target gene | Regulation | Confidence | Biological significance |
|---|---|---|---|---|
| TP53 | ESR1 | Activator | A (High) | Hub gene #1 directly activates ancestry-significant gene ESR1 |
| FOXA1 | ESR1 | Activator | A (High) | Pioneer TF for estrogen signaling; known BPA transcriptional target |
| FOXM1 | ESR1 | Activator | A (High) | Promotes estrogen receptor expression in luminal breast cancer |
| FOXO3 | ESR1 | Activator | A (High) | Tumor suppressor; regulates ESR1 in hormone-responsive breast cancer |
| GATA3 | ESR1 | Activator | A (High) | Master regulator of luminal breast cancer subtype |
| PGR | ESR1 | Activator | A (High) | Progesterone receptor; co-regulates with ESR1 in breast tissue |
| SP1 | ESR1 | Activator | A (High) | Transcriptional activator of ESR1 promoter |
| STAT1 | ESR1 | Activator | A (High) | Immune-inflammatory signaling intersects with estrogen receptor regulation |
| STAT3 | ESR1 | Activator | A (High) | Immune-inflammatory signaling intersects with estrogen receptor regulation |
| STAT5A | ESR1 | Activator | A (High) | Prolactin/JAK-STAT signaling activates ESR1 in breast tissue |
| STAT5B | ESR1 | Activator | A (High) | Prolactin/JAK-STAT signaling activates ESR1 in breast tissue |
| TFAP2C | ESR1 | Activator | A (High) | AP-2γ transcription factor; required for ESR1 expression in luminal BC |
| TWIST1 | ESR1 | Repressor | A (High) | Associated with ER-negative aggressive breast cancer phenotype |
| ARNT | ESR1 | Activator | C (Low) | AhR nuclear translocator; mediates TCDD effects on ESR1 |
| HOXB13 | ESR1 | Activator | C (Low) | Homeobox TF; regulates ESR1 in hormone-responsive cancer |
| ONECUT1 | ESR1 | Activator | C (Low) | Hepatocyte nuclear factor; modulates estrogen signaling |
| RUNX2 | ESR1 | Repressor | C (Low) | Associated with aggressive breast cancer subtypes |
| EGR1 | EP300 | Activator | A (High) | High-confidence activator of EP300 transcriptional coactivator |
| YY1 | EP300 | Activator | A (High) | High-confidence activator of EP300; regulates chromatin accessibility |
| FOXP1 | ARID1A | Repressor | B (Medium) | Medium-confidence repressor of ARID1A chromatin remodeler |
| PRDM14 | ARID1A | Activator | B (Medium) | Medium-confidence activator of ARID1A in stem cell contexts |
| ATF7 | ARID1A | Activator | C (Low) | Stress-responsive TF; regulates ARID1A chromatin remodeling |
| CREB3L1 | ARID1A | Activator | C (Low) | ER stress-responsive TF regulating ARID1A |
| CREM | ARID1A | Activator | C (Low) | cAMP-responsive element modulator; regulates ARID1A |
| E2F7 | ARID1A | Activator | C (Low) | Cell cycle TF; regulates ARID1A in proliferating cells |
| IKZF1 | ARID1A | Activator | C (Low) | Ikaros family zinc finger; regulates ARID1A in immune contexts |
| KLF13 | ARID1A | Repressor | C (Low) | Krüppel-like factor; represses ARID1A expression |
| MAZ | ARID1A | Activator | C (Low) | MYC-associated zinc finger; regulates ARID1A transcription |
| MEF2C | ARID1A | Activator | C (Low) | Myocyte enhancer factor; regulates ARID1A in differentiation |
| MYBL2 | ARID1A | Activator | C (Low) | Cell cycle TF; regulates ARID1A in proliferating cells |
| NFE2 | ARID1A | Activator | C (Low) | NF-E2 TF; regulates ARID1A in hematopoietic contexts |
| SMAD1 | ARID1A | Activator | C (Low) | BMP signaling mediator; regulates ARID1A chromatin remodeling |
| ZNF384 | ARID1A | Activator | C (Low) | Zinc finger TF; regulates ARID1A expression |
Transcription factor-target gene regulatory relationships were retrieved from the DoRothEA database and filtered by confidence levels A (highest), B (medium), and C (low). Mode of regulation: Activator = positive regulation (mor = +1); Repressor = negative regulation (mor = −1). Green row = intra-network hub gene regulatory connection (TP53→ESR1). TF = transcription factor; BC = breast cancer; BPA = bisphenol A; TCDD = 2,3,7,8-tetrachlorodibenzo-p-dioxin; ER = estrogen receptor.
Table 3.
Transcription Factor Regulatory Relationships for Ancestry-Significant EDC Hub Genes.
| Category | ESR1 | EP300 | ARID1A | Notes |
|---|---|---|---|---|
| Total variants | 260 | 2,446 | 1,953 | All germline variants in ClinVar |
| Pathogenic | 25 | 200 | 94 | Confirmed disease-causing variants |
| Likely pathogenic | 3 | 123 | 60 | Probable disease-causing variants |
| Pathogenic + likely pathogenic | 28 | 323 | 154 | Combined clinical burden |
| Uncertain significance | 91 | -- | -- | Variants of unknown clinical impact |
| Benign/likely benign | 121 | -- | -- | Non-disease-causing variants |
| Most common variant type | SNV (214) | SNV (2,115) | SNV (1,750) | Single nucleotide variants predominate |
| Most common consequence | Missense / UTR (101 each) | Missense (1,198) | Missense (1,047) | Amino acid changing variants most common |
| Breast cancer associated | Yes – familial breast cancer | Yes – hereditary breast/ovarian | Yes – indirect (3 variants) | Condition labels from ClinVar submissions |
| GTEx breast mammary eQTLs | None significant | Not queried | Not queried | No germline variants regulating expression in breast tissue |
Germline variant data were retrieved from the NCBI ClinVar database (accessed July 2026). SNV = single-nucleotide variant; UTR = untranslated region; eQTL = expression quantitative trait locus; GTEx = Genotype-Tissue Expression portal. The green row represents the combined pathogenic burden (the most clinically relevant metric). EP300 carries 11x more pathogenic variants than ESR1. Dashes (—) indicate data not systematically recorded for that gene.
Disclaimer/Publisher’s Note: The statements, opinions and data contained in all publications are solely those of the individual author(s) and contributor(s) and not of MDPI and/or the editor(s). MDPI and/or the editor(s) disclaim responsibility for any injury to people or property resulting from any ideas, methods, instructions or products referred to in the content. |
© 2026 by the authors. Licensee MDPI, Basel, Switzerland. This article is an open access article distributed under the terms and conditions of the Creative Commons Attribution (CC BY) license (http://creativecommons.org/licenses/by/4.0/).
Copyright: This open access article is published under a Creative Commons CC BY 4.0 license, which permit the free download, distribution, and reuse, provided that the author and preprint are cited in any reuse.