

Submitted:
13 November 2026
Posted:
16 November 2026
You are already at the latest version
Abstract
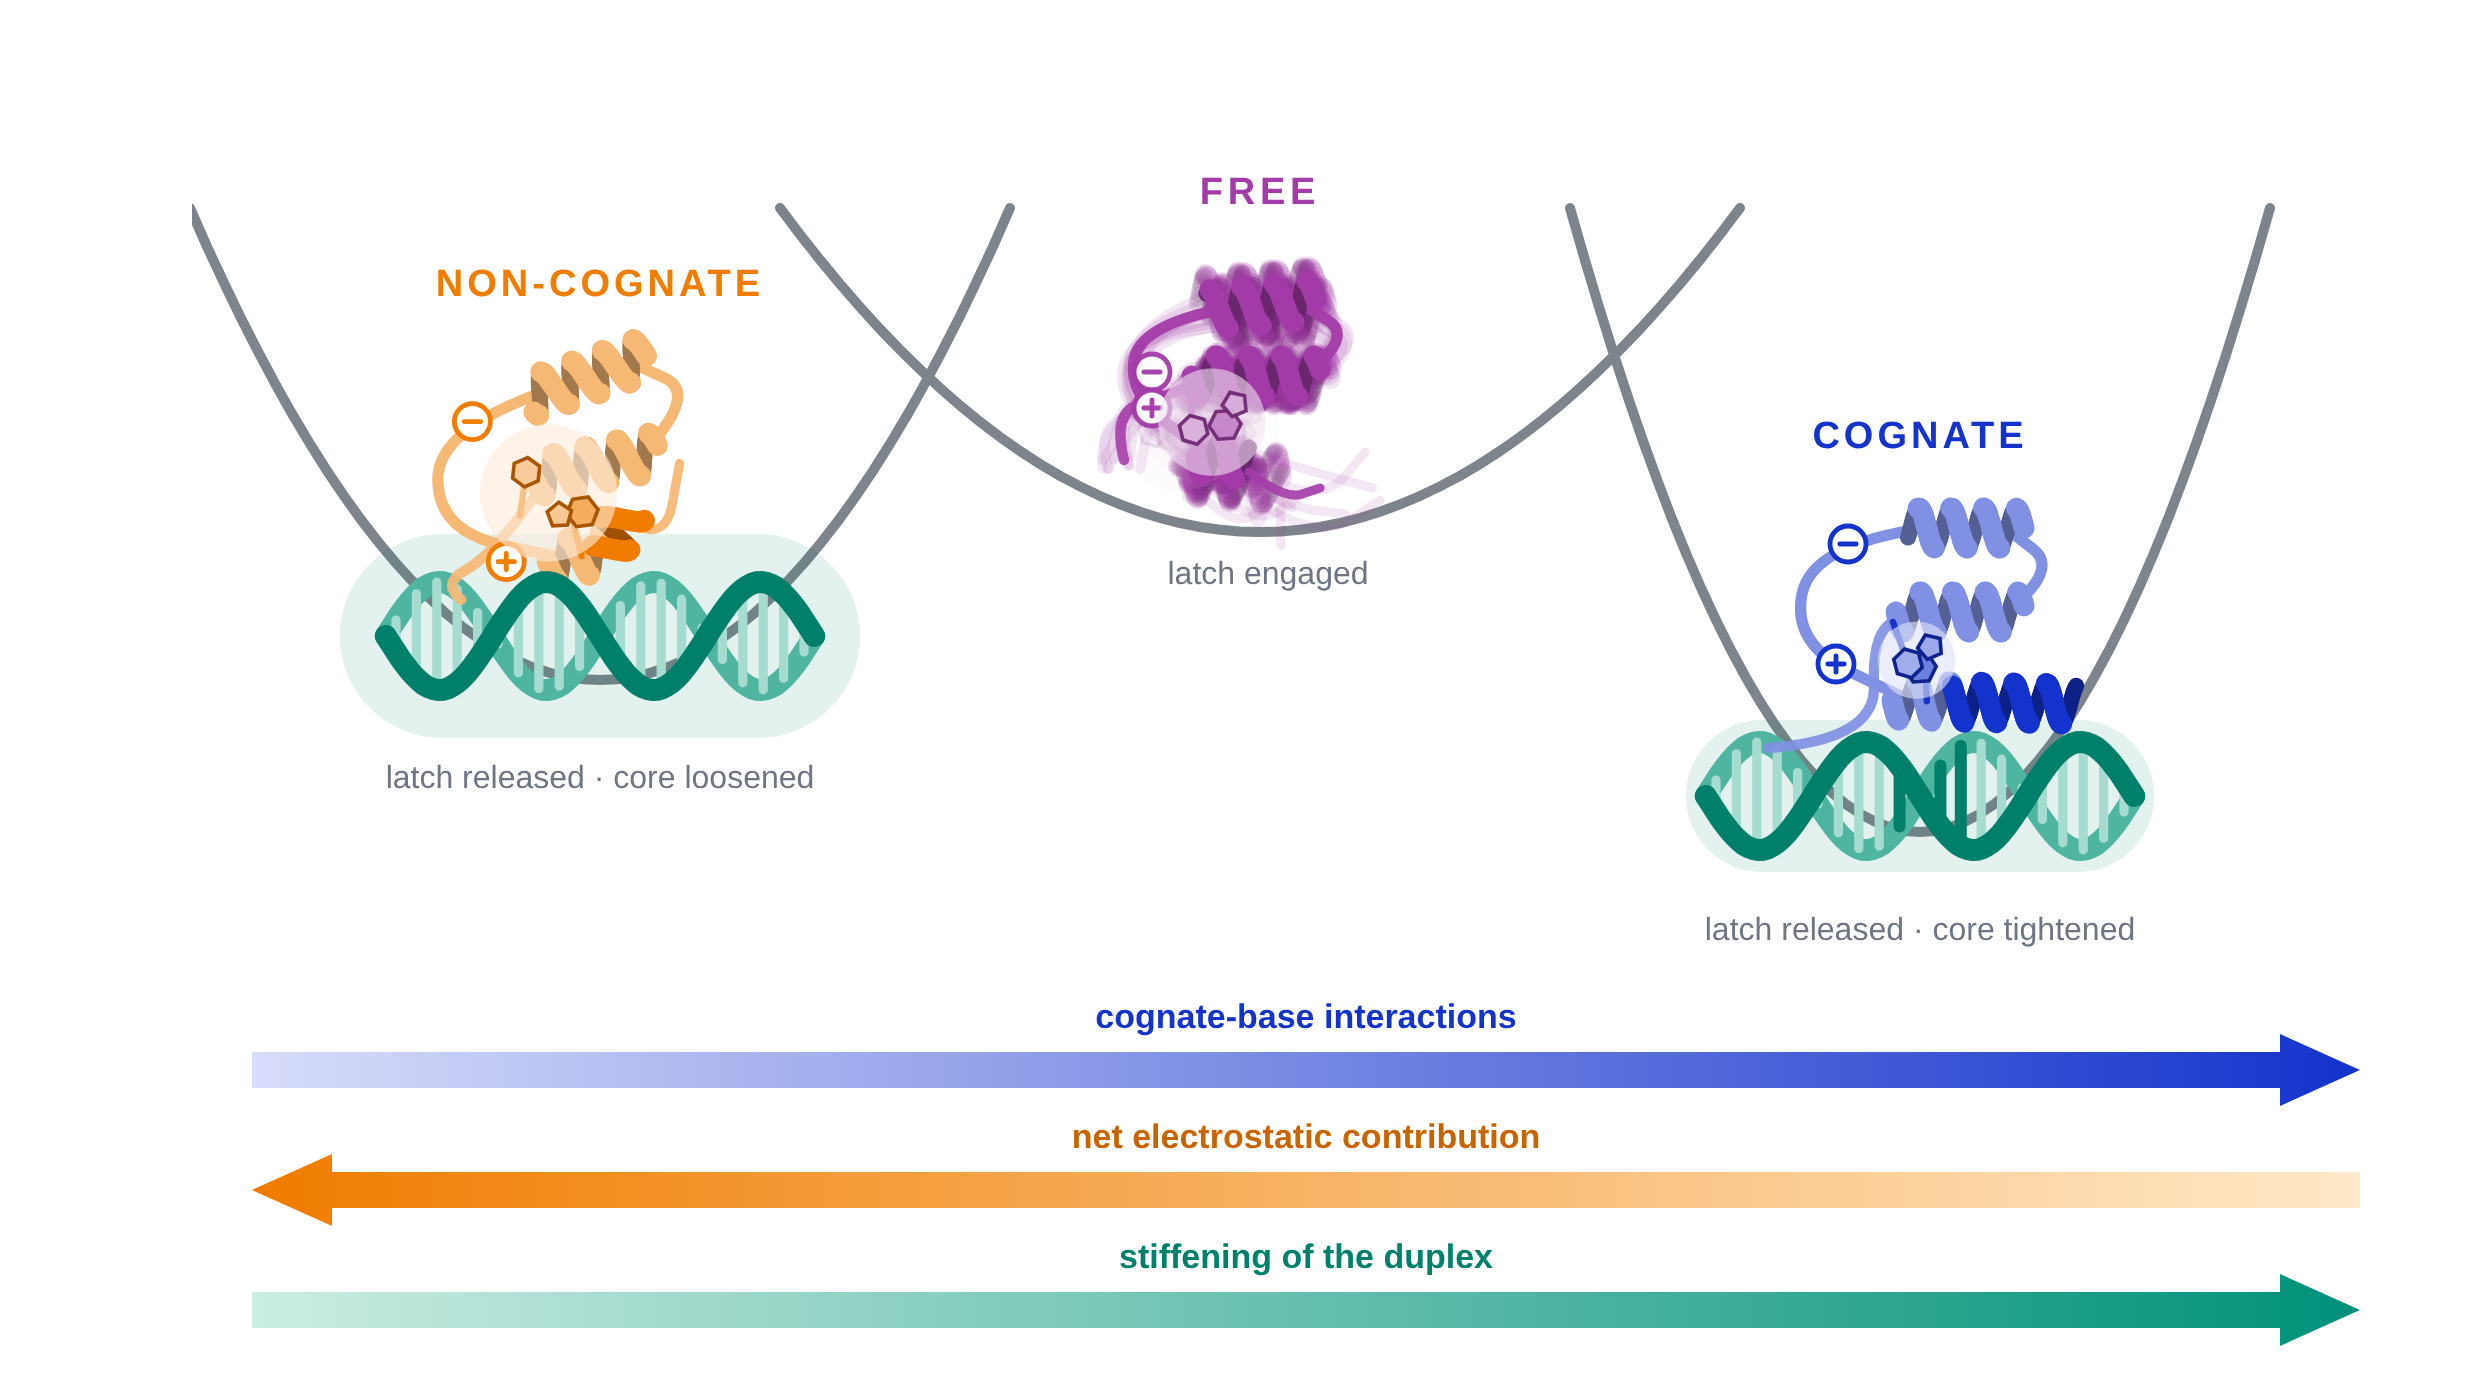
Homeodomains, the DNA-binding domains of eukaryotic transcription factors directing developmental programs, all bind very similar TAAT-based sequences, yet the factors carrying them regulate hundreds of genes. We showed previously that the engrailed homeodomain uses a promiscuous recognition code that grades DNA along a ladder of affinities, and that it changes conformation on binding its cognate motif, in a transition released by a built-in electrostatic spring-loaded latch. Whether the latch is reserved for cognate signals was untested. Here, by NMR and circular dichroism, we compare the responses of domain and DNA at both ends of that ladder: the cognate duplex and a duplex designed with minimal cognate similarity. We find that the latch releases on non-cognate DNA, in a pattern consistent with conformational rheostat operation. The domain also stiffens both duplexes without reshaping them, by an amount scaled with the association strength. Amide chemical shifts indicate that the non-cognate complex is distinct, with the interface held through charge, only part of the base reading segment retained, the C-terminal end of helix 3 unstructured, and the core repacked in the opposite direction. Sequence thus sets the extent and nature of the protein response, which could let a promiscuous factor scan without stalling while remaining localized at its regulatory regions.
Keywords:
engrailed homeodomain
; protein–DNA recognition
; DNA-binding specificity
; nuclear magnetic resonance
; circular dichroism
; DNA flexibility
; downhill folding
; electrostatic spring-loaded latch
; conformational rheostat
; molecular oscillator
1. Introduction
The engrailed homeodomain (enHD) is the structural paradigm of the homeodomain family of DNA binding domains from eukaryotic transcription factors (ETFs). Homeodomain-bearing ETFs control entire developmental programs across eukaryotes, and are especially prominent in metazoans [1]. The enHD–DNA complex was the first homeodomain complex to be solved [2] and remains among the most finely characterized [3]. It displays the architecture shared across the family: a three-helix bundle that docks on DNA through a helix-turn-helix unit, inserting its third helix, conventionally called the recognition helix, into the major groove and an N-terminal arm into the adjacent minor groove, with sugar–phosphate backbone contacts conserved throughout the family holding the arrangement in place [4]. In the crystal the duplex stays in essentially canonical B-form and the protein is unchanged by binding, so their recognition has usually been understood as a lock-and-key event. That picture sits awkwardly with the functional diversity of the family, whose members all bind AT-rich sequences built around a TAAT core. Homeodomains are, in that sense, a textbook case of the specificity paradox [5].
The specificity paradox follows from the way ETFs work compared to prokaryotic systems. In the canonical bacterial operon control resides locally, in the occupancy of one or a few operators on a compact and largely naked genome. In eukaryotes it is distributed over regulatory regions that may lie far from the gene, are read combinatorially by many factors, and are dynamically packaged into chromatin [6,7]. The recognition problem begins with a mismatch of scale: ETFs read sequences of 6 to 10 base pairs [8,9] within genomes of billions, and the regions they control are long and densely populated with clusters of imperfect copies of the cognate motifs of a certain factors [10,11]. Those degenerate signals are not incidental to function. They confer specificity in developmental enhancers, where perfect matches to the consensus drive strong but ectopic expression [12,13]. Such clusters of partial repeats can operate as antennas that hold the factor near its target genes by exchange among many weaker sites [14]. EnHD exemplifies the whole picture. Its code is massively promiscuous, distinguishing sites along a ladder of affinities rather than as cognate against the rest [15]; the regulatory regions of its target genes carry long tracts of degenerate repeats that serve as such antennas [14]; and it binds nucleosomes with enhanced affinity relative to naked DNA [16]. It thus performs both of the tasks expected of DNA binding domains of pioneer-like ETFs.
How a domain carrying such a degenerate code finds its targets has become clearer in recent years. EnHD must do so without a clamping interface, the feature that allows other scanning proteins to hold onto the DNA and search by efficient sliding, and single-molecule experiments have shown that it succeeds nonetheless: it scans naked DNA about 200,000-fold faster than a continuous promiscuous slide would allow, alternating local sweeps of a few hundred base pairs with stochastic redeployments elsewhere in the region [16]. A promiscuous binder should be stalled by the many partial cognate sites it meets, above all within the tracts of partial repeats, but it is not. The explanation may lie in its folding properties. EnHD is a marginally stable domain that folds ultrafast [17] with the kinetic properties of a reaction that crosses a minimal free-energy barrier [18], a behavior described as downhill folding. The marginal stability is in part the price of function, since the positive charge the domain needs to bind DNA destabilizes the overall fold [19]. These properties carry functional implications because downhill folders lose and gain structure gradually, which allows them to track inputs conformationally in an analog fashion and hence operate as rheostats [20]. Furthermore, it has been recently noted that a domain that alternates quickly between the downhill and two-state folding regimes could sit at the core of a molecular oscillator, choreographing binding events to several partners without consuming chemical energy [21]. EnHD has been proposed to work as a molecular oscillator of such kind in searching the genome, alternating between a scanning mode and a recognition mode with the degenerate repeats of the antennas sustaining the alternation [22]. Significantly, a fundamental conformational mechanism is already known in this domain: a built-in electrostatic spring-loaded latch that changes the conformational ensemble on binding the cognate site [23], and which operates between 45 and 300 mM, a range covering physiological conditions [24].
Every one of the mechanistic proposals outlined above rests on one premise that remains unverified: that the conformational response of enHD to DNA is sequence-dependent, in which case duplexes bearing less resemblance to the cognate motif could elicit correspondingly differential responses from the domain. What has been recently measured is the response of enHD to the cognate site alone, against the free protein. Nonspecific DNA binding by homeodomains have been examined before. NMR studies of the HoxD9 homeodomain on nonspecific DNA indicate that it binds with the same mode and register as in its specific complex [25,26], and the nonspecific mode of the Meis1 homeodomain has also been characterized [27]. Those experiments resolve the binding mode in the absence of a cognate signal, but they do not address whether the conformational ensemble of the domain responds to what it is bound to.
Here we use NMR and circular dichroism to compare directly the response of enHD, and also of the DNA itself, to the two extremes of its promiscuous recognition code: the cognate motif, and a DNA of the same length with minimal cognate similarity. We use amide chemical shift perturbations, which report on interactions and on backbone conformation, to resolve the protein response residue by residue, and thus weigh the binding mode against the conformational change. These two DNA duplexes bracket the ladder of affinities that enHD encounters in vivo, and therefore set the limits on the response to any sequence in between. The question at issue is whether a sequence with minimal recognition determinants elicits no response at all, the cognate response attenuated, or a different response altogether, and which parts of the domain account for the difference.
2. Results
2.1. Delimiting the Extremes of the DNA Binding Affinity Spectrum of enHD
Given the extremely promiscuous nature of DNA recognition by enHD [14], we delimited our study to DNA sequences sitting at the two ends of its affinity spectrum. We defined the high-affinity end by using the same 21 bp DNA duplex of the earlier crystallographic and NMR studies [2,3,23], which carries a single palindromic TAATTA motif, binds with low nanomolar affinity at moderate ionic strength, and permits direct comparison with the earlier work. For the low-affinity end we designed a 21 bp sequence using the statistical mechanical model of enHD–DNA binding developed previously [14]. This model computes the binding free energy of the domain for an arbitrary DNA sequence from its similarity to the recognition logo at every register. Particularly, we searched for a DNA sequence of minimal predicted affinity, which required eliminating A·T-rich tracts and any repeat of those bases capable of reconstituting part of the TAATTA motif at any register. The selected duplex, 5′-CCGTGTCCGTGTCCGTGTCCC-3′, is 71% G·C, against 29% G·C for the cognate duplex. Importantly, no register within the 21 bp duplex matches more than two of the six positions of the cognate TAATTA motif in either strand. The predicted affinity of this molecule, which we refer to as the non-cognate DNA throughout, is about 200-fold lower than that of the cognate duplex. Because matches of up to two cognate-like bases remain, the domain retains a weak sequence-dependent contribution alongside the electrostatic one even at such floor of its promiscuous recognition code.
Whether this designed sequence defines a usable affinity floor rests on the energetics of the model. Such energetics were derived from a large body of binding data obtained by fluorescence correlation spectroscopy [14] and have been tested independently by single-molecule tracking experiments, which showed that the dwell times of enHD on λ-phage genomic DNA, converted to free energies, traced the predicted binding free energy with a correlation coefficient of 0.996 and a slope of unity [16]. We therefore consider the 200-fold reduction as a reasonable estimate of the affinity floor.
That floor is in turn constrained by the concentrations at which we study the two complexes, 30 µM for circular dichroism and 200 µM for NMR. A 200-fold reduction places the predicted dissociation constant near 1 µM, 30-fold below the CD concentration and more than two orders of magnitude below the NMR one. Both experiments therefore report essentially on the saturated complex rather than on a mixture.
The same floor also sets the range of ionic strength that can be safely examined. Association is largely electrostatic and weakens steeply with charge screening, most consequentially for the non-cognate duplex. Hence, we work at a low I of 45 mM, and at 110 mM, which corresponds to the free ionic strength estimated for the cytoplasm [24], rather than extending the study to the higher values at which the cognate complex was also characterized in previous work [23]. This is because, above that range, the non-cognate duplex would no longer be bound sufficiently for safe comparison, and any inference drawn from the two endpoints would be confounded by partial dissociation.
2.2. EnHD Stiffens the Bound DNA without Reshaping It
We used near-UV CD to investigate the effect that enHD has on the DNA, and found that binding modifies the spectrum of both duplexes. The near-UV CD spectrum of B-form DNA has a positive lobe near 275 nm and a negative lobe near 245 nm, both arising from exciton coupling between stacked bases. The specific features of this band depend on the base composition — compare, for example, the blue spectra in panels a and b of Figure 1 — but the band also reports on the regularity of the B-form stack. The main effect of adding an equimolar amount of enHD at I = 110 mM to each duplex is an increase in the amplitude of this band. A 1.36-fold increase is found on the cognate DNA (red in Figure 1a) and a 1.09-fold increase on the non-cognate one (green in Figure 1b). The amplitude rescaling is quantitative, as shown by fitting each bound spectrum as a single scalar multiple of the corresponding free spectrum. The fits account for essentially all of the observed spectral change in every case. Binding of enHD therefore affects the DNA conformation, and it does so in the same general way for both duplexes, albeit to a larger extent for the stronger binding cognate duplex.
The rescaling fits demonstrate that the change upon binding does not alter the spectral shape. A bound spectrum that is simply an intensified free spectrum indicates that enHD does not elicit a different DNA conformer, whether a transition toward A-form or a distinct bent or unwound segment. Either would alter the relative weights of the exciton components and displace the crossover point, and neither effect is apparent in the data. These results indicate that binding of the protein narrows the broad distribution of B-form stacking geometries sampled by the free DNA in solution. EnHD thus stiffens the DNA it binds without reshaping it.
The amplitude difference between the cognate and non-cognate bound spectra suggests that DNA stiffening grows with binding strength. This point is supported by experiments at a lower ionic strength. Lowering I from 110 to 45 mM reduces the screening of the sequence-independent electrostatic interactions that promote DNA association, and hence strengthens binding for both duplexes. At I = 45 mM, we do observe the same type of intensity increase but of larger magnitude: the bound-form spectrum reaches 1.56-fold the free value for the cognate duplex (Figure 1c) and 1.23-fold for the non-cognate one (Figure 1d). What controls DNA stiffening is therefore not the identity of the sequence as such but the binding free energy. Cognate similarity and ionic strength jointly determine the binding free energy, so that binding made stronger by either factor can pay a larger entropic penalty to stiffen the DNA.
The four measurements do form a series ordered by the predicted affinities: the cognate duplex at I = 45 mM, the cognate duplex at 110 mM, the non-cognate duplex at 45 mM, and the non-cognate duplex at 110 mM. Taking the first as reference, stiffening decreases monotonically along the series: 1.00, 0.64, 0.41 and 0.16, confirming that the weaker the predicted association, the less the duplex is stiffened. Changing the sequence alone reduces the stiffening to 0.41 of the cognate value at I = 45 mM and to 0.25 at 110 mM, so the effect of sequence is larger at the higher ionic strength. In other words, the duplex is stiffened to the degree that the binding free energy affords.
2.3. Release of enHD’s Electrostatic Spring-Loaded Latch Does Not Require the Cognate Motif
Binding to the non-cognate duplex produces a large change in the far-UV CD spectrum of enHD. At I = 110 mM the free domain has a minimum at 208 nm and a shallow valley at 222 nm, with a mean residue ellipticity of −13,600 deg cm2 dmol−1 (blue in Figure 2). The crystal structure of the 56-residue free domain (PDB 1ENH) contains 38 helical residues in three segments of 13, 10 and 15, corresponding to 68% helix content and an average helix length (n) of 12.7 residues. The same native structure formed in solution should give approximately θ222 = −21,425 deg cm2 dmol−1, as determined from θ222,max = −39,500(1 − 2.57/n) = −31,507 deg cm2 dmol−1. The free protein therefore carries 64% of the native helical signal, consistent with a partially disordered domain whose helices are highly frayed in solution.
Addition of an equimolar amount of the non-cognate duplex increases the intensity of the maximum near 193 nm and of both minima at 208 and 222 nm, raising θ222 to −16,950 deg cm2 dmol−1 (green in Figure 2). This implies a net gain equivalent to six helical residues relative to the free protein, bringing the helical content to 79% of the maximal native helical signal. A DNA molecule designed to carry no recognition determinants at any register therefore elicits a substantial conformational change in enHD. This result establishes that the electrostatic spring-loaded latch is responsive to DNA generally, and not only to the cognate motif.
The conformational change of enHD on binding its cognate motif has been characterized previously [23]. We remeasured it here under identical conditions so that the two duplexes could be compared within a single data set. The cognate complex gives θ222 = −18,330 deg cm2 dmol−1 at I = 110 mM (red in Figure 2), a gain equivalent to eight residues.
To compare the two responses, we use the fraction of the cognate response achieved by the non-cognate complex, (θnon-cognate − θfree)/(θcognate − θfree), which is independent of the conversion adopted. At I = 110 mM this fraction is 0.71, indicating that binding to a sequence that sits at the floor of the promiscuous affinity spectrum of enHD recapitulates roughly 70% of the helical change elicited by binding to the cognate motif.
All three spectra share a common isodichroic point at 203 nm at both ionic strengths. Free, non-cognate-bound and cognate-bound enHD therefore lie on a single helix ↔ coil axis, which provides an internal check that the separation of the spectral contributions from the protein and DNA by singular value decomposition was effective. The θ222/θ208 ratio is reduced relative to the value expected for long, regular helices in all cases: 0.67 for the free protein against 0.72–0.73 for both complexes. This observation is indicative of short or frayed helical segments. That is, binding to either duplex appears to regularize as well as extend the highly frayed helices of the free protein.
Lowering the ionic strength to I = 45 mM renders the free protein slightly less helical, because electrostatic strain is less screened [23]. The effect is small though, with θ222 shifting from −13,600 to −13,180 deg cm2 dmol−1. Under these weaker screening conditions binding to both duplexes becomes stronger, but the fraction of the cognate response achieved by the non-cognate complex is maintained nonetheless (Figure S1). The invariance is significant given that it occurs across a 2.4-fold change in ionic strength, indicating that the different response observed at 110 mM for the non-cognate sequence is not an artifact of potentially incomplete binding at the higher ionic strength. We thus infer that the enHD responds differentially to the two duplexes as set by their sequence rather than by differences in binding saturation.
Placing the response of the protein on the same four-point series as in Section 2.2, and taking again the cognate complex at I = 45 mM as reference, we obtain 1.00, 0.88, 0.69 and 0.62. The protein response also decreases monotonically, although over a much smaller range of 1.6-fold against 6.2-fold for the DNA stiffening. Changing the sequence leaves about 70% of the response at either ionic strength, whereas raising the ionic strength leaves about 90% with either duplex. The protein response therefore does not follow the binding free energy in the way the stiffening of the DNA does.
2.4. Binding Interface and Protein Conformational Response at the Residue Level
The CD experiments report on the average conformation of each partner. To follow the response residue by residue we recorded 1H–15N HSQC spectra of the protein free and bound to the non-cognate duplex at I = 110 mM, together with the cognate complex, which we characterized previously [23] and remeasured here under the same conditions (Figure 3). The spectra of the two complexes are alike in their general features. Both are as well dispersed as the free protein, indicating that the domain stays in a structured conformation with either duplex bound. Both give a single set of sharp signals with no residual free-protein component and no signs of line broadening, consistent with binding being saturated under these conditions. Resonances could be followed from the free protein into both complexes for 52 backbone amides spanning residues 5 to 56 and for the W48 side-chain indole. The chemical shifts for the free protein and the cognate and non-cognate complexes are provided in Table S1.
A clear distinction between the two bound spectra is the magnitude of the perturbations, which are smaller for the non-cognate duplex at all but a few amides. To perform a residue-level comparison, we combine the 1H and 15N chemical shifts of each crosspeak in two ways. The combined perturbation Δδcomb = [Δδ(1H)2 + (0.14·Δδ(15N))2]½ is the length of the displacement in the 1H–15N plane and measures how strongly a probe is perturbed. The net perturbation Δδnet = Δδ(1H) + 0.14·Δδ(15N) retains the sign of the two contributions and reports the net sense of the displacement. Both are expressed in ppm on the 1H scale, the factor of 0.14 compensating for the wider dispersion of the 15N scale [28]. Here we use Δδcomb, which averages 0.06 ppm over the 52 amides for the non-cognate duplex, which is about a third of the 0.18 ppm for the cognate one. The two nuclei respond differentially and thus provide complementary information. Amide 1H shifts are governed mainly by through-space contributions, above all, the geometry of the hydrogen bond in which the proton participates, together with ring-current and electric-field effects from neighboring groups [29,30]. Amide 15N shifts are governed mainly by the backbone torsions of the residue and the one preceding it, with a considerably smaller contribution from hydrogen bonding [31,32]. Because both shifts are affected to varying extents by both hydrogen bonding and by backbone conformation, no general procedure is available to interpret a perturbation in structural terms directly [28]. We thus kept the two nuclei apart and treated each crosspeak as a displacement in the 1H–15N plane, so that every probe carries a direction as well as a magnitude. When examined at this level, the crosspeak shifts reveal certain interesting trends. Of the 39 amides whose cognate perturbation exceeds 0.08 ppm, 15 move within 25° of the cognate direction in the non-cognate complex and 7 move at more than 100°, while the remaining 17 fall in between.
One example in which the directions agree is R24, in the segment following helix 1, for which the non-cognate crosspeak moves within 6° of the cognate direction covering 76% of the distance to the cognate position. Other crosspeaks that move along the cognate direction can still differ in how far they shift. Departures from that pattern take two forms. Some non-cognate crosspeaks lose the response altogether. K55, at the C-terminal end of helix 3, shifts by 0.47 ppm in the cognate complex and insignificantly in the non-cognate one. Other crosspeaks point the other direction. The W48 indole shifts upfield in both nuclei on cognate binding and downfield in both on non-cognate binding.
At I = 45 mM the perturbations follow the same trends but are somewhat larger for both duplexes, and proportionally more for the non-cognate one, with the mean rising from 0.06 to 0.10 ppm against 0.18 to 0.21 ppm for the cognate complex (Figure S2 and Table S2). The non-cognate response thus goes from about a third at 110 mM to a half of the cognate value at the lower ionic strength. Note, however, that both fractions are averages over probes that move along the cognate direction and others that go in other ways, hence, such fractions do not imply uniform convergence toward the cognate complex.
2.5. Non-Cognate DNA Elicits Its Own Characteristic Response from enHD
We used a cross-correlation analysis to ask whether the probes share a common fraction of the cognate response. We defined for every probe f = (δnon−cognate − δfree)/(δcognate − δfree), which is computed separately for 1H and for 15N. On this scale f = 0 marks a probe whose environment is unchanged by the non-cognate duplex and f = 1 one that changes exactly as in the cognate complex. Plotting f(15N) against f(1H) places every probe on a map whose reference points are the free protein at the origin and the cognate complex at (1,1), and whose diagonal between them marks the probes for which the non-cognate complex is an attenuated version of the cognate one (Figure 4). We restricted the analysis to probes with cognate shifts of more than 0.03 ppm in 1H and 0.25 ppm in 15N, which leaves 29 probes at I = 110 mM and 32 at I = 45 mM. One of these, T6, lies so far from the rest at both ionic strengths that we show it in the insets to both panels of Figure 4 and leave it out of the statistics that follow to avoid excessive bias.
Three possible outcomes can be distinguished on this map. If the non-cognate complex were a uniformly attenuated version of the cognate complex, every probe would fall at the same point on the diagonal, within the error bands. If it were a binding mode resembling the cognate one to a different extent at each residue, the probes would remain on the diagonal but scattered along it. Finally, if it were a different binding mode altogether, probes would depart from the diagonal, and those falling outside the region between the two end states would report environments that neither the free protein nor the cognate complex experiences.
At I = 110 mM the probes average f = 0.23 in 1H and 0.14 in 15N, so the non-cognate complex is, on average, about 20% of the way from the free protein toward the cognate complex. These values are smaller than the roughly one third obtained from the combined shifts of Section 2.4 because a probe that moves exactly opposite to its cognate direction adds as much to the combined shift as one that moves exactly along it, whereas f is negative for the first. The gap between these two averages reflects the extent to which the non-cognate response is not directed toward the cognate complex. The scatter about the diagonal is also informative: only 13 of the 28 probes fall within three standard deviations. The hypothesis that the two nuclei of a given probe report a common value of f is clearly rejected, with χ2 = 464 on 28 degrees of freedom, and the rejection survives removal of the three largest contributors. The non-cognate complex is therefore not a uniformly attenuated version of the cognate complex, and the departure from that pattern is not confined to just a few probes.
Lowering the ionic strength to I = 45 mM strengthens the non-cognate response, with most probes moving further along the directions they already had at I = 110 mM. This is shown by correlating the values of f at the two ionic strengths for those probes that have perturbations above threshold in both conditions. The correlation yields r = 0.93 in 1H and 0.79 in 15N. Strengthening the interaction therefore preserves the probe-to-probe pattern that distinguishes the non-cognate complex. It is also worth noting that the sensitivity of enHD to ionic strength differs among the three states, being largest for the free protein, intermediate for the non-cognate complex and nearly suppressed for the cognate one. In other words, binding reduces the sensitivity of the domain to ionic screening, which likely reflects a relief of electrostatic strain in the domain due to compensation from the phosphate backbone, as well as the interactions with the bases in the cognate complex.
The individual probes fall into three groups that report on different aspects of the response. One group lies on the diagonal, behaving similarly to an attenuated cognate complex: F8 gives f = 0.20 in 1H and 0.19 in 15N, the two nuclei agreeing closely on a response one fifth of the way to cognate. A second group departs from the diagonal in one nucleus or the other, and in both directions: E19 gives f = 1.22 in 1H against 0.02 in 15N, so that this amide experiences an electronic environment close to that of the cognate complex while the backbone around it retains a free-protein-like conformation. K52 gives −0.01 in 1H against 0.51 in 15N, the reverse pattern. Probes of either kind cannot be described with a single value of f. The fact that both patterns occur indicates that some residues can recapitulate the cognate change in the environment of their amide proton but not in their backbone conformation, and the other way round. A third group lies outside the region defined by the two end states and reports environments that neither reference experiences: R53 gives 0.62 in 1H against −1.30 in 15N and Y25 gives 0.24 against −1.19, where the negative values mean that the 15N moves opposite to the cognate direction. The extreme case is T6, whose two nuclei move in opposite directions by several fold the cognate perturbation (insets to both panels of Figure 4). Taken together, the three groups show that the response of enHD to the non-cognate duplex is mixed: about half of the probes look like an attenuated version of the cognate response whereas the other half exhibit patterns of their own.
2.6. Cognate vs. Non-Cognate DNA: Differences in Binding Mode and Conformational Change
Figure 5 maps the perturbations induced by the two duplexes onto the structure of enHD, the larger ones shown with a thicker tube. The quantity displayed here is Δδnet, which assigns a single sign to each residue corresponding to the sum of its two contributions. Individual 1H and 15N shifts are given in Table S1 and Table S2. All perturbations are reported as δ(bound) − δ(free), so that upfield shifts carry a negative sign and downfield shifts a positive one. An upfield 15N is consistent with increased helical conformation, a downfield one with a decrease. Shielding (upfield) or deshielding (downfield) of an amide proton in the core is indicative of changes in solvation or in the ring-current contribution of a spatially neighboring aromatic resiude due to displacement or reorientation of its ring.
Looking at the cognate complex (Figure 5a), we find that the larger perturbations are concentrated in the three regions closest to the DNA in the crystal structure of the complex: the N-terminal arm with the residues following it, helix 3, and the loop connecting helices 1 and 2. Helices 1 and 2 experience much smaller perturbations. At the residue level the largest ones occur at F8, K55, A54, T27 and I47, in decreasing order.
Despite this correspondence with the interface, we do not expect the amide perturbations to report on the contacts made with the DNA for the following reasons: i) no protein amide forms hydrogen bonds with the DNA, the closest approach being T6 at 3.6 Å; ii) no amide is at a sufficiently close distance to a base to experience significant ring current effects; iii) and, while the T6 and L26 amides appear to undergo some desolvation on binding, as judged by the crystal structure, their 1H perturbations are small, 0.05 and 0.09 ppm respectively. The duplex is in fact held by side chains: Y25, R31, R53, K55 and K57 interacting with phosphate oxygens, and I47, Q50 and N51 interacting with bases [2,3]. Accordingly, the amides of the residues whose side chains contact the duplex show no distinctive pattern.
What the amide perturbations do report on is the conformational change undergone by enHD upon binding. For instance, the data indicate that the protein core is reorganized in the cognate complex. The 1H of F8 is deshielded by 0.52 ppm, and the W48 side-chain indole is shielded in both nuclei, by 0.22 ppm in 1H and 0.13 ppm in 15N. The amides adjacent to the core aromatic rings are also perturbed, and in both directions, with K52, R24, A7, L16 and R53 deshielded by 0.11–0.15 ppm, while F49 and Q50 are shielded by 0.11 and 0.28 ppm.
In terms of the increase in helical content observed by CD, many positions in the three α-helices are followed by an amide with an upfield 15N shift, which is consistent with an increase in helix at that position. These include S10, Q12, L13, A14, L16 and F20 in helix 1; E28, R30, Q33 and S36 in helix 2; and N41, immediately preceding helix 3, together with Q44, F49, R53, A54 and K55 within it. The increase in helicity induced by cognate binding therefore appears to be distributed along the three helices, but particularly at the end of helix 3.
Turning to the non-cognate complex (Figure 5b), the perturbations are smaller in magnitude, though not uniformly so along the domain. The perturbations also often differ in sign from their cognate counterparts, which provides further support for a different complex. The largest perturbations now fall in the N-terminal arm and in the loop connecting helices 1 and 2, whereas the reduction of the effect is most pronounced at the end of helix 3, where the perturbations become rather small, even for K55 and A54, the second and third largest in the cognate complex.
We have no structure of the non-cognate complex to reference the observed amide perturbations, but three probes clearly stand out relative to the cognate response. T6 and L26, the two amides closest to the phosphate backbone in the cognate complex, are the two most perturbed of the whole non-cognate map, and they are the only amides in the domain whose 1H perturbation exceeds its cognate value. Also, R5, immediately preceding T6, changes sign. All three are deshielded here, which is the direction expected for an amide proton polarized by a nearby phosphate oxygen, whereas T6 and R5 are shielded and with smaller perturbations in the cognate complex. The non-cognate duplex therefore engages the region that contacts the phosphate backbone in a different manner, and hence using a different binding mode.
The reorganization of the core is largely absent. The 1H and 15N of F8 retain about 0.20 of their cognate perturbations, and the amides adjacent to the core aromatic rings are reduced in the same proportion or more. The W48 side-chain indole does not simply weaken but reverses direction: it is deshielded in both nuclei, by 0.09 ppm in 1H and 0.12 ppm in 15N, where cognate binding shields it in both.
In terms of helical content, most of the positions whose following amide carries an upfield 15N on cognate binding still do so here, so part of the increase in helix is retained. The retained fraction varies widely however. It is close to unity at K55 and S10, intermediate at L13, A14 and Q44, and falls to nearly nothing at R53, A54 and Q12. The increase in helix at the C-terminal end of helix 3, the most pronounced feature of the cognate complex, is essentially absent in the non-cognate one. At nine positions the 15N of the following amide reverses sign, among them the contiguous stretch R24, Y25 and L26 in the loop.
Lowering the ionic strength to I = 45 mM strengthens the non-cognate response at all but seven of the probes (Figure S3, Table S2), and it does so without altering the pattern described above: the loop remains first and helix 3 last, which is the region that also gains the least. Two features do change appreciably in relative terms. The upfield 15N following R53 recovers sixfold, from 0.13 to 0.82 ppm, so part of the cognate-induced helical increase at the end of helix 3 is restored on the non-cognate complex at low ionic strength. The W48 indole moves further from its cognate response, its deshielding increasing to 0.10 ppm in 1H and 0.38 ppm in 15N.
3. Discussion
3.1. The Free-Energy Cost of DNA Stiffening and Its Implications for Nucleosomal DNA
The stiffening of the duplex induced by enHD binding is most simply read as a cost paid out of the binding free energy. It scales with the strength of the association across the four conditions examined here, over a total change of 6.2-fold between the strongest and the weakest. The scaling effect follows binding strength whether the association is made stronger by similarity to the cognate sequence or by reduced charge screening.
That homeodomain binding stiffens the DNA has not, to our knowledge, been reported before. The effect is not apparent in the X-ray structures of enHD bound to cognate DNA, in which the duplex is essentially in canonical B-form [2,3]. The reason is instructive. The near-UV CD measurements report a narrowing of the distribution of stacking geometries, not a displacement of its mean, but the mean is precisely what a crystallographic model describes. A duplex stiffened by homeodomain binding should therefore remain in canonical B-form, populating a narrower conformational ensemble with the same average. Such an effect would at most appear as a relative reduction in the crystallographic B factors of the DNA, but the comparison would require a structure of the same free duplex solved under matched conditions, which does not exist.
Interestingly, this result offers an interpretation of the binding behavior of enHD around nucleosomes. Homeodomains can engage nucleosomal DNA at periodic solvent-exposed positions [33], which is possible because the TAAT core of the motif carries most of the base specificity [2,3]. EnHD, moreover, binds nucleosomes with enhanced affinity relative to naked DNA [16]. A duplex that is already conformationally restricted costs less free energy to bind than a flexible one, provided its average conformation is compatible with the geometry that binding requires, a condition that the observed nucleosome binding shows to be satisfied. Since nucleosomal DNA is held wrapped, bent and conformationally constrained by the histone octamer, part of the restriction that enHD would otherwise have to pay for has been paid in advance at the expense of the histone core. That a small DNA-binding domain with no clamp should prefer the more sterically encumbered substrate is, on this reading, an indication that the penalty for enHD to bind DNA already bent on the nucleosome is smaller than the cost it would otherwise pay to restrict a free duplex.
3.2. The Conformational Response of enHD is That of a Rheostat
EnHD undergoes a large-scale conformational transition when it binds a DNA bearing its cognate motif, gaining the equivalent of eight helical residues. The response to the non-cognate DNA, designed to represent an affinity floor in its promiscuous recognition code, is also substantial, with a gain equivalent to six residues. EnHD therefore responds to non-cognate DNA with attenuated intensity. This is hardly surprising at face value, given that the affinity for the non-cognate DNA is significantly lower.
A closer look uncovers two mechanistic considerations. The first relates to what the response means at the level of individual molecules. A fractional response to an attenuated signal can be due to a rheostat, in which all the molecules are homogeneously intermediate, or to a switch, with corresponding fractions of molecules in the on and off states. These two options are normally indistinguishable in bulk. Here, however, the NMR spectra resolve them. Binding saturation removes any contribution from free protein, and the non-cognate complex gives a single set of sharp, well-dispersed signals with no line broadening (Figure 3). A bound state composed of two distinct conformational populations would appear either as a second set of resonances or as broadened ones. This is because dynamic averaging into one set would require interconversion faster than the chemical shift timescale. Since the protein stays bound to the duplex, interconversion would have to proceed either through release and rebinding at the dissociation rate, or in complex against the binding free energy, which should be even slower. The dissociation rate thus sets the ceiling, which for complexes of nanomolar to low micromolar affinity it should be much too slow. We thus conclude that he fractional helical increase is adopted by the whole population, as required in a rheostat.
That is, a weaker signal elicits a homogeneous response of lower intensity. The fundamental implication is that the response of enHD to non-cognate DNA is that of a conformational rheostat. Importantly, such homogeneity is across molecules and not along the different segments of the protein. The residue-level NMR data do show large variations in the ratio of the non-cognate to the cognate response, running from near unity to nearly nothing depending on the position, even with a sign reversal at nine positions. EnHD’s response to DNA is therefore rheostatic and differential across the protein. We note that rheostat operation is consistent with the isodichroic point in the far-UV CD spectra of free enHD and of both complexes (Figure 2), which simply establishes that the three spectra are linear combinations of helix and coil contributions at the residue level, and not that the underlying transition is two-state at the level of molecules. A conformational change upon cognate binding has recently been reported for the HMG box of Sox2. In that case binding to the cognate site quenches a minor population of partially unfolded states and rigidifies part of the C-terminal tail, which the authors interpreted as conformational selection [34]. EnHD behaves differently in that what changes is the extent of folding and not the weight of substates within a pre-organized ensemble.
The second consideration concerns the driving force behind enHD’s response to DNA. While the DNA stiffens in step with the free energy provided by complex formation, the domain itself behaves differently. Its helical response falls to 0.7 in the weaker non-cognate complex, but that ratio is nearly insensitive to ionic strength over a 2.4-fold range, even though the residue-level response redistributes along the protein. That is not what would follow for a response scaled with binding free energy. Because electrostatics accounts for a much larger share of the binding free energy in the non-cognate complex, lowering the ionic strength strengthens the weaker complex disproportionately and should thus shift the non-cognate/cognate ratio closer to unity. It does not. Such insensitivity to charge screening indicates that the response is not driven by the direct contacts the domain makes with the phosphate backbone. The alternatives are an unexpectedly strong floor-level contribution from promiscuous base interactions, or a trigger caused by proximity to the overall electric field of the DNA without requiring significant counterion displacement.
Either way, the implication is that there is a mechanism that places the domain in a state competent to read the DNA sequence, and that does so on approach rather than upon recognition. A mechanism of this kind differs from the standard search-recognition switch, in which the protein searches in one state and locks into another upon finding its target. Here the change that prepares the domain for readout would be elicited by any DNA it approaches, and its extent set by how cognate-like the sequence is. For a factor with a promiscuous code this is the more serviceable arrangement for exploiting the degenerate repeats that cluster around gene regulatory regions. The promiscuous code and the conformational mechanism would then be two aspects of a single arrangement for facilitating dynamic localization within a transcription antenna.
3.3. A Distinct Non-Cognate Binding Mode and Its Implications for Scanning
In contrast to the average nature of circular dichroism, NMR resolves the response of enHD to DNA residue by residue. Chemical shifts are exquisitely sensitive to the local environment, and each amide supplies two of them, 1H and 15N, that arise from different physical origins and hence provide independent reports on each peptide bond. The cross-correlation analysis we use here builds on this fact. Each normalized non-cognate amide chemical shift perturbation reports where that residue has moved relative to the cognate environment. Our results show that the probes share neither a common value nor a trend. The departure is also non-uniform across the domain: some positions acquire environments in the direction of their cognate ones, while others move in orthogonal or even antiparallel directions.
More direct evidence comes from the region in contact with the phosphate backbone. T6 and L26, the two amides closest to phosphates in the cognate complex, are the only ones more strongly perturbed by the non-cognate duplex than by the cognate one. R5, immediately preceding them, reverses sign. All three become deshielded, as an amide proton polarized by a nearby phosphate oxygen should be, whereas T6 and R5 become shielded in the cognate complex. The non-cognate duplex must thus engage this region differently, since a uniformly weaker interface could not give a larger response anywhere, placing the distinct non-cognate binding mode in a specific region of the domain.
Our results bear on a recent proposal that a molecular oscillator underlies the DNA scanning of enHD. It has been shown on theoretical grounds that a protein exchanging rapidly between a barrierless and a two-state folding regime can choreograph binding events to various partners that require the protein to convert to distinct conformations, without consuming chemical energy [21]. Barrierless folding gives fast interconversion but too brief a residence for efficient binding; two-state folding gives the residence at the cost of slow, uncorrelated transitions. However, a thermally driven fast exchange between the two regimes in response to modest changes in the local environment, such as partner proximity, can produce oscillatory behavior. For enHD that input has been proposed to be the electrostatic field of the DNA, which would shift the domain toward a flexible binding-competent ensemble in proximity to a duplex [22]. Our results lend some support to that input. The non-cognate duplex, which matches no more than two positions of the six-base motif at any register, still elicits 0.7 of the cognate helical change. This means that the trigger does not require the cognate motif. The ratio is insensitive to charge screening, as noted above, which suggests that the field works as a threshold instead of as a proportional input, hence releasing the latch in full once it becomes strong enough. The remaining increment in the cognate complex would then come from base-specific interactions, which are far less sensitive to screening.
One key aspect missing in that proposal is the nature of the two bound states, and the present results supply suitable candidates. Because the cognate and non-cognate complexes are conformationally distinct, a transition between them should likewise require release and rebinding through the free state, the one that would represent the barrierless regime at the core of the oscillator mechanism. The two bound states need not be equally long-lived, however, since the cognate complex binds with far higher affinity and should dissociate more slowly.
The difficulty is that a domain primed to bind by mere proximity could bind anywhere along its promiscuous code and would be prone to stall. The oscillator may therefore act as an escapement rather than as a choreographer: not oscillating itself, but releasing the domain from each site and returning it to its binding-competent free form, ready for the next motif it meets. Here thermal energy would supply the bias of a mainspring. Such a mechanism would prevent stalling at the isolated cognate matches that a genome presents by chance, which is consistent with the fast scanning seen in single-molecule tracking [16]. Within a transcription antenna, the aggregate of many somewhat longer-lived binding events would keep the population localized as a dynamic attractor, and hence available to the cofactors that initiate or block transcription. Demonstrating this hypothesis will most likely require observing individual molecules interconverting near and on DNA.
3.4. Non-Cognate DNA Repacks the Core and Reorganizes enHD’s Interface
Amide chemical shift perturbations cannot be converted into structural information directly, but the two nuclei report different properties: 1H mainly the local environment of the proton, 15N largely the local backbone conformation. For their interpretation, we start with two considerations that will guide the analysis. First, since the conformational change is locked out in the crystal [23], the nearly identical structures of the free and cognate-bound domain describe the fold of the free form, though significantly less frayed than in solution as judged by the CD spectrum (Figure 2). Second, the structure of enHD sitting on the cognate DNA shows no amide donating a hydrogen bond to a base, nor any lying close enough to a base to sense one. Only the amide of T6 comes close enough to a phosphate oxygen for a direct interaction. Therefore, the perturbations observed in the regions sitting close to the DNA largely report the domain’s own environment, which turns them into a map of the conformational change in response to binding.
The reorganization of the hydrophobic core is the first aspect of note, which we can inspect through the amides of F8, L13, L16 and F20 and the W48 indole. In the free protein the side chains of those residues pack against the indole at van der Waals distance, forming a packing unit, and with the indole being the principal contact that helix 3 makes with helix 1 and the N-terminal arm. Only the indole proton probes the aromatic contacts directly, whereas the amides report the backbone conformation and can move either way without indicating whether the side chain approaches the indole or retreats from it. On cognate binding the 1H shifts move coherently across the unit, deshielding every amide proton and shielding the indole. The indole upfield shift points at the aromatic rings brought closer together than in the free protein. The 15N shifts are significant for F8 and F20, the two phenylalanines whose rings surround the indole, particularly for F8. We also know from CD that binding consolidates and extends the frayed helices. The fold reorganization induced by the cognate duplex thus involve repacking of the core together with helix tightening. Non-cognate binding produces a distinct response in the same region. CD gives most of the cognate gain in helicity, and the 1H and 15N shifts of F8 and F20 move in the cognate direction at reduced magnitude. The indole proton shifts downfield, however, indicating that the surrounding aromatic rings move further from it than in the free protein. This is in stark contrast with cognate binding, which draws them closer. Therefore, non-cognate binding recapitulates most of the cognate-induced helical increase and far less of the overall backbone reconfiguration. More significant still, it moves the packing of helix 3 against helix 1 and the N-terminal arm away from the free protein in the opposite direction to the cognate one.
We can infer some aspects of the electrostatic latch release as well. The latch is made by a network of three salt bridges, R15–E37, E19–R30 and R31–E42, that holds the helices together against the repulsion accumulated on the positively charged face of enHD [22]. The CD results from Figure 2 show that both duplexes release it. However, neither the salt-bridging residues nor the stretches of sequence around them stand out in the domain-wide pattern of perturbations, and the regions carrying the two partners of a bridge respond in uncorrelated fashion, so we can conclude that what opens the latch is the global reorganization of the domain rather than localized changes.
An additional aspect is the binding mode. Outside the core, the regions that move furthest from the free protein on cognate binding are the N-terminal arm, the loop between helices 1 and 2 and helix 3, which is where the crystal structure places the contacts with the DNA. That correspondence cannot be assumed for the non-cognate complex. What we can say nonetheless is that non-cognate binding produces a distinct response in each of these regions, and that electrostatics seem to play a key role in that response. The N-terminal arm and the loop carry uncompensated positive charge in the free protein, R3 and R5 in the arm and R24 in the loop, with the nearest acidic side chains lying far from them in the free structure. These two regions are those that move furthest from the free protein in the non-cognate complex, and in directions different from the cognate one. The implication is that the non-cognate duplex engages enHD where the domain’s charge invites it, and in an arrangement that is distinct from the cognate one and available to bind any DNA sequence.
Helix 3 moves in the cognate direction from its beginning and as far as Q50. This is the only non-cognate engaged region that does, but it does so in a softened way. Interestingly, that helix stretch carries two of the three contacts with bases in the cognate structure. Part of the cognate reading scaffold therefore survives, which is consistent with the non-cognate DNA representing a non-zero floor in enHD’s promiscuous code. Beyond N51 the picture changes. The helix 3 end does not order on non-cognate binding: A54 and K55, which give among the largest perturbations of the domain on cognate binding, are minimally perturbed, and the length of this short segment matches the difference in helical content that CD measures between the two complexes. A similar ordering has been reported in PBX1, where a fifteen-residue extension lying outside the homeodomain and without DNA contact folds into a helix on DNA binding [35]. The region is not disengaged, however. It is the most basic stretch of the whole domain, and R53, one of its arginines, is perturbed almost as strongly as on cognate binding but in a markedly different direction. We thus conclude that the end of helix 3 engages the non-cognate duplex through charge rather than setting into the major groove as the cognate one does, and presumably interacting with the phosphate backbone. A comparable division has been described outside the homeodomain family, particularly in the ETS domain of Ets-1, in which the same interface engages specific and non-specific DNA but the non-specific complex is held just by electrostatic interactions [36]. Non-cognate DNA therefore holds enHD through charge along the whole of its interface, while retaining the cognate reading carried by only the first part of helix 3.
Read functionally, these results give structural form to the scanning mechanism proposed in Section 3.3, and suggest a division of labor between charge and sequence. The cognate register positions the domain to read bases, but such placement need not be the arrangement that best satisfies the domain’s own charge. In the cognate complex, for instance, the guanidinium of R5 reaches a base in the minor groove rather than the phosphate backbone. Released from the cognate-reading register, enHD would settle onto the DNA in the arrangement charge alone favors. That way, enHD would scan DNA already open and against the phosphate backbone. What a cognate site would then pay for is locking the end of helix 3 into the major groove, which makes the structuring of that segment the step that separates a committed complex from a transient one in that mechanism, and the one its escapement would have to undo for the search to resume.
4. Materials and Methods
4.1. Protein Expression and Purification
Codon-optimized gene sequences encoding for the 56-residue enHD as a fusion with SUMO protein were synthesized and cloned into pBAT vector. Recombinant SUMO-enHD was expressed in BL21(DE3) E. coli strain. Bacteria were grown at 37 °C in minimal media containing 15NH4Cl as the sole nitrogen source or containing 15NH4Cl and 13C6-D-glucose as the sole nitrogen and carbon sources, respectively. After reaching an OD600 of 0.8-1.0, protein expression was induced by adding. 1 mM IPTG (isopropyl-β-D-thiogalacto-pyranoside). After induction, we expressed the SUMO-fused enHD overnight at 37 °C Cells were harvested by centrifugation and resuspended in B-PER Complete Bacterial Protein Extraction buffer. Cells were incubated in buffer for 60 min then centrifuged at 30,000 rpm at 4 °C for 30 min. The supernatant was purified using a HisTrap HP column. The SUMO tag was cleaved by incubating the column’s eluant with ULP1 overnight at 4 °C. A second purification step using the HisTrap HP column was needed to remove the SUMO-tag. A third purification using C4 reverse phase was then performed to remove excess salt from the buffer. The sample was then lyophilized and confirmed by SDS-PAGE and electrospray ionization Mass Spectrometry with a purity >98%.
4.2. Cognate and Non-Cognate DNA Molecules
As a molecule for non-cognate DNA binding, we used the DNA sequence 5’-CCGTGTCCGTGTCCGTGTCCC-3’ and its complement strand 5’-CGGACACGGACACGGACACGC-3’. As a molecule for cognate DNA binding, we used the same 21 bp DNA sequence as previously described [23]. All DNA oligonucleotides were purchased from Integrated DNA Technologies (IDT). The double stranded DNA was hybridized by mixing equal volumes of 10 mM solutions of oligonucleotide in each buffer used for NMR or CD experiments. DNA annealing was achieved by heating at 393K for 10 min followed by slow cooling to 277K using a T100 Thermal cycler from Bio-Rad. Good stoichiometry and pairing were confirmed by analytical centrifugation.
4.3. Circular Dichroism (CD) Spectroscopy
Samples for circular dichroism analysis of the effects of binding cognate or non-cognate DNA were prepared with only enHD at 30 μM as the negative control, cognate or non-cognate DNA at 30 μM for subtraction of the inherent CD spectrum of DNA, and both enHD and cognate or non-specific DNA at 1:1 equimolar concentrations. Samples were prepared in 20 mM Tris HF (pH adjusted using HF and KOH) at pH 7. KF was added to reproduce the final ionic strengths by adding 25 mM and 90 mM, respectively. CD spectra were acquired on a Chirascan Plus spectrophotometer. Data were collected with 1 nm resolution from 300-190 nm (40 s acquisition per nm) using a 0.2 mm pathlength cuvette at room temperature. Buffer baseline was subtracted and data were transformed into mean residue ellipticity units for enHD and molar ellipticity units for DNA, and then analyzed using singular value decomposition in MATLAB.
4.4. Nuclear Magnetic Resonance (NMR) Spectroscopy
NMR samples for resonance assignment were prepared with 13C and 15N uniformly labeled enHD at 500 μM in 20 mM MES buffer, 25 mM NaCl, pH6, 10% D2O/90% H2O. Under these conditions, enHD remains soluble and monomeric. NMR experiments for [1H-15N]-HSQC assignment were acquired at 298K in a Bruker Avance III HD 800 MHz spectrometer equipped with a TCI cryoprobe at UC Santa Cruz. Sequence backbone chemical shift assignments were obtained from experiments: [1H-15N]-HSQC, 3D HNCACB and 3D CBCA(CO)NH. NMR samples for DNA binding were prepared at a final concentration of 200 μM EnHD in 20 mM MES at 25 mM or 90 mM NaCl, pH 6, 5% D2O/95% H2O. DNA binding experiments were acquired at 298K in a Bruker NEO 600 MHz spectrometer equipped with an HCND cryoprobe at UC Merced. enHD/DNA samples were prepared by mixing solutions of enHD and hybridized DNA at 2x molar ratio (to ensure 1:1 binding) but at concentrations 10-fold diluted relative to the target final concentration of enHD. A volume of 3 mL of a 10x dilute sample was concentrated down to 300 μL final sample volume using 3K MWCO Amicon Ultra Centrifugal Filters spun at 3000 xg for 60 min at 4 °C. Sample preparation at 10-fold dilution avoids the precipitation of enHD during mixing with DNA. NMR samples were processed using NMRPipe [37] and Sparky [38] was used to visualize the processed data.
4.5. Analysis of Amide Chemical Shift Perturbations
Assigned peak positions were extracted in ppm for both the 1H and the 15N dimension. For each assigned backbone amide, and for the W48 indole, perturbations were computed separately at each ionic strength as the difference between the complex and the free protein measured under the same conditions, Δδ(1H) = δcomplex − δfree and Δδ(15N) likewise, so that upfield shifts carry a negative sign and downfield shifts a positive one. Two combinations are reported, both on the 1H scale with the factor of 0.14 scaling the nitrogen dispersion to that of the proton [28], a weighting that has been found to be optimal across proteins of different kinds [39]: the combined perturbation Δδcomb =[Δδ(1H)2 + (0.14·Δδ(15N))2]½, which measures how strongly a probe is displaced, and the net perturbation Δδnet = Δδ(1H) + 0.14·Δδ(15N), which retains the sign of the two contributions.
To quantify the extent to which the non-cognate-bound ensemble adopts features of the cognate-bound conformation, residue-specific normalized chemical shift ratios were calculated independently for the two nuclei as f = Δδ(non-cognate − free)/Δδ(cognate − free). This normalization defines f = 0 as free-like behavior, f = 1 as cognate-like behavior, and intermediate values as positions along the free-to-cognate chemical shift trajectory. The ratio was evaluated only for residues whose cognate displacement exceeded 0.03 ppm in 1H and 0.25 ppm in 15N; below those values the ratio is dominated by measurement error. Uncertainty in f = A/B was estimated by first-order propagation of error, assuming independent uncertainties in A = Δδ(non-cognate − free) and B = Δδ(cognate − free), and was propagated independently for the two dimensions from peak-position uncertainties of 0.005 ppm (1H) and 0.05 ppm (15N).
Each perturbation was additionally treated as a vector in the 1H–15N plane, (Δδ(1H), 0.14·Δδ(15N)). For every probe, the angle between the cognate and the non-cognate vectors reports whether the environment acquired on binding the non-cognate duplex is the one the cognate duplex produces, and the ratio of their lengths reports how far that environment has moved from the free state. Angles were evaluated only where the combined cognate displacement exceeded 0.08 ppm, since below that value the direction is not determined. Residue T6 was excluded from all averages and statistical tests for the reasons given in the Results.
4.6. Structural Analysis
Interatomic distances and solvent accessibilities were computed from the crystal structures of free enHD (PDB 1ENH) and of its cognate complex (PDB 3HDD). Amide protons, absent from both X-ray models, were placed geometrically along the bisector of the N–C′(i−1) and N–Cα directions at 1.01 Å from the nitrogen. Solvent-accessible surface areas were obtained with the Shrake–Rupley algorithm using a 1.4 Å probe, and the burial of an amide by the duplex was taken as the difference between the values computed for the protein alone and for the protein–DNA complex. Water molecules were excluded from all distance calculations involving the DNA
5. Conclusions
The engrailed homeodomain responds conformationally to any DNA it binds, releasing the same electrostatic spring-loaded latch whatever the sequence. At the floor of its affinity scale the response is large, albeit of lesser magnitude than the cognate one, and homogeneous across the bound population, indicating that the domain works as a conformational rheostat set by the DNA sequence.
We also find that enHD stiffens the DNA it binds to a degree graded by the strength of the association. The conformational restriction of the DNA is therefore a cost met out of the binding free energy. The implication is that a duplex that is already restricted should cost less to bind, which may explain why enHD binds nucleosomes with higher affinity than naked DNA.
The response that the non-cognate duplex elicits is not a softened version of that induced by cognate recognition. Residue by residue, the non-cognate complex appears to hold the domain through charge along the whole interface, reproduces only the part of the sequence-recognition scaffold carried by the first part of helix 3, leaves the C-terminal end of that helix unordered, and repacks the hydrophobic core away from its free-protein arrangement in the direction opposite to the cognate one. It is therefore a distinct binding mode. Importantly, tightening the non-cognate association does not shift enHD to the other mode, meaning that what the domain adopts is set by the sequence it reads.
Finally, we identify two distinctly organized bound states induced by the differences in DNA sequence. Two such states are what the molecular oscillator mechanism previously proposed for enHD [21] would require to operate. We further suggest that the oscillator could act in this case as an escapement for scanning the genome, a hypothesis that needs further testing, possibly via single-molecule experiments that manage to resolve the individual binding transitions.
Supplementary Materials
The following supporting information can be downloaded at the website of this paper posted on Preprints.org, Figure S1: far-UV Spectra of enHD at I = 45 mM; Figure S2: 1H–15N HSQC spectra of enHD at I = 45 mM; Figure S3: Amide chemical shift perturbations of enHD on binding at I = 45 mM, mapped onto the structure; Table S1: EnHD backbone amide 1H–15N chemical shift assignments at I = 110 mM; Table S2: EnHD backbone amide 1H–15N chemical shift assignments at I = 45 mM.
Author Contributions
Conceptualization, V.M.; methodology, B.T., M.S., and V.M..; formal analysis, B.T. and V.M.; investigation, B.T.; resources, M.S.; data curation, B.T.; writing—original draft preparation, B.T.; writing—review and editing, V.M.; visualization, B.T.; supervision, V.M.; project administration, V.M.; funding acquisition, V.M. All authors have read and agreed to the published version of the manuscript.
Funding
Please add: This research was funded by the National Science Foundation, grant numbers MCB-2112710 and HRD-2112675 and by the National Institutes of Health, grant number R01GM152623.
Data Availability Statement
The original contributions presented in this study are included in the article/supplementary material. Further inquiries can be directed to the corresponding author(s)..
Acknowledgments
During the preparation of this manuscript, the author(s) used Claude for the purposes of generating Figure 4 as well as well as for performing the vectorial analysis of the 1H and 15N chemical shift perturbations discussed in the Methods section. The authors have reviewed and edited the output and take full responsibility for the content of this publication.”.
Conflicts of Interest
The authors declare no conflicts of interest.
References
- Burglin, T.R.; Affolter, M. Homeodomain proteins: an update. Chromosoma 2016, 125, 497-521. [CrossRef]
- Kissinger, C.R.; Liu, B.S.; Martin-Blanco, E.; Kornberg, T.B.; Pabo, C.O. Crystal structure of an engrailed homeodomain-DNA complex at 2.8 A resolution: a framework for understanding homeodomain-DNA interactions. Cell 1990, 63, 579-590. [CrossRef]
- Fraenkel, E.; Rould, M.A.; Chambers, K.A.; Pabo, C.O. Engrailed homeodomain-DNA complex at 2.2 A resolution: a detailed view of the interface and comparison with other engrailed structures. J Mol Biol 1998, 284, 351-361. [CrossRef]
- Wolberger, C.; Vershon, A.K.; Liu, B.; Johnson, A.D.; Pabo, C.O. Crystal structure of a MAT alpha 2 homeodomain-operator complex suggests a general model for homeodomain-DNA interactions. Cell 1991, 67, 517-528. [CrossRef]
- Cain, B.; Webb, J.; Yuan, Z.; Cheung, D.; Lim, H.W.; Kovall, R.A.; Weirauch, M.T.; Gebelein, B. Prediction of cooperative homeodomain DNA binding sites from high-throughput-SELEX data. Nucleic Acids Res 2023, 51, 6055-6072. [CrossRef]
- Lelli, K.M.; Slattery, M.; Mann, R.S. Disentangling the many layers of eukaryotic transcriptional regulation. Annu Rev Genet 2012, 46, 43-68. [CrossRef]
- Long, H.K.; Prescott, S.L.; Wysocka, J. Ever-Changing Landscapes: Transcriptional Enhancers in Development and Evolution. Cell 2016, 167, 1170-1187. [CrossRef]
- Jolma, A.; Yan, J.; Whitington, T.; Toivonen, J.; Nitta, K.R.; Rastas, P.; Morgunova, E.; Enge, M.; Taipale, M.; Wei, G.; et al. DNA-binding specificities of human transcription factors. Cell 2013, 152, 327-339. [CrossRef]
- Weirauch, M.T.; Yang, A.; Albu, M.; Cote, A.G.; Montenegro-Montero, A.; Drewe, P.; Najafabadi, H.S.; Lambert, S.A.; Mann, I.; Cook, K.; et al. Determination and inference of eukaryotic transcription factor sequence specificity. Cell 2014, 158, 1431-1443. [CrossRef]
- Berman, B.P.; Nibu, Y.; Pfeiffer, B.D.; Tomancak, P.; Celniker, S.E.; Levine, M.; Rubin, G.M.; Eisen, M.B. Exploiting transcription factor binding site clustering to identify cis-regulatory modules involved in pattern formation in the Drosophila genome. Proc Natl Acad Sci U S A 2002, 99, 757-762. [CrossRef]
- Gotea, V.; Visel, A.; Westlund, J.M.; Nobrega, M.A.; Pennacchio, L.A.; Ovcharenko, I. Homotypic clusters of transcription factor binding sites are a key component of human promoters and enhancers. Genome Res 2010, 20, 565-577. [CrossRef]
- Crocker, J.; Abe, N.; Rinaldi, L.; McGregor, A.P.; Frankel, N.; Wang, S.; Alsawadi, A.; Valenti, P.; Plaza, S.; Payre, F.; et al. Low affinity binding site clusters confer hox specificity and regulatory robustness. Cell 2015, 160, 191-203. [CrossRef]
- Farley, E.K.; Olson, K.M.; Zhang, W.; Brandt, A.J.; Rokhsar, D.S.; Levine, M.S. Suboptimization of developmental enhancers. Science 2015, 350, 325-328. [CrossRef]
- Castellanos, M.; Mothi, N.; Muñoz, V. Eukaryotic transcription factors can track and control their target genes using DNA antennas. Nat Commun 2020, 11, 540. [CrossRef]
- Muñoz, V.; Goluguri, R.R.; Ghosh, C.; Tanielian, B.; Sadqi, M. Mechanisms for DNA Interplay in Eukaryotic Transcription Factors. Annu Rev Biophys 2025, 54, 121-139. [CrossRef]
- Goluguri, R.R.; Ghosh, C.; Quintong, J.; Sadqi, M.; Muñoz, V. How to scan naked DNA using promiscuous recognition and no clamping: a model for pioneer transcription factors. Nucleic Acids Res 2024, 52, 11098-11114. [CrossRef]
- Mayor, U.; Guydosh, N.R.; Johnson, C.M.; Grossmann, J.G.; Sato, S.; Jas, G.S.; Freund, S.M.; Alonso, D.O.; Daggett, V.; Fersht, A.R. The complete folding pathway of a protein from nanoseconds to microseconds. Nature 2003, 421, 863-867. [CrossRef]
- Naganathan, A.N.; Doshi, U.; Muñoz, V. Protein folding kinetics: barrier effects in chemical and thermal denaturation experiments. J Am Chem Soc 2007, 129, 5673-5682. [CrossRef]
- Stollar, E.J.; Mayor, U.; Lovell, S.C.; Federici, L.; Freund, S.M.; Fersht, A.R.; Luisi, B.F. Crystal structures of engrailed homeodomain mutants: implications for stability and dynamics. J Biol Chem 2003, 278, 43699-43708. [CrossRef]
- Campos, L.A.; Sadqi, M.; Muñoz, V. Lessons about protein folding and binding from archetypal folds. Accounts of Chemical Research 2020, 53, 2180-2188.
- Murugan, R.; Muñoz, V. Theory on the Design Principles of Protein Molecular Oscillatory Machines. J Phys Chem B 2025, 129, 7753-7765. [CrossRef]
- Herrera-Asmat, O.; Muñoz, V. Functional folding dynamics: fold switches, rheostats and oscillators. Current Opinion in Structural Biology 2026, (In Press).
- D’Amelio, N.; Tanielian, B.; Sadqi, M.; Lopez-Navajas, P.; Muñoz, V. Cognate DNA Recognition by Engrailed Homeodomain Involves a Conformational Change Controlled via an Electrostatic-Spring-Loaded Latch. Int J Mol Sci 2022, 23, 2412. [CrossRef]
- Liu, B.; Poolman, B.; Boersma, A.J. Ionic Strength Sensing in Living Cells. ACS Chem Biol 2017, 12, 2510-2514. [CrossRef]
- Iwahara, J.; Clore, G.M. Detecting transient intermediates in macromolecular binding by paramagnetic NMR. Nature 2006, 440, 1227-1230. [CrossRef]
- Iwahara, J.; Zweckstetter, M.; Clore, G.M. NMR structural and kinetic characterization of a homeodomain diffusing and hopping on nonspecific DNA. Proc Natl Acad Sci U S A 2006, 103, 15062-15067. [CrossRef]
- Choi, S.R.; Lee, J.; Seo, Y.J.; Jin, H.S.; Ahn, H.B.; Go, Y.; Kim, N.K.; Ryu, K.S.; Lee, J.H. Molecular basis of facilitated target search and sequence discrimination of TALE homeodomain transcription factor Meis1. Nat Commun 2024, 15, 6984. [CrossRef]
- Williamson, M.P. Using chemical shift perturbation to characterise ligand binding. Prog Nucl Magn Reson Spectrosc 2013, 73, 1-16. [CrossRef]
- de Dios, A.C.; Pearson, J.G.; Oldfield, E. Secondary and tertiary structural effects on protein NMR chemical shifts: an ab initio approach. Science 1993, 260, 1491-1496. [CrossRef]
- Parker, L.L.; Houk, A.R.; Jensen, J.H. Cooperative hydrogen bonding effects are key determinants of backbone amide proton chemical shifts in proteins. J Am Chem Soc 2006, 128, 9863-9872. [CrossRef]
- Le, H.; Oldfield, E. Correlation between 15N NMR chemical shifts in proteins and secondary structure. J Biomol NMR 1994, 4, 341-348. [CrossRef]
- Xu, X.P.; Case, D.A. Probing multiple effects on 15N, 13C alpha, 13C beta, and 13C’ chemical shifts in peptides using density functional theory. Biopolymers 2002, 65, 408-423. [CrossRef]
- Zhu, F.; Farnung, L.; Kaasinen, E.; Sahu, B.; Yin, Y.; Wei, B.; Dodonova, S.O.; Nitta, K.R.; Morgunova, E.; Taipale, M.; et al. The interaction landscape between transcription factors and the nucleosome. Nature 2018, 562, 76-81. [CrossRef]
- Orsetti, A.; Slejfer, J.; Ha, S.; Kevelam, D.I.; Tekkelenburg, J.; van Duijn, T.; Leppakoski, A.; Sedrakyan, A.; Szilagyi, A.; Schellevis, R.D.; et al. Solution structure of the Sox2 DNA-binding domain reveals conformational selection in DNA binding. Nucleic Acids Res 2025, 53. [CrossRef]
- Farber, P.J.; Mittermaier, A. Concerted dynamics link allosteric sites in the PBX homeodomain. J Mol Biol 2011, 405, 819-830. [CrossRef]
- Desjardins, G.; Okon, M.; Graves, B.J.; McIntosh, L.P. Conformational Dynamics and the Binding of Specific and Nonspecific DNA by the Autoinhibited Transcription Factor Ets-1. Biochemistry 2016, 55, 4105-4118. [CrossRef]
- Delaglio, F.; Grzesiek, S.; Vuister, G.W.; Zhu, G.; Pfeifer, J.; Bax, A. NMRPipe: a multidimensional spectral processing system based on UNIX pipes. J Biomol NMR 1995, 6, 277-293. [CrossRef]
- Lee, W.; Tonelli, M.; Markley, J.L. NMRFAM-SPARKY: enhanced software for biomolecular NMR spectroscopy. Bioinformatics 2015, 31, 1325-1327. [CrossRef]
- Hobbs, B.; Drant, J.; Williamson, M.P. The measurement of binding affinities by NMR chemical shift perturbation. J Biomol NMR 2022, 76, 153-163. [CrossRef]
Figure 1.
Near-UV circular dichroism spectra of the two DNA duplexes, free and bound to enHD, at two ionic strengths. (a) Cognate and (b) non-cognate duplex at I = 110 mM; (c) cognate and (d) non-cognate duplex at I = 45 mM. In each panel the free duplex is shown in blue, and the equimolar complex with enHD in red for the cognate duplex and in green for the non-cognate one. Note that the vertical scale differs between the cognate and non-cognate panels, the two duplexes having different molar ellipticities and spectral shapes by virtue of their base composition.
Figure 1.
Near-UV circular dichroism spectra of the two DNA duplexes, free and bound to enHD, at two ionic strengths. (a) Cognate and (b) non-cognate duplex at I = 110 mM; (c) cognate and (d) non-cognate duplex at I = 45 mM. In each panel the free duplex is shown in blue, and the equimolar complex with enHD in red for the cognate duplex and in green for the non-cognate one. Note that the vertical scale differs between the cognate and non-cognate panels, the two duplexes having different molar ellipticities and spectral shapes by virtue of their base composition.
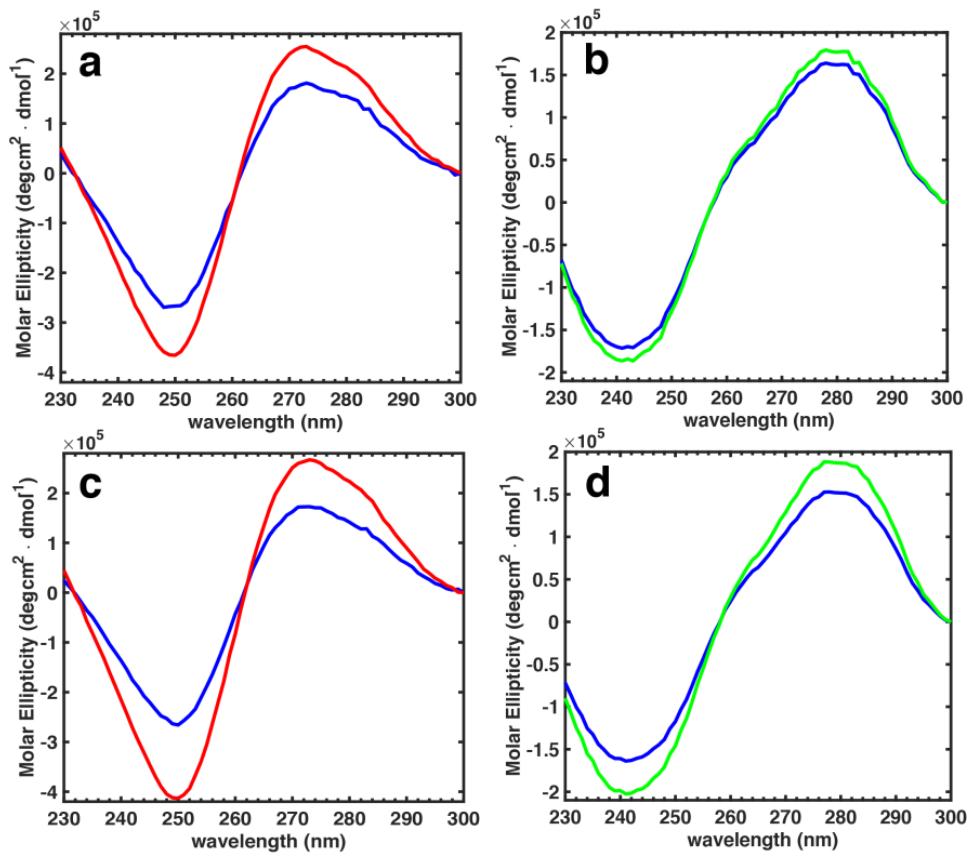
Figure 2.
Far-UV circular dichroism (CD) spectra of enHD at I = 110 mM in the absence of DNA (blue), in the presence of cognate DNA at a 1:1 ratio (red), and in the presence of non-cognate DNA at a 1:1 ratio (green).
Figure 2.
Far-UV circular dichroism (CD) spectra of enHD at I = 110 mM in the absence of DNA (blue), in the presence of cognate DNA at a 1:1 ratio (red), and in the presence of non-cognate DNA at a 1:1 ratio (green).
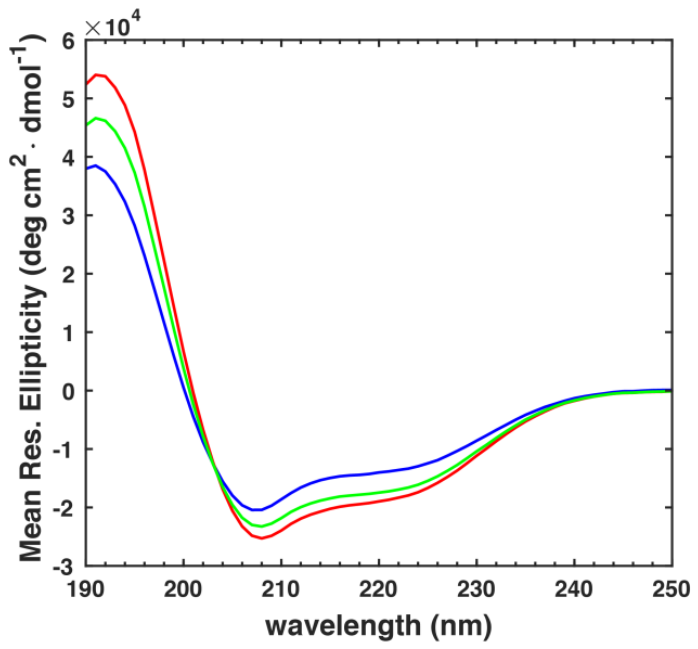
Figure 3.
1H–15N HSQC spectra of enHD at I = 110 mM, free (blue), bound to the non-cognate duplex (green) and bound to the cognate duplex (red), at 25 °C and 200 µM protein with a 2-fold excess of DNA. Assignments are indicated on the free-protein crosspeaks.
Figure 3.
1H–15N HSQC spectra of enHD at I = 110 mM, free (blue), bound to the non-cognate duplex (green) and bound to the cognate duplex (red), at 25 °C and 200 µM protein with a 2-fold excess of DNA. Assignments are indicated on the free-protein crosspeaks.
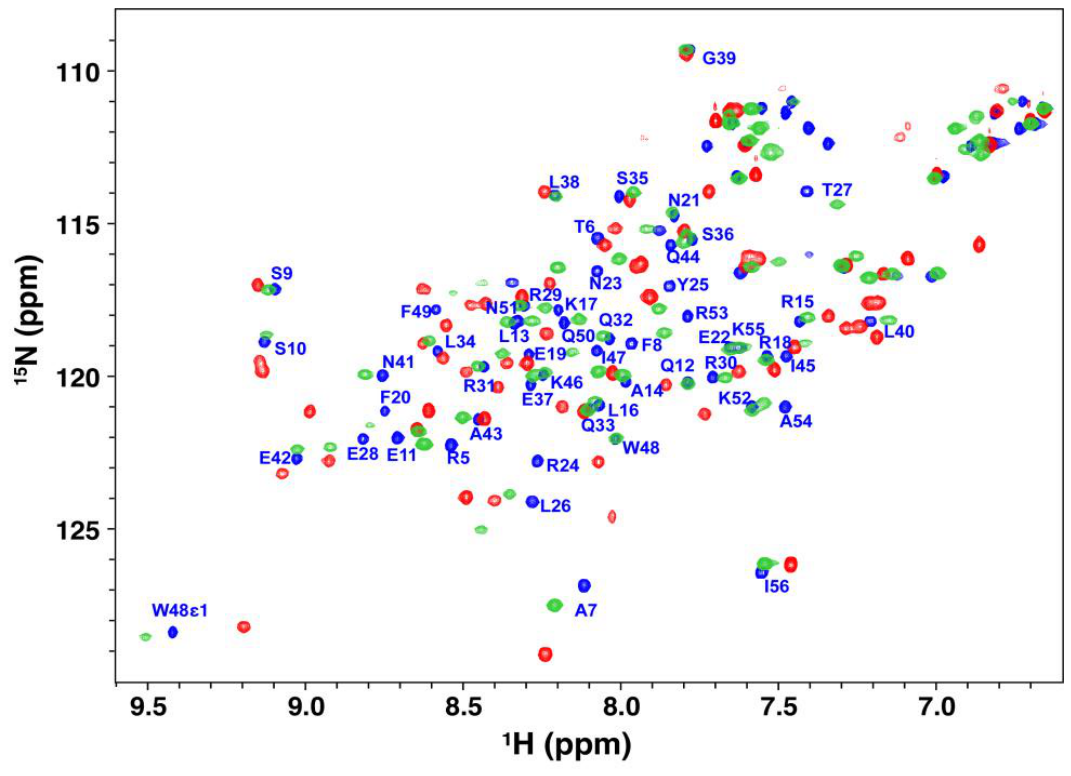
Figure 4.
Normalized cross-correlation of the non-cognate and cognate chemical shift perturbations at (a) I = 110 mM and (b) I = 45 mM. For each probe, f = (δnon-cognate − δfree)/(δcognate − δfree) is plotted for 15N against 1H. The blue star marks the free protein (0,0) and the red star the cognate complex (1,1); the solid line joining them is the locus of partial cognate responses, and the dark and light grey bands are its ±1σ and ±3σ envelopes, σ being the median propagated uncertainty. The dashed line extends the diagonal beyond the two end states. Error bars are propagated from peak-position uncertainties of 0.005 ppm (1H) and 0.05 ppm (15N). Probes falling outside the ±3σ band are labeled. Insets show T6, which lies far outside the plotted range in both panels. Only probes whose cognate perturbation exceeds the thresholds of 0.03 ppm (1H) and 0.25 ppm (15N) are included: n = 29 at I = 110 mM and n = 32 at I = 45 mM.
Figure 4.
Normalized cross-correlation of the non-cognate and cognate chemical shift perturbations at (a) I = 110 mM and (b) I = 45 mM. For each probe, f = (δnon-cognate − δfree)/(δcognate − δfree) is plotted for 15N against 1H. The blue star marks the free protein (0,0) and the red star the cognate complex (1,1); the solid line joining them is the locus of partial cognate responses, and the dark and light grey bands are its ±1σ and ±3σ envelopes, σ being the median propagated uncertainty. The dashed line extends the diagonal beyond the two end states. Error bars are propagated from peak-position uncertainties of 0.005 ppm (1H) and 0.05 ppm (15N). Probes falling outside the ±3σ band are labeled. Insets show T6, which lies far outside the plotted range in both panels. Only probes whose cognate perturbation exceeds the thresholds of 0.03 ppm (1H) and 0.25 ppm (15N) are included: n = 29 at I = 110 mM and n = 32 at I = 45 mM.
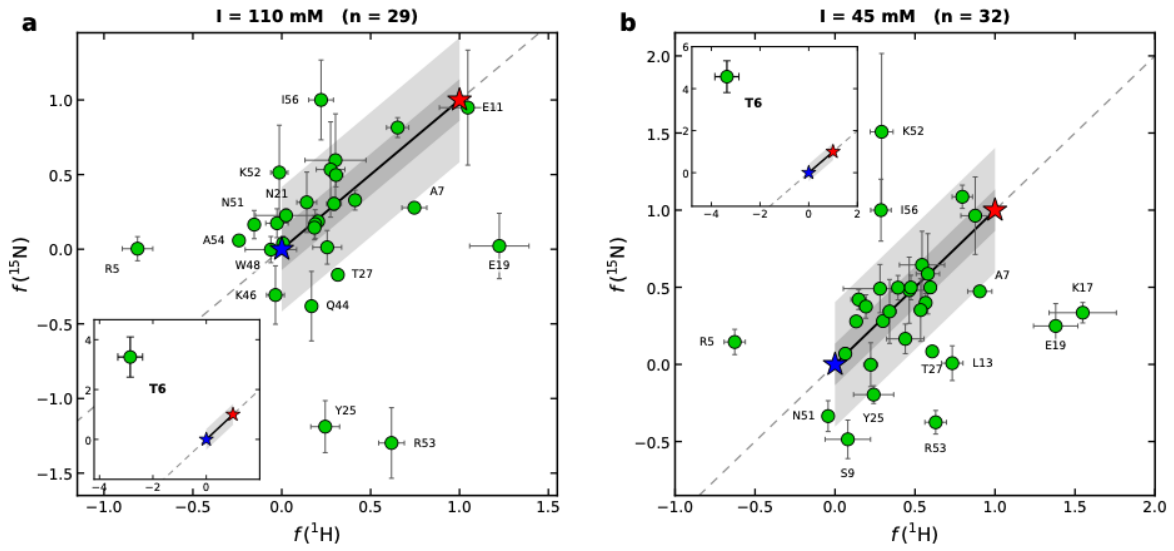
Figure 5.
Amide chemical shift perturbations of enHD on binding (a) the cognate and (b) the non-cognate duplex at I = 110 mM, mapped onto the structure of enHD (PDB 3HDD). The quantity plotted is Δδnet = Δδ(1H) + 0.14 Δδ(15N) between the bound and the free protein. This mapping retains the sign of the net chemical shift perturbations for each 1H-15N pair. Tube radius is proportional to |Δδnet| and color encodes its sign, red for positive and blue for negative in (a), green for positive and blue for negative in (b). A positive sign means the net move of the 1H-15N resonance pair is downfield (deshielded) and a negative sign means the net move is upfield (shielded). Full scale is ±1.2 ppm in (a) and ±0.29 ppm in (b).
Figure 5.
Amide chemical shift perturbations of enHD on binding (a) the cognate and (b) the non-cognate duplex at I = 110 mM, mapped onto the structure of enHD (PDB 3HDD). The quantity plotted is Δδnet = Δδ(1H) + 0.14 Δδ(15N) between the bound and the free protein. This mapping retains the sign of the net chemical shift perturbations for each 1H-15N pair. Tube radius is proportional to |Δδnet| and color encodes its sign, red for positive and blue for negative in (a), green for positive and blue for negative in (b). A positive sign means the net move of the 1H-15N resonance pair is downfield (deshielded) and a negative sign means the net move is upfield (shielded). Full scale is ±1.2 ppm in (a) and ±0.29 ppm in (b).
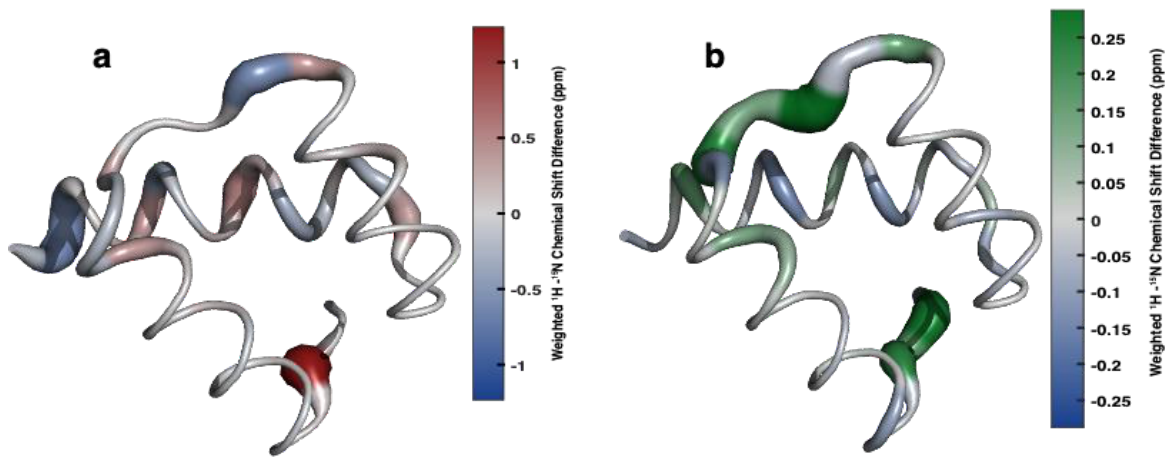
Disclaimer/Publisher’s Note: The statements, opinions and data contained in all publications are solely those of the individual author(s) and contributor(s) and not of MDPI and/or the editor(s). MDPI and/or the editor(s) disclaim responsibility for any injury to people or property resulting from any ideas, methods, instructions or products referred to in the content. |
© 2026 by the authors. Licensee MDPI, Basel, Switzerland. This article is an open access article distributed under the terms and conditions of the Creative Commons Attribution (CC BY) license (http://creativecommons.org/licenses/by/4.0/).
Copyright: This open access article is published under a Creative Commons CC BY 4.0 license, which permit the free download, distribution, and reuse, provided that the author and preprint are cited in any reuse.