

Submitted:
13 November 2026
Posted:
16 November 2026
You are already at the latest version
Abstract
Romania and India followed contrasting agricultural pathways towards food and nutrition security, and the EU–India Free Trade Agreement, concluded in January 2026 and expected to enter into force in 2027, will link them through trade. We compare how both countries convert production into food and nutrition security, establishing an ex-ante baseline for the agreement. Using FAOSTAT, Eurostat and EU geographical indication data (1961–2024), we analysed yields, food supply, access, input use, emissions and stability, with bootstrapped Chow tests, autocorrelation-robust trend tests and variance tests. Structural breaks around the 1989–1991 reforms reflected input collapse in Romania and Green Revolution exhaustion in India. Romania’s low-input system had lower farm-gate emissions per kilogram of protein than India and the EU, but seven times higher cereal yield variability than India’s irrigated system. Animal protein shares rose in parallel without convergence (56% versus 27%). Despite 3711 kcal per capita, 15.2% of Romanians experienced moderate or severe food insecurity. Foods excluded from liberalisation supplied over half of Romania’s and three-quarters of India’s dietary energy. Both countries underuse certified traditional products. The agreement leaves staples untouched; progress towards SDG 2 Zero Hunger requires better access in Romania, lower input intensity in India and climate-resilient production in both.
Keywords:
food and nutrition security
; sustainable intensification
; low-input agriculture
; nutrition transition
; food access
; EU–India Free Trade Agreement
; traditional food products
; Romania
; India
1. Introduction
Food security exists when all people, at all times, have physical and economic access to sufficient, safe and nutritious food that meets their dietary needs and food preferences for an active and healthy life [1]. The concept rests on four pillars—availability, access, utilisation and stability [2]—and remains at the core of Sustainable Development Goal (SDG) 2 Zero Hunger of the United Nations 2030 Agenda for Sustainable Development [3], within which SDG - 2 Zero Hunger has a transversal, catalytic role in relation to the other goals [4]. Agriculture is expected to supply nutritious food for a growing population without permanently degrading land, water and biodiversity, in a climate that is becoming increasingly variable [5]. A growing body of work also argues that food security has an ethical dimension, linked to the fairness of access and to the responsibilities of actors along the food chain [6,7,8].
The literature describes two broad routes towards this goal (input-intensive agricultural intensification and low-input or agroecological systems) and an equally open debate on the role of trade in food security; these strands, together with the literature on the nutrition transition, production stability and traditional food systems, are reviewed in Section 2.
Romania and India illustrate these opposing routes. India followed the intensification model: nitrogen use per hectare has increased almost continuously, and close to half of its cropland is irrigated. Its diet is predominantly plant-based, with a large contribution from milk and pulses. After 1990, Romania went through an abrupt de-intensification, with a collapse in fertiliser use and the abandonment of most of its irrigation infrastructure, while its diet became dominated by animal products. Despite these differences, the two countries share several structural features. Both underwent major economic reforms almost simultaneously, in 1989–1991, although of different depth: Romania abandoned central planning and collectivised agriculture, whereas India’s 1991 liberalisation was primarily macroeconomic, and its agriculture remained strongly supported by the state through minimum support prices, input subsidies and public procurement. Both have agricultural sectors with very large numbers of small holdings: Romania alone accounted for 31.8% of all farms in the European Union (EU) in 2020 [9], while small and marginal holdings represented about 86% of operational holdings in India [10]. Both are also net cereal exporters: Romania is one of the main cereal exporters of the EU, and India is the world’s largest rice exporter, although it exports only about one-tenth of its cereal production (Section 4.4). This combination of strong contrasts and shared features makes the two countries a suitable pair for a most-different-systems comparison [11,12].
The comparison now also has practical relevance. On 27 January 2026, the EU and India concluded negotiations on a free trade agreement (FTA), the largest ever concluded by either party [13]. The agreement is therefore very recent: the European Commission proposed its signature and conclusion to the Council only in September 2026 [14], and at the time of writing (November 2026) it had not yet entered into force, which is expected in 2027 [15], so that its effects cannot yet be observed. Agriculture was among the most sensitive chapters, and both sides excluded their staple products from liberalisation. Agri-food trade between Romania and India is, at present, marginal: in 2025, Romanian exports to India amounted to EUR 378 million in goods and services, of which agri-food products accounted for only about EUR 1 million (less than 0.3%) mainly because of high Indian tariffs [16]. The food systems of the two countries are therefore only weakly connected through trade. The agreement opens a new trade space that may link them, and its consequences for food and nutrition security on both sides will depend on the productive and nutritional profiles of the partners. Assessments of the FTA have so far focused on trade and industrial effects; a baseline from the perspective of food and nutrition security is missing. Earlier comparisons of Romania with its neighbours [17] and of protein supply structures in other transition regions [18] provide a methodological starting point for such an assessment.
The aim of this study is to compare how Romania and India have converted agricultural production into food and nutrition security over 1961–2024 and to establish a food and nutrition security baseline for the EU - India FTA. Specifically, the study (i) assesses the efficiency of production, (ii) the nutritional quality of the food supply and access to food, and (iii) the environmental costs and stability of the two production models, and (iv) evaluates the exposure of national diets to the agreement and (v) the valorisation of traditional products and production systems. The study addresses six research questions (RQ):
- RQ1. How have crop yields and the structure of agricultural production evolved in Romania and India over 1961–2024, and did the reforms of 1989–1991 produce structural breaks in yield trends?
- RQ2. How has agricultural production been converted into food supply, dietary protein structure and access to food in the two countries?
- RQ3. What environmental costs—input use and greenhouse gas emissions—are associated with the two production models?
- RQ4. How stable are agricultural production and food supply in the two systems, and through which channels is stability ensured?
- RQ5. To what extent are the national diets of the two countries exposed to liberalisation under the EU–India FTA?
- RQ6. How are certified traditional products and traditional production systems valorised in the two countries?
Based on the literature on agricultural intensification, the nutrition transition, production stability and trade liberalisation reviewed in Section 2, a testable hypothesis (H) was formulated for each research question. Hypotheses H1–H4 are tested with the statistical procedures described in Section 3.4 or by direct comparison of indicators, while H5 and H6 are assessed through the classification of food items under the FTA and the analysis of quality schemes and traditional production systems. Each hypothesis carries the same number as the research question it answers:
- H1. Yield trends in both countries show structural breaks around the 1989–1991 reforms, but driven by different mechanisms: the collapse of input use in Romania and the exhaustion of Green Revolution gains in India.
- H2. The share of animal protein in total protein supply has increased in both countries, but without convergence between them.
- H3. India’s intensified production model has a higher input intensity (mineral fertilisers and irrigation) and a higher environmental cost per unit of food supplied than Romania’s low-input model.
- H4. Romania’s rainfed, low-input production system has significantly lower yield stability than India’s irrigated, intensified system.
- H5. Foods excluded from liberalisation under the EU–India FTA supply most of the dietary energy and protein in both countries.
- H6. Both countries have internationally recognised traditional production systems (transhumant sheep farming in Romania and millet cultivation in India), but make limited use of certified quality schemes to valorise them.
The results show that the two countries have built food security models with opposite strengths and weaknesses. Romania’s low-input model has the lowest environmental cost per unit of protein but highly unstable yields and a serious problem of access to food despite abundant supply. India’s intensified model is stable but input-intensive, and its diet shows qualitative deficiencies. The FTA leaves the staple foods of both countries untouched and opens opportunities in niche markets and for the valorisation of traditional production systems.
2. Literature Review
2.1. Search Strategy
The literature was identified through searches in the Web of Science Core Collection, supported by the Web of Science Research Assistant (Clarivate), and Google Scholar, complemented by Crossref, which was also used to verify the bibliographic data and digital object identifiers of all cited works. Search strings combined terms related to food and nutrition security (“food security”, “nutrition security”, “food supply”, “food access”, “double burden of malnutrition”), agricultural pathways (“Green Revolution”, “sustainable intensification”, “low-input agriculture”, “post-socialist agriculture”, “irrigation”, “fertiliser use”), stability and climate risk (“yield variability”, “drought”, “self-sufficiency”, “public distribution system”), traditional food systems (“geographical indications”, “traditional products”, “transhumance”, “millets”) and the countries studied (“Romania”, “India”, “Eastern Europe”, “South Asia”). Peer-reviewed articles, books and book chapters published in English were considered, with priority given to studies published after 2000 and to classic methodological works.
Because several topics of this study are documented mainly outside academic journals, the search was extended to grey literature. This included reports and databases of the Food and Agriculture Organization of the United Nations, the European Commission and Eurostat, the Government of India, UNESCO and the United Nations General Assembly, as well as Romanian legislation and official communications. Grey literature was used only for factual information (legal provisions, negotiated outcomes, registrations and official statistics), not for interpretation. The searches were conducted between August -November 2026, and the reference lists of key studies were screened for additional sources.
2.2. Agricultural Pathways: Intensification Versus Low-Input Systems
The dominant route to higher food availability in the second half of the twentieth century was the Green Revolution, which combined high-yielding varieties, mineral fertilisers and irrigation and transformed cereal production in Asia, including India [19]. Its limits became visible from the late 1980s onwards: slowing yield growth, declining input efficiency, soil degradation and pressure on water resources [19,20]. In response, Swaminathan proposed an “evergreen revolution”, defined as productivity gains without ecological harm [21], while the broader concept of sustainable intensification seeks to raise output from the same land with lower environmental costs [5,22]. Low-input and extensive systems sit at the opposite end of this spectrum: they place less pressure on the environment but usually achieve lower and less stable yields. In Central and Eastern Europe, the shift towards low-input farming was not a deliberate choice but a consequence of the post-1989 transition, during which land restitution, farm fragmentation, the loss of access to credit and inputs and the breakdown of collective infrastructure reshaped agricultural production [23]. Romania and India thus represent two real-world versions of these pathways, which have rarely been compared directly.
2.3. Nutrition Transition, Access to Food and the Double Burden of Malnutrition
Rising incomes and urbanisation shift diets from cereals and pulses towards animal products, fats and sugar, a process described as the nutrition transition [24]. The transition improves energy and protein supply but brings new problems, as undernutrition and micronutrient deficiencies increasingly coexist with overweight and obesity—the double burden of malnutrition [25]. In India, this double burden has been documented at the national level [26], while milk has become the main source of animal protein following the cooperative dairy development launched with Operation Flood [27]. For Romania and neighbouring countries, previous studies have shown high energy and protein supply, a growing share of animal products and persistent inequalities in access to food [6,17]; similar analyses of protein supply structures have been carried out for Sub-Saharan Africa [18]. A related strand of research links food abundance to overconsumption, food waste and the environmental costs of meat-centred diets [28,29,30,31] and argues that food security also has an ethical dimension, concerning the fairness of access and the responsibilities of actors in the food system [7,8]. Evidence that aggregate economic growth does not automatically improve access to food [32] further supports the view that availability alone is an insufficient measure of food security. Healthy and sustainable reference diets, in turn, recommend a largely plant-based protein structure [33].
2.4. Stability, Climate Risk and Trade
Stability, the fourth pillar of food security [2], depends on both production systems and market arrangements. In southern Romania, drought has repeatedly reduced crop yields, and the link between drought and yields became stronger after 1989 as irrigation systems deteriorated [34,35]; recent studies confirm the growing frequency and severity of droughts and their impact on maize production [36,37]. In India, cereal yields remain sensitive to climate variability [38], but irrigation and public stockholding have reduced production and consumption risks, at the cost of groundwater depletion in the north of the country [39]. Indian food security policy relies on public procurement, stocks and the Public Distribution System, expanded by the National Food Security Act of 2013 [40], whose effectiveness and fiscal costs are still debated [41,42]. The role of trade is equally contested: openness can stabilise supplies, whereas self-sufficiency strategies aim to reduce exposure to external shocks; the choice depends on the commodity and the national context [43]. Empirical evidence on the effects of free trade agreements on food trade comes mainly from other regional contexts; for example, the first phase of the China–Pakistan agreement was positively associated with Pakistan’s vegetable exports to China, whereas its second phase had no measurable effect [44].
2.5. Traditional Products and Traditional Production Systems
Quality schemes for traditional products are increasingly seen as tools for adding value to local food heritage. In the EU, protected designations of origin, protected geographical indications and traditional specialities guaranteed protect product names linked to a territory or a traditional method [45]; Romania additionally operates a national certification scheme for traditional products [46]. India protects geographical indications through a national register, in which agricultural goods and foodstuffs account for a significant share of registrations [47]. Beyond certified products, some traditional production systems have gained international recognition: transhumance, the seasonal movement of livestock, was inscribed in 2023 on the UNESCO list of intangible cultural heritage, with Romania among the submitting countries [48], and the United Nations declared 2023 the International Year of Millets [49]. Millets are valued for their drought tolerance and nutritional quality [50], and partially replacing rice with alternative cereals could reduce irrigation water demand and improve nutrient supply in India [51].
2.6. Research Gap
The literature reviewed shows extensive research on each pathway taken separately - the Green Revolution and its limits in India, the post-socialist transition in Romania - but no direct comparison of how the two countries convert agricultural production into food and nutrition security. Existing assessments of the EU–India FTA focus on trade and industrial effects, without a baseline from the perspective of food and nutrition security. A literature search in the Web of Science Core Collection, assisted by the Web of Science Research Assistant, and in Google Scholar identified no study assessing the implications of the EU - India agreement for food and nutrition security. The closest studies addressed sustainable initiatives and emerging challenges in agri-food supply chains [52,53], resource efficiency and circularity in the Indian agri-food sector [54], and the effects of other free trade agreements on food trade [44]. This absence is not surprising, given that negotiations were concluded only in January 2026 and the agreement is expected to enter into force only in 2027 [14,15]. An ex-ante assessment is therefore both timely and necessary: the baseline established here provides the reference point against which the actual effects of the agreement can be measured ex-post. Studies on traditional products rarely distinguish between certified products, recognised production systems and the agricultural commodities produced in these systems.
This study addresses these gaps by combining the four pillars of food security, the environmental costs of production and the treatment of foods under the FTA in a single comparative framework.
3. Materials and Methods
3.1. Study Design and Case Selection
The study uses a comparative design of two contrasting cases (most different systems design and paired comparison) [11,12]. Romania and India differ in the size of their agricultural economies, dietary patterns and farm organisation, but share three structural features: major economic reforms in 1989–1991 (the end of central planning in Romania and the macroeconomic liberalisation of 1991 in India, where agriculture nevertheless remained strongly state-supported), the predominance of small holdings and their position as net cereal exporters. Both are also covered, directly or through the EU, by the same free trade agreement, concluded on 27 January 2026 but not yet in force. Because the design includes only two cases, it is used to describe and contrast pathways rather than to identify causal effects (Section 5.6). To separate country-specific features from regional trends, each country is benchmarked against its region, Romania against Eastern Europe and the EU-27, India against South Asia, while the world average serves as a common reference. The analysis covers 1961–2024, depending on data availability. The order “Romania–India” follows the name of the agreement (EU–India) and is kept throughout the text. The conceptual framework of the study, linking the research questions, hypotheses, indicators, and statistical methods, is shown in Figure 1.
3.2. Data Sources
All data are publicly available and were retrieved on 5 November 2026 (Table 1). FAOSTAT provided the production, food balance, input, land use, emissions and food security series [55]; Eurostat provided household food deprivation data [56] and bilateral trade data [57]; the EU register of geographical indications was downloaded in full [45]; and the treatment of agri-food products under the FTA was taken from official documents of the European Commission [58,59] and the Government of India [60].
3.3. Indicators
Yield dynamics. For each crop, five-year averages were calculated at the beginning of the period (1961–1965), before the reforms (1986–1990) and at the end (2020–2024), to reduce the influence of extreme years. Growth rates were estimated as the slope b of log-linear trends:
where Yt is the yield in year t; 100·b approximates the average annual growth rate (%).
ln Yt = a + b·t + εt,
Structure of the food supply. The share of animal protein in total protein supply was computed as
and the share of cereals in dietary energy was calculated analogously. Dietary diversity was measured with the Shannon index [61], applied to the energy supplied by the 19 food groups of the FAO food balance sheets:
where pi is the share of group i in total energy supply. Alcoholic beverages are retained in the energy and diversity calculations because the FAO food balance sheets include them in dietary energy supply; they are not otherwise discussed as food products. The same food balance framework has been used to analyse protein supply structures in other regions [18]. Access to food was described using the prevalence of undernourishment, the Food Insecurity Experience Scale (FIES), adult obesity and anaemia in women of reproductive age [55], and the share of the population unable to afford a meal with meat, fish or a vegetarian equivalent every second day [56].
APS = (Panimal / Ptotal) × 100,
H′ = −Σ pi ln pi,
Environmental cost. Three indicators were used: mineral fertiliser use per hectare of cropland, the share of cropland actually irrigated, and farm-gate emissions per kilogram of protein supplied:
where EFG is farm-gate emissions (kg CO₂eq, FAO Tier 1, AR5), Pcap is protein supply (g per capita per day) and N is population. Emission intensities per kilogram of product were taken directly from FAOSTAT.
Ep = EFG / (Pcap × N × 365/1000),
Stability. For 1991–2024, a linear trend in log yields was estimated for each crop, and annual deviations from the trend were computed as
dt = ln Yt − (â + b̂·t).
The standard deviation of dt, expressed in percent, measures yield variability; years with dt < −0.15 were classified as shock years. The same procedure was applied to dietary energy supply for 2010–2023. The trade position for cereals was described by the self-sufficiency ratio,
where Q is production, M imports, X exports and ΔS the change in stocks; the denominator is the domestic supply quantity of the food balance sheets. To avoid mismatches between harvest years and export years, SSR was computed on three-year totals.
SSR = Q / (Q + M − X − ΔS) × 100,
Exposure of diets to the FTA. Each item of the food balance sheets was assigned to one of four categories—protected (excluded from concessions), partial (tariff-rate quotas or partial reductions), liberalised and not specified—on the basis of official documents [58,59,60]. For Romania, the EU treatment of imports from India was applied; for India, the Indian treatment of imports from the EU. The share of each category in dietary energy and protein (average 2021–2023) was calculated as
Sc = Σi∈c xi / Σi xi × 100.
Traditional products and production systems. Three levels were distinguished: (i) traditional products with legal protection or certification—protected designations of origin (PDO), protected geographical indications (PGI) and traditional specialities guaranteed (TSG) in the EU register [45], products certified under the Romanian national scheme [46] and geographical indications registered in India [47]; (ii) traditional production systems with international recognition, namely transhumant sheep farming in Romania [48] and millet cultivation in India [49]; and (iii) the agricultural commodities produced in these systems, which are not themselves certified traditional products. For Romania, registered EU geographical indications were compared with the mean and median of EU Member States. Two emblematic low-input systems were analysed with FAOSTAT data: millet in India (area, yield, production and food supply) and sheep farming in Romania (stocks, milk and meat production, share in the EU-27).
3.4. Statistical Analysis
Structural breaks in yield trends (H1) were tested with the Chow test [62], with the break fixed at 1990, applied to the log-linear model in Equation (1). To avoid imposing the break year, the sup-F statistic—the maximum Chow statistic over candidate break years 1975–2010—was also computed, following the Quandt–Andrews approach [63]; the year at which the maximum occurs is reported as the estimated break year. Because the sup-F statistic does not follow the standard F distribution and both statistics are sensitive to serially correlated errors, p-values were also obtained with a parametric bootstrap: for each series, 2000 series were simulated under the null hypothesis of a single log-linear trend with first-order autoregressive (AR(1)) errors estimated from the residuals, and the p-value was computed as the share of simulated statistics at least as large as the observed one. Trends in the share of animal protein (H2) were tested with linear regression and the non-parametric Mann–Kendall test [64,65] for 1990–2023; because the annual shares are strongly autocorrelated, OLS p-values were also computed with Newey–West heteroskedasticity and autocorrelation consistent standard errors (three lags) [66], and the modified Mann–Kendall test of Hamed and Rao [67] was applied; convergence between the two countries was assessed through the slope of the difference between them, separately for 1961–1989 and 1990–2023. Differences in yield variability (H4) were tested with the one-sided F test for the ratio of variances (alternative hypothesis: larger variance in Romania, as stated in H4) and with the Brown–Forsythe test [68], which is more robust to departures from normality. The significance level was 0.05. Calculations were performed in Python (pandas, NumPy, SciPy, statsmodels and pymannkendall); the processed data and the calculations for Equations (1)–(7), implemented as Excel formulas, are provided in Supplementary Workbook S1.
3.5. Data Limitations
Several limitations should be noted. First, food balance sheets after 2010 follow a revised FAO methodology; the series were linked at 2010, and in the overlapping years 2010–2013 the two versions differ by less than 4% for energy and by at most 3 g for protein. Second, official Romanian statistics from the 1980s were systematically overstated—the 1987 cereal harvest was officially reported at 31.7 million tonnes, against about 18.6 million tonnes estimated by the United States Department of Agriculture [69,70]. The FAOSTAT series used here (16.9 million tonnes for 1987) do not reproduce the official figures of the period, but comparisons before and after 1990 remain subject to greater uncertainty for the 1980s. Similarly, Romanian pulse yields in the early 1960s (0.13 t/ha) were unusually low, so the high pre-1990 growth rate of Romanian pulses should be read with caution, and Romanian rice is grown on a very small area, so its yield results are less robust than those for the main crops. Third, emissions per kilogram of protein relate production-based emissions to domestic protein supply without adjusting for trade; for a net cereal exporter such as Romania, the indicator therefore tends to overstate emissions. India is also a net exporter, mainly of rice and buffalo meat, so the bias has the same direction in both countries; given Romania’s much larger export share of cereals (69.5% versus 11.1% of production in 2021–2023), a trade adjustment would be unlikely to reverse the ranking of the two countries. Fourth, Romanian trade includes intra-EU flows in both directions. Fifth, the classification of products under the FTA is based on official documents published so far, not on the final legal text; items not named in these documents were conservatively classified as “not specified”. At the time of writing, the agreed text was still undergoing legal revision before signature [14]; because the classification was made at the level of food balance sheet items, and the main protected and liberalised products are named explicitly in the official documents, changes at the tariff-line level are expected to affect mainly items of small dietary weight. Finally, the national Indian register of geographical indications and the EU register apply different criteria and are not directly comparable.
During this study, the authors used the Web of Science Research Assistant (Clarivate) to identify the relevant scientific literature, and Claude (Anthropic; Claude Opus 5.5) to write scripts for data retrieval and processing, perform statistical calculations, and edit text. In addition, Grammarly (Grammarly, Inc.) was used for grammar correction, rephrasing, and language polishing. The authors verified the results, interpreted the data, and take full responsibility for the content of this publication.
4. Results
4.1. Yields and Production Structure (RQ1, H1)
At the beginning of the period, Romania’s cereal yields were almost twice those of India: 1.61 t/ha versus 0.94 t/ha in 1961–1965 (Table 2, Figure 2). By the late 1980s, both countries had roughly doubled their yields, to 3.07 t/ha in Romania and 1.75 t/ha in India. After 1990, the trajectories diverged. Romanian cereal yields rose only to 3.95 t/ha in 2020–2024, while Indian yields reached 3.54 t/ha, narrowing the gap between the two countries from 71% to 12%. Both remained below the world average (4.18 t/ha) and well below the EU-27 (5.38 t/ha). The gap with the EU was largest for maize, Romania’s main crop: 3.98 t/ha versus 7.06 t/ha.
The crop-level comparison reveals two different patterns of specialisation. Wheat yields rose from 1.46 to 4.00 t/ha in Romania and from 0.84 to 3.52 t/ha in India, so the difference between the two countries almost disappeared. Rice, India’s staple, reached 4.23 t/ha in 2020–2024, almost three times the level of 1961–1965. Pulses showed the opposite pattern: Romania obtained higher yields (1.47 versus 0.91 t/ha) but produced only 0.14 million tonnes per year, while India produced 26.0 million tonnes. Millet, India’s traditional cereal, increased its yield 3.4-fold (from 0.42 to 1.42 t/ha), while its area halved. The difference in scale was large: India produced 363 million tonnes of cereals and 230 million tonnes of milk per year (2020–2024 average), compared with 20.7 and 4.3 million tonnes in Romania. The cereal area grew from 92.2 to 107.7 million ha in India (1961–2024) and declined from 7.0 to 5.1 million ha in Romania.
The Chow test, applied to the log-linear trend model in Equation (1), confirmed a structural break in 1990 for cereals in both countries (asymptotic p < 0.001; AR(1) bootstrap p = 0.011 in Romania and 0.013 in India; Table 3). In Romania, the growth rate of cereal yields, estimated as the slope of Equation (1), fell from 2.79% per year before 1990 to 1.69% per year afterwards; the endogenously estimated break occurred in 1992 for cereals and in 1991 for wheat, immediately after the dissolution of agricultural production cooperatives under the 1991 land law [71] and the collapse of input use. In India, the breaks had a different direction and timing. Growth slowed for cereals (break in 1988) and wheat (break in 1993; from 3.61% to 1.31% per year), as the gains of the Green Revolution were exhausted, but accelerated for maize, from 1.16% to 2.65% per year after 1988. The bootstrap confirmed the breaks for cereals, wheat and pulses in both countries and for maize in India, but not for maize and rice in Romania (bootstrap p ≥ 0.10), whose asymptotic results should therefore be interpreted with caution; for rice in India, only the endogenously estimated break (1983) remained significant (bootstrap p = 0.031). H1 is therefore partly confirmed: structural breaks occurred in both countries around the reforms, but with different causes—the collapse of the input system in Romania (Section 4.3) and the exhaustion of Green Revolution gains in wheat combined with crop diversification in India.
4.2. Food Supply, Protein Structure and Access to Food (RQ2, H2)
Between 1961 and 2023, dietary energy supply increased from 2832 to 3649 kcal per capita per day in Romania and from 2010 to 2668 kcal in India (Table 4; the shares of animal protein and of cereals were calculated with Equation (2) and dietary diversity with Equation (3)). Romania thus exceeded both the EU-27 average (3546 kcal) and the world average (3016 kcal), whereas India remained below the world average despite narrowing the gap. Protein supply followed the same pattern: 112.4 g per capita per day in Romania, practically at the EU-27 level (113.6 g), and 74.6 g in India, below the world average of 92.5 g. The largest increase was in fat supply, which grew 2.5-fold in Romania (from 55.7 to 137.6 g) and doubled in India (from 30.8 to 65.7 g).
Both countries went through a clear nutrition transition, but along different paths. The share of cereals in total energy, calculated analogously to Equation (2), fell from 63.0% to 34.2% in Romania, approaching the Western European structure (EU-27: 25.0%), whereas in India cereals still supplied 51.0% of energy, compared with 62.9% in 1961. Dietary diversity, measured by the Shannon index (Equation (3)), increased in both countries, from 1.54 to 2.18 in Romania and from 1.40 to 1.85 in India, the latter remaining below the world average (2.10).
The key difference between the two countries lies in protein sources (Figure 3). Cereals contributed almost identical amounts of protein in both countries (35.5 g in Romania and 33.9 g in India, average 2021–2023). The difference came from animal-source foods and pulses: meat supplied 28.5 g in Romania and 3.6 g in India, milk 25.4 g and 11.4 g, and pulses 1.1 g and 9.1 g, respectively. India’s profile is thus lacto-vegetarian: milk accounts for more than half of animal protein, and pulses partly compensate for the low meat intake. In Romania, meat and milk contribute almost equally.
The share of animal protein in total protein, calculated with Equation (2), increased from 27.2% in 1961 to 56.1% in 2023 in Romania and from 11.7% to 26.8% in India (Figure 4). In Romania, the increase was interrupted by the transition crisis, with the share falling from 48.0% in 1990 to 43.7% in 2000 before rising again. Both countries remained below their regional references (Eastern Europe: 59.0%; Southern Asia: 28.8%). After 1990, the share of animal protein (Equation (2)) rose significantly in both countries according to the OLS and Mann–Kendall trend tests (Table 5): by 0.35 percentage points per year in Romania (Mann–Kendall τ = 0.66; p < 0.001) and by 0.30 percentage points per year in India (τ = 0.93; p < 0.001); both trends remained significant when autocorrelation was taken into account (Newey–West and modified Mann–Kendall tests, p < 0.001). The difference between them widened in 1961–1989 (mean 24.7 percentage points; slope 0.70 percentage points per year; p < 0.001). In 1990–2023, the mean difference was 30.0 percentage points and its slope was not statistically significant (0.05 percentage points per year; p = 0.25; Newey–West p = 0.46): the two countries are rising in parallel, without convergence. H2 is confirmed.
National averages of food supply do not, however, reflect actual access to food (Table 6). Although Romania has one of the highest energy supplies per capita in Europe (3711 kcal in 2023–2025) and a prevalence of undernourishment below 2.5%, 15.2% of its population experienced moderate or severe food insecurity and 5.3% severe food insecurity—roughly two and three times the Eastern European averages, respectively. In 2025, 18.1% of Romanians could not afford a meal with meat, fish or a vegetarian equivalent every second day (EU-27: 8.5%), a share that rose to 35.8% among people below the poverty threshold. At the same time, 32.4% of adults were obese. In India, the prevalence of undernourishment fell to 9.8%, but anaemia affected 53.7% of women of reproductive age. Both countries thus face a double burden of malnutrition with different manifestations: in Romania, food insecurity coexists with excess weight; in India, micronutrient deficiencies persist, and obesity is present (8.0% of adults).
4.3. Environmental Cost of the Two Production Models (RQ3, H3)
Mineral fertiliser use shows the clearest divergence between the two countries (Table 7, Figure 5). In 1990, Romania used 76.2 kg of nitrogen per hectare of cropland, more than India (44.5 kg/ha). By 2000, after the dismantling of socialist agriculture and the loss of access to subsidised inputs, Romanian use had dropped to 24.2 kg/ha, and the recovery was only partial: 50.2 kg/ha in 2024, about 60% of the EU-27 average (83.2 kg/ha). India followed the opposite path, with nitrogen use rising continuously to 131.8 kg/ha in 2024—2.6 times that of Romania and above the Southern Asian average (120.3 kg/ha). The difference persisted for phosphate (50.0 versus 22.6 kg P₂O₅/ha) and, to a lesser extent, potash (14.2 versus 9.0 kg K₂O/ha). H3 is confirmed with respect to input intensity.
The contrast is even sharper for irrigation (Table 7). Romania has 3.18 million ha equipped for irrigation, inherited from the 1980s, but only 0.52 million ha are actually irrigated (5.9% of cropland). In India, the area actually irrigated corresponds to 49.1% of cropland; it exceeds the equipped area because several crops per year are grown on the same irrigated land. Organic farming covered 5.5% of agricultural land in Romania and 2.5% in India in 2023, both below the EU-27 average (11.1%).
Emission intensities per unit of product did not follow the difference in input use in a uniform way (Table 8): they were similar for cow milk and sheep meat, higher in India for cereals other than rice and for pig meat, and lower in India for chicken meat. Cow milk had almost identical intensities (1.07 kg CO₂eq/kg in Romania and 1.05 in India), both above the EU-27 (0.58). Cereals other than rice had a lower intensity in Romania (0.14) than in India (0.24) and the world average (0.18), despite lower yields, while pig meat had 2.00 versus 4.86 kg CO₂eq/kg. Sheep meat had similar values (14.5 in Romania and 16.3 in India), both well below the EU-27 average (22.9).
The structure of farm-gate emissions differed between the two countries (Figure 6). Enteric fermentation had the same weight in both (39.3% in Romania and 39.2% in India). In India, on-farm energy use (22.0%), largely for pumping irrigation water, and rice cultivation (13.5%) were also important, whereas in Romania synthetic fertilisers (15.0%), manure management (10.4%) and crop residues (7.0%) weighed more. Related to the protein supplied, according to Equation (4), farm-gate emissions were lowest in Romania: 22.0 kg CO₂eq per kg of protein in 2023, compared with 26.7 in India, 32.1 in the EU-27 and 29.7 worldwide (Table 9). Per capita, they amounted to 0.90 t CO₂eq in Romania and 0.73 t in India, both below the EU-27 (1.33 t). These results qualify the second part of H3: India’s intensified model has a much higher input intensity, but not a uniformly higher emission intensity per product; the difference per unit of protein stems mainly from the production structure (rice cultivation and energy for irrigation) and from the lower protein supply per capita.
4.4. Stability of Production and Food Supply (RQ4, H4)
After removing long-term trends with Equation (5), Romanian yields varied far more from year to year than Indian yields (Table 10). In 1991–2024, the standard deviation of cereal yields around the trend was 22.9% in Romania and 3.4% in India—6.8 times higher. The pattern was repeated for all major crops: 21.2% versus 4.3% for wheat, 30.3% versus 5.5% for maize and 26.1% versus 5.5% for pulses. The differences were statistically significant with both the one-sided F test (e.g., F = 45.8 for cereals; p < 0.001) and the Brown–Forsythe test (W = 33.0; p < 0.001). The gap was smaller, but still significant, for crops less dependent on summer rainfall: 12.8% versus 6.4% for potatoes (Brown–Forsythe p = 0.012) and 24.7% versus 12.6% for sunflower (p = 0.025).
Romanian instability was concentrated in shock years (Figure 7). Between 1991 and 2024, cereal yields fell more than 15% below the trend (deviations dt < −0.15, Equation (5)) in eight years: 2000 (−39%), 2002 (−16%), 2003 (−17%), 2007 (−67%), 2009 (−17%), 2012 (−40%), 2020 (−18%) and 2024 (−22%). The most severe coincided with extreme droughts [36,37,72]; in the Oltenia Plain, the link between drought and yields became statistically significant only after 1989, with the gradual degradation of the irrigation system [34], and maize yields in southern Oltenia depend on the water deficit to a degree of about 65% [35]. India recorded no such year for cereals, although its yields remain sensitive to climate variability [38]. H4 is confirmed: the Romanian rainfed, low-input system shows significantly lower yield stability than the Indian intensified and irrigated system, in line with the share of cropland actually irrigated (5.9% versus 49.1%).
Production instability was not, however, transmitted to the food supply (Table 11). In 2010–2023, the variability of dietary energy supply around its trend, calculated with Equation (5), was only 1.11% in Romania and 0.81% in India, so the sevenfold difference in yields shrank to less than 1.4-fold at the level of the diet. The explanation lies in the trade position of the two countries. Romania is a major net cereal exporter: in 2021–2023, its self-sufficiency ratio (Equation (6)) was 175.6%, meaning that production represented 175.6% of domestic supply (127.6% in 2010–2012), and exports represented 69.5% of production. These values include intra-EU trade, which flows in both directions; imports covered 36.0% of domestic supply. In a system with such surpluses, production shocks primarily reduce exported volumes and stocks rather than domestic consumption. India is almost exactly self-sufficient (105.5–111.6%), exports about 11% of its cereal production and imports practically none (0.2%); its stability rests on irrigation and on the public system of stocks and distribution [40,41,42]. The two countries thus ensure stability through different channels: Romania through markets and exports, India through irrigation and public stocks.
4.5. Exposure of Diets to the EU–India Free Trade Agreement (RQ5, H5)
When each food item is classified according to its treatment under the FTA and the shares of each category are calculated with Equation (7), the agreement appears to affect the margins rather than the core of the two diets (Table 12, Figure 8). In India, foods excluded from concessions supplied 76.0% of dietary energy and 77.3% of protein in 2021–2023, led by rice (643 kcal per capita per day), wheat (550 kcal), milk (209 kcal; 11.4 g protein), sugar (174 kcal), pulses (99 kcal; 6.4 g protein), ghee and millet. The only liberalisation relevant to the diet concerns vegetable oils, for which Indian tariffs fall to zero [59]; together with alcoholic beverages they supply 9.5% of energy but only 1.0% of protein. In Romania, foods protected by the EU against imports from India supplied 52.2% of energy and 61.4% of protein: wheat (954 kcal; 29.1 g protein), milk and dairy products (457 kcal; 25.4 g protein), sugar (267 kcal) and poultry (93 kcal; 10.9 g protein). The rest of the diet consists mainly of foods not named in the official documents (46.0% of energy and 36.4% of protein), such as sunflower oil, pig meat, maize, potatoes and animal fats. These products play no real role in trade with India: in 2024, EU-27 imports from India of pig meat, potatoes, maize and sunflower and soybean oils together amounted to less than EUR 0.5 million out of a total of EUR 4.49 billion for HS chapters 01–24 [57]. The tariff-rate quotas opened by the EU for sheep and goat meat, grapes and onions concern only 1.6% of Romanian dietary energy.
H5 is confirmed. The food groups excluded from liberalization (staple cereals, dairy, sugar and poultry) supply most of the energy and protein in the diets of both countries: more than three-quarters in India and more than half in Romania. The agreement mainly opens trade in high-value products (such as olive oil, processed foods and sheep meat), leaving the staple foods of both countries untouched. For Romania, the FTA creates export opportunities rather than pressure on domestic consumption: Indian tariffs on sheep meat fall from 33% to zero and those on processed foods from 50% to zero [59].
4.6. Traditional Products and Traditional Production Systems (RQ6, H6)
Both countries possess an important heritage of traditional products and production systems but make limited use of internationally recognised quality schemes (Table 13). In the EU register of geographical indications, Romania has only 16 protected agricultural products and foodstuffs, ranking 16th of the 27 Member States, below the EU median of 21 and well below the mean of 58.6 [45]. The first was registered only in 2009 (Magiun de prune Topoloveni), and most are meat products, cheeses and processed fish, such as Salam de Sibiu, Telemea de Ibănești, Telemea de Sibiu, Cașcaval de Săveni and Novac afumat din Țara Bârsei; two further foodstuffs are under registration. At the national level, more than 790 products had been certified as traditional by January 2025 [46,73], but this national scheme is not recognised at the EU level. India has about 700 geographical indications in its national register, of which 31.5% are agricultural goods and 7.8% foodstuffs [47], but only two in the EU register, both teas: Darjeeling (2007) and Kangra tea (2008); the application for Basmati is still pending.
Millet, a cereal of low-input systems whose importance was recognised when the United Nations declared 2023 the International Year of Millets at India’s initiative [49], illustrates the Indian case (Figure 9). Between 1961 and 2024, the millet area fell from 18.7 to 8.8 million ha, while yields increased 3.4-fold (from 0.42 to 1.42 t/ha, five-year averages for 1961–1965 and 2020–2024; Table 2) and production rose from 7.7 to 12.6 million tonnes. Its place in the diet, however, halved, from 131 to 68 kcal per capita per day, while sorghum fell from 139 to only 20 kcal.
In Romania, sheep farming—largely practised in extensive and transhumant systems recognised by UNESCO in 2023 as intangible cultural heritage [48]—is the sector with the largest European weight (Table 14). With 10.4 million head in 2024, Romania has the second largest sheep flock in the EU after Spain (18.5% of the EU-27 flock), ranks fourth in sheep milk production (434 thousand tonnes; 14.7% of the EU) and produces 11.6% of EU sheep meat. The sector went through the same post-1990 collapse as agriculture as a whole: the flock fell from 15.4 million head in 1990 to 8.1 million in 2000 before partly recovering.
H6 is confirmed. Both countries have recognised traditional production systems, linked to low-input or mixed farming, but make limited use of certified quality schemes: Romania has few foodstuffs protected at the EU level, and Indian millet has lost its place in the diet despite rising yields. The FTA and the parallel negotiations on geographical indications, which are still ongoing [13], provide a framework for valorisation, although its concrete effects will depend on the outcome of these negotiations.
5. Discussion
5.1. Two Pathways After the Reforms (H1)
The results show that 1990 was a turning point for agriculture in both countries, but for different reasons. In Romania, the slowdown in yield growth after 1991–1992 coincides with the collapse of fertiliser use (from 76 to 24 kg N/ha within a decade) and the abandonment of the irrigation system, with 3.2 million ha equipped but less than 0.6 million ha actually irrigated. The post-socialist disorganisation of Eastern European agriculture—fragmentation of land after restitution, loss of access to credit and inputs, and the breakdown of collective infrastructure—has been widely documented [23]. Our results add a less discussed dimension: these changes transformed not only the level but also the stability of production, a finding consistent with the post-1989 increase in the climate sensitivity of yields in southern Romania [34,35]. In India, the slowdown in wheat and total cereal growth after 1988–1993 matches the exhaustion of Green Revolution gains reported in the literature [19,20], while the acceleration in maize and pulses points to crop diversification rather than stagnation. Because India’s 1991 reforms were mainly macroeconomic and left agricultural support largely in place, the Indian breaks reflect technological rather than institutional change and do not coincide exactly with the reform year. H1 is thus partly confirmed: the reforms mark breaks in both countries, but through opposite mechanisms—Romania lost its input system, whereas India exhausted one model of intensification and moved towards diversification.
5.2. A Nutrition Transition Without Convergence and the Limits of Availability (H2)
Both countries have passed through the classic stages of the nutrition transition: a declining share of cereals in energy, rising fat and animal protein, and greater dietary diversity [24]. The trend tests show, however, that Romania and India are moving in parallel, without convergence. India’s lacto-vegetarian protein structure, in which milk supplies more than half of animal protein and pulses partly compensate for low meat intake, is closer than the Romanian profile to the recommendations for healthy and sustainable diets [33]. The dairy orientation of the Indian diet reflects, among other factors, the cooperative dairy development launched in 1970 through Operation Flood, which raised the growth rate of milk production to more than 4% per year [27]; according to FAOSTAT [55], milk production increased about twelvefold, from 20.8 million tonnes in 1970 to 247.8 million tonnes in 2024 (Supplementary Workbook S1, Table S2). Similar contrasts between plant- and animal-based protein structures have been documented in Romania and its neighbours [17] and in Sub-Saharan Africa [18], and the environmental cost of Romania’s meat-centred diet in terms of land and natural resources has been highlighted previously [29,30].
The most important result of this section, however, concerns the gap between availability and access. With 3711 kcal per capita per day, Romania exceeds the EU average, yet 15.2% of its population experiences moderate or severe food insecurity and 18.1% cannot afford a complete meal every second day (35.8% among people below the poverty threshold), while almost one third of adults are obese. The coexistence of surplus and lack of access confirms that food security cannot be reduced to the availability pillar. Romania’s problem lies in the distribution of food resources and in the double burden of malnutrition [25]. This interpretation is consistent with earlier analyses linking abundance in the food system to overconsumption, waste, unequal access and the need for an ethical approach to food security [6,7,8,28,31], and with evidence that aggregate economic growth does not automatically translate into improved access [32]. In India, the same gap takes another form: undernourishment has fallen below 10%, but anaemia affects more than half of women of reproductive age, and overweight is rising [26], a qualitative rather than quantitative deficit. In both countries, therefore, progress towards SDG 2 depends on progress in reducing poverty and inequality and in improving health, in line with the interdependence of the goals of the 2030 Agenda [3,4].
5.3. The Trade-Off Between Inputs, Stability and Environmental Cost (H3, H4)
The results reveal a clear trade-off between the two production models. Romania’s low-input system has the lowest environmental cost per unit of protein among all references analysed (22.0 kg CO₂eq/kg, compared with 32.1 in the EU-27), but pays for it with yields seven times more unstable, with eight shock years in three decades, the most severe of which were associated with extreme droughts [36,37]. India’s intensified and irrigated model achieves remarkable yield stability, with 2.6 times more nitrogen per hectare and higher emissions per unit of protein, driven by rice cultivation and energy for pumping water. Its stability also has a hidden cost: irrigation has led to substantial groundwater depletion in northern India [39]. Neither model therefore corresponds to sustainable intensification, high and stable yields with low environmental cost [5,22]. For Romania, the suggested direction is stabilisation rather than intensification at any price: restoring effective irrigation and adapting to drought could reduce volatility without a proportional increase in chemical inputs. For India, the opposite challenge is to reduce input intensity and pressure on water without losing stability, in the spirit of the “evergreen revolution”, productivity gains without ecological harm [20,21]. Resource efficiency and circularity within the Indian agri-food sector have already been examined empirically from this perspective [54].
An unexpected result is that the instability of Romanian production is not transmitted to the diet: the variability of energy supply (1.1%) is close to that of India (0.8%). Romania stabilises through markets, producing more than one and a half times its domestic cereal supply and absorbing shocks through exports and stocks, whereas India stabilises through irrigation and the public system of stocks and distribution, extended by the 2013 food security law [40,41]. Both strategies have limits. Market-based stabilisation protects national consumption but not the incomes of Romanian farmers, who bear the full impact of climate shocks. Stabilisation through public stocks has high fiscal costs and contested efficiency [42].
5.4. The EU–India Agreement and the “Red Lines” of Food Security (H5)
The dietary analysis shows that the EU - India FTA liberalises trade at the margins of the food systems rather than at their core. The foods excluded from liberalisation supply more than three-quarters of energy and protein in the Indian diet and more than half in the Romanian diet, while Romanian foods with unspecified treatment are not the subject of real import flows from India. This finding feeds into the debate between self-sufficiency and trade openness as food security strategies [43]. Both parties applied the same logic: they opened trade in high-value products and kept staple foods protected—drawing, in effect, “red lines” of food security. For India, the protection of cereals, milk and pulses also protects the livelihoods of a very large farming population, the dairy cooperatives and the public distribution system. Conversely, India liberalised vegetable oils, for which imports covered about two-thirds (67.1%) of its domestic supply in 2023 according to FAOSTAT food balances, an area of structural dependence rather than self-sufficiency. For the EU, the protection of meat, sugar and rice reflects the political sensitivity of the agricultural sector. Beef illustrates this sensitivity from both sides. India is one of the world’s leading meat exporters, but its exports consist almost entirely of buffalo meat (carabeef), not beef, and in this product India has shown a consistent revealed comparative advantage [74]. Because the EU tariff headings for beef (Harmonized System, HS 0201–0202) also cover buffalo meat, Indian carabeef falls within the protected category. Romanian beef, by contrast, has long been weak in quality terms, with most cattle carcasses graded in the lower conformation and fat classes of the EUROP system [75]. Keeping this category protected therefore also shields a vulnerable segment of Romanian meat supply, in a diet in which meat provides 28.5 g of protein per capita per day. In the short term, the agreement does not appear to threaten the food security of either country; its effects should be sought in niche export opportunities (for Romania, notably vegetable oils, sheep meat and processed foods), and in the still open negotiations on geographical indications.
The Indian case requires a brief clarification. Although the cow is sacred in Hinduism, the majority religion, India is one of the world’s leading meat exporters; the explanation is both legal and economic. Article 48 of the Indian Constitution directs the State to take steps towards prohibiting the slaughter of cows, calves and other milch and draught cattle [76], and most states have enacted laws banning or restricting cow slaughter, whereas buffaloes are not protected in the same way. In line with this, India’s export policy prohibits the export of beef (meat of cows, oxen and calves) and allows only the export of boneless buffalo meat [77]. Buffalo meat is obtained mainly from male buffaloes and from female buffaloes that are no longer productive in a dairy herd kept primarily for milk, so that meat exports are largely a by-product of India’s milk-oriented livestock sector rather than of specialised beef production. Beef is still eaten by part of the population, mainly among religious minorities and in states without slaughter restrictions, but these religious and legal constraints help explain the very low contribution of meat to the Indian diet (3.6 g of protein per capita per day; Section 4.2).
Because the agreement is so recent and is expected to enter into force only in 2027 [15], its opportunities are still potential rather than realised, and the period before implementation is precisely when they can be prepared. Our results point to four such opportunities. First, tariff-free access for vegetable oils from the EU [59] can help India diversify a supply on which it depends heavily on imports, while for Romania it could help stabilise an episodic export flow: Romanian exports of fats and oils to India reached EUR 68 million in 2023 but fell to EUR 16 million in 2024 [57], and Romanian agri-food exports to India as a whole amounted to only about EUR 1 million in 2025 [16]. Second, the elimination of Indian tariffs on sheep meat and the reduction of those on processed foods [59] could give Romania’s extensive sheep sector, the second largest in the EU, and its traditional processed foods an outlet that rewards low-input production systems. Third, more diversified export markets could partly cushion Romanian farmers against the income effects of the recurrent drought shocks identified in this study [36,37], which are currently absorbed through exports and stocks rather than through domestic consumption. Fourth, the parallel negotiations on geographical indications [13] offer both countries an opportunity to protect and add value to their traditional products in each other’s markets—Romanian foodstuffs such as Magiun de prune Topoloveni, and Indian teas and Basmati rice. These opportunities remain modest in volume compared with the staple foods that dominate both diets, and their realisation will also depend on non-tariff conditions, including sanitary and phytosanitary requirements, which future studies should examine once the agreement is in force.
5.5. Traditional Products: A Potential in Three Weakly Connected Layers (H6)
Distinguishing between certified traditional products, traditional production systems and agricultural commodities reveals a fragmented valorisation in Romania. It combines a traditional production system with international recognition, transhumance, inscribed by UNESCO in 2023 as intangible cultural heritage [48] and underpinning the second largest sheep flock in the EU; several hundred products certified as traditional at the national level but without EU recognition [46,73]; and only 16 foodstuffs protected at the European level, below the median of Member States. The distance between these layers means that much of the cultural and ecological value of traditional systems is not reflected in product prices. Moving products from national certification to EU-level protection also requires quality management capacity among small producers, which public agricultural advisory services are well placed to support [78]. India presents a similar situation on a different scale: several hundred agricultural and food geographical indications nationally [47], but only two protected names in the EU. The case of millet shows another facet of the problem. A crop recognised for its drought resilience and nutritional quality [50], promoted internationally through the International Year of Millets [49], has lost half of its place in the diet even though yields rose 3.4-fold; replacing part of rice with millets and other alternative cereals could reduce irrigation water use and improve nutrient supply [51]. The ongoing EU–India negotiations on geographical indications [13] are an opportunity for both countries.
5.6. Limitations and Future Research
The study has several limitations, presented in detail in Section 3.5. The comparison relies on national averages from the FAO food balance sheets, which describe availability rather than actual consumption; the indicator of emissions per unit of protein is not adjusted for trade; the classification of foods under the FTA is based on the official documents published so far rather than the final legal text; and Romanian data for the 1980s are subject to greater uncertainty. In addition, a two-country design does not allow causal inference: the associations identified—for example, between irrigation, input use and yield stability—are consistent with the proposed mechanisms, but other factors, such as climate, farm structure and agricultural policy, may also contribute, and the regional benchmarks control for them only partly. Finally, several time series are autocorrelated; robust tests (AR(1) bootstrap, Newey–West and modified Mann–Kendall) confirmed the main results, but the breaks for maize and rice in Romania were not robust. Future research could (i) carry out an ex-post assessment of the actual effects of the FTA after its entry into force, using the ex-ante baseline provided by this study as the reference point; (ii) analyse access to food by income group and region in both countries; and (iii) quantify the economic value of traditional production systems and the potential impact of mutual protection of geographical indications.
6. Conclusions
Romania and India have reached food security through opposite agricultural pathways, each with real strengths and specific vulnerabilities. The 1989–1991 reforms marked structural breaks in both countries, but through different mechanisms: the collapse of the input and irrigation system in Romania, and the exhaustion of Green Revolution gains followed by diversification in India. The yield gap between the two countries narrowed from 71% to 12%, yet both remain below the world average.
The nutrition transition is advancing in parallel, without convergence: India retains a lacto-vegetarian protein profile, Romania one dominated by animal products. High food availability does not guarantee access: in Romania, abundance coexists with food insecurity for about one in six people and with widespread obesity, so its food security problem is one of distribution and diet quality rather than quantity. Romania’s low-input model has the lowest environmental cost per unit of protein but yields seven times more unstable; India’s intensified, irrigated model is stable but input-intensive. Consumption stability is ensured through markets and exports in Romania and through irrigation and public stocks in India.
The EU - India FTA liberalises trade at the margins of national diets, as staple foods remain protected on both sides; its effects will appear mainly in export niches, such as vegetable oils, sheep meat and processed foods for Romania, and in future negotiations on geographical indications. Both countries have internationally recognised traditional production systems but make limited use of certified quality schemes. Policy priorities follow from these results: for Romania, stabilising production through effective irrigation and drought adaptation, improving access to food for vulnerable households and connecting its traditional heritage to European quality schemes; for India, reducing input intensity and reintegrating millets into the diet; and for both, using the negotiations on geographical indications to add value to traditional production systems.
Future research on food and nutrition security in Romania and India can build on this baseline in several directions. First, once the agreement enters into force, which is expected in 2027, the indicators used here (dietary shares by FTA treatment, self-sufficiency ratios and bilateral agri-food flows) can be recalculated in an ex-post assessment of its actual effects, complementing the ex-ante baseline established here and including the role of sanitary and phytosanitary requirements for products such as sheep meat, dairy products and vegetable oils. Second, the two countries offer complementary lessons on climate resilience: Romania can draw on India’s experience with irrigation in stabilising yields, while India’s efforts to reduce water and fertiliser use can benefit from European experience with low-input farming; joint studies on drought adaptation and water-efficient cropping systems would be particularly valuable. Third, research on the double burden of malnutrition should move from national averages to household and regional data, comparing the drivers of food insecurity and obesity in Romania with those of micronutrient deficiencies in India. Fourth, the valorisation of traditional production systems (transhumant sheep farming in Romania and millet cultivation in India) calls for joint work on their nutritional, environmental and economic value and on the mutual protection of geographical indications. Finally, consumption-based, trade-adjusted indicators of environmental cost would allow a fairer comparison of the two production models. The political context is favourable: during the first state visit of an Indian President to Romania in nearly three decades, in July 2026, the two countries agreed to work towards doubling bilateral trade within three years [79]. Therefore, such comparative research would strengthen the evidence base for the progress of both countries towards SDG 2 Zero Hunger of the UN Agenda 2030 and help ensure that the new trade relationship supports, rather than weakens, food and nutrition security on both sides.
Supplementary Materials
The following supporting information can be downloaded at the website of this paper posted on Preprints.org, Workbook S1: Data and calculations underlying the tables and figures, including Table S1–S18 (data for Table 2, Table 3, Table 4, Table 5, Table 6, Table 7, Table 8, Table 9, Table 10, Table 11, Table 12, Table 13 and Table 14, production of main food groups, the classification of all food balance items under the FTA, agri-food trade with India and Romanian geographical indications), data and charts for Figure 2, Figure 3, Figure 4, Figure 5, Figure 6, Figure 7, Figure 8 and Figure 9 (sheets numbered as in the manuscript), bootstrap p-values for the structural break tests and autocorrelation-robust trend tests (Table S4 and Table S10), and calculation sheets with Excel formulas for Equations (1)–(7) (log-linear trends and Chow tests, animal protein and cereal shares, Shannon index, farm-gate emissions per kilogram of protein, detrended yield and energy supply variability with F and Brown–Forsythe tests, cereal self-sufficiency ratio and diet shares by FTA treatment).
Author Contributions
Conceptualization, B.P.R.; methodology, A.A.; software, S.K.B.; validation, A.A. and S.K.B.; formal analysis, G.F.; investigation, S.C.; resources, G.F.; data curation, S.C.; writing—original draft preparation, B.P.R. and G.F.; writing—review and editing, A.A. and S.K.B.; visualization, S.C.; supervision, B.P.R.; project administration, B.P.R.; funding acquisition, G.F. The author has read and agreed to the published version of the manuscript.
Funding
The APC was funded by the University of Agronomic Sciences and Veterinary Medicine of Bucharest (USAMVB), Romania.
Institutional Review Board Statement
Not applicable.
Informed Consent Statement
Not applicable.
Data Availability Statement
The data analysed in this study are publicly available from FAOSTAT (https://www.fao.org/faostat/en/#data), Eurostat (https://ec.europa.eu/eurostat/data/database; Comext: https://ec.europa.eu/eurostat/comext/newxtweb/) and the EU register of geographical indications, eAmbrosia (https://ec.europa.eu/agriculture/eambrosia/geographical-indications-register/). The processed datasets and all calculations underlying the tables and figures, with Excel formulas, are provided in the Supplementary Materials (Workbook S1); the analysis scripts are available from the corresponding author upon request.
Acknowledgments
During the preparation of this article, the authors used the Web of Science Research Assistant (Clarivate) to search and identify the relevant scientific literature, and Claude (Anthropic; Claude Opus 5.5) to write scripts for data retrieval and processing, perform statistical calculations, and edit text. In addition, Grammarly (Grammarly, Inc.) was used for grammar correction, rephrasing, and language polishing. The authors verified the results, interpreted the data, and take full responsibility for the content of this publication.
Conflicts of Interest
The author declares no conflicts of interest.
Abbreviations
The following abbreviations are used in this manuscript:
| APS | Animal protein share |
| AR(1) | First-order autoregressive (process) |
| EU | European Union |
| FAO | Food and Agriculture Organization of the United Nations |
| FBS | Food balance sheets |
| FIES | Food Insecurity Experience Scale |
| FTA | Free trade agreement |
| GI | Geographical indication |
| H | Hypothesis |
| HS | Harmonized System (tariff nomenclature) |
| OLS | Ordinary least squares |
| PDO | Protected designation of origin |
| PGI | Protected geographical indication |
| RQ | Research question |
| SDG | Sustainable Development Goal |
| SSR | Self-sufficiency ratio |
| TRQ | Tariff-rate quota |
| TSG | Traditional speciality guaranteed |
| UN | United Nations |
References
- FAO. Rome Declaration on World Food Security and World Food Summit Plan of Action; World Food Summit; FAO: Rome, Italy, 1996; Available online: https://www.fao.org/3/w3613e/w3613e00.htm (accessed on 5 August 2026).
- FAO. Declaration of the World Summit on Food Security; WSFS 2009/2; World Summit on Food Security: Rome; FAO: Rome, Italy, 16–18 November 2009. [Google Scholar]
- United Nations General Assembly. Transforming Our World: The 2030 Agenda for Sustainable Development; United Nations: New York, NY, USA, 2015; Available online: https://docs.un.org/en/A/RES/70/1 (accessed on 5 November 2026).
- Balan, I.M.; Trasca, T.I.; Ocnean, M.; Horablaga, A.; Mateoc-Sirb, N.; Salasan, C.; Tiu, J.V.; Radoi, B.P.; Lile, R.A.; Firu Negoescu, G.A. Connecting SDG 2: Zero Hunger with the Other SDGs—Teaching Food Security and the SDGs Interdependencies in Higher Education. Sustainability 2025, 17, 7496. [Google Scholar] [CrossRef]
- Godfray, H.C.J.; Beddington, J.R.; Crute, I.R.; Haddad, L.; Lawrence, D.; Muir, J.F.; Pretty, J.; Robinson, S.; Thomas, S.M.; Toulmin, C. Food Security: The Challenge of Feeding 9 Billion People. Science 2010, 327, 812–818. [Google Scholar] [CrossRef] [PubMed]
- Balan, I.M.; Gherman, E.D.; Gherman, R.; Brad, I.; Pascalau, R.; Popescu, G.; Trasca, T.I. Sustainable Nutrition for Increased Food Security Related to Romanian Consumers’ Behavior. Nutrients 2022, 14, 4892. [Google Scholar] [CrossRef] [PubMed]
- Balan, I.M.; Trasca, T.I.; Mateoc-Sirb, N.; Radoi, B.P.; Rujescu, C.I.; Ocnean, M.; Bob, F.; Tamas, L.A.; Gencia, A.D.; Jadaneant, A. Claiming Food Ethics as a Pillar of Food Security. Foods 2026, 15, 255. [Google Scholar] [CrossRef] [PubMed]
- Balan, I.M.; Trasca, T.I.; Mateoc-Sirb, N. From Food Waste to Food Citizenship via Food Ethics—Cross-Country Analysis. Foods 2026, 15, 3822. [Google Scholar] [CrossRef] [PubMed]
- Eurostat. Farms and Farmland in the European Union—Statistics. Statistics Explained. Available online: https://ec.europa.eu/eurostat/statistics-explained/index.php/Farms_and_farmland_in_the_European_Union_-_statistics (accessed on 5 November 2026).
- Agriculture Census Division; Department of Agriculture; Cooperation; Farmers Welfare. Agriculture Census 2015–16 (Phase-I): All India Report on Number and Area of Operational Holdings; Ministry of Agriculture & Farmers Welfare, Government of India: New Delhi, India, 2018. [Google Scholar]
- Przeworski, A.; Teune, H. The Logic of Comparative Social Inquiry; Wiley-Interscience: New York, NY, USA, 1970. [Google Scholar]
- Tarrow, S. The Strategy of Paired Comparison: Toward a Theory of Practice. Comp. Political Stud. 2010, 43, 230–259. [Google Scholar] [CrossRef]
- European Commission. EU–India Agreements. Available online: https://policy.trade.ec.europa.eu/eu-trade-relationships-country-and-region/countries-and-regions/india/eu-india-agreements_en (accessed on 5 November 2026).
- European Commission. <italic>Proposal for a Council Decision on the Signing of the Free Trade Agreement between the European Union and the Republic of India</italic>; COM(2026) 483 final; European Commission: Brussels, Belgium, 2026.
- EUbusiness. EU-India Free Trade Agreement Set for 2027 Entry into Force. 15 July 2026. Available online: https://www.eubusiness.com/trade/eu-india-free-trade-agreement-set-for-2027-entry-into-force/ (accessed on 8 November 2026).
- European Commission. Factsheet: EU–India Free Trade Agreement and Romania. Available online: https://policy.trade.ec.europa.eu/eu-trade-relationships-country-and-region/countries-and-regions/india/eu-india-agreements/factsheet-eu-india-free-trade-agreement-romania_en (accessed on 5 November 2026).
- Trasca, T.I.; Balan, I.M.; Fintineru, G.; Tiu, J.V.; Mateoc-Sirb, N.; Rujescu, C.I. Sustainable Food Security in Romania and Neighboring Countries—Trends, Challenges, and Solutions. Foods 2025, 14, 1309. [Google Scholar] [CrossRef] [PubMed]
- Trasca, T.I.; Balan, I.M.; Mateoc-Sirb, N.; Hussaini, A.S.; Gaise Magomboane, A.; Cimpeanu, S.M. Beyond Calories—Changes in Protein Supply Structure and Implications for Sustainable Food Systems in Sub-Saharan Africa. Nutrients 2026, 18, 2372. [Google Scholar] [CrossRef] [PubMed]
- Pingali, P.L. Green Revolution: Impacts, Limits, and the Path Ahead. Proc. Natl. Acad. Sci. USA 2012, 109, 12302–12308. [Google Scholar] [CrossRef] [PubMed]
- Kesavan, P.C.; Swaminathan, M.S. Strategies and Models for Agricultural Sustainability in Developing Asian Countries. Philos. Trans. R. Soc. B Biol. Sci. 2008, 363, 877–891. [Google Scholar] [CrossRef] [PubMed]
- Swaminathan, M.S. An Evergreen Revolution. Crop Sci. 2006, 46, 2293–2303. [Google Scholar] [CrossRef]
- Pretty, J. Intensification for Redesigned and Sustainable Agricultural Systems. Science 2018, 362, eaav0294. [Google Scholar] [CrossRef] [PubMed]
- Swinnen, J.F.M.; Rozelle, S. From Marx and Mao to the Market: The Economics and Politics of Agricultural Transition; Oxford University Press: Oxford, UK, 2006. [Google Scholar] [CrossRef]
- Popkin, B.M. Global Nutrition Dynamics: The World Is Shifting Rapidly toward a Diet Linked with Noncommunicable Diseases. Am. J. Clin. Nutr. 2006, 84, 289–298. [Google Scholar] [CrossRef]
- Popkin, B.M.; Corvalan, C.; Grummer-Strawn, L.M. Dynamics of the Double Burden of Malnutrition and the Changing Nutrition Reality. Lancet 2020, 395, 65–74. [Google Scholar] [CrossRef] [PubMed]
- Dutta, M.; Selvamani, Y.; Singh, P.; Prashad, L. The Double Burden of Malnutrition among Adults in India: Evidence from the National Family Health Survey-4 (2015–16). Epidemiol. Health 2019, 41, e2019050. [Google Scholar] [CrossRef] [PubMed]
- Candler, W.; Kumar, N. India: The Dairy Revolution: The Impact of Dairy Development in India and the World Bank’s Contribution; World Bank Operations Evaluation Study; World Bank: Washington, DC, USA, 1998. [Google Scholar]
- Balan, I.M.; Gherman, E.D.; Brad, I.; Gherman, R.; Horablaga, A.; Trasca, T.I. Metabolic Food Waste as Food Insecurity Factor—Causes and Preventions. Foods 2022, 11, 2179. [Google Scholar] [CrossRef] [PubMed]
- Trasca, T.I.; Ocnean, M.; Gherman, R.; Lile, R.A.; Balan, I.M.; Brad, I.; Tulcan, C.; Firu Negoescu, G.A. Synergy between the Waste of Natural Resources and Food Waste Related to Meat Consumption in Romania. Agriculture 2024, 14, 644. [Google Scholar] [CrossRef]
- Balan, I.M.; Trasca, T.I. Reducing Agricultural Land Use Through Plant-Based Diets: A Case Study of Romania. Nutrients 2025, 17, 175. [Google Scholar] [CrossRef] [PubMed]
- Balan, I.M. Addressing Food Waste and Hunger Together. Nat. Hum. Behav. 2025, 9, 2217–2218. [Google Scholar] [CrossRef] [PubMed]
- Balan, I.M.; Trasca, T.I.; Ocnean, M.; Radoi, B.P.; Simbiat Hussaini, A.; Gaise Magomboane, A.; Cimpeanu, S.M. Gross Domestic Product Growth versus Food Insecurity in Africa—Insights from Nigeria and DR Congo. Sci. Pap. Ser. Manag. Econ. Eng. Agric. Rural Dev. 2026, 26, 71–79. [Google Scholar]
- Willett, W.; Rockström, J.; Loken, B.; Springmann, M.; Lang, T.; Vermeulen, S.; Garnett, T.; Tilman, D.; DeClerck, F.; Wood, A.; Jonell, M.; Clark, M.; Gordon, L.J.; Fanzo, J.; Hawkes, C.; Zurayk, R.; Rivera, J.A.; De Vries, W.; Majele Sibanda, L.; Afshin, A.; Chaudhary, A.; Herrero, M.; Agustina, R.; Branca, F.; Lartey, A.; Fan, S.; Crona, B.; Fox, E.; Bignet, V.; Troell, M.; Lindahl, T.; Singh, S.; Cornell, S.E.; Srinath Reddy, K.; Narain, S.; Nishtar, S.; Murray, C.J.L. Food in the Anthropocene: The EAT–Lancet Commission on Healthy Diets from Sustainable Food Systems. Lancet 2019, 393, 447–492. [Google Scholar] [CrossRef] [PubMed]
- Ontel, I.; Vladut, A. Impact of Drought on the Productivity of Agricultural Crops within the Oltenia Plain, Romania. Geogr. Pannonica 2015, 19, 9–19. [Google Scholar] [CrossRef]
- Prăvălie, R.; Patriche, C.V.; Sîrodoev, I.; Bandoc, G.; Dumitraşcu, M.; Peptenatu, D. Water Deficit and Corn Productivity during the Post-Socialist Period. Case Study: Southern Oltenia Drylands, Romania. Arid Land Res. Manag. 2016, 30, 239–257. [Google Scholar] [CrossRef]
- Ionita, M.; Antonescu, B.; Roibu, C.; Nagavciuc, V. Drought’s Grip on Romania: A Tale of Two Indices. Int. J. Climatol. 2025, 45, e8876. [Google Scholar] [CrossRef]
- Barna, F.M.; Manescu, A.C. The Impact of Drought Risk on Maize Crop in Romania. Sustainability 2025, 17, 8870. [Google Scholar] [CrossRef]
- Davis, K.F.; Chhatre, A.; Rao, N.D.; Singh, D.; DeFries, R. Sensitivity of Grain Yields to Historical Climate Variability in India. Environ. Res. Lett. 2019, 14, 064013. [Google Scholar] [CrossRef]
- Rodell, M.; Velicogna, I.; Famiglietti, J.S. Satellite-Based Estimates of Groundwater Depletion in India. Nature 2009, 460, 999–1002. [Google Scholar] [CrossRef] [PubMed]
- Government of India. The National Food Security Act, 2013; Act No. 20 of 2013; The Gazette of India Extraordinary, Part II, Section 1, No. 29; Ministry of Law and Justice: New Delhi, India, 2013. [Google Scholar]
- George, N.A.; McKay, F.H. The Public Distribution System and Food Security in India. Int. J. Environ. Res. Public Health 2019, 16, 3221. [Google Scholar] [CrossRef] [PubMed]
- Bathla, S.; Bhattacharya, P.; D’Souza, A. India’s National Food Security Act 2013: Food Distribution through Revamped Public Distribution System or Food Stamps and Cash Transfers? Agric. Econ. Res. Rev. 2015, 28, 39–55. [Google Scholar] [CrossRef]
- Clapp, J. Food Self-Sufficiency: Making Sense of It, and When It Makes Sense. Food Policy 2017, 66, 88–96. [Google Scholar] [CrossRef]
- Khan, H.; Chen, Y.; Lv, L. Does the China–Pakistan Free Trade Agreement Benefit the Vegetable Exports of Pakistan? A Gravity Estimation. Front. Sustain. Food Syst. 2024, 8, 1362910. [Google Scholar] [CrossRef]
- European Commission. eAmbrosia—The EU Geographical Indications Register. Available online: https://ec.europa.eu/agriculture/eambrosia/geographical-indications-register/ (accessed on 5 November 2026).
- Ministry of Agriculture and Rural Development; Ministry of Health; National Authority for Consumer Protection. Order No. 724/1082/360/2013 on the Certification of Traditional Products; Monitorul Oficial al României, Part I. 11 November 2013; No. 688.
- Kumar, V.; Singh, R.; Singh, G.P. Geographical Indications: Agricultural Perspectives with Special Reference to Rice Genetic Resources in India. J. Cereal Res. 2025, 17, 135–145. [Google Scholar] [CrossRef] [PubMed]
- UNESCO. Decision of the Intergovernmental Committee: 18.COM 8.B.14—Transhumance, the Seasonal Droving of Livestock; Kasane, Botswana, 2023. Available online: https://ich.unesco.org/en/decisions/18.COM/8.B.14 (accessed on 5 November 2026).
- United Nations General Assembly. International Year of Millets, 2023; Resolution A/RES/75/263; United Nations: New York, NY, USA, 2021. [Google Scholar]
- Saleh, A.S.M.; Zhang, Q.; Chen, J.; Shen, Q. Millet Grains: Nutritional Quality, Processing, and Potential Health Benefits. Compr. Rev. Food Sci. Food Saf. 2013, 12, 281–295. [Google Scholar] [CrossRef]
- Davis, K.F.; Chiarelli, D.D.; Rulli, M.C.; Chhatre, A.; Richter, B.; Singh, D.; DeFries, R. Alternative Cereals Can Improve Water Use and Nutrient Supply in India. Sci. Adv. 2018, 4, eaao1108. [Google Scholar] [CrossRef] [PubMed]
- Mangla, S.K.; Luthra, S.; Rich, N.; Kumar, D.; Rana, N.P.; Dwivedi, Y.K. Enablers to Implement Sustainable Initiatives in Agri-Food Supply Chains. Int. J. Prod. Econ. 2018, 203, 379–393. [Google Scholar] [CrossRef]
- Bhat, R.; Jõudu, I. Emerging Issues and Challenges in Agri-Food Supply Chain. In Sustainable Food Supply Chains: Planning, Design, and Control through Interdisciplinary Methodologies; Accorsi, R., Manzini, R., Eds.; Academic Press: London, UK, 2019; pp. 23–37. [Google Scholar] [CrossRef]
- Priyadarshini, P.; Abhilash, P.C. An Empirical Analysis of Resource Efficiency and Circularity within the Agri-Food Sector of India. J. Clean. Prod. 2023, 385, 135660. [Google Scholar] [CrossRef]
- FAO. FAOSTAT Statistical Database: Crops and Livestock Products; Food Balances; Fertilizers by Nutrient; Land Use; Emissions Totals; Emissions Intensities; Suite of Food Security Indicators. Available online: https://www.fao.org/faostat/en/#data (accessed on 5 November 2026).
- Eurostat. Inability to Afford a Meal with Meat, Chicken, Fish (or Vegetarian Equivalent) Every Second Day—EU-SILC Survey (ilc_mdes03). Available online: https://ec.europa.eu/eurostat/databrowser/view/ilc_mdes03/default/table (accessed on 5 November 2026).
- Eurostat. EU Trade since 1988 by HS2-4-6 and CN8 (DS-045409). Available online: https://ec.europa.eu/eurostat/comext/newxtweb/ (accessed on 5 November 2026).
- European Commission. Memo: EU–India Free Trade Agreement—Chapter-by-Chapter Summary. Available online: https://policy.trade.ec.europa.eu/eu-trade-relationships-country-and-region/countries-and-regions/india/eu-india-agreements/memo-eu-india-free-trade-agreement-chapter-chapter-summary_en (accessed on 5 November 2026).
- European Commission. Factsheet—EU–India Free Trade Agreement: EU Agri-Food Exports. Available online: https://policy.trade.ec.europa.eu/node/1960_en (accessed on 5 November 2026).
- Ministry of Commerce and Industry; Government of India. Factsheet on India–EU Trade Deal. 27 January 2026. Available online: https://www.commerce.gov.in/wp-content/uploads/2026/01/Factsheet-on-India-EU-trade-deal-27.1.2026.pdf (accessed on 5 November 2026).
- Shannon, C.E. A Mathematical Theory of Communication. Bell Syst. Tech. J. 1948, 27, 379–423. [Google Scholar] [CrossRef]
- Chow, G.C. Tests of Equality between Sets of Coefficients in Two Linear Regressions. Econometrica 1960, 28, 591–605. [Google Scholar] [CrossRef]
- Andrews, D.W.K. Tests for Parameter Instability and Structural Change with Unknown Change Point. Econometrica 1993, 61, 821–856. [Google Scholar] [CrossRef]
- Mann, H.B. Nonparametric Tests against Trend. Econometrica 1945, 13, 245–259. [Google Scholar] [CrossRef]
- Kendall, M.G. Rank Correlation Methods, 4th ed.; Charles Griffin: London, UK, 1975. [Google Scholar]
- Newey, W.K.; West, K.D. A Simple, Positive Semi-Definite, Heteroskedasticity and Autocorrelation Consistent Covariance Matrix. Econometrica 1987, 55, 703–708. [Google Scholar] [CrossRef]
- Hamed, K.H.; Rao, A.R. A Modified Mann-Kendall Trend Test for Autocorrelated Data. J. Hydrol. 1998, 204, 182–196. [Google Scholar] [CrossRef]
- Brown, M.B.; Forsythe, A.B. Robust Tests for the Equality of Variances. J. Am. Stat. Assoc. 1974, 69, 364–367. [Google Scholar] [CrossRef]
- Georgescu, V. Romania in the 1980s: The Legacy of Dynastic Socialism. East Eur. Politics Soc. 1987, 2, 69–93. [Google Scholar] [CrossRef]
- Bachman, R.D. (Ed.) Romania: A Country Study, 2nd ed.; Federal Research Division, Library of Congress: Washington, DC, USA, 1991. [Google Scholar]
- Law No. 18 of 19 February 1991 on Land Resources (Legea fondului funciar). Monit. Of. Al României Part I 1991, No. 37.
- FAO GIEWS. Romania’s Cereal Production Seriously Reduced by Drought. In Special Alert; FAO: Rome, Italy, 29 November 2000. [Google Scholar]
- Agerpres. Produsele Agroalimentare Românești Promovate la Săptămâna Verde 2025 [Romanian Agri-Food Products Promoted at Green Week 2025]. 15 January 2025. Available online: https://agerpres.ro/economic/2025/01/15/produsele-agroalimentare-romanesti-promovate-la-saptamana-verde-2025--1412704 (accessed on 5 November 2026).
- Ravindran, P.Y.; Yadav, Y. Performance and Export Competitiveness of Meat Exports from India. Indian J. Econ. Dev. 2024, 20, 23137. [Google Scholar] [CrossRef]
- Petroman, C.; Balan, I.; Petroman, I.; Orboi, M.D.; Banes, A.; Trifu, C.; Marin, D. National Grading of Quality of Beef and Veal Carcasses in Romania According to “EUROP” System. J. Food Agric. Environ. 2009, 7, 173–174. [Google Scholar]
- Government of India. The Constitution of India; Article 48: Organisation of Agriculture and Animal Husbandry; Legislative Department, Ministry of Law and Justice. New Delhi, India. Available online: https://legislative.gov.in/constitution-of-india/ (accessed on 7 November 2026).
- Directorate General of Foreign Trade. ITC (HS) 2022, Schedule 2—Export Policy, Chapter 02: Meat and Edible Meat Offal. Ministry of Commerce and Industry, Government of India: New Delhi, India, 2022. Available online: https://www.dgft.gov.in (accessed on 7 November 2026).
- Salasan, C.; Balan, I.M. Suitability of a Quality Management Approach within the Public Agricultural Advisory Services. Qual.-Access Success 2014, 15, 81–84. [Google Scholar]
- President’s Secretariat; Government of India. President of India in Romania; Holds Bilateral Meeting with President of Romania and Leads Delegation-Level Talks. Press Release. 23 July 2026. Available online: https://presidentofindia.nic.in/press_releases/president-india-romania-holds-bilateral-meeting-president-romania-and-leads (accessed on 7 November 2026).
Figure 1.
Conceptual framework of the study: contrasting agricultural pathways are assessed through four dimensions of food and nutrition security, providing a baseline for the EU–India Free Trade Agreement. Note: RQ = research question; H = hypothesis; Eq. = equation (Section 3.3). Source: Original by authors.
Figure 1.
Conceptual framework of the study: contrasting agricultural pathways are assessed through four dimensions of food and nutrition security, providing a baseline for the EU–India Free Trade Agreement. Note: RQ = research question; H = hypothesis; Eq. = equation (Section 3.3). Source: Original by authors.
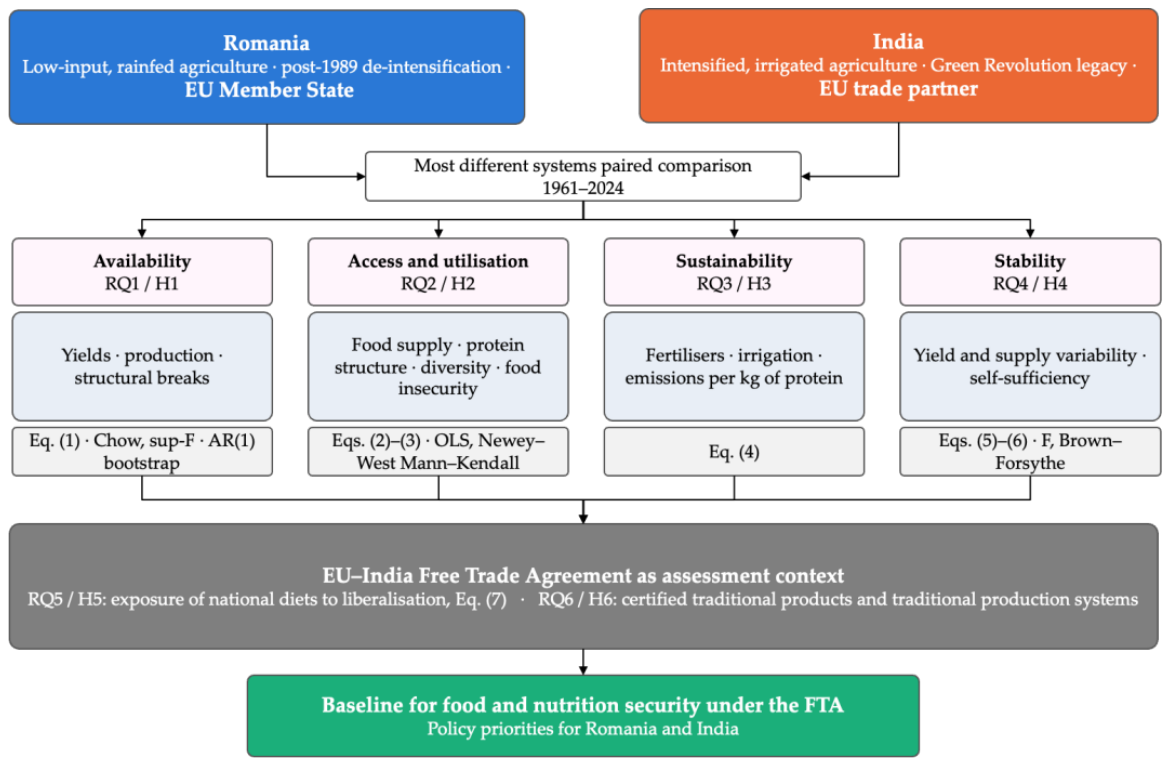
Figure 2.
Cereal yields in Romania and India compared with regional and global references, 1961–2024 (t/ha). Source: By authors based on FAOSTAT [55].
Figure 2.
Cereal yields in Romania and India compared with regional and global references, 1961–2024 (t/ha). Source: By authors based on FAOSTAT [55].
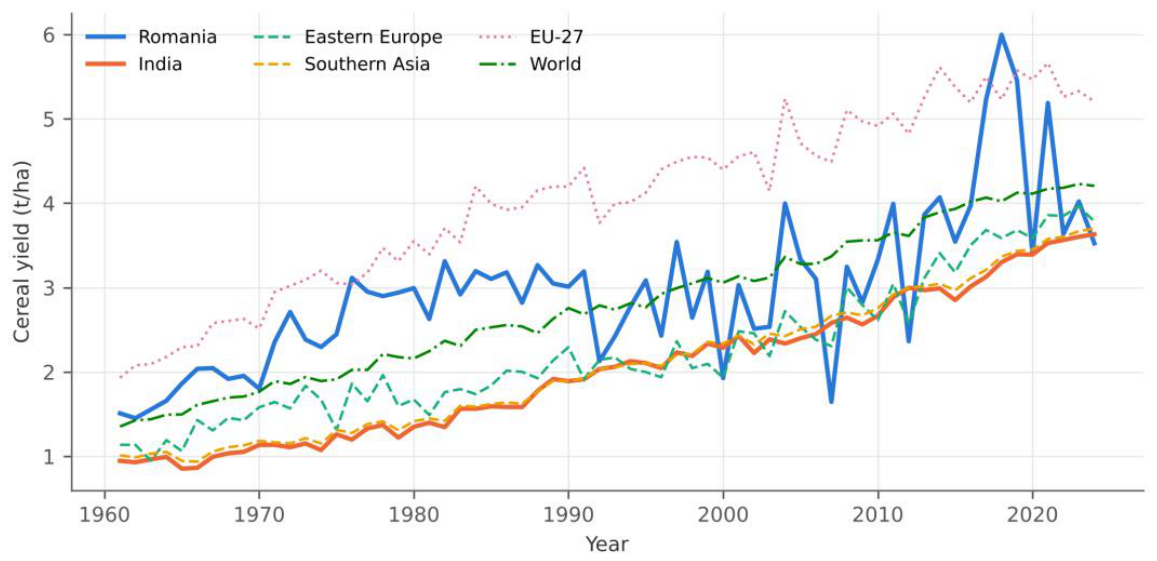
Figure 3.
Protein supply by food group in Romania and India, 2021–2023 average (g per capita per day). Note: Food groups supplying at least 1 g per capita per day in either country. Source: By authors based on FAOSTAT [55].
Figure 3.
Protein supply by food group in Romania and India, 2021–2023 average (g per capita per day). Note: Food groups supplying at least 1 g per capita per day in either country. Source: By authors based on FAOSTAT [55].
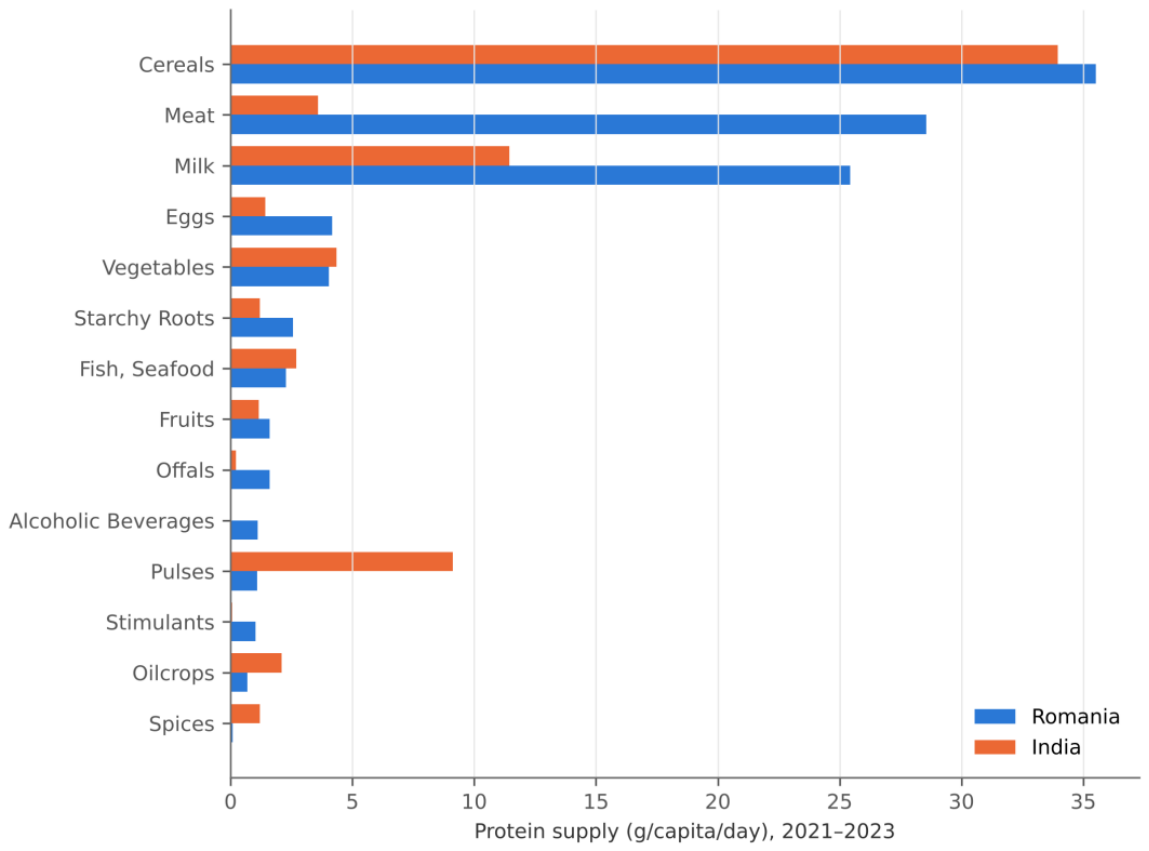
Figure 4.
Share of animal protein in total protein supply, 1961–2023 (%). Note: Calculated with Equation (2). Methodological break in the FAO food balance sheets in 2010. Source: By authors based on FAOSTAT [55].
Figure 4.
Share of animal protein in total protein supply, 1961–2023 (%). Note: Calculated with Equation (2). Methodological break in the FAO food balance sheets in 2010. Source: By authors based on FAOSTAT [55].
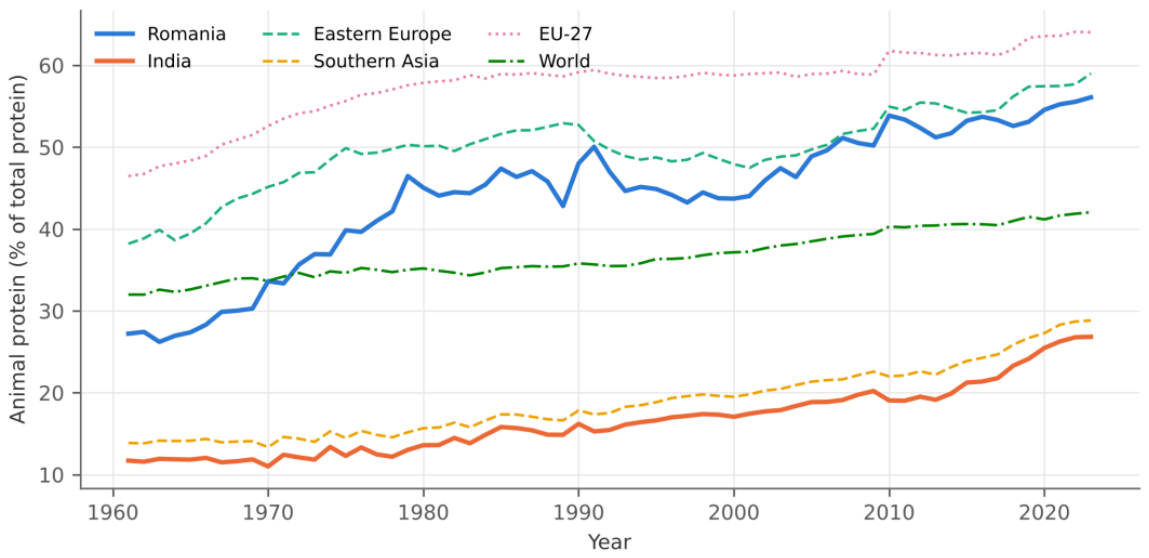
Figure 5.
Nitrogen fertiliser use, 1961–2024 (kg N per hectare of cropland). Source: By authors based on FAOSTAT [55].
Figure 5.
Nitrogen fertiliser use, 1961–2024 (kg N per hectare of cropland). Source: By authors based on FAOSTAT [55].
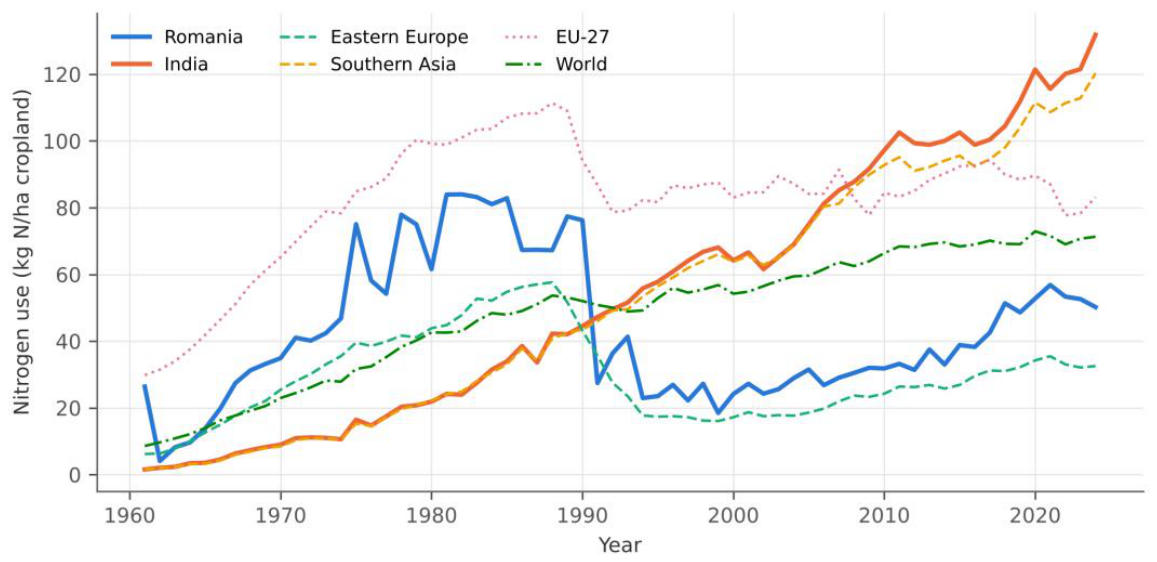
Figure 6.
Structure of farm-gate emissions, 2021–2023 average (% of total CO₂eq). Source: By authors based on FAOSTAT Emissions Totals, FAO Tier 1 [55].
Figure 6.
Structure of farm-gate emissions, 2021–2023 average (% of total CO₂eq). Source: By authors based on FAOSTAT Emissions Totals, FAO Tier 1 [55].
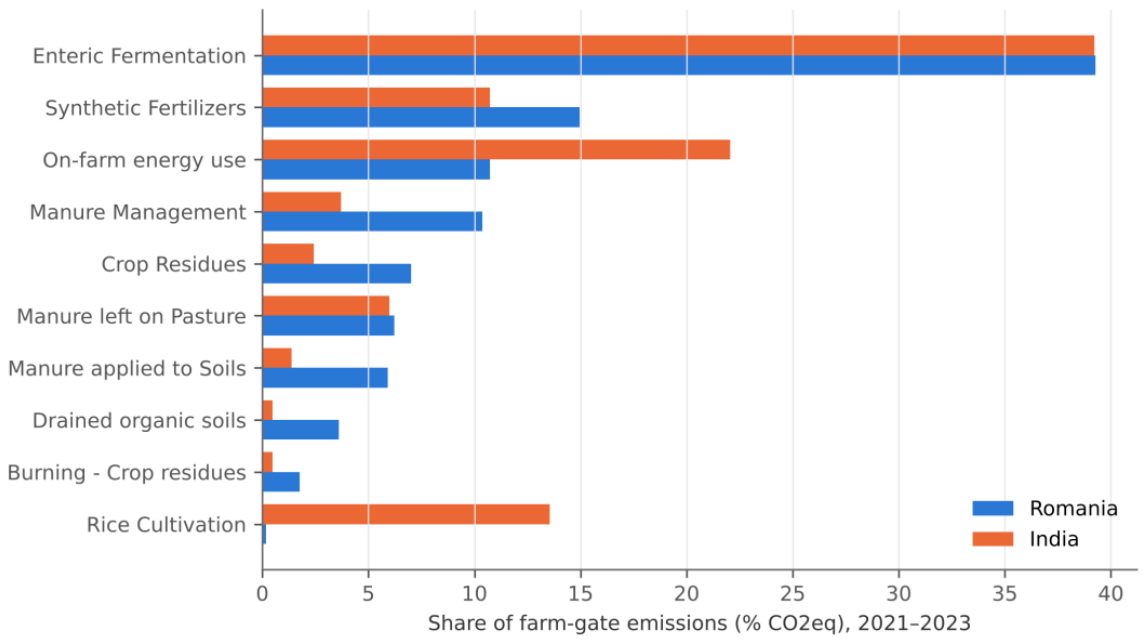
Figure 7.
Deviation of cereal yields from the log-linear trend, 1991–2024 (%). Note: Deviations calculated with Equation (5); the dashed line marks the −15% shock threshold. Source: By authors based on FAOSTAT [55].
Figure 7.
Deviation of cereal yields from the log-linear trend, 1991–2024 (%). Note: Deviations calculated with Equation (5); the dashed line marks the −15% shock threshold. Source: By authors based on FAOSTAT [55].
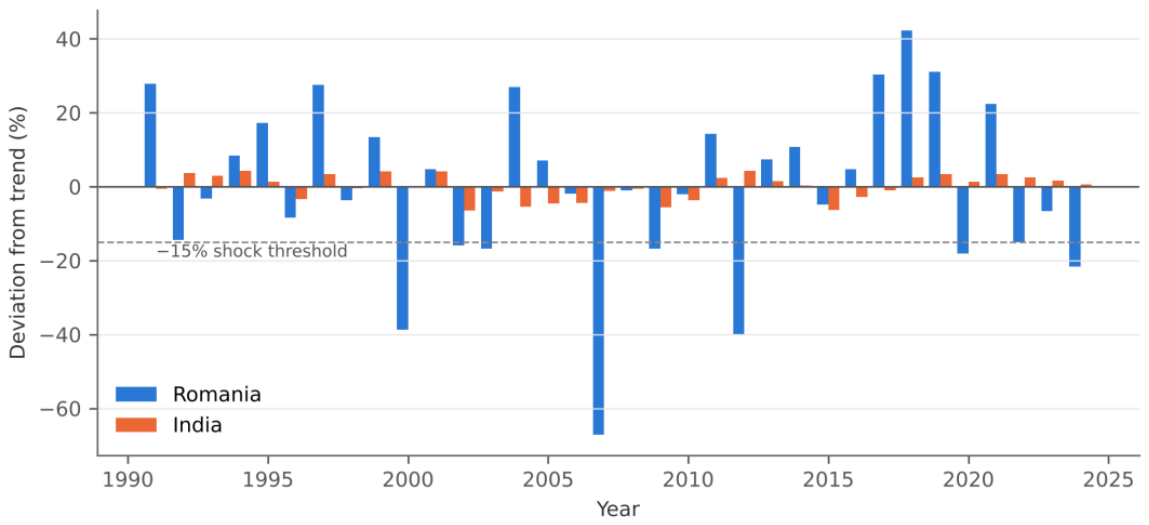
Figure 8.
Shares of dietary energy and protein by treatment of food items under the EU–India Free Trade Agreement, 2021–2023 (%). Note: Shares calculated with Equation (7). Source: By authors based on FAOSTAT [55] and FTA documents [58,59,60].
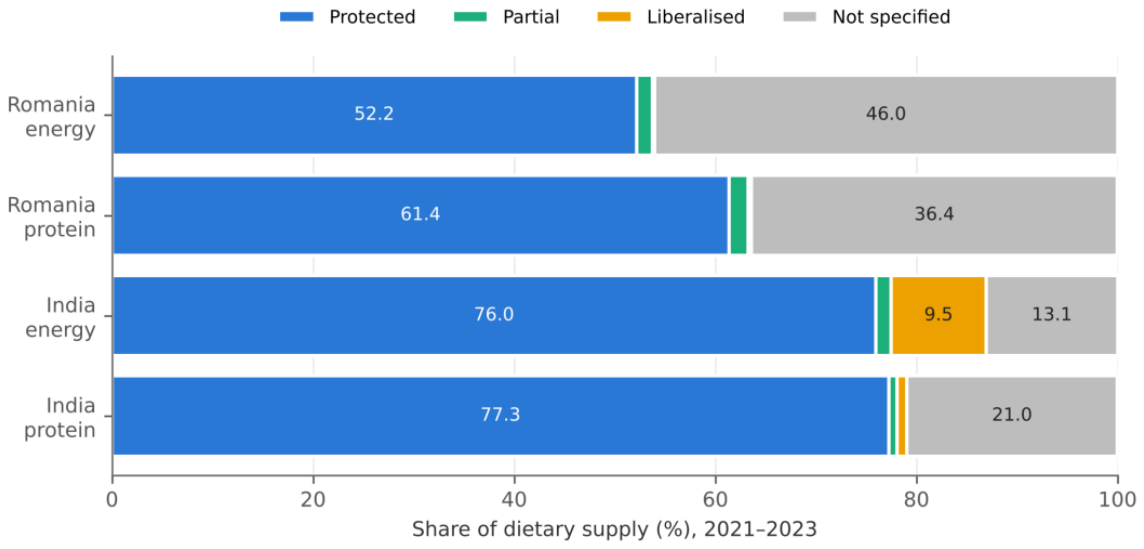
Figure 9.
Millet in India, 1961–2024: (a) area harvested (million ha); (b) yield (t/ha); (c) production (million tonnes); (d) food supply (kcal per capita per day). Source: By authors based on FAOSTAT [55].
Figure 9.
Millet in India, 1961–2024: (a) area harvested (million ha); (b) yield (t/ha); (c) production (million tonnes); (d) food supply (kcal per capita per day). Source: By authors based on FAOSTAT [55].
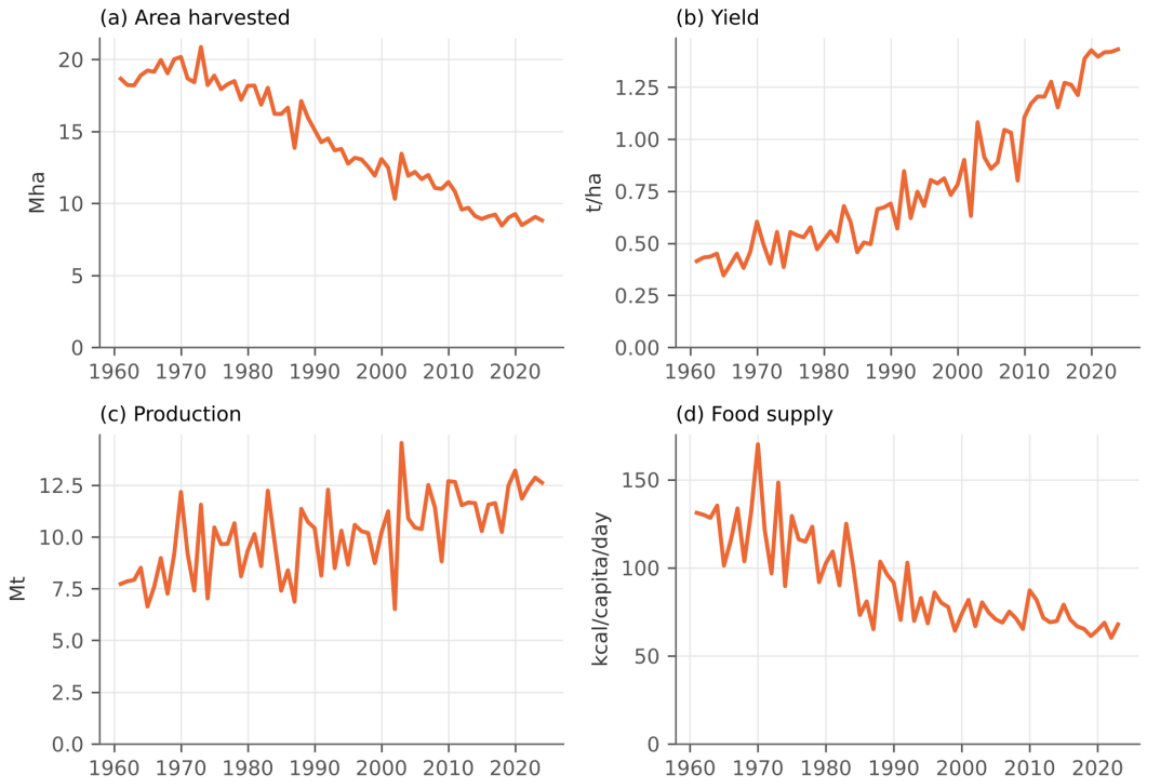

Table 1.
Data sources and indicators used in the study.
| Source / domain | Indicators | Period |
| FAOSTAT, Crops and Livestock Products (QCL) [55] | Area harvested, yield and production of crops; livestock numbers; milk and meat production | 1961–2024 |
| FAOSTAT, Food Balances (FBSH, FBS) [55] | Energy, protein and fat supply by food item and group; production, trade and stock variation of cereals | 1961–2023 |
| FAOSTAT, Fertilizers by Nutrient (RFN) and Land Use (RL) [55] | N, P₂O₅ and K₂O use per hectare of cropland; area equipped for irrigation and actually irrigated; organic agriculture | 1961–2024 |
| FAOSTAT, Emissions Totals (GT) and Emissions Intensities (EI) [55] | Farm-gate emissions by source (FAO Tier 1, AR5); emission intensity by product | 2010–2023 |
| FAOSTAT, Suite of Food Security Indicators (FS) [55] | Undernourishment, food insecurity (FIES), adult obesity, anaemia in women | 2023–2025 |
| Eurostat, EU-SILC (ilc_mdes03) [56] | Inability to afford a meal with meat, fish or a vegetarian equivalent every second day | 2025 |
| Eurostat, Comext (DS-045409) [57] | EU-27 and Romanian agri-food trade with India, HS chapters 01–24 | 2023–2024 |
| eAmbrosia, EU register of geographical indications [45] | Registered and pending PDO, PGI and TSG names by Member State and third country | 2026 |
| European Commission and Government of India [58,59,60] | Treatment of agri-food products under the EU–India FTA | 2026 |
Note: FIES = Food Insecurity Experience Scale; FTA = free trade agreement; PDO = protected designation of origin; PGI = protected geographical indication; TSG = traditional speciality guaranteed.
Table 2.
Yields of main crops in Romania and India compared with the EU-27 and the world (t/ha, five-year averages).
Table 2.
Yields of main crops in Romania and India compared with the EU-27 and the world (t/ha, five-year averages).
| Crop | Romania | India | EU-27 | World | ||||
| 1961–1965 | 1986–1990 | 2020–2024 | 1961–1965 | 1986–1990 | 2020–2024 | 2020–2024 | 2020–2024 | |
| Cereals | 1.61 | 3.07 | 3.95 | 0.94 | 1.75 | 3.54 | 5.38 | 4.18 |
| Wheat | 1.46 | 3.11 | 4.00 | 0.84 | 2.07 | 3.52 | 5.53 | 3.62 |
| Maize | 1.77 | 2.91 | 3.98 | 0.99 | 1.37 | 3.35 | 7.06 | 5.79 |
| Rice | 2.98 | 2.38 | 4.54 | 1.48 | 2.44 | 4.23 | 6.40 | 4.74 |
| Millet | – | – | – | 0.42 | 0.61 | 1.42 | – | 1.00 |
| Pulses | 0.13 | 0.85 | 1.47 | 0.49 | 0.55 | 0.91 | 2.11 | 1.05 |
| Potatoes | 8.29 | 12.70 | 15.56 | 7.35 | 15.04 | 24.68 | 36.00 | 22.38 |
| Sunflower seed | 1.11 | 1.58 | 1.88 | – | 0.44 | 1.02 | 2.03 | 1.88 |
Note: “–” = not produced or not reported. Source: By authors based on FAOSTAT, QCL [55].
Table 3.
Structural break tests in yield trends (ln yield, 1961–2024): Chow test at 1990 and endogenously estimated break year.
Table 3.
Structural break tests in yield trends (ln yield, 1961–2024): Chow test at 1990 and endogenously estimated break year.
| Crop | Country | Growth before 1990 (%/year) | Growth after 1990 (%/year) | Chow F (1990) | p (asymptotic) | p (bootstrap) | sup-F | p, sup-F (bootstrap) | Break year |
| Cereals | Romania | 2.79 | 1.69 | 10.45 | <0.001 | 0.011 | 12.18 | 0.048 | 1992 |
| Cereals | India | 2.48 | 1.90 | 15.15 | <0.001 | 0.013 | 20.78 | 0.024 | 1988 |
| Wheat | Romania | 2.99 | 1.89 | 10.67 | <0.001 | 0.004 | 13.91 | 0.010 | 1991 |
| Wheat | India | 3.61 | 1.31 | 85.94 | <0.001 | 0.002 | 86.47 | 0.007 | 1993 |
| Maize | Romania | 2.37 | 1.57 | 3.59 | 0.034 | 0.119 | 7.87 | 0.100 | 1987 |
| Maize | India | 1.16 | 2.65 | 20.07 | <0.001 | <0.001 | 26.12 | <0.001 | 1988 |
| Rice | Romania | −0.37 | 2.80 | 9.89 | <0.001 | 0.117 | 19.76 | 0.106 | 2004 |
| Rice | India | 1.95 | 1.56 | 4.19 | 0.020 | 0.059 | 9.09 | 0.031 | 1983 |
| Pulses | Romania | 7.21 | 0.90 | 29.37 | <0.001 | 0.034 | 56.52 | 0.014 | 1985 |
| Pulses | India | 0.44 | 1.57 | 15.11 | <0.001 | 0.008 | 17.88 | 0.031 | 1980 |
Note: Growth rates are slopes b of the log-linear trend in Equation (1) × 100. sup-F = maximum Chow F statistic over candidate break years 1975–2010 [63]. Bootstrap p-values from 2000 series simulated under a single log-linear trend with AR(1) errors (Section 3.4); <0.001 = no simulated statistic as large as the observed one. Romanian rice is grown on a very small area; its results are less robust. Source: By authors based on FAOSTAT, QCL [55].
Table 4.
Food supply indicators in Romania and India compared with regional and global references (per capita per day).
Table 4.
Food supply indicators in Romania and India compared with regional and global references (per capita per day).
| Indicator / year | Romania | India | Eastern Europe | Southern Asia | EU-27 | World |
| Energy (kcal) | ||||||
| 1961 | 2,832 | 2,010 | 3,100 | 2,014 | 2,962 | 2,196 |
| 1990 | 3,127 | 2,205 | 3,360 | 2,242 | 3,361 | 2,621 |
| 2023 | 3,649 | 2,668 | 3,429 | 2,649 | 3,546 | 3,016 |
| Protein (g) | ||||||
| 1961 | 87.5 | 52.1 | 94.6 | 51.9 | 86.7 | 61.5 |
| 1990 | 96.2 | 53.2 | 105.2 | 54.2 | 103.8 | 70.5 |
| 2023 | 112.4 | 74.6 | 110.8 | 73.9 | 113.6 | 92.5 |
| Fat (g) | ||||||
| 1961 | 55.7 | 30.8 | 73.1 | 29.9 | 94.5 | 47.5 |
| 1990 | 102.5 | 39.6 | 107.8 | 40.4 | 137.6 | 67.3 |
| 2023 | 137.6 | 65.7 | 125.5 | 66.3 | 152.5 | 89.8 |
| Animal protein (% of protein) | ||||||
| 1961 | 27.2 | 11.7 | 38.2 | 13.9 | 46.5 | 32.0 |
| 1990 | 48.0 | 16.2 | 52.7 | 17.8 | 59.2 | 35.8 |
| 2023 | 56.1 | 26.8 | 59.0 | 28.8 | 64.0 | 42.0 |
| Cereals (% of energy) | ||||||
| 1961 | 63.0 | 62.9 | 48.9 | 65.0 | 36.4 | 49.5 |
| 1990 | 42.8 | 63.4 | 36.6 | 64.2 | 26.9 | 50.2 |
| 2023 | 34.2 | 51.0 | 30.9 | 51.9 | 25.0 | 42.4 |
| Shannon index H′ | ||||||
| 1961 | 1.54 | 1.40 | 1.85 | 1.38 | 2.17 | 1.92 |
| 1990 | 2.00 | 1.45 | 2.10 | 1.44 | 2.31 | 1.89 |
| 2023 | 2.18 | 1.85 | 2.21 | 1.82 | 2.32 | 2.10 |
Note: Animal protein share calculated with Equation (2); cereal share of energy calculated analogously; Shannon index calculated with Equation (3). Food balance sheets after 2010 follow the revised FAO methodology; series linked at 2010. Source: By authors based on FAOSTAT, FBSH and FBS [55].
Table 5.
Trend and convergence tests for the share of animal protein in total protein supply (H2).
| Test | Romania | India | Difference RO–IN |
| OLS slope 1990–2023 (pp/year) | 0.352 | 0.304 | 0.049 |
| p-value (OLS) | <0.001 | <0.001 | 0.254 |
| p-value (OLS, Newey–West) | <0.001 | <0.001 | 0.464 |
| Mann–Kendall τ 1990–2023 | 0.66 | 0.93 | – |
| p-value (Mann–Kendall) | <0.001 | <0.001 | – |
| p-value (modified Mann–Kendall) | <0.001 | <0.001 | – |
| Mean difference 1961–1989 (pp) | – | – | 24.7 |
| Slope of difference 1961–1989 (pp/year) | – | – | 0.696 (p < 0.001) |
| Mean difference 1990–2023 (pp) | – | – | 30.0 |
Note: Animal protein share calculated with Equation (2). pp = percentage points. A non-significant slope of the difference after 1990 indicates parallel growth without convergence. Newey–West standard errors with three lags [66]; modified Mann–Kendall test according to Hamed and Rao [67]. Source: By authors based on FAOSTAT [55].
Table 6.
Food access and nutrition outcomes in Romania and India compared with regional and global references.
Table 6.
Food access and nutrition outcomes in Romania and India compared with regional and global references.
| Indicator | Romania | India | Eastern Europe | Southern Asia | EU-27 | World |
| Dietary energy supply, kcal/capita/day (2023–2025) | 3711 | 2705 | 3473 | 2681 | – | 3025 |
| Prevalence of undernourishment, % (2023–2025) | <2.5 | 9.8 | <2.5 | 10.6 | – | 8.1 |
| Moderate or severe food insecurity (FIES), % (2023–2025) | 15.2 | n.a. | 8.6 | 34.9 | – | 26.8 |
| Severe food insecurity (FIES), % (2023–2025) | 5.3 | n.a. | 1.6 | 16.2 | – | 9.8 |
| Unable to afford a meal with meat, fish or vegetarian equivalent every second day, % of population (2025) | 18.1 | – | – | – | 8.5 | – |
| of which: population below 60% of median equivalised income, % (2025) | 35.8 | – | – | – | 20.3 | – |
| Adult obesity, % (2024) | 32.4 | 8.0 | 21.1 | 10.5 | – | 16.2 |
| Anaemia in women aged 15–49 years, % (2023) | 24.3 | 53.7 | 23.5 | 49.3 | – | 30.7 |
Note: n.a. = not published for India. FIES = Food Insecurity Experience Scale. Dietary energy supply in this table is the three-year average 2023–2025 from the FAOSTAT Suite of Food Security Indicators and therefore differs from the single-year food balance sheet values for 2023 in Table 4. Sources: By authors based on FAOSTAT, FS [55] and Eurostat, EU-SILC [56].
Table 7.
Mineral fertiliser use, irrigation and organic farming in Romania and India.
| Indicator | Romania | India | EU-27 |
| Nitrogen, kg N/ha of cropland, 1961 | 26.4 | 1.6 | 29.8 |
| Nitrogen, kg N/ha of cropland, 1990 | 76.2 | 44.5 | 94.2 |
| Nitrogen, kg N/ha of cropland, 2000 | 24.2 | 64.2 | 83.0 |
| Nitrogen, kg N/ha of cropland, 2024 | 50.2 | 131.8 | 83.2 |
| Phosphate, kg P₂O₅/ha of cropland, 1990 | 31.2 | 18.4 | 42.7 |
| Phosphate, kg P₂O₅/ha of cropland, 2024 | 22.6 | 50.0 | 17.3 |
| Potash, kg K₂O/ha of cropland, 1990 | 13.4 | 7.8 | 47.2 |
| Potash, kg K₂O/ha of cropland, 2024 | 9.0 | 14.2 | 22.1 |
| Cropland, thousand ha (2024) | 8787 | 168,010 | – |
| Area equipped for irrigation, thousand ha (2024) | 3177 | 75,500 | – |
| Area actually irrigated, thousand ha (2024) | 515 | 82,416 | – |
| Area actually irrigated, % of cropland (2024) | 5.9 | 49.1 | – |
| Organic agriculture, % of agricultural land (2023) | 5.5 | 2.5 | 11.1 |
Note: In India, the area actually irrigated exceeds the equipped area because several crops per year are grown on irrigated land. Source: By authors based on FAOSTAT, RFN and RL [55].
Table 8.
Emission intensity of selected products, 2021–2023 average (kg CO₂eq/kg product).
| Product | Romania | India | EU-27 | World |
| Cereals excluding rice | 0.14 | 0.24 | 0.15 | 0.18 |
| Rice | – | 0.81 | 2.28 | 0.95 |
| Cow milk | 1.07 | 1.05 | 0.58 | 0.95 |
| Buffalo milk | – | 0.87 | 2.09 | 0.97 |
| Sheep milk | 6.13 | – | 2.55 | 5.73 |
| Goat milk | 1.34 | 1.35 | 0.86 | 2.48 |
| Cattle meat | 20.45 | – | 18.04 | 30.54 |
| Buffalo meat | – | 28.50 | 20.51 | 37.53 |
| Sheep meat | 14.48 | 16.25 | 22.93 | 22.85 |
| Goat meat | 17.01 | 18.57 | 11.21 | 29.30 |
| Pig meat | 2.00 | 4.86 | 1.79 | 1.64 |
| Chicken meat | 0.27 | 0.16 | 0.17 | 0.54 |
Note: “–” = not produced or not reported. Rice in Romania (very small production base) is not reported. FAO Tier 1 estimates, AR5 global warming potentials. Source: By authors based on FAOSTAT, EI [55].
Table 9.
Farm-gate emissions per kilogram of protein supplied (kg CO₂eq/kg protein).
| Area | 2010 | 2015 | 2020 | 2023 |
| Romania | 23.2 | 21.7 | 22.8 | 22.0 |
| India | 31.5 | 29.9 | 27.9 | 26.7 |
| Eastern Europe | 39.2 | 38.6 | 38.7 | 37.8 |
| Southern Asia | 31.7 | 30.1 | 28.7 | 27.8 |
| EU-27 | 35.7 | 36.0 | 34.5 | 32.1 |
| World | 33.7 | 31.9 | 30.3 | 29.7 |
Note: Production-based farm-gate emissions (FAO Tier 1) divided by domestic protein supply, Equation (4); the indicator is not adjusted for trade. Source: By authors based on FAOSTAT, GT and FBS [55].
Table 10.
Yield variability around trend, 1991–2024 (standard deviation of detrended ln yield, %).
| Crop | Romania | India | Ratio RO/IN | F | p(F) | Brown–Forsythe W | p(BF) | Shock years RO | Shock years IN |
| Cereals | 22.9 | 3.4 | 6.8 | 45.8 | <0.001 | 33.0 | <0.001 | 8 | 0 |
| Wheat | 21.2 | 4.3 | 4.9 | 24.2 | <0.001 | 22.8 | <0.001 | 8 | 0 |
| Maize | 30.3 | 5.5 | 5.5 | 30.7 | <0.001 | 31.4 | <0.001 | 6 | 1 |
| Rice | 30.8 | 4.0 | 7.7 | 59.9 | <0.001 | 19.9 | <0.001 | 7 | 0 |
| Pulses | 26.1 | 5.5 | 4.7 | 22.4 | <0.001 | 23.6 | <0.001 | 9 | 0 |
| Potatoes | 12.8 | 6.4 | 2.0 | 4.0 | <0.001 | 6.6 | 0.012 | 3 | 2 |
| Sunflower seed | 24.7 | 12.6 | 2.0 | 3.8 | <0.001 | 5.2 | 0.025 | 5 | 3 |
Note: Deviations from trend calculated with Equation (5). Shock years = years with yields more than 15% below trend (dt < −0.15). Shock years for Romanian cereals: 2000, 2002, 2003, 2007, 2009, 2012, 2020 and 2024. The F test is one-sided (alternative hypothesis: larger variance in Romania). Romanian rice is grown on a very small area; its variability is less representative of the production system. Source: By authors based on FAOSTAT, QCL [55].
Table 11.
Food supply stability and cereal trade position (three-year aggregates).
| Indicator | Period | Romania | India | EU-27 | World |
| Energy supply variability around trend (%) | 2010–2023 | 1.11 | 0.81 | – | – |
| Cereal self-sufficiency ratio (%) | 2010–2012 | 127.6 | 107.2 | 100.3 | 98.5 |
| 2015–2017 | 163.7 | 105.5 | 106.2 | 100.6 | |
| 2021–2023 | 175.6 | 111.6 | 100.7 | 98.5 | |
| Cereal exports (% of production) | 2010–2012 | 32.0 | 5.4 | 39.5 | 16.8 |
| 2015–2017 | 50.6 | 6.3 | 46.9 | 18.6 | |
| 2021–2023 | 69.5 | 11.1 | 53.2 | 20.5 | |
| Cereal imports (% of domestic supply) | 2010–2012 | 17.1 | 0.2 | 39.2 | 18.2 |
| 2015–2017 | 29.3 | 1.1 | 45.9 | 20.7 | |
| 2021–2023 | 36.0 | 0.2 | 53.5 | 22.9 |
Note: Energy supply variability calculated with Equation (5) applied to dietary energy supply. Self-sufficiency ratio according to Equation (6), computed on three-year totals. Romanian and EU-27 trade include intra-EU flows. Source: By authors based on FAOSTAT, FBS [55].
Table 12.
Shares of dietary energy and protein supplied by food items according to their treatment under the EU–India FTA, 2021–2023 average (%).
Table 12.
Shares of dietary energy and protein supplied by food items according to their treatment under the EU–India FTA, 2021–2023 average (%).
| Treatment | Romania | India | ||
| Energy | Protein | Energy | Protein | |
| Protected (excluded from concessions) | 52.2 | 61.4 | 76.0 | 77.3 |
| Partial (tariff-rate quota or partial reduction) | 1.6 | 1.9 | 1.5 | 0.8 |
| Liberalised | 0.2 | 0.3 | 9.5 | 1.0 |
| Not specified | 46.0 | 36.4 | 13.1 | 21.0 |
Note: Shares calculated with Equation (7). Romania: EU treatment of imports from India; India: Indian treatment of imports from the EU. EU side protected: rice, soft wheat, sugar, beef and buffalo meat, poultry, dairy, honey and bananas; tariff-rate quotas: sheep and goat meat, grapes, onions. India side protected: cereals, dairy, poultry, pulses, soybeans, tea, coffee and sugar; liberalised: vegetable oils, alcoholic beverages and sheep meat. Items not named in official documents are classified as “not specified”. Sources: By authors based on FAOSTAT, FBS [55] and FTA documents [58,59,60].
Table 13.
Agricultural products and foodstuffs registered as geographical indications in the EU register (eAmbrosia): Romania, India and EU-27 benchmarks.
Table 13.
Agricultural products and foodstuffs registered as geographical indications in the EU register (eAmbrosia): Romania, India and EU-27 benchmarks.
| Indicator | Value |
| Agricultural products and foodstuffs registered by Romania | 16 |
| Rank of Romania in the EU-27 | 16 |
| EU-27 mean per Member State | 58.6 |
| EU-27 median per Member State | 21 |
| Names of Indian origin registered in the EU | 2 |
Note: Only agricultural products and foodstuffs are shown. Pending applications: Romania—Salam Poiana Mărului and Brânză de burduf de Ibănești; India - Basmati. Names of Indian origin registered in the EU: Darjeeling (2007) and Kangra tea (2008). Source: By authors based on eAmbrosia [45].
Table 14.
Sheep and goat sector in Romania.
| Indicator | 1990 | 2000 | 2010 | 2024 | Share of EU-27, 2024 (%) | Rank in EU-27, 2024 |
| Sheep (million head) | 15.4 | 8.1 | 9.1 | 10.4 | 18.5 | 2 |
| Sheep milk (thousand t) | 403.9 | 320.8 | 651.3 | 434.4 | 14.7 | 4 |
| Sheep meat (thousand t) | 101.5 | 49.2 | 62.6 | 51.7 | 11.6 | – |
| Goats (million head) | 1.02 | 0.56 | 0.92 | 1.43 | 13.6 | – |
Source: By authors based on FAOSTAT, QCL [55].
Disclaimer/Publisher’s Note: The statements, opinions and data contained in all publications are solely those of the individual author(s) and contributor(s) and not of MDPI and/or the editor(s). MDPI and/or the editor(s) disclaim responsibility for any injury to people or property resulting from any ideas, methods, instructions or products referred to in the content. |
© 2026 by the authors. Licensee MDPI, Basel, Switzerland. This article is an open access article distributed under the terms and conditions of the Creative Commons Attribution (CC BY) license (http://creativecommons.org/licenses/by/4.0/).
Copyright: This open access article is published under a Creative Commons CC BY 4.0 license, which permit the free download, distribution, and reuse, provided that the author and preprint are cited in any reuse.