

Submitted:
07 November 2026
Posted:
16 November 2026
You are already at the latest version
Abstract
Objective: The aim of this study is to reduce high-dimensional radiomic features extracted from breast ultrasound images into compact and stable subsets using a multi-stage feature selection process, and to evaluate the effectiveness of these features in classifying benign and malignant breast lesions through various machine learning algorithms. Methods: A total of 647 breast ultrasound images comprising 437 benign and 210 malignant cases obtained from the Breast Ultrasound Images (BUSI) dataset were used in this study. A total of 753 radiomic features were extracted using PyRadiomics, including first-order statistical, shape, and texture features, as well as features derived from wavelet and Laplacian of Gaussian transforms. To reduce feature dimensionality, a multi-stage feature selection approach was employed, consisting of variance filtering, correlation analysis, Mutual Information, Least Absolute Shrinkage and Selection Operator (LASSO), and Recursive Feature Elimination (RFE). Compact radiomic feature sets comprising five and ten features—were evaluated using nine machine learning algorithms through three-, five-, and ten-fold stratified cross-validation. Final model performance was assessed using an 80% development and 20% hold-out test split. Classification performance was evaluated through bootstrap confidence intervals, DeLong and McNemar tests, as well as calibration and decision curve analyses. Feature selection stability and model explainability were investigated using selection frequency, SHAP (SHapley Additive exPlanations), and permutation importance analyses. Results: As a result of a multi-stage feature selection process, compact candidate sets consisting of five and ten features were constructed. SVM and MLP models stood out due to their high classification performance. Explainability analyses, classification performance, and feature selection stability have provided significant opportunities for the multidimensional assessment of the diagnostic potential of compact radiomic feature sets.Conclusions: This study contributes to a comprehensive analysis of compact radiomics-based classification approaches by integrating explainability analyses, feature selection stability, statistical comparisons, and thorough model validation. For future research, validation using multi-center and independent datasets may be required to demonstrate clinical generalizability.
Keywords:
breast ultrasonography
; radiomics
; feature selection
; machine learning
; feature stability
; explainable artificial intelligence
; BUSI
1. Introduction
Breast cancer is one of the most frequently diagnosed malignancies in women worldwide and represents a significant public health issue. Early diagnosis is critical for improving patient prognosis and determining appropriate treatment strategies. Methods such as magnetic resonance imaging (MRI), ultrasonography, and mammography are utilized for the detection and evaluation of breast cancer. Among these, ultrasonography is frequently employed in clinical practice due to its accessibility, absence of ionizing radiation, cost-effectiveness, and its complementary role in examining dense breast tissue. However, the interpretation of ultrasound images can vary depending on the experience of the specialist performing the examination and the morphological characteristics of the lesions. This situation underscores the need for reproducible, computer-aided, and objective assessment approaches to distinguish between benign and malignant breast lesions.
In recent years, the use of radiomic analysis and machine learning methods in the field of medical imaging has provided significant opportunities for incorporating quantitative information derived from images into diagnostic decision-making processes. Radiomic analysis is based on the calculation of numerous quantitative features from medical images, such as intensity distribution, shape, textural heterogeneity, and spatial patterns. Specifically, first-order statistical features, shape descriptors, and texture features—including the Gray-Level Co-occurrence Matrix (GLCM), Gray-Level Run-Length Matrix (GLRLM), Gray-Level Size-Zone Matrix (GLSZM), and Gray-Level Dependence Matrix (GLDM) are utilized for the image-based characterization of lesions. Furthermore, wavelet transforms and Laplacian of Gaussian (LoG) filters enable the extraction of image patterns across various spatial scales. The integration of these features with machine learning algorithms has emerged as a prominent approach for classifying benign and malignant lesions in breast ultrasound images.
Previous studies of breast ultrasound radiomics have shown that quantitative image features can provide discriminatory information in terms of classification. [1] reported high classification performance in the machine learning approach they developed with radiomics and image-based features on the BUSI dataset. [2] reduced the initially extracted 520 radiomic features to 10 features with multistage selection methods and evaluated the diagnostic potential of the selected features in independent test data. [3] demonstrated that reducing radiomic features through importance and correlation analysis can support the classification performance of different machine learning algorithms. Similarly, [4] demonstrated that a limited number of quantitative ultrasound features can be used to differentiate benign and malignant lesions. These findings show that it is important not only to obtain a large number of features in radiomic analysis, but also to identify informative features in terms of classification.
Furthermore, the high dimensionality of the feature space in radiomic analyses presents significant methodological challenges. Particularly in datasets where the number of features is large relative to the sample size, issues such as high inter-feature correlation, redundancy, model complexity, and the risk of overfitting can negatively impact the reliability of classification models. Consequently, feature selection methods such as variance filtering, correlation analysis, Mutual Information, Least Absolute Shrinkage and Selection Operator (LASSO), and Recursive Feature Elimination (RFE) are employed to reduce high-dimensional radiomic data into smaller, more informative subsets. Study [5] highlights the importance of feature selection stability, identifying 48 stable features out of an initial set of 939 radiomic features. Study [6] reduced 851 radiomic features to 12, while study [7] selected 10 key features from a total of 1,558. Furthermore, study [8] demonstrated that high classification performance can be achieved using a limited number of features by deriving compact subsets from a high-dimensional feature space that includes both deep image features and sonographic descriptors.
Another aspect to consider during the feature selection process is the extent to which the selected features remain consistent when data splits or cross-validation folds are altered. Features selected based on a single train-test split can be sensitive to variations in the sample and may not be selected with the same frequency across different subsets of the data. In this context, examining feature selection in terms of stability can provide complementary insights into the robustness of the identified sets of radiomic features. While [9] evaluated the robustness of radiomic features using breast ultrasound data from different clinical centers, [5] assessed the features that were consistently selected throughout the cross-validation process. Nevertheless, the combined examination of various feature selection stages, compact feature set sizes, and cross-validation schemes remains significant, particularly when dealing with open-access datasets that have limited sample sizes.
Achieving high accuracy or a high ROC-AUC score is not, in itself, sufficient to demonstrate the reliability of machine learning models. Especially in datasets with imbalanced class distributions, it is essential to evaluate model performance using complementary metrics such as sensitivity, specificity, the F1-score, and the Matthews correlation coefficient. Furthermore, the calibration of prediction probabilities, decision curve analysis, the examination of confidence intervals, and statistical model comparisons contribute to a more nuanced assessment of classification results. In [10], radiomic models were evaluated using calibration, ROC analysis, the DeLong test, and decision curve analysis. Meanwhile, [11] which conducted evaluations across four publicly available breast ultrasound datasets, including the BUSI dataset demonstrated that performance achieved during internal validation may decline during external validation across different datasets; the study emphasized the necessity of preventing data leakage, as well as the importance of independent validation and model calibration. These findings support the argument that model performance should not be based on a single classification metric alone.
When examining the existing literature, it becomes evident that research in the field of breast ultrasound radiomics addresses key areas such as feature selection stability, dimensionality reduction, comprehensive validation, and model explainability. The process of deriving highly compact feature subsets from high-dimensional radiomic data evaluated through an integrated approach that employs various cross-validation strategies and machine learning algorithms emerges as a significant area for future investigation. In particular, critical aspects that warrant further attention include the extent to which a limited set of selected features can maintain classification performance, the stability of these features across different data splits, and the degree to which the resulting performance outcomes are substantiated by statistical evaluations and explainability analyses.
In this study, 753 radiomic features extracted from a total of 647 ultrasound images of 437 benign and 210 malignant lesions in the BUSI dataset were analyzed and evaluated. Feature extraction involved the use of first-order, textural, and shape-based features, as well as features derived from Laplacian-of-Gaussian (LoG) and wavelet transforms. To reduce the high-dimensional feature space, a multi-stage feature selection approach was employed, incorporating variance filtering, correlation analysis, Mutual Information, LASSO, and Recursive Feature Elimination (RFE). The classification performance of compact candidate feature sets consisting of five and ten features was examined using nine machine learning models; the stability of feature selection and model performance were assessed through three-, five-, and ten-fold stratified cross-validation. Furthermore, the data were partitioned into development and independent hold-out test sets to investigate the performance of the final models on unseen test data. Various dimensions of the classification results were evaluated using ROC and precision–recall curves, calibration, decision curve analysis, bootstrap confidence intervals, DeLong and McNemar tests, as well as SHAP and permutation importance analyses.
The primary objective of this research is to develop and evaluate reliable classification models by reducing high-dimensional radiomic features extracted from breast ultrasound images into compact subsets consisting of a limited number of discriminative and stable features. The expected scientific contribution of this study is to provide evidence for leaner and more systematically evaluated machine learning approaches in breast ultrasound radiomics by examining the relationships between feature selection stability, the number of features, model performance, statistical reliability, and explainability within a unified experimental framework.
Studies in the literature concerning the selection of radiomic features from breast ultrasound images for the analysis of breast lesions, as well as the application of machine learning methods and their diagnostic and classification performance, are briefly summarized below.
[1], developed an approach that combines machine learning with radiomic features to classify benign and malignant breast lesions using the BUSI dataset. The study reports that shape, texture, and histogram-oriented gradient features are discriminative for classification, and that ensemble learning methods, in particular, yield high performance following feature selection and the mitigation of class imbalance. The fact that the developed approach achieves an accuracy rate of 97.4% and an AUC value of 0.97 demonstrates that radiomic features can be effectively utilized for the computer-aided classification of breast ultrasound images, highlighting their potential in this field.
[2], developed a classification approach for distinguishing between benign and malignant breast lesions in ultrasound images by integrating radiomic features with machine learning methods. In this study, an initial set of 520 radiomic features was reduced to a more compact subset of 10 features through analyses of reproducibility, variance, and correlation, as well as a feature selection process based on RFECV (Recursive Feature Elimination with Cross-Validation). A Random Forest classification model, developed using these selected features, achieved an accuracy of 82% and an AUC value of 0.82 on an independent external test dataset. These findings demonstrate the potential of selected radiomic features to contribute to classification processes aimed at distinguishing between benign and malignant lesions in breast ultrasound images.
[3], examined the classification performance of radiomic features and machine learning algorithms for the purpose of distinguishing between benign and malignant lesions in breast ultrasound images. Out of 123 radiomic features extracted using PyRadiomics, 40 were selected through feature importance and correlation analyses; among the various machine learning algorithms tested, Gradient Boosting demonstrated the highest performance, achieving an accuracy of 98.13%. The findings indicate that selected radiomic features can provide high classification performance in distinguishing between benign and malignant breast lesions.
[12], developed an approach for the assessment of breast lesions in the BUSI dataset that integrates UNet-based automated segmentation, radiomic feature extraction, and machine learning. High performance was achieved in the classification of benign versus malignant lesions using radiomic features extracted from both manual masks and masks generated by the UNet model; when ground-truth masks were used, test accuracy reached 98.96% for some models. The study demonstrated that integrating automated segmentation with radiomic analysis and machine learning can be effective for the classification of breast ultrasound images [12].
In a multicenter study [9], the robustness of radiomic features and the classification performance of machine learning models were examined using 1,259 breast ultrasound lesions collected from three different countries. The research aims to identify radiomic features that demonstrate reproducibility across data obtained from different centers and to examine the diagnostic contribution of these features in distinguishing between benign and malignant lesions. The study highlights the importance of evaluating not only the discriminative power of radiomic features in classification tasks but also their stability and consistency when derived from diverse data sources.
In another study [4], the effectiveness of 10 quantitative radiomic features—based on BI-RADS criteria—was investigated for the classification of benign and malignant breast ultrasound lesions. The study, which evaluated a total of 206 breast lesions, compared several algorithms: MLP, Decision Tree, LDA, Random Forest, and SVM. Following ten-fold cross-validation, the SVM model achieved the highest performance, with an AUC value of 0.840. Furthermore, it was determined that lesion margin and orientation were the most prominent features for classification. These findings indicate that a limited number of clinically meaningful radiomic features can be effectively used to distinguish between benign and malignant breast lesions.
[5], investigated the efficacy of radiomic features in the benign–malign classification of breast lesions, using 927 lesions from 816 patients in the BUSI-WHU dataset. Out of 939 radiomic features extracted in the study, 48 were consistently selected across cross-validation folds following statistical analysis, correlation filtering, and Boruta-based feature selection. In a comparison of six different machine learning algorithms, AUC values ranged from 0.828 to 0.834, with no statistically significant superiority observed among the models. SHAP analyses revealed that texture features—particularly those derived from filtered images—played a prominent role in classification decisions. These findings underscore the importance of feature selection stability and model explainability in the development of reliable classification systems.
[13], developed a multimodal model that integrates handcrafted radiomic features, deep learning features, and clinical/ultrasound findings to improve the differentiation between benign and malignant BI-RADS 4A breast lesions. Following feature selection, 29 radiomic and 22 deep learning features were identified, and various machine learning algorithms were compared. While a model based solely on radiomic features achieved an AUC of 0.719 in external validation, the AUC increased to 0.861 when radiomic, deep learning, and clinical/ultrasound features were combined. The findings indicate that, although radiomic features can provide diagnostic information on their own, their integration with deep learning and clinical features can enhance both the generalizability and diagnostic performance of the model.
[14], In an eight-center study conducted in 2026, 851 radiomic features extracted from breast ultrasound images of 3,142 patients were reduced to 12 features through analyses of reproducibility and redundancy, combined with the use of LASSO. Employing multiple machine learning models and SHAP analysis, the study demonstrated that a combined clinico-radiomic model achieved AUC values of 0.92 and 0.93 in external and prospective validation, respectively. The study highlighted the importance of feature selection, explainability, and independent/prospective validation for model generalizability in the field of breast ultrasound radiomics [6].
[7], developed a radiomics and machine learning-based approach for distinguishing between benign and malignant non-mass breast lesions in ultrasound images. In the study, 1,558 radiomic features extracted from 123 lesions in 119 patients were reduced to 10 key features through dimensionality reduction and feature selection processes. These selected features were evaluated using LR, SVM, Random Forest, Extra Trees, and LightGBM models; the radiomics-based LightGBM model achieved an AUC of 0.867 in the validation cohort. When clinical and radiomic data were combined, the model's performance improved to an AUC of 0.933. The findings indicate that reducing high-dimensional radiomic data to a small number of discriminative features and integrating these features with clinical data can be effective for the classification of breast lesions.
[10] extracted 848 radiomic features from the ultrasound images of 619 patients to distinguish between benign and malignant non-mass lesions in dense breast tissue, employing statistical testing, correlation analysis, and LASSO for feature selection. Models that integrated these radiomic features with clinical and ultrasound findings were evaluated using ROC analysis, calibration, decision curve analysis (DCA), and DeLong’s test. The study demonstrated that a multi-stage feature selection process and comprehensive model evaluation can contribute to the development of reliable diagnostic models in ultrasound radiomics.
[15], in their study using the BUSI dataset, integrated radiomic features extracted from breast ultrasound images into a classification system based on hierarchical fuzzy logic. The researchers evaluated 647 images comprising 437 benign and 210 malignant lesions and extracted morphological and intensity-based radiomic features in accordance with IBSI guidelines. To reduce multicollinearity and redundant information among the features, a filtering process was applied to feature pairs with a Pearson correlation coefficient of 0.96 or higher. Subsequently, the radiomic features were fed into a hierarchical fuzzy inference system; a hybrid approach, which also incorporated deep features derived from ResNet50, was evaluated. In this study, a ROC-AUC value of 0.996 and a classification accuracy of 99.60% were reported for the hybrid model. The research findings demonstrate that quantitative radiomic features extracted from breast ultrasound images hold significant potential for the development of decision-support systems that offer high classification performance while prioritizing interpretability. Furthermore, as the study primarily utilized correlation-based methods for feature dimensionality reduction, the exploration of more comprehensive selection strategies with a focus on feature stability is suggested as a key area for future research.
In study [8], the impact of reduced-dimension feature subsets on classification performance was investigated by combining clinical sonographic descriptors with features extracted from breast ultrasound images via deep learning methods. In this context, 768 deep learning-based image features derived from 252 images in the BrEaST-Lesions dataset were integrated with 12 clinical sonographic descriptors to construct a data matrix comprising a total of 780 features. As part of the research, 500 randomly generated feature subsets were analyzed to identify compact combinations, each consisting of 10 features. One of the top-performing combinations formed by integrating six clinical sonographic descriptors with four deep learning-based image features achieved an accuracy of 92%, a ROC-AUC value of 0.9567, and a sensitivity of 100% on an independent test dataset. Furthermore, SHAP analysis was employed to evaluate the contributions of lesion boundaries, morphological shape characteristics, and specific deep learning-based image features to the classification process. The findings indicate that reducing high-dimensional feature spaces into smaller subsets consisting of a limited number of highly discriminative and informative features can help maintain classification performance in breast ultrasound datasets with restricted sample sizes, while also enhancing the interpretability of the developed models.
In study [11], the generalization capabilities of artificial intelligence models based on breast ultrasound images across different datasets were examined within a comprehensive comparative analysis framework, which also addressed controls for preventing patient-level data leakage and the reliability of model predictions. The study utilized a total of 3,052 ultrasound images of benign and malignant breast lesions, compiled from four distinct open-access datasets: BUSI, BUS-BRA, BUS-UCLM, and BrEaST. The performance of the EfficientNet-B0 and Vision Transformer (ViT-B/16) architectures was evaluated and compared using two input strategies: one based on the entire image and the other focused on the region of interest (ROI) containing the lesion. In total, 320 experimental evaluations were conducted, each using five different random initialization conditions. The findings revealed that the mean ROC-AUC value, calculated at 0.801 during internal testing, declined to 0.719 when evaluated on external datasets. It was determined that an ROI-based input strategy significantly improved external classification performance particularly within the ViT architecture increasing the ROC-AUC value from 0.666 to 0.805. Furthermore, it has been reported that following the calibration process applied using the temperature scaling method, the mean expected calibration error decreased from 0.180 to 0.150, while the negative log-likelihood value dropped from 0.848 to 0.682. The study demonstrates that high internal validation performance in breast ultrasound imaging does not guarantee generalizability to different data sources; it further highlights that patient-level data splitting, independent external validation, ROI-based image representations, and calibration analyses are essential for the development of reliable artificial intelligence systems.
Radiomics and machine learning-based studies on the classification of breast ultrasound images in terms of benign and malignant lesions have revealed that high-dimensional image features contain important diagnostic information. Previous studies have shown that radiomic features can be reduced to smaller and distinctive subsets using correlation analysis, LASSO, RFE, Boruta and various statistical filtering methods [2,5,6]. However, existing studies show significant methodological differences in terms of feature selection strategies, number of features selected, stability assessments, and model validation approaches.
Especially in open access breast ultrasound data sets with limited sample size, obtaining extremely compact and stable feature sets from the high-dimensional radiomic feature space and evaluating the classification performances of these sets in different machine learning algorithms together remains important. In addition, high classification success alone is insufficient to demonstrate model reliability; It is emphasized that prevention of data leakage, calibration of prediction probabilities and independent verification results should be taken into account [11].
In this context, the present study evaluates 753 radiomic features extracted from the BUSI dataset using a multi-stage feature selection approach, which comprises variance filtering, correlation analysis, Mutual Information, LASSO, and Recursive Feature Elimination. The study examines the classification potential of compact radiomic sets consisting of 5 and 10 features across various cross-validation schemes and nine machine learning algorithms. Feature selection stability is assessed based on the frequency with which features are selected across different folds, while model performance is validated through an independent hold-out test set, bootstrap confidence intervals, DeLong and McNemar tests, as well as calibration and decision curve analyses. Furthermore, the contributions of the selected features to model predictions are investigated using SHAP and permutation importance methods.
The primary contribution of this study to the literature lies in its integrated experimental framework, which addresses the generation of compact feature sets from high-dimensional radiomic data, the stability of feature selection, the comparison of multiple models, and comprehensive performance evaluation. In this way, the study aims to assess the classification performance achieved with a limited number of radiomic features evaluating it not only in terms of accuracy but also regarding stability, explainability, and statistical reliability.
2. Materials and Methods
In this section, a comprehensive, stability-based and explainable machine learning framework has been developed for the discrimination of benign and malignant breast lesions using radiomic features extracted from breast ultrasonography images in the Busi dataset.
2.1. Study Design
The methodological approach of the study consists of the following: matching images with lesion masks, extracting radiomic features, data pre-processing, multi-stage feature selection, assessing feature stability, comparing different numbers of features, training machine learning models, performing cross-validation and independent hold-out evaluation, examining performance uncertainty via the bootstrap method, conducting statistical comparisons between models, and performing explainable artificial intelligence analyses.
Beyond simply identifying the model that achieves the highest classification accuracy, the primary methodological objective of this study is to detect high-dimensional radiomic features that exhibit high reproducibility and stability, to systematically examine the impact of the number of selected features on the model's classification performance, and to render the decision-making processes of the developed models interpretable through explainability methods. The analyses conducted within the scope of this study are structured around four key methodological stages: (i) the application of a multi-stage feature selection approach; (ii) the examination of the stability levels of the selected features across different cross-validation folds; (iii) the execution of a sensitivity analysis to determine the effect of variations in the number of features on model performance; and (iv) the evaluation of model predictions within an explainable artificial intelligence framework using the SHAP method. In addition to these, multiple cross-validation strategies, independent hold-out evaluation, bootstrap confidence intervals, and statistical comparisons between models were employed to assess the robustness of model performance. Figure 1 presents the methodological design of the study.
2.2. Dataset
In this study, the Breast Ultrasound Images (BUSI) dataset, available on Kaggle (www.kaggle.com), was used. The BUSI dataset contains breast ultrasound images and the corresponding segmentation masks for the lesions present in these images [16]. Although the cases in the dataset consist of three distinct classes malignant, benign, and normal the analyses were conducted solely on benign and malignant lesions, as the objective of the current study is lesion characterization. Prior to analysis, the ultrasonography images were automatically matched with their corresponding lesion masks based on file names. Images lacking a segmentation mask were excluded from the radiomic analysis process. This ensured that radiomic features were extracted exclusively from images containing a defined lesion region in other words, a Region of Interest (ROI).
Table 1 presents the distribution of the dataset into development and independent test sets. A total of 647 ultrasound images of benign and malignant breast lesions were included in the analysis. Of these, 437 (67.54%) were benign lesions, and 210 (32.46%) were malignant lesions. In order to carry out the model development and final evaluation processes independently of each other, the data set is divided into stratified development (80%) and independent testing (20%) sets. The development set contained 517 cases, while the independent test set consisted of 130 cases. The development set included 349 benign and 168 malignant cases, whereas the independent test set comprised 88 benign and 42 malignant cases. The proportions of malignant cases were 32.50% and 32.31%, respectively, indicating that the class distribution was largely maintained across both data subsets.
In the classification stage, benign lesions are coded as class 0, while malignant lesions are coded as class 1.
2.3. Preparation of Images and Segmentation Masks
In the BUSI dataset, the malignant and benign breast ultrasound images were associated with their corresponding segmentation masks through an automated matching process, prior to the radiomic feature extraction stage. The images in PNG, JPG, and JPEG formats were structured to be compatible with the algorithms used in the analysis. To prevent segmentation masks from being evaluated as independent ultrasonography images, files containing the suffix “_mask” in their filenames were excluded from the main list of images and were used exclusively as segmentation masks for their corresponding images.
Following the image-mask pairing, the ultrasonography images were converted into grayscale and represented using a floating-point (float32) data type for subsequent numerical processing. The segmentation masks were also loaded in grayscale, and any pixel values greater than zero within the masks were identified as belonging to the lesion region, resulting in the creation of binary masks. As a result of this process, the lesion region was assigned a value of 1 and the background a value of 0, thereby defining the region of interest (ROI) to be used in the radiomic analysis.
The process of preparing images and masks is illustrated in Figure 2. The top row of the figure presents examples of a benign lesion, while the bottom row shows examples of a malignant lesion. The figure displays the original ultrasound images (A and E), the segmentation masks provided in the dataset (B and F), these masks converted into binary region-of-interest (ROI) formats (C and G), and the determined ROI boundaries overlaid onto the corresponding ultrasound images (D and H). This procedure ensures that radiomic features are extracted specifically from the lesion regions defined by the segmentation masks, rather than from the entire image area.
2.4. Extraction of Radiomic Features
All analyses were conducted in a Jupyter Notebook environment using the Python programming language. PyRadiomics and SimpleITK were used for radiomic feature extraction and medical image processing; pandas and NumPy for data manipulation and numerical computations; and scikit-learn for data preprocessing, feature selection, cross-validation, and fundamental machine learning analyses. XGBoost and CatBoost libraries were utilized for implementing the relevant classification models, SHAP for explainable AI analyses, SciPy for statistical calculations, and Matplotlib for generating plots.
In analyses involving randomness where a 'random state' parameter can be specified `random_state=42` has been used to enhance reproducibility. Version information for Python and the core libraries employed in the analyses has been recorded from the working environment and reported to support the reproducibility of these analyses.
During the pre-processing stage, the grayscale ultrasonography images and their corresponding binary segmentation masks were converted into SimpleITK-compatible image objects. Using these segmentation masks, the lesion areas were defined as regions of interest (ROI), and radiomic features were calculated exclusively within these regions.
To ensure that radiomic characterization is not limited solely to the intensity and texture features present in the original ultrasound images, derived images based on Wavelet and Laplacian of Gaussian (LoG) transforms have also been included in the analysis, alongside the original images. As a result of wavelet transformation, LH, HL, HH and LL subbands were obtained. These transformations allowed representing different spatial frequency components of the image and evaluating different tissue patterns within the lesion. The LoG filtering process was applied at values of σ = 1.0, 2.0 and 3.0, aiming to radiomically evaluate image structures at different spatial scales.
The image transformations used in the radiomic analysis are shown in Figure 3. The figure displays the region of interest (ROI) boundary and the corresponding binary ROI mask on the original breast ultrasound image, as well as the Wavelet-LH, Wavelet-HL, Wavelet-HH, and Wavelet-LL images derived from the same source, along with Laplacian-of-Gaussian (LoG) images generated using σ values of 1.0, 2.0, and 3.0. In this context, the aim is to characterize the same lesion through a holistic approach that integrates the intensity properties of the original image with image patterns that emerge at various spatial frequencies and scales.
2.5. Data Preprocessing and Data Cleaning
The feature matrix generated for the extraction of radiomic features underwent quality control and data pre-processing to ensure data quality. In this context, feature columns containing missing values or duplicates were first removed from the dataset. Subsequently, variables serving as metadata—such as class labels, class names, and image identifiers were separated from the radiomic feature matrix, ensuring that only numerical radiomic features were used as inputs for the training and evaluation of machine learning models. During the numerical data conversion process, any resulting infinite values were redefined as missing data, and feature columns containing missing observations were excluded from the analysis. Prior to the feature selection stage, the radiomic variables were standardized using the StandardScaler method. The standardization parameters employed in this process were derived exclusively from the respective training dataset, and these calculated parameters were then applied to the test data to perform the same transformation. This approach was intended to prevent potential information leakage from the test dataset into the training phase and to ensure the reliability of the model evaluation process.
2.6. Independent Hold-Out Evaluation
In radiomics studies with high-dimensional feature space and limited sample size, evaluating the performance of machine learning models only on development datasets may lead to overestimation of model success and increased risk of overfitting [17,18]. In this context, conducting the model development phase and the final performance evaluation process independently of each other is of critical importance for a more objective and reliable assessment of the generalization capabilities of the developed predictive models [19].
Standardization, feature selection, feature stability analysis, sensitivity analysis regarding the number of features, and model development using 3-fold, 5-fold, and 10-fold cross-validation were performed exclusively on the 80% development set. The independent 20% test set was not used in any of these processes and was kept separate until model development was complete.
Candidate models, identified based on cross-validation results within the development set, were subjected to a final evaluation on an independent test set following the completion of model and feature selection. This approach aimed to compare the generalizability of the candidate models to instances not previously encountered during the model development process. Performance on the independent test set was assessed using metrics such as Accuracy, Precision, Sensitivity, Specificity, F1-score, MCC, and ROC-AUC, alongside a confusion matrix and relevant performance curves.
2.7. Multi-Stage Radiomic Feature Selection and Stability Analysis
The 753 features obtained through radiomic feature extraction were subjected to a multi-stage feature selection process before being fed into the classification models. To prevent data leakage and the resulting performance bias, all stages of standardization and feature selection were performed using only the relevant training data within each fold of the cross-validation process. Samples in the test fold were not used in any stage of the feature selection process.
To mitigate the impact of features existing on different scales on subsequent selection stages, radiomic features in each training fold were standardized using `StandardScaler`. The parameters used in the standardization process were determined based solely on the data within the respective training fold to prevent data leakage. Following this, the feature selection process was conducted using a five-stage approach, which involved the sequential application of the following methods: variance-based filtering, correlation-based elimination, MI, LASSO, and RFE.
- Stage One – Variance filter; following the standardization process, the radiomic features were analyzed in terms of their variance levels using the VarianceThreshold method, with a threshold value of 0.01 set for filtering. Features with a variance below this threshold were excluded from subsequent stages of the analysis [20]. This approach aims to remove features from the dataset that exhibit limited variability across samples in the training set and may offer little informational value for distinguishing between classes [21].
- Stage Two – Correlation filter; High-dimensional datasets obtained as a result of radiomic feature extraction may contain many variables that represent similar image characteristics and are highly correlated with each other. This situation can increase model complexity by causing information redundancy and multicollinearity among features and can negatively affect the interpretability of the resulting models [22,23]. Absolute correlation coefficients between the remaining features after the variance filter were calculated. One of the highly correlated feature pairs with an absolute correlation coefficient above 0.90 was removed from the analysis. Thus, it is aimed to reduce the information redundancy resulting from radiomic variables carrying largely similar information and to create a more compact feature space.
- Stage Three – MI; Relying solely on methods based on linear correlation to evaluate the relationships between radiomic features and the target class may lead to overlooking complex, non-linear dependencies. Mutual Information (MI)—a criterion rooted in information theory—is employed in supervised feature selection problems because it can assess the statistical dependence between variables without requiring the assumption of a linear relationship [24,25,26,27]. Following the correlation filter, the relationships between the remaining features and the benign/malignant class labels were evaluated using the Mutual Information (MI) method. The features were ranked in descending order based on their MI scores, and the method was structured to carry forward up to 200 features—specifically those with the highest MI scores—to the next stage. In cases where fewer than 200 features remained after the correlation filter, all existing features were retained and ranked according to their MI scores. This stage was intended to account for non-linear dependencies between the features and the target class.
- Stage Four – LASSO; In high-dimensional radiomic datasets, the inclusion of variables that contribute minimally to classification can increase model complexity and introduce the risk of overfitting. L1-regularization-based methods (LASSO) can perform simultaneous coefficient shrinkage and variable selection by applying a regularization term to the regression coefficients, effectively reducing some of them to exactly zero [27,28,29,30]. The application of this approach to binary classification problems—in the form of L1-regularized logistic regression—is also methodologically supported [31]. LASSO was applied to the features that passed the MI stage. The model is configured with parameters penalty="L1", solver="liblinear" and C=0.1. The class_weight="balanced" option was used to reduce the effect of imbalance in class distribution. Variables whose coefficients remained different from zero as a result of L1 regularization were accepted as candidate features for the next selection stage. At this stage, no MI-based fallback mechanism was used and only the features protected by LASSO were transferred to the RFE stage.
- Stage Five – RFE; In high-dimensional radiomic datasets, identifying features that contribute minimally to classification performance and constructing models with a smaller number of variables are key objectives of the feature selection process. RFE is a supervised feature selection approach that iteratively eliminates variables of lower importance—based on feature importance scores calculated by a base estimator—thereby reducing the feature space to a predetermined target dimensionality [32,33,34,35,36]. A Random Forest-based Recursive Feature Elimination (RFE) was applied to the candidate features retained by LASSO. RFE iteratively eliminated features based on their importance scores—derived from the estimator—until the number of features was reduced to a predetermined target count. A Random Forest model, consisting of 200 trees and utilizing balanced class weights, served as the RFE estimator. Within the primary LASSO-RFE selection pipeline, parsimonious sets of candidate radiomic features—comprising 5 and 10 features, respectively—were generated.
2.8. Feature Stability Analysis
Feature stability analysis was conducted to evaluate the reproducibility of feature selection across different data splits. Feature selection stability refers to the extent to which a selection algorithm can consistently identify similar features when applied to different training samples. Previous research has shown that, particularly in high-dimensional datasets, sample variability can influence the sets of features selected; therefore, feature selection should be specifically assessed in terms of its stability [37,38].
In this regard, stability analysis was conducted separately for 3-fold, 5-fold, and 10-fold stratified cross-validation schemes. For each cross-validation fold, all stages of standardization and feature selection were independently re-executed using only the corresponding training data. This approach aims to reduce the risk of data leakage by preventing the transfer of information from validation data to the feature selection process. It has been previously demonstrated that performing feature selection outside of cross-validation in radiomics research can lead to biased estimates of model performance [39].
For each radiomic feature, the selection count is defined as the number of folds in a given cross-validation scheme in which the feature was selected. The selection frequency is calculated by taking the ratio of the number of folds in which the feature was selected to the total number of cross-validation folds.
Selection frequency = Number of folds in which the feature was selected/Total number of cross-validation folds.
For instance, in 10-fold cross-validation, a feature selected in all 10 folds is assigned a selection frequency of 1.00 (100%), while a feature selected in eight folds is assigned a selection frequency of 0.80 (80%). The same calculation was applied to 3-fold and 5-fold cross-validation schemes. Stability metrics are treated not as direct indicators of the clinical or biological significance of features, but rather as methodological criteria for evaluating the reproducibility of feature selection across different data splits.
2.9. Sensitivity Analysis of the Number of Features
Radiomic datasets are susceptible to methodological issues such as high dimensionality, redundancy among features, and overfitting due to the fact that they contain a large number of quantitative imaging features relative to a limited number of observations. Consequently, reducing the number of features is considered a crucial step in the development of more compact and generalizable classification models [39,40].
Independent of the main LASSO-RFE feature selection pipeline, a separate feature count sensitivity analysis was performed to evaluate the sensitivity of classification performance to the number of radiomic features used. In this analysis, Random Forest-based Recursive Feature Elimination (RF-RFE) method was used without applying LASSO after standardization, variance filter, correlation filter and MI-based feature ranking. RFE is a feature selection approach based on iterative elimination of features based on their importance obtained from the model [32]. The use of MI-based feature evaluation together with subsequent selection methods is compatible with the literature on obtaining informative and compact feature sets from high-dimensional data [41].
Seven alternative radiomic feature sets, consisting of 5, 10, 20, 40, 60, 80, and 100 features, were generated using RF-RFE. The specific numbers of features were predetermined to allow for a systematic and comparative evaluation of the impact that low- and high-dimensional radiomic feature representations have on classification performance. Previous radiomic studies in the literature have examined the effects of selected feature subsets of varying sizes on model performance, reporting that an increase in the number of features used does not always result in a significant improvement in performance [42].
The impact of each specific number of selected features on classification performance was examined independently within the framework of 3-, 5-, and 10-fold stratified cross-validation strategies. Conducting feature selection processes using only data from the respective training folds was adopted as a fundamental methodological approach to prevent potential information leakage from the validation datasets into the training process, thereby avoiding overly optimistic performance estimates that could otherwise arise [39].
As part of the analysis, the effects of variations in the dimensionality of the feature space on classification success were systematically examined; furthermore, an assessment was conducted to determine whether parsimonious feature subsets—consisting of a smaller number of variables—could achieve predictive performance levels comparable to those of high-dimensional radiomic representations. In previous research within the field of radiomic modeling, it is emphasized that, among models with comparable predictive performance, approaches utilizing a smaller number of features may offer advantages by reducing model complexity and leading to simpler model structures [43].
In this design, two distinct methodological objectives are separated. The primary LASSO-RFE selection pipeline is employed to identify a small, reproducible set of radiomic features, while an RF-RFE sensitivity analysis—excluding the LASSO component—is conducted as an independent experimental evaluation to examine the impact of varying the number of features on classification performance.
2.10. Machine Learning Models
In the classification process aimed at distinguishing between benign and malignant breast lesions based on radiomic features, the performance of nine distinct machine learning algorithms—each rooted in different learning principles—was evaluated and compared. Previous radiomic studies utilizing breast ultrasound images have employed methods such as Random Forest (RF), Support Vector Machine (SVM), Multi-Layer Perceptron (MLP), XGBoost, and various ensemble learning techniques to classify benign and malignant lesions; this provides a significant methodological foundation for conducting a comparative analysis of the performance of classification algorithms based on diverse learning strategies.
In line with this, RF, SVM, Gradient Boosting, AdaBoost, MLP, XGBoost, CatBoost, Soft Voting Classifier, and Stacking Classifier have been included in the study.
RF represents the ensemble learning approach that combines the predictions of multiple decision trees [33], SVM represents the creation of a maximum margin decision boundary between classes [44], and Gradient Boosting, AdaBoost, XGBoost and CatBoost represent different boosting mechanisms [45,46,47,48]. The MLP model allows modeling of nonlinear feature–class relationships through a multilayer artificial neural network [49].
To leverage the complementary predictions of different learning mechanisms, ensemble models—specifically Soft Voting and Stacking—have been constructed. In both ensemble models, Random Forest (RF), Gradient Boosting, and Support Vector Machines (SVM) were employed as base learners.
In a Soft Voting Classifier, the final class prediction is obtained by combining the class probabilities estimated by the base learners. In a Stacking Classifier, on the other hand, a second-level meta-classifier is used, which leverages the predictions made by the base learners. The stacking approach is based on combining the predictions of different learners through a high-level model [50]. In this study, logistic regression with balanced class weights was chosen as the meta-classifier. By comparing the algorithms across different learning mechanisms, the aim was to evaluate the sensitivity of the classification performance of radiomic features to the choice of model.
2.11. Cross-Validation Strategy
To evaluate the sensitivity of the classification performance of machine learning models to different data splits and to examine the dependence of the results on a specific cross-validation configuration, 3-fold, 5-fold, and 10-fold stratified cross-validation strategies were employed. Previous methodological research has demonstrated that the number of folds used in cross-validation can influence the bias and variance of performance estimates [51,52].
In each cross-validation strategy employed in this study, the StratifiedKFold method was used to ensure that the class distributions of benign and malignant lesions remained as balanced and proportionally consistent as possible across the training and validation folds. Stratified cross-validation is a sampling technique designed to minimize variability in class distribution across different folds a particularly useful approach for datasets where the number of samples per class is imbalanced [51].
In this study, 3-, 5-, and 10-fold cross-validation strategies were comparatively analyzed across seven distinct feature subsets, each containing 5, 10, 20, 40, 60, 80, and 100 radiomic features, respectively. The objective was to conduct a systematic and comprehensive evaluation of the potential effects that variations in the number of folds—used during the cross-validation process and the dimensionality of the feature space have on classification performance.
2.12. Confusion Matrix and Classification Performance Metrics
The classification performance of each model was examined using the Accuracy (1) equation, Precision (2) equation, Sensitivity (3) equation, Specificity (4) equation, F1-score (5) equation, MCC (6) equation and ROC-AUC criteria. By evaluating these criteria together, it is aimed to comprehensively examine both the general classification success and the performance regarding positive and negative classes. It has been reported that using Accuracy and F1-score criteria alone can be misleading, especially in problems with unbalanced class distribution, and that MCC provides complementary information by considering the four components of the confusion matrix together [53].
The discriminative performance of the models at various classification thresholds was evaluated using ROC curves and ROC-AUC values. ROC-AUC was employed as a threshold-independent performance metric that summarizes the degree to which positive and negative instances can be distinguished based on their prediction scores [54,55]. In addition, Precision–Recall curves have been examined—particularly in data structures where malignant lesions are defined as the positive class and the class distribution is imbalanced—to evaluate both the accuracy and sensitivity of positive predictions [56]. Key performance metrics derived from the confusion matrix were calculated as follows: malignant lesions were considered the positive class (1), and benign lesions were considered the negative class (0). These are defined as True Positive (TP), True Negative (TN), False Positive (FP), and False Negative (FN).
To account for the potential impact of class imbalance on performance evaluation, the MCC was also calculated:
For the final evaluation, 20% of the dataset has been set aside as a hold-out test set, independent of the model development and feature selection processes. This approach is based on the necessity of evaluating the selected models on previously unseen samples, as the cross-validation results obtained during model selection may be subject to optimism bias [57,58].
Average ROC-AUC was determined as the primary criterion in ranking the models. If ROC-AUC values were equal or similar, F1-score, MCC and Accuracy values were taken into consideration, respectively. Five candidate models determined as a result of different feature numbers and cross-validation configurations were finally evaluated on the 20% hold-out test set that was not used in the development process. For each model, the distributions of TP, TN, FP, and FN were visualized using confusion matrices; performance results on the held-out test set were reported separately from the cross-validation results.
Calibration curves were created for models that provide probability output to evaluate the agreement of the predictive probabilities produced by the models with the observed malignancy rates. Thus, not only the ability of the models to distinguish benign and malignant lesions, but also the compatibility of the prediction probabilities they produced with the observed results was evaluated.
2.13. Decision Curve Analysis
Decision Curve Analysis (DCA) was performed on an independent hold-out test set to evaluate the potential clinical utility of candidate machine learning models at various decision thresholds. DCA is a decision analysis approach that considers not only the statistical discrimination performance of predictive models but also the potential clinical benefits and harms of decisions based on model predictions [59].
In the analysis, malignant breast lesions were defined as the positive class, and net benefit values were calculated for each model across various threshold probabilities. Net benefit was derived by subtracting the weighted impact of false-positive classifications weighted according to the threshold probability—from the contribution of true-positive classifications [60].
The decision curve of each model was compared to the reference strategies treat-all, where all events are considered positive, and treat-none, where no events are considered positive. Thus, it was evaluated whether model-based decision strategies provide additional net benefits compared to reference approaches at different threshold probabilities [59,60,61].
DCA has been employed as a complementary analysis to evaluate "decision benefit" an aspect that traditional discrimination metrics, such as ROC-AUC, cannot capture on their own. Threshold probabilities are considered within the framework of decision preferences, which reflect the relative consequences of false-positive and false-negative decisions [60].
In this context, it was examined whether models demonstrating high classification performance yield a higher net benefit at various decision thresholds than "treat-all" or "treat-none" strategies. The results of the Decision Curve Analysis (DCA) were interpreted not as proof of the models' proven utility in actual clinical practice, but rather as a comparative indicator of their potential clinical benefit under specific decision-making assumptions.
2.14. Bootstrap Confidence Intervals
A non-parametric bootstrap resampling analysis was conducted to assess the sampling uncertainty of the classification performance estimates obtained on an independent hold-out test set. The bootstrap method allows for an approximate evaluation of the sampling distribution of statistical estimates by generating repeated samples from the observed sample, with replacement [62,63].
In this regard, 1000 bootstrap iterations were performed using the observations from an independent hold-out test set. In each iteration, a new sample of the same size as the test set was generated via sampling with replacement, and the metrics Accuracy, Precision, Sensitivity, Specificity, F1-score, ROC-AUC, and MCC were recalculated using the predictions obtained from the pre-trained models for the corresponding observations.
For each performance metric, an empirical distribution of the values obtained from bootstrap samples was constructed, and two-sided 95% confidence intervals were calculated using the 2.5th and 97.5th percentiles of this distribution. This approach is known as the percentile-based bootstrap confidence interval method and is widely used to assess the uncertainty of statistical estimates [63,64].
Since ROC-AUC relies on distinguishing observations belonging to positive and negative classes based on their prediction scores, it is considered necessary for both classes to be represented in the bootstrap samples [54]. Therefore, bootstrap samples containing only a single class were excluded from the ROC-AUC confidence interval calculation.
2.15. Statistical Model Comparisons
Paired model comparisons were performed to examine the statistical significance of the differences between the discriminative performances of candidate machine learning models evaluated in the independent hold-out test set. Since the predictions obtained on the same test samples are statistically related, methods that take this dependency structure into account were preferred in model comparisons.
The differences in ROC-AUC between the reference model and other candidate models were evaluated using the non-parametric paired DeLong test, based on the malignancy probabilities obtained for the same test samples. The DeLong method allows for the statistical assessment of differences in discriminative performance by accounting for the covariance between AUC estimates of ROC curves derived from the same cases [65].
The McNemar test was also applied to evaluate the differences between the thresholded classification decisions of the models. In this analysis, instances that were classified correctly by the reference model but incorrectly by the model being compared were contrasted with instances that were classified incorrectly by the reference model but correctly by the model being compared. The McNemar test is a method used to evaluate differences between paired binary outcomes [66] and is also among the statistical approaches recommended for comparing classification algorithms [67].
Given that the number of discordant classifications between models on an independent test set may be limited, the version of the McNemar test based on the exact binomial distribution was employed. This reduces reliance on the asymptotic chi-square approximation when the number of discordant pairs is small.
To account for the multiple hypothesis testing problem that may arise when comparing multiple candidate models against a reference model, the Holm-Bonferroni correction was applied to the p-values. The Holm method is a step-wise correction approach designed to control the family-wise Type-I error rate in multiple comparisons [68].
The level of statistical significance was set at a two-sided α = 0.05. Comparison results were evaluated using both raw and adjusted p-values; findings that were not statistically significant were not interpreted as evidence of equivalence between the models.
2.16. Permutation Importance (PI)
A permutation feature importance analysis was conducted to evaluate the dependence of the final machine learning model's predictive performance on the selected radiomic features, using a model-agnostic approach. This approach is based on the change in the model's predictive performance resulting from the random shuffling of a feature's values across observations [33,69].
The analysis was conducted on a hold-out test set kept separate from the model development process using the final, pre-trained model with its parameters held constant. ROC-AUC was employed as the baseline performance metric. For each radiomic feature, its values were independently and randomly shuffled 30 times across the test observations, while the values of all other features remained unchanged. Following each permutation, the model’s ROC-AUC value was recalculated and compared against the baseline ROC-AUC.
The PI value for each feature was determined based on the arithmetic mean of the differences between the initial ROC-AUC value and the ROC-AUC values calculated after the permutation process, averaged over 30 independent iterations. The features were ranked in descending order according to their mean importance values and are reported alongside the standard deviations of the importance values obtained from the permutation iterations.
Through this analysis, the extent to which the final model’s discriminative performance on the hold-out test set relied on specific radiomic features was evaluated [69]. It was also taken into account that PI values can be influenced by correlations between features and, therefore, cannot be interpreted in isolation as an indicator of causal or independent biological significance [7].
2.17. SHAP-Based Explainable Artificial Intelligence Analysis
The SHapley Additive exPlanations (SHAP) method was employed to evaluate the prediction mechanisms of machine learning models and the contributions of radiomic features to model outputs. SHAP is a unified feature attribution approachbased on Shapley values from cooperative game theory—that quantitatively assesses the contribution of each individual feature to a specific model prediction [71].
For the candidate models, feature contribution values were calculated using SHAP explainers tailored to each model's architecture. For tree-based models and others directly supported by the relevant SHAP explainer the TreeSHAP approach was employed [72]. In cases where tree-based explanation was not applicable, a general SHAP explanation approach, based on the model's prediction function, was applied [71].
To limit computational costs, the background dataset used for SHAP explanations has been restricted to a maximum of 50 development/training samples. The number of independent hold-out test samples to be explained has been capped at 100. These sampling limits were implemented in accordance with the study's available computational resources and the design of the analysis.
SHAP values were visualized using beeswarm plots to examine the distribution of the contributions of radiomic features to individual predictions. A maximum of 20 radiomic features are displayed in these plots. To assess global feature importance, the mean absolute SHAP value for each feature was calculated across the test samples. In this regard, by integrating the local contributions of features to individual predictions, complementary explanations have been obtained that allow for a more comprehensive interpretation of the model's overall predictive behavior [72].
In beeswarm plots, the distribution and direction of the contributions of features to the model output are evaluated through the magnitude and sign of their SHAP values. Meanwhile, mean absolute SHAP values are used to rank the features based on the overall magnitude of their contributions.
SHAP results were interpreted in conjunction with feature selection frequencies calculated across cross-validation splits. In this context, the contributions of radiomic features consistently selected across different data splits to the final model predictions were further examined. Feature selection stability and SHAP-based feature contribution were treated as complementary analyses that evaluate distinct methodological dimensions [37,72].
It was taken into account that correlations between radiomic features could affect SHAP attributions, and the obtained explanations were not interpreted as causal or direct biological effect indicators [73].
2.18. Learning and Validation Curves
A learning curve analysis was conducted on the development dataset to evaluate the learning behavior of the final candidate model in relation to the size of the training sample, as well as the resulting changes in its generalization performance. Learning curves are used to assess a model's sensitivity to the amount of data by enabling an examination of the relationship between the size of the training sample and classification performance [74,75].
In this context, the model was retrained using subsets of the training data of varying sizes, and ROC-AUC values for both the training and cross-validation sets were calculated for each subset size. The training sample sizes were incrementally increased from approximately 10% to 100% of the maximum available training sample size within the cross-validation framework. By examining the training and validation performance together, the model’s learning behavior in relation to sample size, as well as its potential to benefit from additional training data, were evaluated [74,75].
To assess the sensitivity of model performance to variations in a selected hyperparameter, a validation curve analysis was also conducted. The hyperparameters examined within the scope of the analysis, along with their respective value ranges, were determined by taking into account the structural characteristics of each model; for every defined hyperparameter setting, ROC-AUC values for both the training and cross-validation processes were calculated individually. Accordingly, the effects of variations in hyperparameter values on the model's training and validation performance were evaluated on a comparative basis.
Learning and validation curves were utilized to analyze the discrepancies between performance values obtained during the training and cross-validation phases, as well as to identify any tendencies toward overfitting or underfitting in the models. Furthermore, given that cross-validation results in datasets with limited sample sizes can be influenced by variability in the sample distribution, performance evaluations were conducted with this limitation in mind [17].
It has been taken into account that using the same dataset for both hyperparameter optimization and the evaluation of model performance can lead to an optimistic bias in performance estimates [76]. Accordingly, the generation of learning and validation curves was restricted solely to the model development dataset, while an independent hold-out test set was excluded from these analyses and reserved for the final performance evaluation.
3. Results
In this section, as a result of applying a multi-stage feature selection approach, compact candidate feature subsets consisting of five and ten radiomic features, respectively, were obtained.. The diagnostic potential of compact radiomic feature sets has been evaluated through a multidimensional analysis covering the high classification performance of candidate machine learning models, the stability of feature selection, classification accuracy, and model explainability.
3.1. Radiomic Feature Extraction Results
As a result of the radiomic feature extraction, a total of 753 radiomic features were obtained from the Original, Wavelet and LoG-based images. The distribution of these features according to image type and radiomic feature families is shown in Table 1. The radiomic features were derived from the First-order, GLCM, GLRLM, GLSZM, GLDM, Neighbouring Grey Tone Difference Matrix (NGTDM) and two-dimensional shape (Shape2D) feature families. As a result of feature extraction, a total of 753 radiomic variables/features were generated. Of these, 144 were First-order, 192 were GLCM, 128 were GLRLM, 128 were GLSZM, 112 were GLDM, 40 were NGTDM and 9 were Shape2D features.
When evaluated in terms of image types, as shown in Table 2, 102 features were extracted from the original ultrasonography images. A total of 372 Wavelet-based features were obtained comprising 93 features from each of the four Wavelet sub-bands along with 279 LoG-based features, consisting of 93 features from each of the three different LoG scales. Shape2D features were calculated exclusively from the original images, yielding nine two-dimensional morphological features. By combining the features derived from the Original, Wavelet, and LoG images, an initial radiomic feature matrix consisting of a total of 753 variables was constructed.
Diagnostic variables created by PyRadiomics during feature extraction are not included in the radiomics feature matrix. The resulting 753 radiomic features were transferred to the subsequent data preprocessing and multistage feature selection stages.
3.2. Results of Feature Reduction and Feature Selection
Following radiomic feature extraction and data cleaning, a total of 753 radiomic features were included for evaluation. Table 3 presents the changes in the number of features throughout the feature selection stages. According to Table 3, the intra-fold feature selection analyses indicated that the most significant reduction in the feature space occurred during the correlation filter and LASSO stages. Following the variance filter, all 753 initial features were retained; however, the application of a correlation threshold of |r| > 0.90 reduced the number of features to approximately 160–175 across different cross-validation folds. Since the number of features remaining after the correlation filter was below 200, the Mutual Information (MI) stage did not result in further numerical dimensionality reduction; however, it allowed for the ranking of the remaining features based on their relationship with the target class. The application of L1-regularized logistic regression further sparsified the feature space, and subsequent use of RFE led to the creation of candidate radiomic feature sets consisting of 5 and 10 features. In a separate sensitivity analysis regarding the number of features, alternative feature sets consisting of 5, 10, 20, 40, 60, 80, and 100 features were evaluated using 3-fold, 5-fold, and 10-fold cross-validation schemes. This was done to examine whether classification performance depends solely on a specific number of features.
3.3. Stability of Radiomic Features
Feature stability analysis demonstrated that certain radiomic variables were consistently reselected across different cross-validation schemes and training subsamples. Table 3 presents the stability results for the radiomic analysis involving 5 features. According to Table 4, it is understood that especially in the five-feature radiomic analysis, original_shape2D_Elongation, original_shape2D_Sphericity and wavelet-LH_glszm_ZoneEntropy features show 100% selection frequency in all 3-fold, 5-fold and 10-fold cross-validation schemes. The selection frequency of the Original_glrlm_RunEntropy feature was found to be 66.7%, 80% and 70% in 3-fold, 5-fold and 10-fold layouts, respectively. log-sigma-1-0-mm-3D_glszm_ZoneEntropy showed a selection frequency of 60% in the 5-fold analysis and 80% in the 10-fold analysis.
Table 5 presents the stability results for the radiomic analysis involving 10 features. A stable core set of features was observed in this 10-feature radiomic analysis. The features `original_shape2D_Elongation`, `original_shape2D_Sphericity`, `original_glrlm_RunEntropy`, and `wavelet-LH_glszm_ZoneEntropy` were selected in every fold of the 10-fold analysis, achieving a selection frequency of 100%. In addition, log-sigma-2-0-mm-3D_firstorder_Skewness, log-sigma-1-0-mm-3D_glszm_ZoneEntropy, wavelet-HL_firstorder_Skewness, and wavelet-LL_gldm_DependenceVariance showed selection frequencies of 90%, 80%, 80%, and 70%, respectively.
These results have demonstrated that, across different data splits, features specifically 'shape2D' features representing lesion geometry, as well as wavelet and texture features reflecting tissue heterogeneity were selected in a reproducible manner.
3.4. Model Performance and Identification of Candidate Models
Model comparisons conducted on the development set revealed that radiomic feature sets consisting of five features performed particularly well. Based on the rankings established within the development set, the SVM, MLP, Stacking Classifier, XGBoost, and Voting Classifier were selected as the five candidate models to be carried forward for independent test evaluation. Table 6 presents these top five models, as identified in the development set, along with their cross-validation performance results.
The SVM configuration with 3-fold cross-validation and 5 features emerged as the top-performing setup during the development phase, yielding an average ROC-AUC value of 0.9951 ± 0.0024. For this same configuration, the following metrics were calculated: accuracy 0.9574 ± 0.0034, sensitivity 0.8988 ± 0.0273, specificity 0.9857 ± 0.0098, F1-score 0.9320 ± 0.0066, and MCC 0.9028 ± 0.0076.
In the 10-fold, 5-feature configuration for the MLP, the results were determined as follows: ROC-AUC 0.9940 ± 0.0140, accuracy 0.9768 ± 0.0177, sensitivity 0.9526 ± 0.0542, and MCC 0.9483 ± 0.0392. For the Stacking Classifier, the ROC-AUC was found to be 0.9932 ± 0.0099; for XGBoost, 0.9929 ± 0.0050; and for the Voting Classifier, 0.9906 ± 0.0132.
These findings demonstrated that high discriminative performance in the development set was not unique to a single classifier, and that high performance was achieved across different model families using compact radiomic representations consisting of five features.
3.5. Classification Performance on an Independent Test Set
The five candidate models identified during the development phase were evaluated on an independent test set of 130 cases, which had not been used during the model development process. Sampling uncertainty in the performance on the independent test set was assessed using a bootstrap analysis with 1,000 iterations (95% confidence interval). Even when accounting for the uncertainty in test performance as indicated by the bootstrap results the candidate models demonstrated high discriminative performance on the independent test set.
Table 7 presents the performance of the 5 models on the independent test set. According to Table 7, the metrics for the MLP model are as follows: accuracy 0.9846, precision 0.9762, sensitivity 0.9762, specificity 0.9886, F1-score 0.9762, ROC-AUC 0.9981, and MCC 0.9648. SVM, Voting Classifier, and Stacking Classifier yielded identical classification matrix results; for all three models, the accuracy was 0.9923, precision 1.000, sensitivity 0.9762, specificity 1.000, F1-score 0.9880, and MCC 0.9825. The ROC-AUC values for the SVM, Voting Classifier, and Stacking Classifier were calculated as 0.9900, 0.9943, and 0.9930, respectively. For the XGBoost model, the results were as follows: accuracy 0.9692, sensitivity 0.9286, specificity 0.9886, F1-score 0.9512, ROC-AUC 0.9922, and MCC 0.9294.
The confusion matrices for the models on the independent test set are presented in Figure 4. In the MLP model, 41 out of 42 malignant cases were correctly classified, while one malignant case was misclassified as benign; among 88 benign cases, 87 were correctly classified, and one was misclassified. The SVM, Voting Classifier, and Stacking Classifier models correctly classified all 88 benign cases and 41 out of 42 malignant cases. The XGBoost model correctly classified 39 of the 42 malignant cases, while missing three malignant cases and misclassifying one benign case as malignant.
3.6. ROC, Precision-Recall, Calibration, and Decision Curve Analyses
High discriminant performance was observed in all five candidate models in ROC analyzes performed on the independent test set. Figure 5 shows (a) Independent test ROC curves, (b) Precision–Recall curves, (c) Calibration curves and (d) Decision Curve Analyzes graphically. ROC-AUC values ranged between 0.990–0.998 and the highest prediction was obtained in the MLP model.
Precision–Recall analyses have made it possible to evaluate the models’ performance in distinguishing the positive class, whilst taking into account the numerical imbalance between the classes. In addition, the calibration curves enabled an examination of the agreement between the predicted probabilities generated by the models and the observed rates of malignancy. The results of the decision curve analysis, meanwhile, allowed the net benefit behaviour of the models at different decision thresholds to be assessed in comparison with the ‘treat-all’ and ‘treat-none’ reference strategies.
3.7. Statistical Comparisons Between Models
The Holm-corrected results of the DeLong and exact McNemar tests are presented in Table 8. During the development phase, the independent test ROC-AUC values of the four candidate models were compared against the SVM the pre-specified reference model using the DeLong test. The ROC-AUC difference between SVM and MLP is −0.0081, with a calculated raw p-value of 0.3226. Similarly, no statistically significant difference in ROC-AUC was found when comparing SVM with the Stacking Classifier (p=0.3574), XGBoost (p=0.7246), or the Voting Classifier (p=0.3349). Following the Holm correction for multiple comparisons, the adjusted p-value for all comparisons was found to be 1.000.
Similarly, when classification decisions were compared using the exact McNemar test, no significant difference was observed between the SVM and the other models. In the SVM–MLP comparison, only one discordant instance was found (p=1.000), while the SVM, Stacking Classifier, and Voting Classifier all exhibited the same pattern of correct/incorrect classifications. In the comparison between SVM and XGBoost, three discordant instances were identified; however, the difference did not reach statistical significance (raw p=0.250). Following the Holm correction, the p-value was calculated as 1.000 for all comparisons.
These results have revealed that the numerical performance differences observed between the models on the independent test set do not translate into a statistically demonstrable superiority.
3.8. Permutation Importance (PI) and SHAP Findings
The PI analysis conducted on the SVM which was selected as the reference model during the development phase demonstrated that the `original_shape2D_Sphericity` feature provided the greatest performance contribution to the final radiomic analysis, which incorporated five features. For this feature, the mean PI value was calculated as 0.3797 ± 0.0462. In second place was `original_shape2D_Elongation`, with a mean importance value of 0.1817 ± 0.0306. These were followed by wavelet-LH_firstorder_Mean (0.0158 ± 0.0060), wavelet-LH_glszm_ZoneEntropy (0.0152 ± 0.0081), and wavelet-LL_glszm_SizeZoneNonUniformityNormalized (0.0009 ± 0.0015). Thus, it was observed that, within the reference model, two 'shape2D' features which specifically represent lesion geometry contributed more significantly to the model's performance.
SHAP analysis was successfully performed for all of the top 5 models; for each model, 50 development samples were used as a background dataset, while 100 independent test samples served as an explanation set.
The PI results for SVM are presented in Table 9. Evaluating the SHAP and PI results for SVM in conjunction with feature stability has revealed a particularly noteworthy pattern. Original_shape2D_Sphericity exhibited a 100% selection frequency across all stability analyses, while also ranking 1st in both PI and SHAP analyses. Similarly, original_shape2D_Elongation demonstrated 100% selection stability, ranking 2nd in both the PI and SHAP rankings. Likewise, wavelet-LH_glszm_ZoneEntropy showed a 100% selection frequency across all fundamental stability analyses, placing 4th in the PI ranking and 3rd in the SHAP ranking.
These findings have shown that the features in question were not only consistently selected across different data splits, but also made a measurable contribution to the predictions of the baseline model. Figure 6 shows the SHAP plots for the five models.
3.9. Integrated Assessment of Feature Stability and Explainabilityl
Table 10 presents the results of the integrated feature evaluation using Stability, Permutation Importance, and SHAP. Upon examining the results from these three methods—stability, permutation importance, and SHAP—collectively, three radiomic features emerged as significant: original_shape2D_Sphericity, original_shape2D_Elongation, and wavelet-LH_glszm_ZoneEntropy.
These three features exhibited a 100% maximum and 100% average selection frequency across both 5-feature and 10-feature stability analyses within 3-fold, 5-fold, and 10-fold cross-validation (CV) schemes. In other words, each of these features was consistently selected in all six CV–signature combinations evaluated.
The mean absolute SHAP values were calculated as 0.3202 for `Original_shape2D_Sphericity`, 0.1719 for `Original_shape2D_Elongation`, and 0.0473 for `wavelet-LH_glszm_ZoneEntropy`. The fact that the permutation importance values for these same features are also positive indicates a consistent pattern between stability and model explainability.
Conversely, although some features demonstrated high selection stability, they were not included in the final five-feature signature of the SVM model and, therefore, did not receive a SHAP or permutation importance value. For example, for log-sigma-2-0-mm-3D_firstorder_Skewness, the maximum selection frequency was set at 100 per cent and the overall average selection frequency at 96.7 per cent; for original_glrlm_RunEntropy, these were set at 100 per cent and 86.1 per cent respectively. For this reason, the high selection stability of these features has not been interpreted as indicating that they make a direct contribution to the prediction in the final reference model.
3.10. Learning and Validation Curves
Figure 7 shows the (a) training and (b) validation curves for the SVM model. In both graphs, the blue line represents the training ROC-AUC values, whilst the orange line represents the cross-validation ROC-AUC values. The learning curve for the reference SVM model showed a marked improvement in validation performance as the training sample size increased. When 20 per cent of the training data was used, the average training ROC-AUC was found to be 0.9631, whilst the validation ROC-AUC was 0.9012. When the training rate was increased to 40 per cent, the validation ROC-AUC rose to 0.9679; at 60 per cent, it rose to 0.9923; and at 80 per cent, it rose to 0.9950. When the entire training dataset was used, the training and validation ROC-AUC values were calculated as 0.9981 ± 0.0008 and 0.9944 ± 0.0062, respectively.
As the sample size increases, the narrowing gap between training and validation performance along with the fact that validation ROC-AUC values reach a high-level plateau indicates that the model’s generalization behavior within the development dataset becomes increasingly stable.
In the analysis of the validation curve for the SVM’s C hyperparameter, the highest mean validation ROC-AUC value was obtained for C=1 (0.9944 ± 0.0062). The validation ROC-AUC was calculated as 0.9572 ± 0.0399 for C = 0.01, 0.9829 ± 0.0182 for C = 0.1, 0.9932 ± 0.0070 for C = 10 and 0.9864 ± 0.0133 for C = 100. Although increasing the C value above 1 improved the training ROC-AUC, it did not result in any further improvement in validation performance.
The analyses revealed three key findings. Firstly, despite a significant reduction in the high-dimensional feature space which originally comprised 753 radiomic features high classification performance was maintained using compact radiomic representations comprising five features. The five candidate models identified during the development phase demonstrated performance in the range of approximately 0.990–0.998 in terms of ROC-AUC on the independent test set.
Secondly, the differences in numerical performance within the independent test set were not found to be statistically significant following Holm correction in the DeLong and exact McNemar tests. Consequently, the results were interpreted in the context of compact radiomic analysis being capable of delivering high discriminatory performance across multiple machine learning approaches, rather than indicating the statistical superiority of one particular model over the others.
The third finding and the most significant in terms of the study’s stability-focused objective is that the features `original_shape2D_Sphericity`, `original_shape2D_Elongation` and `wavelet-LH_glszm_ZoneEntropy` were consistently selected across different cross-validation schemes and were also supported by SHAP and permutation importance analyses in the reference SVM model. These results demonstrate that, beyond simply creating a model that exhibits high classification performance, it is possible to define a more compact radiomic feature kernel that is robust to data splits and provides a measurable contribution to model decisions.
4. Discussion
In this section, the experimental results of studies carried out in the literature have been examined and discussed in the context of the present study.
Radiomic features derived from breast ultrasound images provide valuable information for distinguishing between benign and malignant lesions by quantitatively characterising the morphological characteristics of lesions, the distributional properties of pixel intensities, and tissue heterogeneity. However, the high number of features initially obtained in radiomic analyses can lead to increased model complexity, the emergence of multicollinearity amongst features, and, particularly in datasets with limited sample sizes, an increased risk of overfitting [77]. For this reason, the systematic reduction of the high-dimensional radiomic feature space is a key methodological step in the development of reliable and generalisable machine learning models. Table 11 provides a comparative overview of studies in the literature, including the datasets, the initial number of features, the selected features and the feature selection methods.
It is evident from the literature that radiomic studies based on breast ultrasonography show significant variations in the number of initial features. [2] extracted 520 radiomic features from ultrasonography images of a total of 201 breast lesions obtained from two centres and, following a multi-stage feature selection process, reduced this number to 10. Similarly, [7] extracted 1,558 radiomic features from 123 non-mass breast lesions and, following dimension reduction, developed a radiomic score comprising 10 features. [10], on the other hand, initially extracted 848 features from ultrasound images obtained from 619 patients and included 12 of these in the final model. These studies demonstrate that a common approach is to first establish a broad pool of radiomic features and then identify those that are more informative for classification purposes.
On the other hand [9], identified 33 robust and statistically significant features from among 242 radiomic features associated with 1,259 solid breast lesions obtained from three different centres. [5], on the other hand, defined a set comprising 48 features selected consistently across different cross-validation folds by evaluating 939 radiomic features derived from 927 lesions in the BUSI-WHU dataset. The findings indicate that the initial number of features alone is not a sufficient criterion for determining model performance; rather, the discriminatory power of the features across classes, their levels of reproducibility, and the feature selection strategy employed must also be considered as key factors influencing model performance.
As part of this study, a total of 753 radiomic features were obtained by applying the Original, Wavelet and Laplacian of Gaussian (LoG) transformations to 647 breast ultrasound images from the BUSI dataset. Of the features extracted, 102 were derived from the original images, 372 from the sub-bands of the wavelet transform, and 279 from the LoG filtering operations. Thanks to this approach, it has been possible to quantitatively characterise not only the basic density distributions and morphological characteristics of the lesions, but also the tissue patterns that emerge at different spatial scales and frequency levels. The reduction of the 753 features initially obtained to a compact, five-feature radiomic representation following a multi-stage selection process demonstrates that the high-dimensional feature space can be significantly simplified. The fact that high classification accuracy was maintained on the independent test dataset despite the elimination of approximately 99.34 per cent of the initially obtained radiomic features suggests that a small number of radiomic features with high information content may be sufficient for distinguishing between benign and malignant breast lesions. However, when assessing the generalisability of this finding, the characteristics of the BUSI dataset used and the methodological limitations of the analysis protocol applied within the scope of the study should be taken into account.
The selection of radiomic features is regarded as a critical step in reducing redundant, repetitive and information-overlapping features amongst the variables derived from high-dimensional medical images. A review of the relevant literature reveals that researchers have utilised filter-based, embedded and enveloping methods in their feature selection processes, and have developed various feature selection strategies by integrating these approaches in different ways.
In study [10], the feature selection process was carried out within the framework of a multi-stage approach in which Student’s t-test, Pearson’s correlation analysis and LASSO regression were applied sequentially. In the first stage, features exhibiting statistically significant differences between the benign and malignant lesion groups were identified; in the subsequent stage, variables showing a high degree of correlation were removed from the dataset. Finally, by reducing the dimension of the feature space using LASSO regression, 12 radiomic features were identified for use in the classification process. Similarly, in [2], following the elimination of radiomic features characterised by low reproducibility, limited variance and high correlation with one another, a feature selection approach based on the cross-validation-based recursive feature elimination (RFECV) method was adopted. In contrast, in study [1], the Recursive Feature Elimination (RFE) method was applied to the BUSI dataset with the aim of identifying radiomic features that contribute to the differentiation between benign and malignant lesions.
In study [5], a multi-stage feature selection strategy was implemented by integrating a correlation-based filtering method with the Boruta algorithm, and particular care was taken to ensure that the selection processes were carried out only within the relevant training layers during the cross-validation process. This methodological approach is important in terms of preventing potential information leakage that may arise from the test data during the feature selection stage. Furthermore, the study assessed not only the numerical magnitude of the selected features, but also the levels of stability and consistency they exhibited across different data partitions.
Within the scope of this study, a five-stage feature selection approach was adopted, in which the VarianceThreshold, Pearson correlation analysis, MI, L1 LASSO and RFE methods were applied sequentially. This strategy aims to obtain more discriminatory and informative feature subsets by utilising the complementary nature of different feature selection techniques. In this context, whilst the aim was to identify features exhibiting low variability using a variance-based filtering method, the use of Pearson’s correlation analysis helped to reduce information redundancy arising from variables with strong linear relationships between them. Whilst the MI method was applied to identify non-linear relationships between radiomic features and the target variable, the LASSO method contributed to obtaining a sparser and lower-dimensional feature representation by reducing the regression coefficients towards zero. In the final stage of the feature selection process, the RFE method was used to identify compact subsets comprising a smaller number of discriminative features.
According to the results obtained, whilst all 753 features were retained following variance filtering, when a correlation threshold of |r| > 0.90 was applied, the number of features decreased to an average of 164.00, 162.60 and 164.00, respectively, in the 3-fold, 5-fold and 10-fold cross-validation schemes. Following the LASSO stage, these figures were calculated as 13.67, 14.60 and 17.00, respectively. These findings indicate that the high correlation between radiomic features points to significant information redundancy in the initial feature space.
Whilst in a large proportion of the studies in the literature the feature selection process is carried out using a single method or a combination of specific methods, the sequential application of different selection techniques offers a more comprehensive methodological framework that allows features to be evaluated according to various criteria. However, in order to demonstrate that multi-stage feature selection strategies offer a clear advantage over single-stage approaches, direct comparative analyses need to be carried out under the same data partitions and experimental conditions.
One of the key objectives in radiomic research is to develop predictive models with high discriminatory power and high classification accuracy, utilising a limited number of informative features. Particularly in medical imaging applications, the use of high-dimensional radiomic feature spaces despite limited sample sizes can lead to models overfitting the training data and, consequently, an increased risk of overfitting.
An evaluation of the studies in the relevant literature reveals that the number of final features used in classification models varies significantly from one study to another. In this context, 10 features were utilised in studies [2] and [7], 12 in study [10], 33 in study [9], and 48 features with a high level of reliability in study [5]. Similarly, in study [3], 40 radiomic features were selected from the 123 features initially obtained from the BUSI dataset and used in the analyses.
When compared with previous studies, the fact that this research identified a subset comprising just five radiomic features demonstrates that the classification model can be developed using a lower-dimensional and more compact feature representation. In addition, the evaluation process should not be limited to a configuration comprising only five features, but should be extended to include alternative subsets comprising 10, 20, 40, 60, 80 and 100 features, and for these configurations to be analysed separately under 3-fold, 5-fold and 10-fold cross-validation strategies, has enabled a systematic and comparative examination of the effects of changes in the dimension of the feature space on the model’s classification performance.
One of the key methodological features of the adopted approach is that the number of features to be selected is not restricted to a single value from the outset, and that subsets of features of varying sizes are included in the evaluation. Accordingly, the comparative analysis of various numbers of features has enabled a systematic examination of the relationship between model complexity and discriminative performance in the classification process. The fact that the model configurations with the highest performance in the development set are concentrated in the five-feature sets suggests that using more radiomic variables does not always result in higher classification accuracy.
Table 12 presents a comparative evaluation of the studies cited in the literature and the present study in terms of machine learning algorithms, validation strategies and the performance results obtained. Within the scope of this study, it was found that the classification models developed using compact subsets comprising five radiomic features achieved ROC-AUC values ranging from 0.9900 to 0.9981 on the independent test dataset. Whilst the SVM, Voting Classifier and Stacking Classifier algorithms stood out with an accuracy rate of 99.23 per cent, the MLP model demonstrated the highest discriminative performance amongst the models evaluated, with a ROC-AUC value of 0.9981.
However, when carrying out a comparative assessment of the accuracy rates and ROC-AUC values reported in different studies, it is important to take methodological differences into account and to interpret the results obtained carefully within this framework. Differences in sample size, class distribution, imaging modalities, segmentation protocols and validation strategies may influence the reported performance metrics. In particular, the external validation analyses carried out in [2,6,78] are important for assessing the performance of the models in different clinical settings. However, although an independent hold-out test set was used in the present study, no external validation was carried out on a different institution or dataset. Consequently, the high test performance should not be interpreted as definitive evidence of clinical generalisability.
One of the key challenges in radiomic feature selection is that the selected features may be sensitive to data split and changes in the sample. Particularly in datasets containing high-dimensional and interrelated features, selection processes carried out on different training samples may result in different sets of features. This situation may limit the reproducibility and biological interpretability of radiomic signatures.
In study [5], the stability of feature selection was examined in detail by identifying 48 radiomic features that demonstrated consistency across different cross-validation folds on the BUSI-WHU dataset. Similarly, in study [9], 33 reliable radiomic features were identified based on criteria of reproducibility and statistical significance in analyses conducted on multicentre datasets. The findings of these studies demonstrate that, in radiomic modelling processes, it is not sufficient to evaluate classification performance alone; it is also important to take into account the levels of stability, reproducibility and reliability of the selected features under different data conditions.
Within the scope of this study, the robustness of radiomic feature selection was examined comparatively using two different subsets comprising five and ten features, respectively, under 3-fold, 5-fold and 10-fold cross-validation strategies. As a result of the analyses carried out, it was found that the features ‘original_shape2D_Sphericity’, ‘original_shape2D_Elongation’ and ‘wavelet-LH_glszm_ZoneEntropy’ achieved a selection frequency of 100 per cent in all the cross-validation configurations examined and demonstrated a high level of selection stability across different data splits.
This finding demonstrates that the relevant radiomic features exhibit a consistent pattern of selection across different training subsamples. In particular, the Sphericity and Elongation features, which characterise the geometric structure of the lesion, are important for the assessment of morphological irregularities associated with malignancy through quantitative measures. In addition, the Wavelet-LH ZoneEntropy feature can provide supplementary information regarding the internal structural characteristics of the lesion by quantitatively characterising the tissue heterogeneity observed in a specific frequency sub-band.
The fact that the findings regarding the selection stability of these radiomic features are supported by SHAP and permutation importance analyses constitutes one of the key methodological aspects of this study. The results of the PI analysis showed that the Sphericity feature had an average importance value of 0.3797, the Elongation feature 0.1817, and the Wavelet-LH ZoneEntropy feature 0.0152. These results enable a quantitative assessment of the contributions made by the relevant features to the classification model. The average absolute SHAP values for these features were found to be 0.3202, 0.1719 and 0.0473, respectively.
Thus, these three features stood out not only because they were repeatedly selected across different cross-validation folds, but also because of their measurable contributions to the predictions of the final SVM model. This finding suggests that jointly evaluating feature selection robustness and model interpretability may enhance the interpretation of compact radiomic signatures.
Whilst achieving high classification performance in radiomics-based machine learning models is important, determining which image features influence model decisions is essential for clinical interpretability. In particular, the inability to explain the decision-making mechanism of a model especially in complex machine learning algorithms can make it difficult to integrate the developed systems into clinical decision-support applications.
In some of the studies in the literature, feature selection and feature importance rankings have been used for model interpretation. For example, [1] assessed the contribution of features identified using RFE to classification performance. [2], on the other hand, developed a Random Forest model based on selected radiomic features. In more recent studies [5,6,78], the use of SHAP analysis to evaluate the variables contributing to model predictions demonstrates the importance of explainable artificial intelligence methods in radiomic research.
In the present study, SHAP analyses were applied to all five candidate models, whilst for the reference SVM model, permutation importance results were examined alongside feature selection robustness. This approach combines three different evaluation dimensions: the extent to which features are selected consistently across different training samples, the degree to which they contribute to model predictions, and how altering the features affects classification performance.
In particular, the fact that the ‘Sphericity’ and ‘Elongation’ features ranked in the top two positions in both the SHAP and permutation importance analyses indicates that variables relating to lesion geometry play a significant role in the final SVM model. The fact that the Wavelet-LH ZoneEntropy feature demonstrates a positive contribution in both explainability analyses suggests that information regarding tissue heterogeneity, as well as the geometric characteristics of the lesion, may play a complementary role in the classification process.
The findings indicate that it is not sufficient to base the selection of radiomic features solely on statistical relationships; it is also necessary to assess the contribution these features make to the model’s decision-making process. However, the results obtained from SHAP and permutation importance analyses do not provide direct evidence regarding the causal effects of the relevant features or their independent biological mechanisms. It should be borne in mind that, particularly in radiomic datasets containing variables that are highly correlated with one another, the calculated feature importance scores may vary depending on the classification algorithm chosen and the explainability method used.
The main scientific and methodological contribution of this study is that the reduction of 753 radiomic features derived from the BUSI dataset to lower-dimensional subsets via multi-stage feature selection strategies; the systematic analysis of the robustness of the selected features under different cross-validation configurations; and the comprehensive evaluation of the resulting compact radiomic feature sets using interpretable machine learning approaches.
Whilst some previous studies have focused on feature selection and model performance, the present study addresses feature selection stability, out-of-sample performance, statistical model comparisons and interpretability analyses within the same experimental framework. In addition, the application of the DeLong and exact McNemar tests in conjunction with the Holm correction for multiple comparisons has made it possible to examine the statistical significance of the numerical performance differences observed between classification models. The fact that the analyses carried out did not reveal any statistically significant differences between the models indicates that insufficient statistical evidence was obtained to support the conclusion that any one classification algorithm demonstrated a clear advantage over the others.
5. Conclusions
In conclusion, studies in the literature demonstrate that reducing the high-dimensional radiomic features derived from breast ultrasonography using appropriate selection methods is an effective approach for the classification of benign and malignant lesions. However, there are marked methodological differences between the studies in terms of the number of features initially evaluated, the feature selection algorithms employed, the structure of the final feature subsets obtained, and the validation strategies applied.
It is not methodologically appropriate to interpret the findings from these studies in terms of direct performance superiority or a ranking of success. Indeed, there are marked differences between studies conducted using publicly available datasets such as BUSI and BUSI-WHU and those based on multicentre clinical cohorts in terms of sample characteristics, imaging protocols, the distribution of patient populations and the validation strategies employed. Furthermore, taking into account factors such as the number of features used, the robustness of the feature selection process, methodological measures to prevent data leakage, and independent validation criteria, enables a more comprehensive and methodologically more holistic assessment compared to performance evaluations based solely on high accuracy rates.
The present study is consistent with findings in the literature in that a compact representation comprising five features can be derived from 753 radiomic features, and that this representation demonstrates high discriminatory performance on an independent test set. The key methodological feature that distinguishes this study from similar ones is that it does not merely focus on reducing the number of radiomic features, but also comprehensively assesses the stability of the selected features under different cross-validation configurations, integrating this with findings derived from SHAP and permutation importance analyses.
In particular, the high selection stability of the Sphericity, Elongation and Wavelet-LH ZoneEntropy features, and their contribution to model predictions, demonstrate the complementary value of morphological and textural information derived from breast ultrasound images. Whilst these findings are promising in terms of the development of compact, reproducible and interpretable radiomic signatures, their clinical applicability needs to be validated through multicentre, prospective studies.
However, the study has certain limitations. Firstly, the fact that the BUSI dataset is derived from a single source and has not been subject to external validation limits the generalisability of the results to different clinical populations. Secondly, due to the limited sample size, high performance values in particular need to be validated in independent data sets. Thirdly, as radiomic features may be sensitive to differences in segmentation and the conditions under which ultrasound images are acquired, the model’s stability across different imaging protocols requires further investigation.
Furthermore, the fact that the consistency of feature selection is high does not guarantee that the same features will demonstrate similar measurement reliability at different centres or on different devices. It would therefore be appropriate for future studies to prioritise multicentre external validation, the reproducibility of segmentation, the assessment of inter-device variability, and prospective clinical analyses.
6. Future Work
In future research, the aim is to evaluate the generalisability and clinical applicability of the radiomics-based machine learning models developed in this study in a more comprehensive manner. Firstly, the external validation of the models using independent datasets obtained from different centres, ultrasound machines and patient populations is important for determining the generalisability of the current findings to different clinical settings. However, investigating the effects of differences in image acquisition protocols on the distribution of radiomic features and classification performance will help to assess the models’ robustness to variations in the data source.
In future, research could also explore the integration of radiomic features with image representations derived from deep learning models. In particular, the combination of deep features derived from convolutional neural networks and visual transformer architectures with selected radiomic features will enable the evaluation of hybrid models in terms of classification performance, interpretability and computational complexity. Furthermore, provided that relevant clinical data is available, incorporating patient age, BI-RADS category and lesion characteristics into the models may enable radiomic findings to be assessed in conjunction with clinical information.
Funding
This research received no external funding.
Informed Consent Statement
This study was conducted using the publicly available Breast Ultrasound Images (BISI) dataset. No new patient data were collected as part of this study, and there was no direct interaction with participants. I would like to note that this research did not involve human, animal, or plant subjects and utilized a publicly available dataset; therefore, “ethics committee approval is not required.”.
Data Availability Statement
The data presented in this study are available from the corresponding author upon request.
Conflicts of Interest
The author declare no conflicts of interest.:
Abbreviations
The following abbreviations are used in this manuscript:
| ROI | Region of Interest |
| BUSI | Breast Ultrasound Images |
| LoG | Lablacion of Gaussian |
| MI | Mutual Information |
| LASSO | Least Absolute Shrinkage and Selection Operator |
| RFE | Recursive Feature Elimination |
| RF-RFE | Random Forest–Recursive Feature Elimination |
| RF | Random Forest |
| SVM | Support Vector Machine |
| MLP | Multi Layer Perception |
| MCC | Matthews Correlation Coefficient |
| TP | True Positive |
| TN | True Negative |
| FP | False Positive |
| FN | False Negative |
| DCA | Decision Curve Analysis |
| SHAP | SHapley Additive exPlanations |
| ECE | Expected Calibration Error |
| GLCM | Gray Level Co-occurrence Matrix |
| GLDM | Gray Level Dependence Matrix |
| GLRLM | Gray Level Run Length Matrix |
| GLSZM | Gray Level Size Zone Matrix |
| NGTDM | Neighbouring Gray Tone Difference Matrix |
References
- Mishra, A.K.; Roy, P.; Bandyopadhyay, S.; Das, S.K. Breast ultrasound tumour classification: A Machine Learning—Radiomics based approach. Expert Syst. 2021, 38, e12713. [Google Scholar] [CrossRef]
- Romeo, V.; Cuocolo, R.; Apolito, R.; Stanzione, A.; Ventimiglia, A.; Vitale, A.; Verde, F.; Accurso, A.; Amitrano, M.; Insabato, L.; et al. Clinical value of radiomics and machine learning in breast ultrasound: A multicenter study for differential diagnosis of benign and malignant lesions. Eur. Radiol. 2021, 31, 9511–9519. [Google Scholar] [CrossRef] [PubMed]
- Ksü Mühendislik Bilimleri Dergisi; Kaplan, A.; Kavadar, E.; Altuncu, M.A. RADYOMİK ÖZELLİKLER VE MAKİNE ÖĞRENMESİ TEKNİKLERİYLE MEME TÜMÖRLERİNİN SINIFLANDIRILMASI CLASSIFICATION OF BREAST TUMORS USING RADIOMIC FEATURES AND MACHINE LEARNING TECHNIQUES. 2025. [PubMed]
- Fleury, E.; Marcomini, K. Performance of machine learning software to classify breast lesions using BI-RADS radiomic features on ultrasound images. Eur. Radiol. Exp. 2019, 3, 1–8. [Google Scholar] [CrossRef] [PubMed]
- Antu, P.S.; Rashid, M.M.-U.; Ali, M.H. Statistically Rigorous and Interpretable Radiomics for Benign–Malignant Classification on the BUSI-WHU Breast Ultrasound Dataset. J. Imaging Inform. Med. 2026, 1–18. [Google Scholar] [CrossRef] [PubMed]
- Zhang, D.; Lu, W.-W.; Qin, X.-C.; Zhou, W.; Zhang, X.-Y.; Luo, Y.-H.; Wu, L.-S.; Wu, J.; Wang, J.-L.; Zhao, J.-J.; et al. Development and validation of an interpretable ultrasound radiomics model for benign and malignant classification of breast lesions: A multicenter large-sample study. Insights Into Imaging 2026, 17. [Google Scholar] [CrossRef] [PubMed]
- Shi, C.; He, H.; Chen, B.; Lu, J.; Xu, Q.; Zhao, K.; Yang, X. Discrimination of benign and malignant non-mass breast lesions using ultrasound radiomics with machine learning models. J. Appl. Clin. Med. Phys. 2025, 27, e70319. [Google Scholar] [CrossRef] [PubMed]
- Karacor, A.G.; Sahin, S. A Data-Efficient Machine Learning Approach for Breast Ultrasound Lesion Classification Integrating Image-Derived Features and Sonographic Descriptors. Diagnostics 2026, 16, 664. [Google Scholar] [CrossRef] [PubMed]
- Homayoun, H.; Chan, W.Y.; Kuzan, T.Y.; Leong, W.L.; Altintoprak, K.M.; Mohammadi, A.; Vijayananthan, A.; Rahmat, K.; Leong, S.S.; Mirza-Aghazadeh-Attari, M.; et al. Applications of machine-learning algorithms for prediction of benign and malignant breast lesions using ultrasound radiomics signatures: A multi-center study. Biocybern. Biomed. Eng. 2022, 42, 921–933. [Google Scholar] [CrossRef]
- Chen, W.; Xiong, Y.; Ke, Z. Machine Learning-Based Ultrasound Radiomics Signature: A Retrospective Analysis for Differentiating Benign from Malignant Non-Mass Lesions in Dense Breasts. Int. J. Gen. Med. 2026, ume 19, 1–13. [Google Scholar] [CrossRef] [PubMed]
- Wang, X.; Zhang, N.; Ma, J.; Qin, W.; Liao, S.; Chang, H.; Liu, J.; Huo, L. Development and validation of radiomics models for the diagnoses of breast lesions with calcification on ultrasound. Quant. Imaging Med. Surg. 2026, 16, 407. [Google Scholar] [CrossRef] [PubMed]
- Jayakrishnan, K.; Katal, N. Radiomics-integrated machine learning framework for quantitative breast cancer diagnosis. Front. Artif. Intell. 2026, 9, 1752413. [Google Scholar] [CrossRef] [PubMed]
- Ye, J.; Xiong, Y.; Chen, Y.; Pan, J.; Qiu, Y.; Chen, Y.; Luo, Z.; Li, Y.; Huang, W. Development and validation of an integrated model combining deep learning, radiomics, and clinical and breast ultrasound features for Breast Imaging Reporting and Data System 4A lesion malignancy classification. Quant. Imaging Med. Surg. 2025, 15, 11907–11921. [Google Scholar] [CrossRef] [PubMed]
- Zhang, D.; Lu, W.-W.; Qin, X.-C.; Zhou, W.; Zhang, X.-Y.; Luo, Y.-H.; Wu, L.-S.; Wu, J.; Wang, J.-L.; Zhao, J.-J.; et al. Development and validation of an interpretable ultrasound radiomics model for benign and malignant classification of breast lesions: A multicenter large-sample study. Insights Into Imaging 2026, 17. [Google Scholar] [CrossRef] [PubMed]
- Loey, M.; Khalil, H.M. Hierarchical Fuzzy System Integrated with Deep Learning for Robust and Interpretable Classification of Breast Malignancies Using Radiomics Features from Ultrasound Imaging. Computers 2026, 15, 147. [Google Scholar] [CrossRef]
- Al-Dhabyani, W.; Gomaa, M.; Khaled, H.; Fahmy, A. Dataset of breast ultrasound images. Data Brief. 2019, 28, 104863. [Google Scholar] [CrossRef] [PubMed]
- Varoquaux, G. Cross-validation failure: Small sample sizes lead to large error bars. NeuroImage 2018, 180, 68–77. [Google Scholar] [CrossRef] [PubMed]
- Vabalas, A.; Gowen, E.; Poliakoff, E.; Casson, A.J. Machine learning algorithm validation with a limited sample size. PLoS ONE 2019, 14, e0224365. [Google Scholar] [CrossRef] [PubMed]
- Steyerberg, E.W.; Harrell, F.E., Jr. Prediction models need appropriate internal, internal–external, and external validation. J. Clin. Epidemiol. 2016, 69, 245–247. [Google Scholar] [CrossRef] [PubMed]
- Guyon, I.; De, A.M. An Introduction to Variable and Feature Selection André Elisseeff. 2003. [PubMed]
- Magnin, C.Y.; Lauer, D.; Ammeter, M.; Gote-Schniering, J. From images to clinical insights: An educational review on radiomics in lung diseases. Breathe 2025, 21, 230225. [Google Scholar] [CrossRef] [PubMed]
- Shur, J.D.; Doran, S.J.; Kumar, S.; Dafydd, D.A.; Downey, K.; O’connor, J.P.B.; Papanikolaou, N.; Messiou, C.; Koh, D.-M.; Orton, M.R. Radiomics in Oncology: A Practical Guide. RadioGraphics 2021, 41, 1717–1732. [Google Scholar] [CrossRef] [PubMed]
- Ge, G.; Zhang, J. Feature selection methods and predictive models in CT lung cancer radiomics. J. Appl. Clin. Med. Phys. 2022, 24. [Google Scholar] [CrossRef] [PubMed]
- Wang, L.; Qiu, T.; Zhou, J.; Zhu, Y.; Sun, B.; Yang, G.; et al. A pretreatment multiparametric MRI-based radiomics-clinical machine learning model for predicting radiation-induced temporal lobe injury in patients with nasopharyngeal carcinoma. Head Neck 2024, 46, 2132–2144. [Google Scholar] [CrossRef] [PubMed]
- Battiti, R. Using mutual information for selecting features in supervised neural net learning. IEEE Trans. Neural Netw. 1994, 5, 537–550. [Google Scholar] [CrossRef] [PubMed]
- Peng, H.; Long, F.; Ding, C. Feature selection based on mutual information criteria of max-dependency, max-relevance, and min-redundancy. IEEE Trans. Pattern Anal. Mach. Intell. 2005, 27, 1226–1238. [Google Scholar] [CrossRef] [PubMed]
- Kraskov, A.; Stögbauer, H.; Grassberger, P. Estimating mutual information. Phys. Rev. E Stat. Phys. Plasmas Fluids Relat. Interdiscip. Top. 2004, 69, 066138, Erratum in 2011, 83, 019903.. [Google Scholar] [CrossRef] [PubMed]
- Ross, B.C. Mutual Information between Discrete and Continuous Data Sets. PLoS ONE 2014, 9, e87357. [Google Scholar] [CrossRef] [PubMed]
- Tibshiranit, R. Regression Shrinkage and Selection via the Lasso; 1996. [Google Scholar]
- Fan, J.; Li, R. Variable selection via nonconcave penalized likelihood and its oracle properties. J. Am. Stat. Assoc. 2001, 96, 1348–1360. [Google Scholar] [CrossRef]
- He, H.; Garcia, E.A. Learning from Imbalanced Data. IEEE Trans. Knowl. Data Eng. 2009, 21, 1263–1284. [Google Scholar] [CrossRef]
- Kohavi, R.; John, G.H. Wrappers for feature subset selection. Artif. Intell. 1997, 97, 273–324. [Google Scholar] [CrossRef]
- Friedman, J.; Hastie, T.; Tibshirani, R.; Narasimhan, B.; Tay, K.; Simon, N.; et al. glmnet: Lasso and elastic-net regularized generalized linear models. Astrophys. Source Code Libr. 2023. [Google Scholar] [CrossRef]
- Guyon, I.; Weston, J.; Barnhill, S.; Vapnik, V. Gene Selection for Cancer Classification using Support Vector Machines. Mach. Learn. 2002, 46, 389–422. [Google Scholar] [CrossRef]
- Breiman, L. Random Forests. In Mach. Learn.; 2001. [Google Scholar]
- Mylona, E.; Zaridis, D.I.; Kalantzopoulos, C.Ν.; Tachos, N.S.; Regge, D.; Papanikolaou, N.; Tsiknakis, M.; Marias, K.; Fotiadis, D.I. Optimizing radiomics for prostate cancer diagnosis: Feature selection strategies, machine learning classifiers, and MRI sequences. Insights Into Imaging 2024, 15, 1–16. [Google Scholar] [CrossRef] [PubMed]
- Jha, A.K.; Mithun, S.; Sherkhane, U.B.; Jaiswar, V.; Shah, S.; Purandare, N.; Prabhash, K.; Maheshwari, A.; Gupta, S.; Wee, L.; et al. Development and validation of radiomic signature for predicting overall survival in advanced-stage cervical cancer. Front. Nucl. Med. 2023, 3. [Google Scholar] [CrossRef] [PubMed]
- Díaz-Uriarte, R.; De Andres, S.A. Gene selection and classification of microarray data using random forest. BMC Bioinform. 2006, 7, 3. [Google Scholar] [CrossRef] [PubMed]
- Nogueira, S.; Sechidis, K.; Brown, G. On the Stability of Feature Selection Algorithms. 2018. Available online: http://jmlr.org/papers/v18/17-514.html.
- Nouraie, M.; Smith, C.; Meinshausen, B.P. Stability selection. J. R. Stat. Soc. Ser. B Stat. Methodol. 2010, 72, 417–473. [Google Scholar] [CrossRef]
- Demircioğlu, A. Measuring the bias of incorrect application of feature selection when using cross-validation in radiomics. Insights Into Imaging 2021, 12, 1–10. [Google Scholar] [CrossRef] [PubMed]
- Hua, J.; Tembe, W.D.; Dougherty, E.R. Performance of feature-selection methods in the classification of high-dimension data. Pattern Recognit. 2009, 42, 409–424. [Google Scholar] [CrossRef]
- Peng, H.; Long, F.; Ding, C. Feature selection based on mutual information criteria of max-dependency, max-relevance, and min-redundancy. IEEE Trans. Pattern Anal. Mach. Intell. 2005, 27, 1228–1238. [Google Scholar] [CrossRef] [PubMed]
- Decoux, A.; Duron, L.; Habert, P.; Roblot, V.; Arsovic, E.; Chassagnon, G.; Arnoux, A.; Fournier, L. Comparative performances of machine learning algorithms in radiomics and impacting factors. Sci. Rep. 2023, 13, 1–10. [Google Scholar] [CrossRef] [PubMed]
- Hong, S.; Hong, S.; Oh, E.; Lee, W.J.; Jeong, W.K.; Kim, K. Development of a flexible feature selection framework in radiomics-based prediction modeling: Assessment with four real-world datasets. Sci. Rep. 2024, 14, 1–9. [Google Scholar] [CrossRef] [PubMed]
- Cortes, C.; Vapnik, V.; Saitta, L. Support-Vector Networks Editor; Kluwer Academic Publishers, 1995. [Google Scholar]
- Friedman, J.H. Accessibility support: If you experience accessibility issues with this file, report them here Greedy Function Approximation: A Gradient Boosting Machine. 2001. [PubMed]
- Freund, Y.; Schapire, R.E. A Decision-Theoretic Generalization of On-Line Learning and an Application to Boosting. J. Comput. Syst. Sci. 1997, 55, 119–139. [Google Scholar] [CrossRef]
- Chen, T.; Guestrin, C. Xgboost: A scalable tree boosting system. arXiv 2016. [Google Scholar] [CrossRef]
- Prokhorenkova, L.; Gusev, G.; Vorobev, A.; Dorogush, A.V.; Gulin, A. CatBoost: Unbiased Boosting With Categorical Features. Available online: https://github.com/catboost/catboost.
- Rumelhart, D.E.; Hinton, G.E.; Williams, R.J. Learning representations by back-propagating errors. Nature 1986, 323, 533–536. [Google Scholar] [CrossRef]
- Wolpert, D.H. Stacked generalization. Neural Netw. 1992, 5, 241–259. [Google Scholar] [CrossRef]
- Kohavi, R. A Study of Cross-Validation and Bootstrap for Accuracy Estimation and Model Selection. 1995. Available online: http://robotics.stanford.edu/ronnyk.
- Rodriguez, J.D.; Perez, A.; Lozano, J.A. Sensitivity Analysis of k-Fold Cross Validation in Prediction Error Estimation. IEEE Trans. Pattern Anal. Mach. Intell. 2009, 32, 569–575. [Google Scholar] [CrossRef] [PubMed]
- Chicco, D.; Jurman, G. The advantages of the Matthews correlation coefficient (MCC) over F1 score and accuracy in binary classification evaluation. BMC Genom. 2020, 21, 1–13. [Google Scholar] [CrossRef] [PubMed]
- Hanley, J.A.; McNeil, B.J. The meaning and use of the area under a receiver operating characteristic (ROC) curve. Radiology 1982, 143, 29–36. [Google Scholar] [CrossRef] [PubMed]
- Fawcett, T. An Introduction to ROC analysis. Pattern Recogn. Lett. 2006, 27, 861–874. [Google Scholar] [CrossRef]
- Saito, T.; Rehmsmeier, M. The Precision-Recall Plot Is More Informative than the ROC Plot When Evaluating Binary Classifiers on Imbalanced Datasets. PLoS ONE 2015, 10, e0118432. [Google Scholar] [CrossRef] [PubMed]
- Varma, S.; Simon, R. Bias in error estimation when using cross-validation for model selection. BMC Bioinform. 2006, 7, 91. [Google Scholar] [CrossRef] [PubMed]
- Steyerberg, E.W.; Harrell, F.E., Jr. Prediction models need appropriate internal, internal–external, and external validation. J. Clin. Epidemiol. 2016, 69, 245–247. [Google Scholar] [CrossRef] [PubMed]
- Vickers, A.J.; Elkin, E.B. Decision Curve Analysis: A Novel Method for Evaluating Prediction Models. Med. Decis. Mak. 2006, 26, 565–574. [Google Scholar] [CrossRef] [PubMed]
- Vickers, A.J.; Van Calster, B.; Steyerberg, E.W. Net benefit approaches to the evaluation of prediction models, molecular markers, and diagnostic tests. BMJ 2016, 352, i6. [Google Scholar] [CrossRef] [PubMed]
- Vickers, A.J.; van Calster, B.; Steyerberg, E.W. A simple, step-by-step guide to interpreting decision curve analysis. Diagn. Progn. Res. 2019, 3, 1–8. [Google Scholar] [CrossRef] [PubMed]
- Efron, B.; Tibshirani, R. Bootstrap Methods for Standard Errors, Confidence Intervals, and Other Measures of Statistical Accuracy. Stat. Sci. 1986, 1, 54–75. [Google Scholar] [CrossRef]
- Effron, B.; Tibshirani, R.J. An introduction to the bootstrap. Monogr. Stat. Appl. Probab. Monogr. Stat. Appl. Probab. 1993, 57, 436. [Google Scholar]
- Carpenter, J.; Bithell, J. Bootstrap confidence intervals: When, which, what? A practical guide for medical statisticians. Stat. Med. 2000, 19, 1141–1164. [Google Scholar] [CrossRef]
- DeLong, E.R.; DeLong, D.M.; Clarke-Pearson, D.L. Comparing the Areas under Two or More Correlated Receiver Operating Characteristic Curves: A Nonparametric Approach. Biometrics 1988, 44, 837–845. [Google Scholar] [CrossRef] [PubMed]
- McNemar, Q. Note on the Sampling Error of the Difference Between Correlated Proportions or Percentages. Psychometrika 1947, 12, 153–157. [Google Scholar] [CrossRef] [PubMed]
- Dietterich, T.G. Approximate Statistical Tests for Comparing Supervised Classification Learning Algorithms. Neural Comput. 1998, 10, 1895–1923. [Google Scholar] [CrossRef] [PubMed]
- Holm, S. Accessibility support: If you experience accessibility issues with this file, report them here A Simple Sequentially Rejective Multiple Test Procedure. 1979. [PubMed]
- Fisher, A.; Rudin, C.; Dominici, F. All Models are Wrong, but Many are Useful: Learning a Variable's Importance by Studying an Entire Class of Prediction Models Simultaneously. 2019; 20. [PubMed]
- Molnar, C.; König, G.; Bischl, B.; Casalicchio, G. Model-agnostic feature importance and effects with dependent features: A conditional subgroup approach. Data Min. Knowl. Discov. 2023, 38, 2903–2941. [Google Scholar] [CrossRef]
- Lee, S.-I.; Lundberg, S.M. A Unified Approach to Interpreting Model Predictions. Adv. Neural Inf. Process. Syst. 2017, 30, 1–3. [Google Scholar] [CrossRef]
- Lundberg, S.M.; Erion, G.; Chen, H.; DeGrave, A.; Prutkin, J.M.; Nair, B.; et al. From local explanations to global understanding with explainable AI for trees. Nat. Mach. Intell. 2020, 2, 56–67. [Google Scholar] [CrossRef] [PubMed]
- Aas, K.; Jullum, M.; Løland, A. Explaining individual predictions when features are dependent: More accurate approximations to Shapley values. Artif. Intell. 2021, 298. [Google Scholar] [CrossRef]
- Perlich, C.; Provost, F.; Simonoff, J.S. Tree Induction vs. Logistic Regression: A Learning-Curve Analysis. 2003.
- Figueroa, R.L.; Zeng-Treitler, Q.; Kandula, S.; Ngo, L.H. Predicting sample size required for classification performance. BMC Med. Inform. Decis. Mak. 2012, 12, 8. [Google Scholar] [CrossRef] [PubMed]
- Cawley, G.C.; Talbot, N.L.C. On Over-fitting in Model Selection and Subsequent Selection Bias in Performance Evaluation. 2010. [PubMed]
- Zhang, Y.-P.; Zhang, X.-Y.; Cheng, Y.-T.; Li, B.; Teng, X.-Z.; Zhang, J.; Lam, S.; Zhou, T.; Ma, Z.-R.; Sheng, J.-B.; et al. Artificial intelligence-driven radiomics study in cancer: The role of feature engineering and modeling. Mil. Med. Res. 2023, 10, 1–33. [Google Scholar] [CrossRef] [PubMed]
- Ye, J.; Xiong, Y.; Chen, Y.; Pan, J.; Qiu, Y.; Chen, Y.; Luo, Z.; Li, Y.; Huang, W. Development and validation of an integrated model combining deep learning, radiomics, and clinical and breast ultrasound features for Breast Imaging Reporting and Data System 4A lesion malignancy classification. Quant. Imaging Med. Surg. 2025, 15, 11907–11921. [Google Scholar] [CrossRef] [PubMed]
Figure 1.
Methodological design of the study.
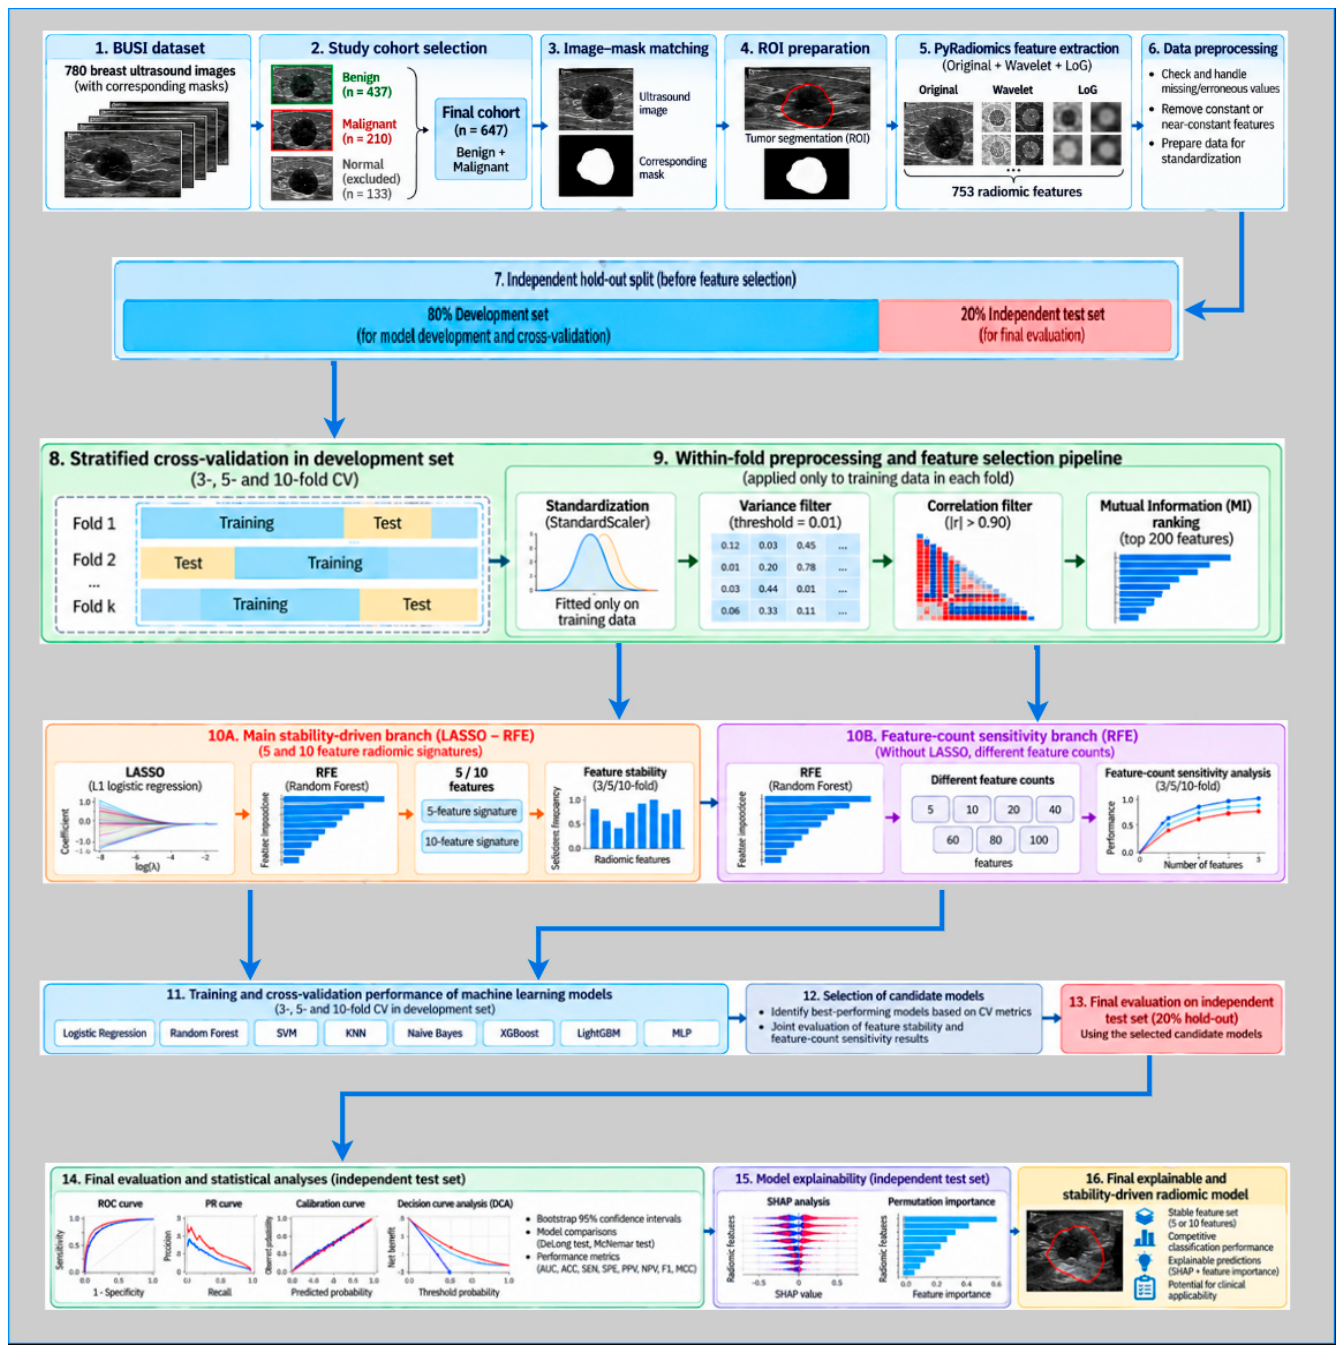
Figure 2.
Preparation of breast ultrasound images and segmentation masks from the BUSI dataset for radiomic analysis.
Figure 2.
Preparation of breast ultrasound images and segmentation masks from the BUSI dataset for radiomic analysis.
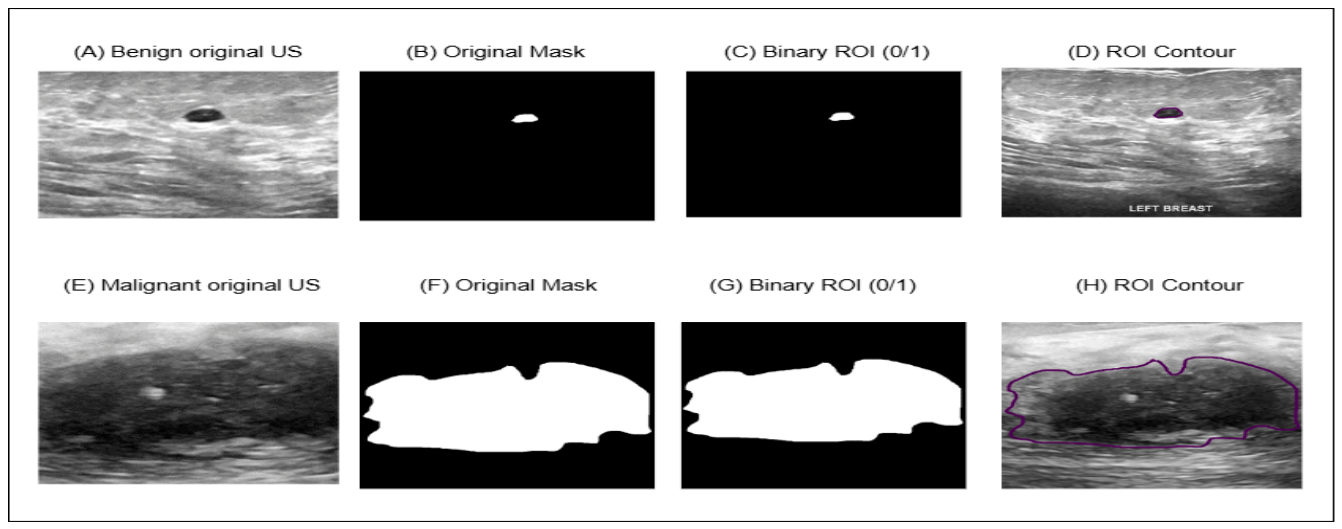
Figure 3.
Representative illustration of the image transformations used for radiomic feature extraction in the BUSI dataset.
Figure 3.
Representative illustration of the image transformations used for radiomic feature extraction in the BUSI dataset.
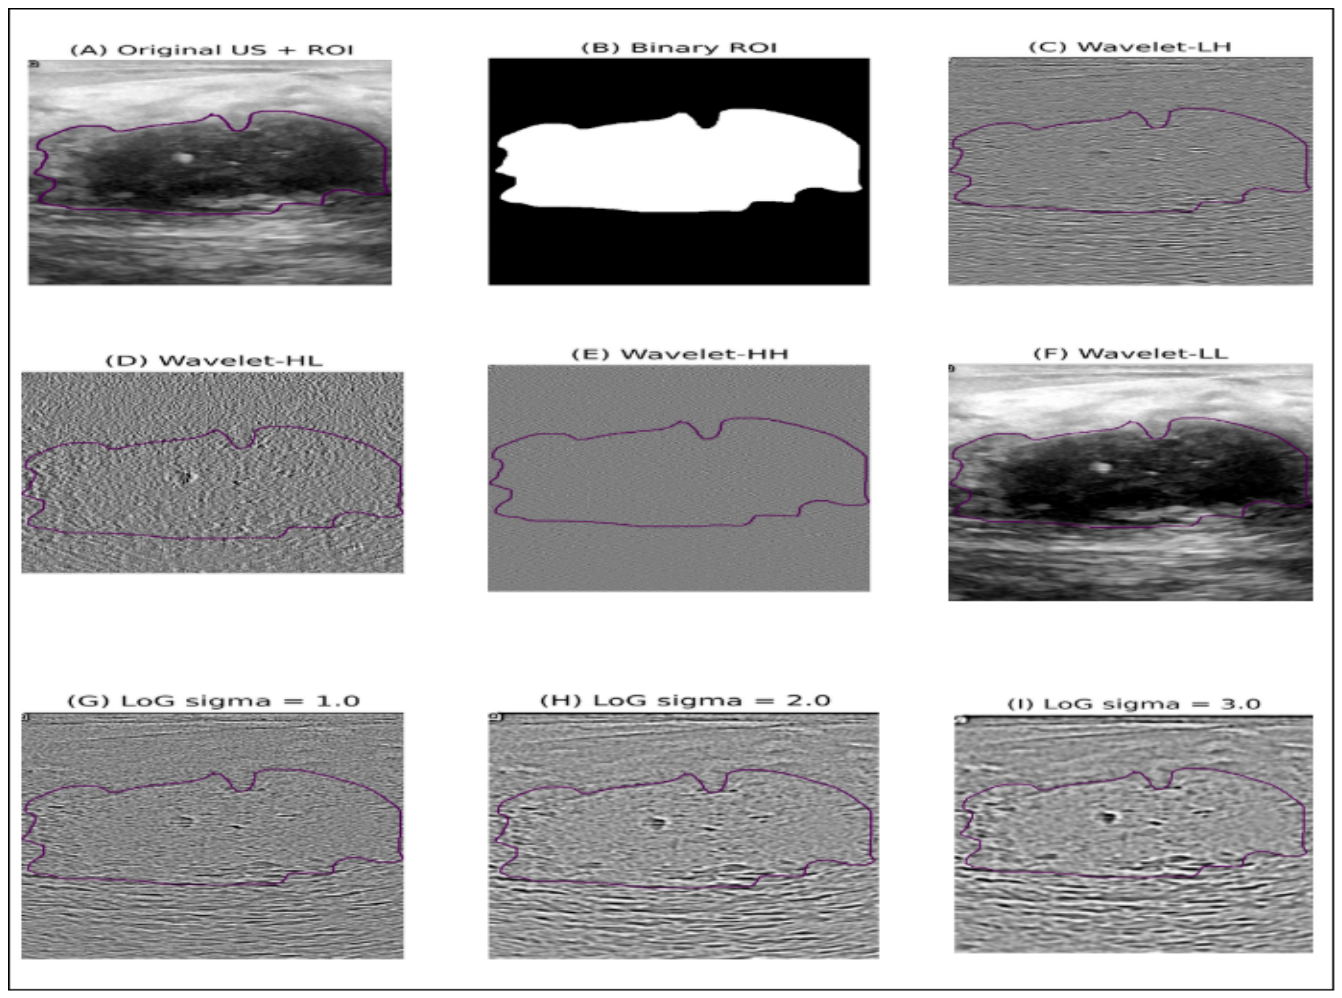
Figure 4.
Confusion matrix plots for the top-5 models on the independent test set.
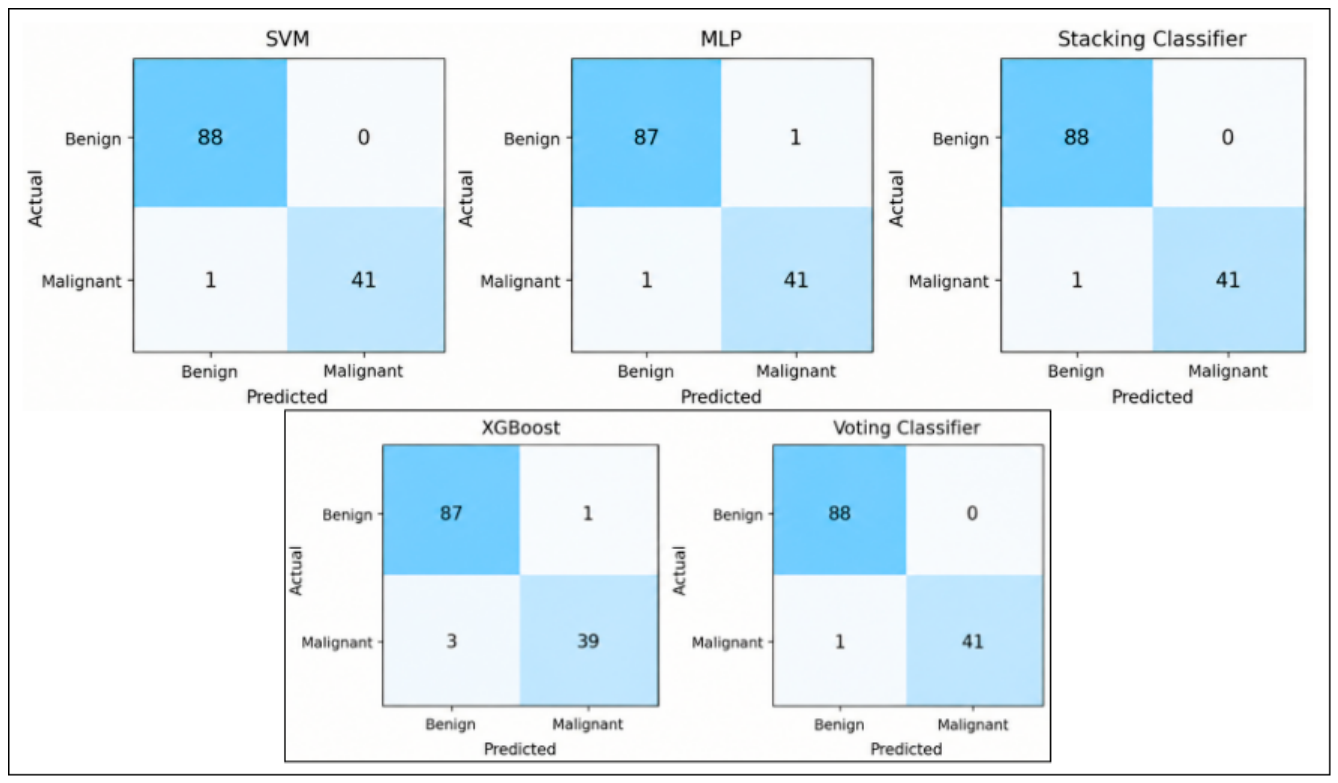
Figure 5.
(a) ROC curves for independent testing, (b) Precision–Recall curves, (c) Calibration curves, and (d) Decision Curve Analysis.
Figure 5.
(a) ROC curves for independent testing, (b) Precision–Recall curves, (c) Calibration curves, and (d) Decision Curve Analysis.
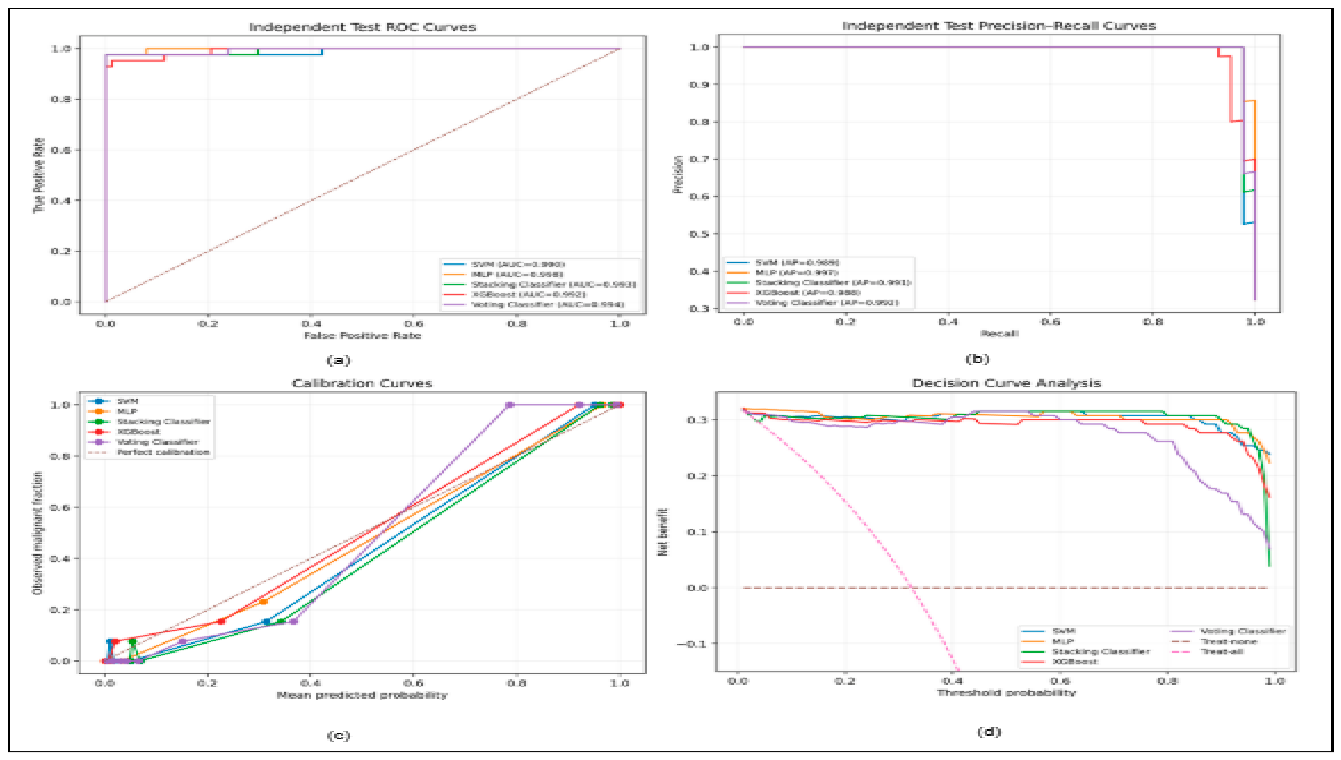
Figure 6.
5 SHAP plots for the mode.
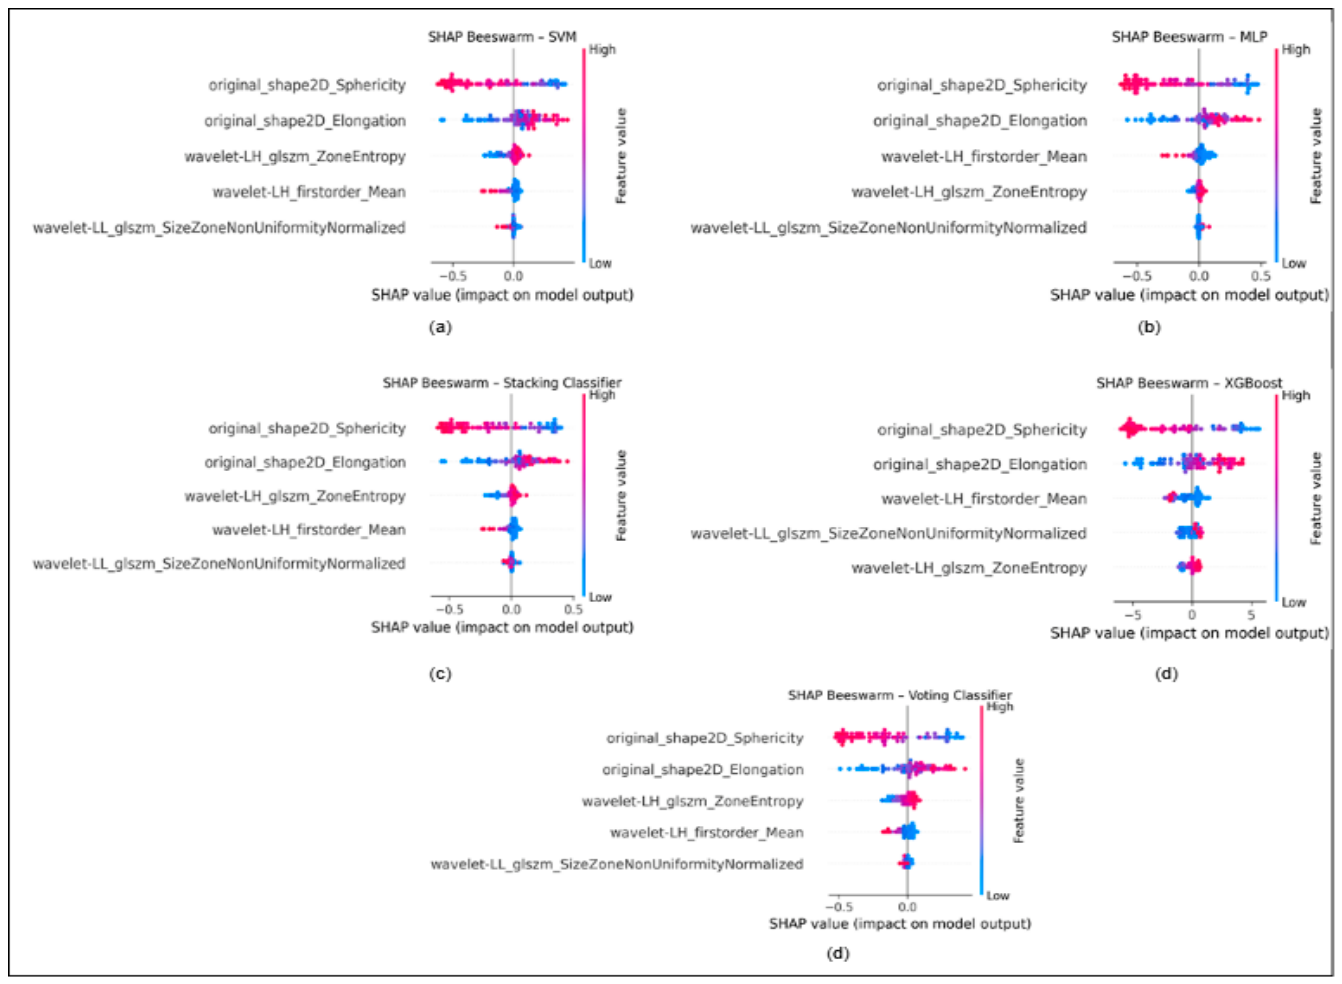
Figure 7.
(a) SVM learning curve and (b) SVM validation curve.
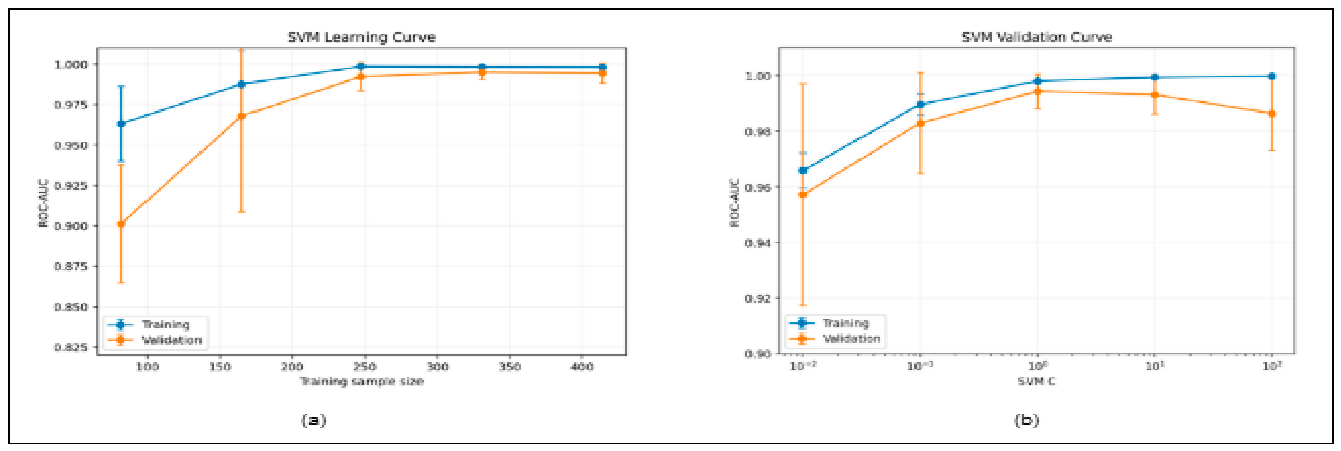

Table 1.
Distribution of the dataset into development and independent test sets.
| Group | n | Benign, n (%) | Malign, n (%) | Malign Rat e |
| Full dataset | 647 | 437 (67.54%) | 210 (32.46%) | 32.46% |
| Development | 517 | 349 (67.50%) | 168 (32.50%) | 32.50% |
| Independent Test | 130 | 88 (67.69%) | 42 (32.31%) | 32.31% |
Table 2.
Radiomic Feature Extraction from Images.
| Image Type | First-Order | GLCM | GLDM | GLRLM | GLSZM | NGTDM | Shape2D | Total |
| Original | 18 | 24 | 14 | 16 | 16 | 5 | 9 | 102 |
| Wavelet-LH | 18 | 24 | 14 | 16 | 16 | 5 | 0 | 93 |
| Wavelet-HL | 18 | 24 | 14 | 16 | 16 | 5 | 0 | 93 |
| Wavelet-HH | 18 | 24 | 14 | 16 | 16 | 5 | 0 | 93 |
| Wavelet-LL | 18 | 24 | 14 | 16 | 16 | 5 | 0 | 93 |
| LoG σ=1.0 | 18 | 24 | 14 | 16 | 16 | 5 | 0 | 93 |
| LoG σ=2.0 | 18 | 24 | 14 | 16 | 16 | 5 | 0 | 93 |
| LoG σ=3.0 | 18 | 24 | 14 | 16 | 16 | 5 | 0 | 93 |
| Total | 144 | 192 | 112 | 128 | 128 | 40 | 9 | 753 |
Table 3.
Change in the number of features during the feature selection stages.
| Fold | Start | Post-Variance | After Correlation | Post-MI | After LASSO |
| 3 | 753 | 753 | 164.00 ± 4.10 | 164.00 ± 4.10 | 13.67 ± 2.25 |
| 5 | 753 | 753 | 162.60 ± 6.55 | 162.60 ± 6.55 | 14.60 ± 1.58 |
| 10 | 753 | 753 | 164.00 ± 4.21 | 164.00 ± 4.21 | 17.00 ± 1.21 |
Table 4.
5-feature radiomics feature set stability results.
| Future | 3-fold | 5-fold | 10-fold |
| log-sigma-1-0-mm-3D_glcm_MaximumProbability | 33.3% | 20.0% | 30.0% |
| log-sigma-1-0-mm-3D_glszm_ZoneEntropy | 33.3% | 60.0% | 80.0% |
| log-sigma-2-0-mm-3D_glcm_MaximumProbability | 33.3% | — | — |
| original_glrlm_GrayLevelNonUniformity | — | 20.0% | 10.0% |
| original_glrlm_RunEntropy | 66.7% | 80.0% | 70.0% |
| original_shape2D_Elongation | 100.0% | 100.0% | 100.0% |
| original_shape2D_Sphericity | 100.0% | 100.0% | 100.0% |
| wavelet-LH_glszm_ZoneEntropy | 100.0% | 100.0% | 100.0% |
| wavelet-LL_gldm_DependenceVariance | 33.3% | 20.0% | 10.0% |
Table 5.
10-feature radiomics feature set stability results.
| Future | 3-fold | 5-fold | 10-fold |
| log-sigma-1-0-mm-3D_glcm_Imc1 | 33.3% | — | — |
| log-sigma-1-0-mm-3D_glcm_MaximumProbability | 33.3% | 20.0% | 30.0% |
| log-sigma-1-0-mm-3D_glszm_ZoneEntropy | 66.7% | 60.0% | 80.0% |
| log-sigma-2-0-mm-3D_firstorder_Skewness | 100.0% | 100.0% | 90.0% |
| log-sigma-2-0-mm-3D_glcm_Imc1 | — | 20.0% | — |
| log-sigma-2-0-mm-3D_glcm_MCC | — | 60.0% | 60.0% |
| log-sigma-2-0-mm-3D_glcm_MaximumProbability | 33.3% | — | — |
| log-sigma-3-0-mm-3D_firstorder_Maximum | 33.3% | 20.0% | 20.0% |
| log-sigma-3-0-mm-3D_glrlm_LongRunEmphasis | 33.3% | — | 10.0% |
| log-sigma-3-0-mm-3D_glrlm_LongRunHighGrayLevelEmphasis | 33.3% | 20.0% | 10.0% |
| log-sigma-3-0-mm-3D_glszm_SmallAreaEmphasis | 33.3% | 40.0% | — |
| original_firstorder_Energy | 33.3% | — | — |
| original_firstorder_Kurtosis | 33.3% | 20.0% | 40.0% |
| original_glcm_Imc2 | 33.3% | 20.0% | 10.0% |
| original_glrlm_GrayLevelNonUniformity | — | 40.0% | 50.0% |
| original_glrlm_RunEntropy | 100.0% | 100.0% | 100.0% |
| original_glszm_LargeAreaHighGrayLevelEmphasis | — | 20.0% | — |
| original_shape2D_Elongation | 100.0% | 100.0% | 100.0% |
| original_shape2D_Sphericity | 100.0% | 100.0% | 100.0% |
| wavelet-HL_firstorder_Skewness | 33.3% | 60.0% | 80.0% |
| wavelet-LH_glszm_ZoneEntropy | 100.0% | 100.0% | 100.0% |
| wavelet-LL_gldm_DependenceVariance | 33.3% | 60.0% | 70.0% |
| wavelet-LL_gldm_LargeDependenceHighGrayLevelEmphasis | 33.3% | 40.0% | 50.0% |
Table 6.
Top-5 models identified on the development set and their cross-validation performances.
| Model | Fold | Future | Accuracy | Sensitivity | Specificity | F1 | ROC-AUC | MCC |
| SVM | 3 | 5 | 0.9574 ± 0.0034 | 0.8988 ± 0.0273 | 0.9857 ± 0.0098 | 0.9320 ± 0.0066 | 0.9951 ± 0.0024 | 0.9028 ± 0.0076 |
| MLP | 10 | 5 | 0.9768 ± 0.0177 | 0.9526 ± 0.0542 | 0.9886 ± 0.0200 | 0.9635 ± 0.0285 | 0.9939 ± 0.0140 | 0.9483 ± 0.0392 |
| Stacking Classifier | 10 | 5 | 0.9652 ± 0.0236 | 0.9287 ± 0.0667 | 0.9828 ± 0.0200 | 0.9448 ± 0.0385 | 0.9932 ± 0.0099 | 0.9214 ± 0.0538 |
| XGBoost | 5 | 5 | 0.9536 ± 0.0329 | 0.8875 ± 0.0843 | 0.9857 ± 0.0175 | 0.9246 ± 0.0541 | 0.9929 ± 0.0050 | 0.8945 ± 0.0759 |
| Voting Classifier | 10 | 5 | 0.9632 ± 0.0231 | 0.9169 ± 0.0629 | 0.9856 ± 0.0151 | 0.9412 ± 0.0377 | 0.9906 ± 0.0132 | 0.9165 ± 0.0528 |
Table 7.
Performance of the top-5 models on the independent test set.
| Model | Accuracy | Precision | Sensitivity | Specificity | F1 | ROC-AUC | MCC |
| MLP | 0.9846 | 0.9762 | 0.9762 | 0.9886 | 0.9762 | 0.9981 | 0.9648 |
| Voting Classifier | 0.9923 | 1 | 0.9762 | 1 | 0.9880 | 0.9943 | 0.9825 |
| Stacking Classifier | 0.9923 | 1 | 0.9762 | 1 | 0.9880 | 0.9930 | 0.9825 |
| XGBoost | 0.9692 | 0.9750 | 0.9286 | 0.9886 | 0.9512 | 0.9922 | 0.9294 |
| SVM | 0.9923 | 1 | 0.9762 | 1 | 0.9880 | 0.9900 | 0.9825 |
Table 8.
Holm-corrected results of the DeLong and exact McNemar tests.
| To Compare | ΔAUC | DeLong p | Holm p | McNemar b/c | McNemar p | Holm p |
| SVM vs MLP | -0.0081 | 0.323 | 1 | 1/0 | 1 | 1 |
| SVM vs Stacking Classifier | -0.0030 | 0.357 | 1 | 0/0 | 1 | 1 |
| SVM vs XGBoost | -0.0022 | 0.725 | 1 | 3/0 | 0.250 | 1 |
| SVM vs Voting Classifier | -0.0043 | 0.335 | 1 | 0/0 | 1 | 1 |
Table 9.
PI results for SVM.
| Future | Importance Ort. | SS | Number |
| original_shape2D_Sphericity | 0.3797 | 0.0462 | 1 |
| original_shape2D_Elongation | 0.1817 | 0.0306 | 2 |
| wavelet-LH_firstorder_Mean | 0.0158 | 0.0060 | 3 |
| wavelet-LH_glszm_ZoneEntropy | 0.0152 | 0.0081 | 4 |
| wavelet-LL_glszm_SizeZoneNonUniformityNormalized | 0.0009 | 0.0015 | 5 |
Table 10.
Integrated feature evaluation using Stability-Permutation-SHAP.
| Future | Max. Selection | Average Selection | Permutation | Permutation Sequence | Mean |SHAP| | SHAP Sequence |
| original_shape2D_Sphericity | 100.0% | 100.0% | 0.3797 | 1 | 0.3202 | 1 |
| original_shape2D_Elongation | 100.0% | 100.0% | 0.1817 | 2 | 0.1719 | 2 |
| wavelet-LH_glszm_ZoneEntropy | 100.0% | 100.0% | 0.0152 | 4 | 0.0473 | 3 |
| log-sigma-2-0-mm-3D_firstorder_Skewness | 100.0% | 96.7% | — | — | — | — |
| original_glrlm_RunEntropy | 100.0% | 86.1% | — | — | — | — |
| log-sigma-1-0-mm-3D_glszm_ZoneEntropy | 80.0% | 63.3% | — | — | — | — |
| wavelet-HL_firstorder_Skewness | 80.0% | 57.8% | — | — | — | — |
| wavelet-LL_gldm_DependenceVariance | 70.0% | 37.8% | — | — | — | — |
| log-sigma-2-0-mm-3D_glcm_MCC | 60.0% | 60.0% | — | — | — | — |
| original_glrlm_GrayLevelNonUniformity | 50.0% | 30.0% | — | — | — | — |
| wavelet-LL_gldm_LargeDependenceHighGrayLevelEmphasis | 50.0% | 41.1% | — | — | — | — |
| log-sigma-3-0-mm-3D_glszm_SmallAreaEmphasis | 40.0% | 36.7% | — | — | — | — |
| original_firstorder_Kurtosis | 40.0% | 31.1% | — | — | — | — |
| log-sigma-1-0-mm-3D_glcm_Imc1 | 33.3% | 33.3% | — | — | — | — |
| log-sigma-1-0-mm-3D_glcm_MaximumProbability | 33.3% | 27.8% | — | — | — | — |
| log-sigma-2-0-mm-3D_glcm_MaximumProbability | 33.3% | 33.3% | — | — | — | — |
| log-sigma-3-0-mm-3D_firstorder_Maximum | 33.3% | 24.4% | — | — | — | — |
| log-sigma-3-0-mm-3D_glrlm_LongRunEmphasis | 33.3% | 21.7% | — | — | — | — |
| log-sigma-3-0-mm-3D_glrlm_LongRunHighGrayLevelEmphasis | 33.3% | 21.1% | — | — | — | — |
| original_firstorder_Energy | 33.3% | 33.3% | — | — | — | — |
| original_glcm_Imc2 | 33.3% | 21.1% | — | — | — | — |
| log-sigma-2-0-mm-3D_glcm_Imc1 | 20.0% | 20.0% | — | — | — | — |
| original_glszm_LargeAreaHighGrayLevelEmphasis | 20.0% | 20.0% | — | — | — | — |
| wavelet-LH_firstorder_Mean | — | — | 0.0158 | 3 | 0.0352 | 4 |
| wavelet-LL_glszm_SizeZoneNonUniformityNormalized | — | — | 0.0009 | 5 | 0.0123 | 5 |
Table 11.
Data set and feature selection.
| Study | Data Set/Sample | Initial Number of Features | Selected Feature | Feature Selection/Reduction |
| [5] | BUSI-WHU; 816 patients, 927 lesions | 939 | 48 fixed features | Correlation filter, Bo-ruta; Mann–Whitney U, Benjamini–Hochberg and Cliff’s delta analyses |
| [10] | Non-mass lesions in dense breasts; 619 patients (304 malignant, 315 benign) | 848 | 12 | Student t-test, Pearson Corelation (r=0.80), LASSO |
| [4] | Prospective, 206 lesions (144 benign, 62 malignant) | 10 | In particular, the margin and orientation of the lesion | 10 BI-RADS-based features; a comparison of the discriminatory power of the features |
| [9] | Three centres, three countries; 1,259 solid lesions | 242 | 33 robust and meaningful features | Reproducibility/robustness assessment and statistical feature selection |
| [12] | BUSI; ultrasound images of benign and malignant lesions | Not specified | Shape-based radiomic features | U-Net segmentation, ROI-based radiomic feature extraction, ML classification |
| [3] | BUSI; benign and malignant images, excluding the ‘normal’ category | 123 | 40 | Feature importance scores, correlation matrix |
| [1] | BUSI; benign and malignant tumours | 3810 | 10 | Recursive Feature Elimination (RFE); SMOTE for class imbalance |
| [2] | Two centres; 135 development lesions and 66 external trial lesions | 520 | 10 | Reproducibility, low variance, high correlation filter, RFECV |
| [7] | 119 patients, 123 non-mass lesions; training set: 98, validation set: 25 | 1.558 | 10 | Dimension reduction, LASSO; λ optimisation using 10-fold cross-validation |
| [78] | BI-RADS 4A; 935 patients in the development/internal validation phase + 488 patients in the external validation phase | 9 Inputs: The number of variables, not the initial number of features. | 29 radiomics + 22 DL + 4 clinical/US | ICC, ANOVA, LASSO; PCA for DL features |
| [6] | 3,142 patients from eight hospitals; plus a prospective test cohort. | 851 | 12 | Reproducibility and selection of radiomic features; integration with clinical features |
| Our Study | BUSI; 647 ultrasound images (437 benign, 210 malignant). Excluding the ‘normal’ class. Training/development 80% (n=517), independent testing 20% (n=130). | 753 radiomic features: Original (102), Wavelet (372), LoG (279). First-order, GLCM, GLRLM, GLSZM, GLDM, NGTDM and Shape2D feature families. | A final radiomic analysis with 5 features. Alternative sets with 10, 20, 40, 60, 80 and 100 features were also evaluated. | VarianceThreshold (0.01), Pearson correlation (|r| > 0.90), Mutual Information, L1-LASSO, RFE. Feature selection was carried out within the training folds of the cross-validation. |
Table 12.
Machine learning, validation and comparison of results.
| Study | ML Models | Verification/Assessment | Explainability | A Striking Result |
| [5] | LR, RF, LightGBM, CatBoost, SVM and other ensemble models | Patient-based, class-balanced 10-fold CV; OOF, bootstrap 95% GA, calibration | SHAP bar and beeswarm; calculations on test floors | ROC-AUC 0.828–0.834; no significant difference between the models |
| [10] | Clinical, ultrasound, radiomic and combined LR models | 7:3 training/validation; ROC, DeLong, calibration, DCA | LASSO coefficients and Rad-score | Combined model AUC: 0.89 (training)/0.83 (validation) |
| [4] | MLP, DT, LDA, RF, SVM | 10-fold CV; ROC-AUC, 95% GA, sensitivity and specificity | The importance of BI-RADS classifications | SVM AUC 0.840; sensitivity 71.4, specificity 76.9% |
| [9] | XGBoost, RF, SVM | Multi-centre evaluation; ROC-AUC, accuracy, sensitivity, specificity | Evaluation of robust and meaningful features | XGBoost: 88.4% accuracy, AUC 0.890 |
| [12] | SVM and other ML classifiers; U-Net | 5-layer CV and test set; IoU, accuracy | Morphological/shape characteristics; SHAP not reported | U-Net–Radiomic ML: 97.8% test accuracy, IoU 0.94231 |
| [3] | XGBoost, Gradient Boosting, AdaBoost, SVM, RF, DT | Classification performance metrics | Feature importance scores | Gradient Boosting: 98.13% accuracy |
| [1] | RF, Gradient Boosting, AdaBoost and other ML models | Accuracy, ROC-AUC, F1, MCC | Features selected using RFE; SHAP not reported | Accuracy97.4%, AUC 0.97, F1 0.94, MCC 0.959 |
| [2] | RF | Cross-validation + independent external testing; McNemar, ROC-AUC | Selected radiomic features; SHAP not reported | 82 per cent accuracy in the external test, AUC 0.82 |
| [7] | LR, lineer regresyon, SVM, RF, Extra Trees, LightGBM | Training/validation; ROC, DCA | Rad-score and selected features; SHAP not reported | Combined model AUC 0.973/0.933 |
| [78] | LR, SVM, RF, XGBoost, MLP, LightGBM | Internal and external validation; DeLong, DCA | SHAP feature contribution analysis | Combined model AUC 0.938/0.870/0.861 (training/internal/external) |
| [6] | Five ML models; the best radiomic model is LR | Internal, external and prospective testing; ROC, DCA | SHAP | Combined model AUC 0.92/0.90/0.92/0.93 (training/internal/external/prospective) |
| Our Study | SVM, MLP, XGBoost, Stacking Classifier, Voting Classifier (the top 5 models transferred to the validation set). | 3-fold, 5-fold and 10-fold cross-validation, independent 20% hold-out test, 1,000-repetition bootstrap (95% confidence interval), Accuracy, Precision, Sensitivity, Specificity, F1, ROC-AUC, MCC, ROC/PR curves, calibration, DCA, DeLong and exact McNemar (Holm correction). | SHAP + Permutation Importance + Feature Stability. SHAP analyses were applied to the top five models. For SVM, the SHAP and permutation importance results were evaluated alongside feature selection stability. | The highest test accuracy was 99.23% (SVM, Voting, Stacking); the highest test ROC-AUC was 0.9981 (MLP). The Sphericity, Elongation and Wavelet-LH ZoneEntropy features demonstrated 100% classification stability. No significant differences were found between the models in the DeLong and McNemar tests (Holm p=1.000). |
Disclaimer/Publisher’s Note: The statements, opinions and data contained in all publications are solely those of the individual author(s) and contributor(s) and not of MDPI and/or the editor(s). MDPI and/or the editor(s) disclaim responsibility for any injury to people or property resulting from any ideas, methods, instructions or products referred to in the content. |
© 2026 by the author. Licensee MDPI, Basel, Switzerland. This article is an open access article distributed under the terms and conditions of the Creative Commons Attribution (CC BY) license.
Copyright: This open access article is published under a Creative Commons CC BY 4.0 license, which permit the free download, distribution, and reuse, provided that the author and preprint are cited in any reuse.