
Submitted:
13 November 2026
Posted:
13 November 2026
You are already at the latest version
Abstract
Oil-mist coalescing filters are commonly compared using filtration efficiency and pressure drop from short tests, although retained liquid continues to redistribute during operation. This critical review examines how liquid morphology, distribution and connectivity affect the interpretation of wet performance and service-life evidence. Imaging reveals substantial local saturation differences and extensive inter-fiber liquid structures. Within one hybrid–Janus comparison, whole-filter saturation ranged from 54.47% to 61.96%, whereas source-reported wet-to-clean pressure-drop ratios ranged from 3.32 to 22.36. These observations support considering liquid arrangement alongside bulk inventory, but do not isolate connectivity from pore geometry and wettability. Long-duration experiments also show that drainage can coexist with pressure-drop creep over 1100 h. We distinguish measured endpoints, observation durations and lifetime estimates extrapolated from short degradation records. A traceable service-life claim requires defined loading and operating conditions, concurrent resistance and outlet measurements, an explicit endpoint, and separation of measured duration from predicted life. A proposed reporting framework and a conditional pressure-scaling analysis identify the evidence needed to assess transfer from laboratory media to compressed-air cartridges.
Keywords:
oil mist
; coalescing filter
; compressed air
; wet pressure drop
; liquid organization
; local saturation
; drainage
; re-entrainment
; service life
; reporting criteria
1. Introduction
Fibrous coalescing filters are widely used to remove submicrometer and micrometer liquid oil droplets from industrial gas streams, including compressed-air systems. Their clean-state operation can be described by conventional aerosol filtration mechanisms: droplets are transported toward fibers by Brownian diffusion, interception and inertial effects, become captured, and subsequently coalesce. The difficulty begins after capture. Unlike solid particles, the collected phase remains mobile. Oil can spread or bead on fibers, accumulate at fiber intersections, form inter-fiber sails and bridges, migrate through the pore network, create preferential channels or interfacial films, reach the downstream surface, and finally drain or become re-entrained. The geometry available to the gas therefore changes continuously during operation, and the filter cannot be regarded as a static porous medium once wetting has begun [1,2,3,4,5,6,7].
These mechanisms belong to two research traditions that are usually reported separately. The capture step has been described for decades by fibrous aerosol filtration theory, in which single-fibre efficiencies for interception and inertial impaction are combined with a filter-scale flow field [8,9], including the deposition of particles onto material already collected on the fibres [10]. The liquid phase itself has been studied far more extensively in the separation literature, where the passage of a dispersion through a fibrous bed is treated as a sequence of capture, film drainage and coalescence [11,12,13], and where the redispersion of the coalesced phase back into the flowing continuous phase is recognised as a distinct mechanism [14,15]. That literature also treats coalescence as a kinetic process that can be represented by population balances or by interfacial film dynamics [16,17,18,19], and it is applied directly in industrial coalescers, including amphiphobic fibre beds for oil–water separation [20] and combined coalescence stages in chemical process purification [21]. The aerosol-mist literature reviewed here has adopted this vocabulary only partially, which is one reason why film behaviour, drainage and re-entrainment are often reported separately from resistance.
The literature already contains broad reviews of aerosol-mist coalescence [1], drainage and entrainment [22], numerical and machine-learning approaches [23], and pressure-drop reduction strategies [24]. These reviews provide the mechanistic and materials context summarized in Table 1. The present review addresses a narrower problem: which wet-state measurements support a claim about service life, and under which conditions can that claim inform compressed-air operation? Its contribution is a comparison of evidence types and endpoints, rather than a new classification of filter materials.
Short-term measurements do not necessarily demonstrate stable long-term operation. A filter may show high removal efficiency and an apparently stable wet pressure drop while its internal liquid distribution continues to evolve. Drainage may begin before liquid pathways stabilize. Similarly, a lower average saturation does not establish that the main gas pathways remain open. Recent work on oily-aerosol media notes that long-term pressure-drop evolution and stability remain insufficiently evaluated for many designs [24].
This distinction becomes particularly important for compressed-air service. Industrial coalescers may operate for months under varying flow, temperature, lubricant condition, humidity, particulate contamination and repeated compressor start–stop cycles. Direct pressure-rated evidence is nevertheless limited. Kaiser et al. measured oil aerosols from oil-injected screw compressors up to 10 bar and showed that pressure, temperature, face velocity, loading and aerosol generation were coupled in the test platform; even apparently simple statements about a “pressure effect” therefore depend on how the actual and standard flow rates are defined [25]. Mechanistic results obtained at atmospheric pressure remain valuable, but they should be transferred to compressed-air service only after the gas condition, actual face velocity and cartridge geometry are considered.
A second difficulty is terminological. The phrase “service life” is used for several different experimental quantities. In some papers, a longer time to a nominal wet plateau is described as longer life. In others, lifetime is the time required to reach a prescribed pressure drop or dust-holding capacity. More recent studies define failure through a combination of pressure-drop and efficiency thresholds. These quantities are not interchangeable. A test can be long without reaching failure, while an accelerated test can generate a numerical lifetime by extrapolation from a much shorter measured period. Without an explicit end-of-life criterion, a statement such as “lifetime increased by 60%” has limited transferability.
Bulk descriptors provide only part of the answer. Straube et al. reported local saturation values from 5.7% to 39.4% within an oil-loaded fibrous specimen, with more than 80% of retained oil volume in inter-fiber sails [26]. Xu et al. reported markedly different normalized wet pressure drops for hybrid and Janus media at broadly similar whole-filter saturation [27]. These results motivate joint consideration of retained quantity, location and connectivity. They do not establish a unique constitutive relation between a liquid-structure descriptor and resistance.
This review follows the link from retained-liquid structure to performance and then to service-life interpretation. Section 2 examines liquid morphology and distribution; Section 3 considers drainage, pressure-drop creep, secondary aerosol and flow interruption. Section 4 compares observation durations with reported life improvements and extrapolated endpoints, and examines pressure scaling under specified assumptions. Section 5 proposes reporting requirements for evaluating service-life claims in compressed-air coalescing filtration. No new filtration experiments are reported.
1.1. Scope and Evidence Selection
This focused critical review covers liquid distribution, evolving wet resistance, drainage and re-entrainment, and the interpretation of service-life endpoints. It is not a systematic review or a quantitative meta-analysis. The synthesis uses the established reviews [1,22,23,24] and selected primary studies addressing these questions. Supplementary Table S1 records the conditions, quantitative observations, evidence type, limitations and source locators of the studies used in the central comparisons. It does not rank the overall quality of individual papers.
The selection is focused on studies relevant to the mechanisms and service-life comparisons discussed below, rather than an exhaustive enumeration of publications. Mechanistic evidence is considered when a reported wet-state response can be linked to the stated experimental or modelling conditions. A service-life value is interpreted as a measured endpoint only when its criterion and observation basis are established. Where only an abstract or publisher-indexed text supports a quantitative statement, that restriction is identified in Supplementary Table S1 and the statement is limited accordingly. Studies without a defined lifetime endpoint may inform the mechanistic discussion but do not establish time to failure.
A study contributes to the synthesis when it informs at least one of these questions; it need not contain every measurement required for lifetime evaluation. Morphology studies, drainage experiments and numerical comparisons are therefore assessed for their specific contribution. An unreported endpoint is treated as missing information, not evidence of poor filtration or evidence that the endpoint was absent. Clean-state filtration and static contact angle are used only as context where they help interpret wet-state behavior.
Evidence from a filter or separator actually operated under specified elevated pressure is distinguished from transferable laboratory evidence. Use of compressed air to generate an aerosol, a compressor lubricant as the liquid, or a cartridge-shaped specimen does not by itself establish pressure-rated validation. Most examples below provide mechanistic or comparative laboratory evidence; their application to compressed-air service remains conditional on pressure, actual velocity, geometry and operating history.
Terminology follows these conventions unless a source is quoted verbatim. Pressure drop (Δp) is the total pressure difference across the test element. Wet pressure drop is the value measured after liquid loading, at the time or within the interval stated by the source; excess wet pressure drop is the wet value minus the corresponding clean-state value. Where a source reports an increase or a reduction relative to a clean reference, that ratio is reproduced as reported and identified as such. Liquid loading rate is quoted in the units of the source, because a mass-per-volume basis may refer to standard or to actual gas volume; the basis and the reference conditions are stated wherever they are known.
2. From Retained Oil Mass to Spatial Organization
2.1. Global Saturation Is Necessary, but Not Sufficient
Liquid saturation is one of the most widely used descriptors of the wet state of fibrous coalescing media. It is physically meaningful: it estimates the fraction of open pore volume occupied by liquid and therefore provides a useful quantity for mass balances, comparison of operating conditions and interpretation of pressure-drop evolution. However, saturation is normally determined over an entire coupon, filter layer or cartridge section. The result is a bulk average. It does not show whether the same liquid volume is dispersed among many fibers, concentrated into a few almost saturated zones, organized as inter-fiber sails, or connected into a film that spans a hydraulically critical region.
Saturation definitions must separate spatial scale from measurement method. Volumetric saturation is the retained liquid volume divided by the stated void volume, S = Vliquid/Vvoid. A local value describes a selected three-dimensional subvolume; an integral value averages over a layer, coupon or element. Gravimetry can yield the same volumetric quantity when retained liquid mass is converted using its density and divided by the stated void volume. Mead-Hunter et al. used this basis in relating pressure drop to saturation [28]. Retained mass per area and mixed-contaminant dust-holding capacity are different quantities, while a percentage change relative to a control is a comparison rather than a saturation definition. Table 2 therefore reports the measurement scale and quantity separately. Imaging resolution, sampled subvolume, void-volume reference and the timing of post-test weighing all affect comparability.
The coupling between retained liquid and resistance has been modelled more directly in related geometries. For gas–liquid flow through packed beds, pressure drop and liquid saturation have been expressed as joint functions of flow rate and packing [36], and dynamic-filtration models for fibrous media allow the penetration to change as deposits accumulate rather than treating it as a clean-state property [37]. Transferring these forms to oil mist requires one additional element, namely a description of how the retained liquid redistributes after capture, which is where the aerosol-mist and emulsion-coalescence literatures can inform each other.
Three-dimensional imaging demonstrates the information lost on averaging. Straube et al. investigated thin oleophilic glass-fiber/PET media after controlled loading [26]. At the highest investigated loading stage, local saturation at different positions ranged from 5.7% to 39.4%. More heavily and less heavily loaded regions therefore coexisted. Preferential gas flow through the more open regions is a plausible hydraulic consequence, but the saturation map alone does not measure that flow distribution.
The morphology of the deposited oil was equally important. Straube et al. classified retained structures as small oil structures, droplets and oil sails, where oil sails denote the elongated liquid bodies that span the space between adjacent fibers [26]. Even at the lowest investigated loading, more than 80% of the deposited oil volume was stored as oil sails. With continued loading, the oil-sail volume fraction increased and highly saturated zones developed, while other areas remained only weakly blocked. This picture differs from the common mental model of a wet filter as a dry network uniformly coated by a thin liquid layer. The retained phase is patchy, structured and preferentially connected.
Retained liquid can also affect capture in opposite directions. In thin oleophilic layers tested at 10, 25 and 40 cm·s−1, Straube et al. found that total number-based efficiency initially decreased up to a saturation of about 0.4, then increased at saturations of 0.6–0.8 as partial films developed [29]. The films enhanced inertial capture while increasing resistance. These saturation ranges belong to the tested thin layers and are not universal transition thresholds. Earlier efficiency and clogging studies likewise support evaluating deposition and flow redistribution together [2,5,6,7]. A film is therefore not intrinsically evidence of failed separation; its hydraulic and capture effects must be measured jointly.
For clarity, this review uses the term liquid organization to denote three related features of the wet state: (i) morphology, including droplets, sails, bridges, channels and films; (ii) spatial distribution through the media thickness and over the upstream and downstream surfaces; and (iii) connectivity, especially whether liquid structures intersect or sever the dominant gas-flow pathways. “Liquid organization” is not proposed as a new constitutive parameter. It is a conceptual distinction between a bulk inventory and the spatial state that controls hydraulic resistance and secondary aerosol generation.
2.2. Morphology and Hydraulic Response
Captured droplets can spread along fibers, collect at junctions, form inter-fiber bridges or sails, and develop connected liquid pathways. At interfaces and downstream surfaces they may form films, drain, or generate secondary aerosol. These states can coexist and their order depends on loading, pore geometry, wettability and flow history. Figure 1 depicts representative local states without assigning them a common time axis. In particular, drainage onset and entrainment onset are not assumed to occur in a universal sequence.
The classical jump-and-channel work of Kampa and co-workers remains useful because it linked these structures to distinct components of wet pressure drop [3,4]. In this framework, a “channel” contribution reflects viscous liquid transport through established connected paths, whereas “jump” contributions reflect capillary barriers associated with entry, exit or interfacial film formation. Importantly, the model does not assume uniform pore filling. It represents a medium containing preferential gas and liquid regions whose contributions evolve as loading proceeds. The same final pressure drop can therefore arise from different combinations of channel resistance and capillary barriers.
The balance among gravity, capillarity and viscous forces helps interpret these states [22]. Bond and capillary numbers can be useful when the characteristic length, phase viscosity and velocity are specified. They do not remove the need to describe fiber geometry, interfaces and liquid pathways. Correlations calibrated for one medium should therefore be distinguished from a transferable relationship across materials and operating conditions.
The interfacial description itself is more developed outside the aerosol-mist literature. The drainage and rupture of the thin film separating two approaching droplets, and the way the film thickness controls the transition to a coalesced state, have been analysed in detail [18,19]. For fibrous media specifically, pore-scale simulation of capillary transport of a wetting liquid provides effective pore radii and transport velocities as functions of fibre geometry and liquid properties [38], which is the quantity that a Bond- or capillary-number argument requires but does not itself supply.
Direct imaging has made these transitions more visible. Zhu et al. monitored oily-aerosol capture on nanofibrous membranes with different wettabilities [39]. On the oleophilic membrane, captured oil initially spread along fibers and accumulated at junctions with little immediate hydraulic penalty. With continued deposition, neighboring droplets merged, liquid structures grew and a continuous film formed. The pressure drop remained relatively low during the early period, then exceeded that of the amphiphobic membrane after about 80 min and ultimately approached 23.95 kPa. The authors also associated the more blocked state with enhanced secondary entrainment and a decline in efficiency.
The amphiphobic membrane followed a different trajectory. Its initial pressure drop was slightly higher because of its smaller pores, but droplets retained a smaller contact area on the fibers, grew as more discrete structures and could detach under gravity. Under the reported condition, pressure drop showed a turning point after about 40 min and reached approximately 8.5 kPa within the following 10 min, after which it changed only modestly [39]. The experiment does not establish a universally superior wettability because the membrane architecture and challenge were specific. Its value lies in showing that a marked change in the pressure-drop trajectory coincided with a change in the morphology of the retained oil.
A time-resolved pressure-drop curve should therefore be regarded as an indirect record of wet-state transitions rather than as a simple function of accumulated mass. A gradual increase can reflect distributed deposition or channel development; a sharp increase can reflect the formation of a capillary barrier or connected film; a subsequent plateau or decrease can reflect redistribution, drainage, film rupture or even structural damage. Interpreting the pressure-drop trajectory without information on liquid morphology can assign the same physical meaning to very different states.
2.3. Liquid Connectivity Can Matter More than Total Retained Liquid
Comparative experiments provide particularly strong evidence that the quantity of retained liquid and its hydraulic consequence can become decoupled.
Chang et al. investigated surface-modified glass-fiber coalescing media with asymmetric wettability [32]. Reported reductions in wet pressure drop and saturation were approximately 27–35% and 39–60%, respectively, relative to the study controls. These ranges are retained as source-reported comparisons; the available source record does not establish a verified pairing between each reduction and a particular spraying or loading condition. They should therefore not be interpreted as the simultaneous performance of a single configuration.
Macroscopic contact angle alone is an incomplete description of a fibrous medium. Coating depth, roughness, junction chemistry, contact-angle hysteresis and pore geometry can change the paths available to retained liquid. Establishing which of these factors controls a particular pressure response requires measurements beyond a static angle on a coupon.
Xu et al. compared an interlaced oleophilic/oleophobic hybrid medium with Janus-F and Janus-R configurations [27]. Whole-filter saturation was 54.47%, 56.01% and 61.96%, respectively, while the corresponding source-reported pressure-drop ratios were 3.32, 13.95 and 22.36 (Figure 2). The original figure labels this ratio ΔPs/ΔP0. The source also gives a transient hybrid pressure of 0.854 kPa and a clean pressure of approximately 0.2 kPa, which do not directly reproduce 3.32; the plotted ratios are therefore retained without calculating a further reduction factor. The commercial comparator, labeled H13 in the source, had saturation of 59.81% and a reported ratio of 25.09. The label is reproduced for source identification and does not independently verify an EN 1822 efficiency classification.
Optical observations in the same study showed continuous films in the single-wettability medium and smaller liquid pools in the hybrid medium [27]. The authors attributed this difference to oleophobic fibers interrupting bridge-to-film development during loading, rather than to rupture of an already equilibrated film. Together with the hydraulic comparison, these observations support a role for the spatial arrangement of liquid. They do not independently isolate connectivity from changes in pore architecture, local wettability or the clean-state reference pressure.
For design, total saturation is consequently insufficient as the sole target. Retained oil may be compatible with low resistance when gas pathways remain open and drainage routes are available. Conversely, liquid at an interface can impose a substantial pressure penalty. The relevant test is whether a proposed structure maintains capture and controlled release while limiting obstruction of the dominant gas pathways. Figure 2 is a within-study comparison, not a ranking of filters tested under different challenges.
2.4. Structure and Wettability Are Useful Because They Control Liquid Organization
Recent high-performance designs can be interpreted consistently through this spatial perspective rather than as isolated material innovations.
Earlier superoleophobic and asymmetric-wettability studies established that surface chemistry can alter the efficiency–pressure-drop tradeoff [40,41], while multilayer sequencing and downstream-support studies showed that the location at which liquid crosses an interface or leaves the active medium can be as important as the nominal wettability of the fibers [42,43,44]. These studies are important here not as a separate materials taxonomy, but because they demonstrate that wet-state behavior is controlled by the arrangement of capture, transport and release functions.
Orientation provides a further controlled design variable. Xu et al. reported a Janus wet pressure drop of 2.8 kPa compared with 6.1 kPa for the original medium and 5.4 kPa for an oleophilic comparator [45]. Coating depth and the direction of flow through the Janus medium affected performance. This comparison reinforces the need to specify which face is upstream and what comparator defines a reduction; the label “Janus” alone does not define a hydraulic state.
Patterned wettability is intended to control where liquid accumulates and crosses an interface. Chang et al. investigated asymmetric surface modification [32], while the studies below extend spatially selective treatment to layered media and cartridges [46,47]. Such designs should be compared using their stated geometries and controls, rather than a single contact-angle value. Detailed pattern-specific quality-factor and efficiency pairings are not used here where the source record is insufficient to verify them.
Ding et al. reported a two-step superoleophobic treatment and patterned coalescing media [46]. The publisher-indexed summary reports a pressure-drop reduction of 46.59% relative to the oleophilic substrate and cumulative efficiencies of 89.13% and 94.77%. The efficiency values differ by 5.64 percentage points. The summary does not establish that all reported benefits belong to the same configuration, and layer-specific reductions and immersion-test duration are not used in this comparison.
Chen et al. extended patterned wettability from flat media to cartridges [47]. Publisher-indexed text reports pressure-drop reductions of 34.2–47.4% for flat media relative to the substrate, and 28.5–35.7% for patterned FW cartridges relative to FS cartridges. The ranges describe separate comparisons and are not treated as a single optimum. These reports suggest that a liquid-routing design can retain a resistance advantage in a cartridge, but the accessible evidence does not establish long-term service life at rated compressed-air pressure.
Wang et al. reported a dual-scale Janus filter incorporating an oil-guiding region [34]. The publisher-indexed summary reports approximately 30% lower pressure drop, efficiency of 99.4%, dust-holding capacity of 286 g·m−2 and a service-life improvement exceeding eightfold relative to commercial filters. These metrics are retained as reported outcomes from separate performance categories; they are not combined into one verified operating point. A detailed efficiency pairing or a particular film-disruption sequence is not inferred from the summary.
These examples point to the same physical design principle: pore-size gradients, patterned surfaces, interlaced fibers and Janus layers are valuable when they separate the functions of capture, coalescence, temporary liquid storage and liquid release so that they do not all occur at the same hydraulic bottleneck. “More oleophobic” or “more oleophilic” is not an adequate design objective in isolation.
Two further design variables follow from the same reasoning. The wettability of the fibre surface shifts the balance between liquid held on the fibres and liquid transported through the medium, and changes filtration performance systematically in gas–liquid coalescing filters [48]. The placement of layers within a multilayer medium acts in a comparable way, because it determines where liquid crosses an interface and how much of it is retained there [49].
Surface-treatment durability remains a separate question. Exposure or immersion tests assess resistance to the specified stress, whereas filtration life concerns continued separation under loading and an explicit endpoint. The source summaries used for the patterned-media comparisons do not establish persistence of the same wet-state behavior during prolonged loading, mixed contamination or repeated shutdown. Tracking wettability and coating integrity alongside performance would help test this possible degradation mechanism.
At the same time, liquid-film language should not be overextended. The recent drainage review notes that published estimates of rear-side film thickness differ and that a universal correlation between film thickness and total pressure drop has not been established [22]. The evidence is much stronger for the broader role of film location, connectivity and dynamic interaction with gas flow than for a unique film-thickness-to-pressure-drop relationship. The next question is therefore temporal: even if a favorable liquid organization is achieved in a short test, does that state remain favorable as the filter continues to load, drain, stop and restart?
Table 2 summarizes selected comparisons using the reported quantity, measurement scale and operating conditions. The values are not pooled because the media, challenges, controls and endpoints differ. Supplementary Table S1 provides the wider evidence record.
2.5. What Numerical Models Can and Cannot Yet Resolve
Numerical methods offer different compromises between resolution and scale [23]. Interface-resolved Volume-of-Fluid and phase-field models represent droplet deformation and coalescence explicitly. Pore-network models retain a defined topology of pores and throats while simplifying interface geometry; they should not be described as discarding connectivity altogether. Darcy-scale descriptions average phase transport and require closure relations. Model usefulness therefore depends on whether the retained representation captures the mechanism being tested, rather than on scale alone.
Several of these approaches have been applied specifically to coalescing filters. A multiphase multicomponent model has been formulated for liquid aerosol filtration in fibrous media [50]; gravity-induced flow during oil-mist filtration has been represented explicitly [51]; and lattice-Boltzmann simulations have been used to resolve particle capture together with the surrounding flow field [52]. Pore-network stitching methods offer one route from such resolved simulations to element-scale predictions [53], while models that express pressure drop and liquid saturation jointly provide a complementary empirical anchor in packed and fibrous beds [36].
Hoch et al. compared a weighted-distance-map approach with Volume-of-Fluid simulations [54]. In an idealized crossed-fiber comparison, droplet-shape agreement was about 65%, while computed permeabilities differed by at most about 2%. Similar hydraulic predictions therefore do not uniquely validate the reconstructed liquid geometry. Their approach reduced computational cost but did not represent drainage, and agreement with another numerical method is not experimental validation. Conversely, calibrated saturation–pressure-drop models already exist: Mead-Hunter et al. obtained agreement using a capillary model with an empirical correction [28]. These studies support model-assisted interpretation within a calibrated range. Cartridge lifetime prediction additionally requires validation of the evolving state, drainage and failure mechanism under the relevant operating history.
3. Drainage Does Not Guarantee Steady Operation
3.1. Drainage Onset Is a Mass-Transfer Milestone, Not an End State
The onset of visible drainage is often used as a practical indication that a coalescing filter has entered steady operation. The assumption is intuitive: once the liquid leaving the element approximately balances the liquid being collected, further accumulation should cease and the pressure drop should stabilize. At the scale of an overall mass balance, this approximation can be useful. It does not, however, require the internal liquid distribution to have stopped evolving.
This distinction is already present in the mechanistic literature. When penetration is small, the cumulative drained mass can increase approximately linearly after a connected drainage path has developed [3,4,22]. That observation indicates a net through-flow of liquid. It does not reveal whether the same internal channels continue to carry the liquid, whether new channels are appearing, whether previously open regions are slowly wetting, or whether the rear-side film is changing its area and thickness. Drainage and internal hydraulic stabilization are different events.
Earlier saturation modeling also used an explicit stability convention. Mead-Hunter et al. treated changes below approximately 1% in saturation and pressure drop over one hour as a steady-state criterion in their experiments [28]. Much of that work used pre-saturated media. Its operational plateau criterion is therefore useful context for interpreting later creep measurements, not proof that all initially dry filters reach a unique stationary state.
Long-duration experiments make the distinction clear. Kolb et al. examined oleophilic glass-microfiber media over face velocities of 5–70 cm·s−1 and liquid-loading rates of 15–125 mg·m−2·s−1 [30]. The excess wet pressure drop did not follow a simple monotonic dependence on face velocity because higher gas velocity could reduce internal saturation. At the most severe reported condition (70 cm·s−1 and 125 mg·m−2·s−1), pressure-drop creep continued during 1100 h of non-stop operation without reaching a clear asymptotic level [30]. Kolb and Kasper subsequently examined this creep more systematically and showed that the apparent steady state also depends on the initial saturation state and filter efficiency [55].
This result changes how “steady state” should be used. A filter can satisfy an approximate liquid mass balance over one observation window while its internal hydraulic network continues to reorganize over a much longer timescale. New preferential paths can emerge, existing paths can redistribute, and weakly loaded regions can gradually become involved in liquid transport. What looks like a plateau over tens of minutes or several hours can therefore be only a quasi-steady state relative to the duration of the experiment.
For lifetime assessment, the distinction is fundamental. Drainage onset answers the question “has the collected liquid found an exit pathway?” It does not answer “has the hydraulic state of the filter stopped changing?” Treating these events as equivalent can underestimate long-term energy demand and can also obscure later changes in outlet oil.
3.2. A Stable Pressure Drop Does Not Guarantee a Stable Outlet
Pressure drop is attractive as an engineering metric because it can be monitored continuously with simple instrumentation. It is also directly linked to energy demand. However, it represents only one consequence of the evolving liquid structure. Outlet performance can change before, during or after the apparent stabilization of the pressure drop.
Wurster et al. investigated the mechanisms that generate secondary aerosol downstream of oil-mist filters [56]. Under typical filtration velocities, they ruled out simple aerodynamic blow-off as the dominant mechanism. Their data showed that steady-state entrainment depended strongly on liquid loading and drainage behavior but only weakly on filtration velocity, and that a threefold increase in oil-loading rate produced a 10–30-fold increase in the large-droplet entrainment rate. Bursting gas bubbles in the downstream liquid film were identified as the principal source of secondary droplets.
The subsequent study by Wurster et al. quantified the relationship among film state, bubbling and entrainment [31]. Along a vertically mounted wettable filter, the average drainage-film thickness increased from roughly 30 μm near the top to about 70 μm near the bottom. Bubble-formation rate increased by about an order of magnitude over the same direction, and the small-droplet entrainment rate also increased. Both bubbling and entrainment rose systematically with oil loading but were relatively insensitive to face velocity. The evidence therefore links the state of the downstream liquid film to the generation of a secondary aerosol.
The downstream aerosol also spans a wide size range. In the entrainment experiments of Wurster et al. the droplets most relevant to carryover were concentrated in two bands, approximately 1–10 μm and 150–500 μm, and the same two-band structure is retained in the more recent review of drainage and entrainment mechanisms [22,56]. Importantly, re-entrainment can begin before the measured pressure drop has fully stabilized. A filter can therefore appear “steady” when judged only by pressure drop while the outlet aerosol is still developing.
These findings argue against using a single pressure-drop plateau as the sole definition of stable filtration. They also explain why a large drained droplet or visible rear-side drainage is not necessarily evidence of good performance: drainage can coexist with the formation of a film through which gas bubbles burst and create downstream droplets.
3.3. Flow Interruption Reveals the History Dependence of the Wet State
Compressed-air systems seldom operate under perfectly constant continuous flow. Compressors load and unload, production lines stop, receivers buffer demand, and saturated filters can remain at zero or low flow for prolonged periods. When flow stops, aerodynamic shear disappears but gravity and capillary forces continue to act. The liquid arrangement immediately before shutdown is therefore not necessarily preserved.
Bredin and Mullins demonstrated that flow interruption can change subsequent filtration behavior because liquid redistributes while the gas flow is absent [57]. On restart, liquid that has moved into previously open regions can create a new resistance transient and change capture or re-entrainment. More recently, Krasiński et al. examined repeated on/off operation and showed that oil accumulation and blocking can differ substantially from continuous-flow behavior [58]. In the reported cyclic protocol, a surface-modified medium retained more favorable resistance than a comparator during repeated operation, while the comparator reached very high resistance.
The broader conclusion is that the wet state is path dependent. Its future behavior depends not only on the current flow and loading but also on how the liquid was accumulated, whether drainage had already developed, how long flow was interrupted, and how the system was restarted. Continuous-flow qualification cannot therefore be assumed to cover duty-cycled compressor installations. This dependence on history is also why Section 5 places the complete operating history, rather than the final pressure-drop value, at the head of the minimum evidence set.
Vibration can likewise modify liquid release without establishing filtration life. Fink-Metzmacher et al. found drainage times about 10–20% shorter for a specified fleece and vertical excitation; the response depended on viscosity and vibration direction [59]. The main droplet-drainage experiments omitted gas shear. The percentage therefore describes drainage time under that mechanical experiment, not a pressure-drop reduction or a service-life extension.
3.4. Operational Stability Requires More than One Plateau
The preceding evidence suggests that the question “has the pressure drop reached steady state?” is too narrow for long-term evaluation. A more useful concept is operational stability: the important filter outputs remain within defined limits over a specified period and duty cycle.
At minimum, four time-dependent quantities are relevant: pressure drop, outlet oil concentration or efficiency, drainage rate, and re-entrained liquid leaving with the gas. These quantities do not have to stabilize simultaneously: drainage can begin before pressure-drop creep ends, and entrainment can begin before the pressure drop stabilizes. Accordingly, the term quasi-steady pressure drop is preferable when only the pressure drop has reached a short-term plateau, and “operationally stable” should be reserved for tests in which resistance and outlet performance remain acceptably stable together under a defined challenge and operating history. This distinction provides the transition from wet-state mechanism to service-life evaluation: if steady operation is not defined consistently, service life cannot be compared consistently either.
A stability assessment should predefine the observation window, sampling interval and acceptable drift for each measured output. The approximately 1% change over one hour convention in [28] provides a study-specific example, not a universal acceptance limit. The appropriate window depends on loading, duty cycle, measurement uncertainty and the timescale of the process being evaluated. Outlet concentration and pressure drop need separate tolerances; a relative-change criterion may be unsuitable when an outlet value is near zero or below the quantification limit.
4. What Does “Long Service Life” Actually Mean?
4.1. The Term “Lifetime” Currently Refers to Different Experimental Quantities
Service life is widely discussed in coalescing-filter research, but it is not a single standardized quantity. At least three meanings appear repeatedly, and they are not mutually exclusive. The first is time to a quasi-steady wet state: a longer channel-development stage or a delayed transition to a final wet pressure drop is sometimes interpreted as longer life. This metric describes loading dynamics, not end of life, because a filter can continue to operate long after a plateau has been reached. The second is time to a specified resistance or loading endpoint, which is closer to conventional filter-life testing; end of life may then be defined by a maximum pressure drop, a maximum accumulated contaminant mass or a specified dust-holding capacity. The third is time to unacceptable separation performance, for example when efficiency falls below a threshold or the outlet oil concentration exceeds an application limit. In principle, the first of several failure criteria reached defines replacement.
The same unit of time can describe different evidence. Figure 3 contrasts a long wet-state observation, a source-reported comparative life improvement whose detailed endpoint is not established by the accessible record, and a short degradation record followed by fitted extrapolation. These results should retain their respective observation and source limits.
4.2. Wang 2025 Reported Comparative Service Life
Wang et al. reported a greater-than-eightfold life improvement for a dual-scale Janus design and a dust-holding capacity of 286 g·m−2 [34]. The accessible publisher-indexed summary supports these reported outcomes but does not establish the detailed loading protocol, terminal pressure or observation status of each test. The result is therefore retained as a source-reported comparison, not classified here as a verified time-to-failure event.
Figure 3b shows only the reported life ratio. Neither an absolute duration nor an acceleration factor can be reconstructed from that ratio alone. Dust-holding capacity is a separate loading metric and cannot substitute for time to a stated failure limit.
Application to compressed air would additionally require aerosol concentration and size distribution, actual face velocity, absolute pressure, liquid properties, co-contaminants, geometry, duty cycle and replacement criteria. Until those conditions and the underlying endpoint are verified, the reported ratio provides a design comparison with limited transferability.
4.3. Yang 2026 Extrapolation from a Short Degradation Record
Yang et al. used a laboratory rig maintained below atmospheric pressure by a vacuum pump and flow-control valve [35]. This is distinct from a pressure-rated compressed-air cartridge test; negative gauge pressure does not by itself reverse the pressure drop across the medium. The normal DEHS test used approximately 0.3 g·m−3 at 0.25 m·s−1. Section 2.3 of the source specifies an increase in velocity to 1.0 m·s−1 for accelerated testing, whereas Section 3.4 describes acceleration by increasing aerosol concentration without giving a corresponding value. The accelerated challenge is thus not reported consistently enough to derive a validated normal-service acceleration factor.
Both configurations were measured for 48 h after reaching a nominal steady state, without observed structural damage. Linear fits were then extrapolated to performance limits. The source reports pressure thresholds of 1.75 kPa for Filter 1A and 2.66 kPa for Filter 2B. Its plotted pressure equations yield approximately 596 and 358 h when the numerical pressure scale is reconciled with these thresholds; adding the preceding stabilization periods gives the reported totals of 599 and 360 h. The pressure-axis unit in the source figure is inconsistent with the numerical scale and the stated kPa thresholds. Figure 3c therefore displays the reported observation interval and predicted endpoints without reconstructing a pressure curve.
The efficiency criterion is described as 85% of steady-state efficiency in the methods and as an absolute efficiency of 85% in the results. Structural damage is included in the initial criteria but excluded from the reported degradation analysis. The reported totals of 599 and 360 h are extrapolated point estimates for two configurations, not an interval estimate and not observed failure times. Their difference corresponds to about 66% relative improvement, conditional on the fitted trends and thresholds. The predicted totals are about 7.5–12.5 times the 48 h measured degradation record. For each configuration, a complete prediction would need to evaluate the earliest applicable performance limit.
4.4. Kolb et al. 2017: Long Observation Is Not the Same as Lifetime Measurement
The opposite situation is provided by the long-duration wet-state experiment of Kolb et al. [30]. A test lasting 1100 h without reaching a clear asymptotic pressure drop is extremely valuable because it demonstrates that the wet state can evolve over much longer timescales than conventional loading tests imply, as panel (a) of Figure 3 illustrates. The subsequent analysis by Kolb and Kasper [55] reinforced the broader point that a nominal steady state can depend on loading history and initial saturation.
The 1100 h record establishes prolonged wet-state evolution, not a measured service life. Formal right-censoring of a time-to-failure variable would require a defined failure event and evidence that the event had not occurred by the end of observation. Because no common end-of-life criterion is established for this example, it is described here as an observation duration without a defined lifetime endpoint.
4.5. Service Life Is a Property of the Test System, Not of the Medium Alone
These examples lead to a central conclusion: a filter medium does not possess a unique intrinsic service life. Measured life is generated by the interaction of the medium and cartridge with a defined challenge, gas condition, operating history and failure criterion.
The resulting life depends on medium structure, cartridge geometry, liquid properties, inlet concentration and size distribution, actual face velocity, pressure, temperature, co-contaminants, duty cycle and the selected endpoint. Water and solids cannot be treated as simple increases in oil loading. Kamiński et al. tested polypropylene nonwovens with water, oil and soot [33]. Oil addition altered the water-associated pressure-drop maximum and subsequent resistance, while solids contributed to later growth. Their model described early loading more successfully than later spatially heterogeneous deposition. This is direct evidence that mixed aerosols change pressure-drop dynamics, but it is not a pressure-rated cartridge lifetime measurement. Wang et al. provide a separate oil–dust endpoint comparison [34]. Neither protocol establishes a universal correction for water or solids in compressed-air service.
Water deserves particular caution, because its interaction with the medium is not simply additive. Water mists interacting with hygroscopic particles and water-absorbing media have been associated with pressure-drop jumps in fibrous filters [60], so an oil-plus-water challenge cannot be treated as an increased oil loading without evidence for the specific medium and condition.
This is particularly important when transferring atmospheric oil-mist experiments to compressed-air service. Higher absolute pressure changes gas density. A standard volumetric flow corresponds to a lower actual volumetric flow at elevated pressure. Temperature changes lubricant viscosity. Real compressor systems add water, aged lubricant, particles, vibration and start–stop operation. An apparently precise laboratory lifetime therefore remains conditional on the test definition.
A meaningful comparison must therefore state the challenge, gas condition, operating history and endpoint alongside the measured or predicted life. Table 3 separates these quantities for the examples above. Observation without failure, a measured endpoint and an extrapolated endpoint remain distinct even when all are expressed in hours.
4.6. Pressure Scaling of the Controlling Groups
Pressure scaling is considered here for fixed standard volumetric flow, unchanged geometry and constant temperature. With ideal-gas behavior, actual flow is Q = QN(pN/p)(T/TN), where p is absolute pressure and N denotes stated reference conditions. Thus U ∝ 1/p and gas density ρg ∝ p at fixed temperature. Table 4 additionally assumes unchanged gas viscosity, liquid properties, droplet and fiber dimensions, characteristic length and accessible flow volume. It gives baseline scaling relationships, not predictions of capture efficiency, entrainment rate or cartridge life.
Under these assumptions, the gas Reynolds number remains unchanged because ρgU is constant. The continuum Stokes number, gas-phase capillary number, Weber number and inertial stress scale decrease as 1/p. For sufficiently small droplets, the slip-correction factor also depends on pressure, so St ∝ 1/p is only a continuum approximation. Actual capture and detachment depend on geometry and competing mechanisms, and secondary aerosol may originate from bubble bursting rather than simple aerodynamic removal. The gas residence-time scale increases as p, but this does not establish a proportional increase in liquid-redistribution or drainage times. Gravity–capillary balance is approximately unchanged only while the change in gas density is negligible relative to liquid density.
These relationships apply to the specified flow basis. At fixed actual face velocity instead, gas density changes without the compensating decrease in U, and the pressure dependencies differ. Temperature, condensation, lubricant ageing, changing wet porosity and cyclic duty introduce further effects. Transfer from an atmospheric experiment therefore requires the actual operating variables, rather than a pressure ratio alone.
The oil-input calculation must use matching concentration and flow bases: ṁoil = CNQN = CaQ, where CN and Ca denote mass per standard and actual gas volume, respectively. At fixed QN and temperature, holding CN constant leaves oil mass input unchanged and gives Ca ∝ p. Holding the numerical value of Ca constant instead gives ṁoil ∝ 1/p because Q ∝ 1/p. An area-based loading rate ṁoil/A has no volumetric-basis ambiguity when measured directly, but a rate inferred from concentration and gas flow requires the same consistent conversion.
The service condition against which a transfer has to be made is itself documented in the compressor literature. Multiphase models of oil-injected screw compressors treat the oil that leaves the compression chamber as part of the machine’s working fluid [61], and separator studies on compressor packages measure oil carryover directly rather than through a surrogate aerosol [62,63]. At the element level, the packing density of the pleat and the cartridge geometry determine how the face velocity is distributed over the medium [64], so a coupon and a cartridge made from the same medium do not experience the same local velocity even at the same nominal flow. These are the conditions to which a laboratory lifetime claim has to be transferred, and they are measurable.
4.7. Observation Status and Extrapolated Estimates
A test yields a measured event time when a defined failure limit is reached and its occurrence is observed. If the same limit is monitored but not reached before a planned stop, the observation may be right-censored with respect to that limit. A long run without a defined endpoint cannot automatically be assigned this status. An extrapolated lifetime is a model-based prediction beyond the measured record. It should be reported separately from both measured events and censored observations.
The examples in Table 3 illustrate these limits. The 1100 h record [30] is an observation duration without a defined lifetime endpoint. The greater-than-eightfold result [34] is a reported comparison whose detailed protocol is not established by the accessible record. The 599 and 360 h values [35] are extrapolated point estimates for different configurations. They are neither confidence bounds nor interval-censored failure data. An interval-censored observation instead means that failure is known to have occurred between two observation times [65].
Reliability analysis distinguishes observation status from prediction [65]. Accelerated testing additionally requires declared stress assumptions and acceptance criteria [66]. Remaining-life methods in other engineering applications use incomplete service histories or degradation signals [67,68], but their application to coalescing filters would require filter-specific endpoints and validation. The use of these concepts here does not imply that the selected studies form a statistically comparable sample.
A future survival-based synthesis would require a common or explicitly modelled failure definition, comparable operating conditions, individual replicate records and a defensible treatment of censoring. Merely assigning an event or censoring label does not make heterogeneous studies exchangeable. The present review therefore compares evidence categories without fitting a pooled survival model.
5. Evidence Required for Service-Life Evaluation
Table 5 sets out the reporting framework proposed here for a quantitative service-life claim. M denotes core information within this proposed framework; R denotes additional information needed when the corresponding mechanism forms part of the claim. These are author recommendations, not requirements of an existing certification standard. Section 5.1 to 5.4 discuss the items, and Section 5.5 considers cross-study comparability.
5.1. Define the Challenge and the First Failure
A lifetime test should declare its failure limits before loading. Possible limits include maximum pressure drop, maximum outlet oil-aerosol concentration, minimum efficiency, loss of drainage capacity or structural damage. The first applicable limit reached defines the measured endpoint. If none is reached, the reported duration is an observation without demonstrated failure; it should not be relabeled as the material lifetime. The controlling criterion matters because a low-resistance medium can exceed an outlet limit before reaching its pressure limit. The limits should be stated as numbers and their origin recorded, because a limit taken from an application requirement, such as an outlet purity class, is not interchangeable with one chosen for experimental convenience.
The accompanying challenge should identify the liquid, concentration, size distribution and generation method, with viscosity and surface tension at the test temperature when they enter the interpretation. Report water, dust or soot and their loading sequence when present. Gas conditions require absolute pressure, temperature, humidity, actual face velocity, effective filter area and geometry. Where standard volumetric flow is used, state the reference conditions and conversion. Initial wet state, shutdown duration and restart procedure are needed to distinguish continuous loading from cyclic operation [25,33,57,58].
5.2. Measure Resistance and Outlet Performance Concurrently
Pressure drop and outlet performance should be recorded over the same time interval. A final pressure value loses the channel-development, creep and restart information contained in the trajectory. A pressure plateau can also coexist with evolving secondary aerosol [30,31,55,56]. At least one time-resolved outlet metric is needed: oil-aerosol concentration or efficiency with its mass or number basis and instrument size range. Cumulative drained mass or drainage rate helps establish whether the captured liquid is being removed and whether changes in resistance correspond to retention or redistribution.
Size-resolved outlet measurements are particularly useful when bubble bursting or droplet detachment is the proposed mechanism [22,31,56]. They complement a mass-based specification rather than invalidate it. A representative total-mass measurement can account for oil carried by large droplets; lack of size resolution does not by itself mean that oil mass was missed. Sampling losses, droplet transport and the instrument size range determine whether the outlet measurement is representative. Oil aerosol and oil vapour are distinct measurement targets, and an aerosol result alone should not be presented as total-oil compliance.
Figure 4 summarizes the proposed reporting framework. The resistance, outlet and drainage observations are concurrent evidence streams, not successive stages that every filter must pass through. The framework supports comparison of research claims; it is not a new certification standard. Imaging can explain the observed response, but is not required at every time point in an engineering lifetime test.
5.3. Separate Measured Life from Accelerated Prediction
Acceleration changes more than elapsed time. Increasing concentration changes accumulation relative to drainage; increasing velocity changes drag and gas-path competition; adding solids can introduce mixed liquid–solid blocking. Temperature can change liquid viscosity and surface behavior. A useful accelerated protocol should therefore compare the morphology, pressure trajectory and controlling failure mechanism with those under a normal challenge. A lifetime ratio measured under an accelerated challenge is not automatically a normal-service ratio [33,34,35].
For extrapolation, report the measured interval, time origin, fitted equations, threshold definitions and predicted time separately, including whether pre-steady operation is counted. State replicate variability and prediction uncertainty where estimable. A close fit over 48 h does not validate linear degradation over several hundred hours. The Yang example also requires resolution of unit and protocol ambiguities before transfer [35]. Identify a reported result as a measured endpoint, an observation duration or an extrapolated estimate; add censoring status only when its failure definition and monitoring support that classification (Section 4.7).
5.4. Establish Relevance to Compressed-Air Cartridges
Within the selected evidence record, Kaiser et al. provide direct elevated-pressure separator measurements [25]. The other detailed examples primarily concern laboratory oil-mist behavior, numerical comparisons or drainage experiments. This distinction limits application claims; it is not a count of all pressure-rated research in the field. A compressor-driven aerosol generator or a nominal cartridge shape is insufficient evidence that the tested medium experienced the intended service pressure.
The relevant standards address different parts of this measurement problem. ISO 12500-1 specifies oil-aerosol filter test methods, while ISO 8573-1 defines compressed-air contaminant and purity classes [69,70]. ISO 8573-2 addresses oil-aerosol content measurement, and ISO 8573-5 addresses oil-vapour content [71,72]. These roles should not be conflated with a complete long-term replacement protocol. A research lifetime claim still requires its own operating history and end-of-life definition.
For development, the priority is to test whether a liquid-routing design retains its advantage at rated pressure under an application-relevant duty cycle. The experiment should connect a stated structural feature to changes in resistance, outlet oil and drainage, rather than merely repeat an initial efficiency comparison. Mixed contamination, coating aging and restart should be added where they represent the intended service. Mechanistic studies and calibrated models can guide that choice, but cannot substitute for the corresponding cartridge evidence. The scaling relations in Section 4.6 give the direction and the order of magnitude of the main differences between atmospheric and rated operation, and should be used to justify a transfer between them rather than to assume it.
5.5. What the Available Evidence Can and Cannot Be Synthesized into
Cross-study comparisons require more than a common unit. Volumetric saturation must use a stated void-volume basis and measurement scale; a pressure ratio must use the same reference definition; a lifetime comparison must identify the endpoint and operating history. Table 2 includes absolute quantities, relative changes and fitted estimates that cannot be converted into a common response without additional source information. Accordingly, the present synthesis compares the meaning and limits of the reported quantities rather than pooling their numerical values.
Access to replicate time series, explicit failure definitions and a clear separation of measured and predicted results would improve later synthesis. A published curve can support interpretation while remaining insufficient for uncertainty analysis or reconstruction of individual failure times. These reporting limits should be identified without treating unreported outcomes as evidence that a mechanism or failure did not occur.
6. Conclusions
Wet-state structure affects how coalescing-filter performance and lifetime claims should be interpreted. The selected studies support the following conclusions.
First, retained-liquid inventory alone does not determine hydraulic or separation behavior. Imaging reveals heterogeneous liquid structures, and within-study hybrid–Janus comparisons show substantially different reported pressure-drop ratios at broadly similar saturation [26,27]. Yet films can also improve capture in thin layers [29]. Morphology, gas-path obstruction and efficiency must therefore be interpreted together; neither minimum saturation nor maximum oil repellency is a universal design objective.
Second, drainage onset and a short pressure-drop plateau do not establish long-term stability. Pressure-drop creep, secondary aerosol and restart transients occur on different timescales [30,31,55,56,57,58]. A useful stability claim requires concurrent resistance and outlet measurements over a specified loading history, supported by drainage observations where liquid accumulation matters.
Third, reported durations and life improvements retain their source-specific meaning. The 1100 h wet-state observation [30], the reported greater-than-eightfold comparison with an incompletely established protocol [34], and the 599 versus 360 h extrapolations from 48 h of degradation data [35] do not provide interchangeable lifetime measurements. Pressure-rated separator measurements [25] offer relevant application evidence, but do not validate transfer of every laboratory lifetime claim.
Fourth, credible comparison requires explicit flow and loading bases, failure definitions and observation status. Table 4 provides pressure-scaling baselines under restricted assumptions; Table 5 proposes the information needed to interpret a service-life claim. Neither scaling nor statistical labeling replaces validation of the controlling failure mechanism at the intended pressure and duty cycle.
The most useful next step is a pressure-rated cartridge study that links an identified liquid-management strategy to time-resolved resistance, outlet aerosol, drainage and a predeclared failure limit under a relevant duty cycle. Numerical models can guide that experiment when their state variables and calibration range are explicit. This approach would test whether the favorable wet structures observed in short material studies persist under the conditions that determine replacement in service.
Supplementary Materials
The following supporting information can be downloaded at the website of this paper posted on Preprints.org. Supplementary Table S1 provides the evidence record, source locators and interpretation limits for the central comparisons.
Author Contributions
Conceptualization, Z.Q. and X.P.; methodology, Z.Q., G.T. and X.P.; investigation, Q.T., Z.W. and Y.T.; data curation, Q.T., Z.W. and Y.T.; writing–original draft preparation, Q.T. and Z.Q.; writing–review and editing, Z.Q., G.T. and X.P.; visualization, Z.W., Y.T. and X.P.; supervision, Z.Q., G.T. and X.P.; project administration, Z.Q. All authors have read and agreed to the submitted version of the manuscript.
Funding
This work was financially supported by the Key Scientific Research Project of Henan Provincial Higher Education Institutions, Construction and Low-Temperature Regeneration Application of MOFs/Glass Fiber Composite Adsorbents for Compressed Air Dehydration (No. 27B530004); Postgraduate Education Reform and Quality Improvement Project of Henan Province, An Engineering Practice-Oriented Teaching Case for the Green-Low-Carbon Transition of Core Nylon Chemical Materials under China’s Dual-Carbon Goals (No.: YJS2026AL145).
Data Availability Statement
No new experimental data were generated. The quantitative comparisons use values reported in the cited studies, with source locators and limitations recorded in Supplementary Table S1. Figure 2 replots the values reported by Xu et al. [27]; Figure 3 distinguishes reported observations and endpoint estimates from three separate studies [30,34,35]. Figure 1 and Figure 4 are conceptual diagrams. Source inconsistencies relevant to reuse of numerical results are identified in the text.
Acknowledgments
The authors thank the technical team of Chongqing Baosi Purification Equipment Technology Co., Ltd. for discussions on compressed-air purification practice.
Declaration of Generative AI and AI-Assisted Technologies in the Writing Process
During preparation of this manuscript, the authors used OpenAI ChatGPT 6.0 to assist with language editing, structural revision, evidence organization and figure preparation. These activities did not generate new experimental measurements. The authors are responsible for the selection and interpretation of sources and for the accuracy of the manuscript.
Conflicts of Interest
Q.T., Z.Q. and Z.W. are employees of Chongqing Baosi Purification Equipment Technology Co., Ltd., which develops purification equipment relevant to the subject of this review. Their contributions are stated in the Author Contributions section. The remaining authors declare no conflict of interest.
References
- Mead-Hunter, R.; King, A.J.C.; Mullins, B.J. Aerosol-mist coalescing filters – A review. Sep. Purif. Technol. 2014, 133, 484–506. [Google Scholar] [CrossRef]
- Raynor, P.C.; Leith, D. The influence of accumulated liquid on fibrous filter performance. J. Aerosol Sci. 2000, 31, 19–34. [Google Scholar] [CrossRef]
- Kampa, D.; Wurster, S.; Buzengeiger, J.; Meyer, J.; Kasper, G. Pressure drop and liquid transport through coalescence filter media used for oil mist filtration. Int. J. Multiph. Flow 2014, 58, 313–324. [Google Scholar] [CrossRef]
- Kampa, D.; Wurster, S.; Meyer, J.; Kasper, G. Validation of a new phenomenological jump-and-channel model for the wet pressure drop of oil mist filters. Chem. Eng. Sci. 2015, 122, 150–160. [Google Scholar] [CrossRef]
- Contal, P.; Simao, J.; Thomas, D.; Frising, T.; Calle, S.; Appert-Collin, J.-C.; Bemer, D. Clogging of fibre filters by submicron droplets. Phenomena and influence of operating conditions. J. Aerosol Sci. 2004, 35, 263–278. [Google Scholar] [CrossRef]
- Charvet, A.; Gonthier, Y.; Gonze, E.; Bernis, A. Experimental and modelled efficiencies during the filtration of a liquid aerosol with a fibrous medium. Chem. Eng. Sci. 2010, 65, 1875–1886. [Google Scholar] [CrossRef]
- Frising, T.; Thomas, D.; Bemer, D.; Contal, P. Clogging of fibrous filters by liquid aerosol particles: Experimental and phenomenological modelling study. Chem. Eng. Sci. 2005, 60, 2751–2762. [Google Scholar] [CrossRef]
- Harrop, J.; Stenhouse, J. The theoretical prediction of inertial impaction efficiencies in fibrous filters. Chem. Eng. Sci. 1969, 24, 1475–1481. [Google Scholar] [CrossRef]
- Zhu, C.; Lin, C.H.; Cheung, C.S. Inertial impaction-dominated fibrous filtration with rectangular or cylindrical fibers. Powder Technol. 2000, 112, 149–162. [Google Scholar] [CrossRef]
- Payatakes, A.; Gradoń, L. Dendritic deposition of aerosol particles in fibrous media by inertial impaction and interception. Chem. Eng. Sci. 1980, 35, 1083–1096. [Google Scholar] [CrossRef]
- Langdon, W.M.; Naik, P.P.; Wasan, D.T. Separation of oil dispersions from water by fibrous bed coalescence. Environ. Sci. Technol. 1972, 6, 905–910. [Google Scholar] [CrossRef]
- Rosenfeld, J.I.; Wasan, D.T. Coalescence of drops in a liquid-liquid dispersion by passage through a fibrous bed. Can. J. Chem. Eng. 1974, 52, 3–10. [Google Scholar] [CrossRef]
- Jeffreys, G.; Davies, G. Coalescence of Liquid Droplets and Liquid Dispersion. In Recent Advances in Liquid–Liquid Extraction; Elsevier: Amsterdam, The Netherlands, 1971; pp. 495–584. [Google Scholar] [CrossRef]
- Lu, H.; Yang, Q.; Liu, S.; Xie, L.S.; Wang, H.L. Effect of fibrous coalescer redispersion on W/O emulsion separation. Sep. Purif. Technol. 2016, 159, 50–56. [Google Scholar] [CrossRef]
- Luo, H.Q.; Bai, Z.S. Investigation of O/W emulsion separation and redispersion using fibrous PTFE bed coalescer. Sep. Sci. Technol. 2019, 54, 1221–1232. [Google Scholar] [CrossRef]
- Das, S. Development of a coalescence model due to turbulence for the population balance equation. Chem. Eng. Sci. 2015, 137, 22–30. [Google Scholar] [CrossRef]
- Tobin, T.; Ramkrishna, D. Coalescence of charged droplets in agitated liquid-liquid dispersions. AIChE J. 1992, 38, 1199–1205. [Google Scholar] [CrossRef]
- Petsev, D.N. Theoretical Analysis of Film Thickness Transition Dynamics and Coalescence of Charged Miniemulsion Droplets. Langmuir 2000, 16, 2093–2100. [Google Scholar] [CrossRef]
- Ma, T.; Zhao, Y.; Zhou, L.; Du, X. Dynamics of nanoscale thin liquid films during coalescence and chemical reaction of droplets. Chem. Eng. J. 2021, 422, 130071. [Google Scholar] [CrossRef]
- Zhang, Q.; Li, L.; Cao, L.; Li, Y.; Li, W. Coalescence separation of oil water emulsion on amphiphobic fluorocarbon polymer and silica nanoparticles coated fiber-bed coalescer. Chin. J. Chem. Eng. 2021, 36, 29–37. [Google Scholar] [CrossRef]
- Lu, Z.; Hu, Z.; Luo, H.; Bai, Z.; Zhang, B. Application of a combined fibrous coalescence technique in deep purification separation of composite ionic liquid alkylation reaction products. J. Clean. Prod. 2020, 261, 121290. [Google Scholar] [CrossRef]
- Mandic, R.; Meyer, J.; Dittler, A. Drainage behavior and entrainment mechanisms in oil mist separation applications – A review. Sep. Purif. Technol. 2025, 358, 130274. [Google Scholar] [CrossRef]
- Starnoni, M. Multiphase Flow and Coalescence Filtration in Fibrous Filters: A Review of Numerical and Machine Learning Approaches. Ind. Eng. Chem. Res. 2025, 64, 22515–22539. [Google Scholar] [CrossRef]
- Cui, Y.; Yang, Y.; Xiong, K.; Wang, Y.; Cao, Q.; Li, S.; Zhang, Y. Pressure drop reduction of filter media for oily aerosol: progress and prospects. Energy Build. 2026, 352, 116798. [Google Scholar] [CrossRef]
- Kaiser, S.; Gugelfuss, A.; Gyurkovich, A.; Rupp, M.; Mehring, C.; Piesche, M. Characterization of oil injected screw compressors and air/oil separators at realistic operating pressures. Aerosol Sci. Technol. 2019, 53, 1311–1321. [Google Scholar] [CrossRef]
- Straube, C.; Meyer, J.; Dittler, A. Investigation of the local oil distribution on oleophilic mist filters applying X-ray micro-computed tomography. Sep. Purif. Technol. 2023, 311, 123279. [Google Scholar] [CrossRef]
- Xu, C.; Lu, Z.; Yu, Y.; Li, L. A coalescing filter with hybrid structure of oleophilic/oleophobic media by centrifugal spinning. Sep. Purif. Technol. 2025, 359, 130512. [Google Scholar] [CrossRef]
- Mead-Hunter, R.; Braddock, R.D.; Kampa, D.; Merkel, N.; Kasper, G.; Mullins, B.J. The relationship between pressure drop and liquid saturation in oil-mist filters – Predicting filter saturation using a capillary based model. Sep. Purif. Technol. 2013, 104, 121–129. [Google Scholar] [CrossRef]
- Straube, C.; Mandic, R.; Meyer, J.; Dittler, A. Influence of deposited liquid structures on the separation efficiency of thin oleophilic fiber layers of mist filters. Sep. Purif. Technol. 2024, 334, 125977. [Google Scholar] [CrossRef]
- Kolb, H.E.; Meyer, J.; Kasper, G. Flow velocity dependence of the pressure drop of oil mist filters. Chem. Eng. Sci. 2017, 166, 107–114. [Google Scholar] [CrossRef]
- Wurster, S.; Meyer, J.; Kasper, G. On the relationship of drop entrainment with bubble formation rates in oil mist filters. Sep. Purif. Technol. 2017, 179, 542–549. [Google Scholar] [CrossRef]
- Chang, C.; Lyu, Q.; Ding, Y.; Ji, Z. Investigation of oil mist filtration performance of surface modified coalescence filters with asymmetric wettability. Sep. Purif. Technol. 2024, 331, 125465. [Google Scholar] [CrossRef]
- Kamiński, M.; Gac, J.M.; Sobiech, P.; Kozikowski, P.; Jankowski, T. Pressure Drop Dynamics during Filtration of Mixture Aerosol Containing Water, Oil, and Soot Particles on Nonwoven Filters. Polymers 2023, 15, 1787. [Google Scholar] [CrossRef] [PubMed]
- Wang, D.; Zhou, Z.; You, T.; Liu, B.; Xie, Q.; Wang, L.; Xu, G.; Liang, Y.; Tang, M. A dual-scale Janus filter for enhanced oil-aerosol filtration performance via oil-guiding transmission. Sep. Purif. Technol. 2025, 366, 132672. [Google Scholar] [CrossRef]
- Yang, Z.; Li, J.; Ma, S.; Wang, Z. Gas-Liquid Coalescing Filter with Wettability-Modified Gradient Pore Structure: Achieving Low Resistance, High Efficiency and Long Service Life. Separations 2026, 13, 32. [Google Scholar] [CrossRef]
- Sindhu, H.; Sai, P. A model for pressure drop and liquid saturation in gas–liquid cocurrent upflow through packed beds. Chem. Eng. J. 2003, 93, 135–142. [Google Scholar] [CrossRef]
- Bao, B.; He, W.; Zhao, H.; Xu, B.; Lin, Z. Modeling Penetration through Fibrous Filter during Dynamic Filtration. Aerosol Air Qual. Res. 2015, 15, 648–656. [Google Scholar] [CrossRef]
- Palakurthi, N.K.; Konangi, S.; Ghia, U.; Comer, K. Micro-scale simulation of unidirectional capillary transport of wetting liquid through 3D fibrous porous media: Estimation of effective pore radii. Int. J. Multiph. Flow 2015, 77, 48–57. [Google Scholar] [CrossRef]
- Zhu, X.; Feng, S.; Low, Z.-X.; Zhao, X.; Zhong, J.; Zhong, Z.; Xing, W. Nanoscale capture and evolution behaviors of oily aerosols by different wettability membranes. J. Membr. Sci. 2024, 695, 122518. [Google Scholar] [CrossRef]
- Wei, X.; Chen, F.; Wang, H.; Zhou, H.; Ji, Z.; Lin, T. Efficient removal of aerosol oil-mists using superoleophobic filters. J. Mater. Chem. A 2018, 6, 871–877. [Google Scholar] [CrossRef]
- Wei, X.; Zhou, H.; Chen, F.; Wang, H.; Ji, Z.; Lin, T. High-efficiency low-resistance oil-mist coalescence filtration using fibrous filters with thickness-direction asymmetric wettability. Adv. Funct. Mater. 2019, 29, 1806302. [Google Scholar] [CrossRef]
- Penner, T.; Meyer, J.; Dittler, A. Oleophilic and oleophobic media combinations – Influence on oil mist filter operating performance. Sep. Purif. Technol. 2021, 261, 118255. [Google Scholar] [CrossRef]
- Penner, T.; Meyer, J.; Dittler, A. Relevance of downstream support structure design for oleophilic and oleophobic oil mist filter operating performance. Sep. Purif. Technol. 2020, 248, 117074. [Google Scholar] [CrossRef]
- Straube, C.; Yang, G.; Voll, D.; Meyer, J.; Theato, P.; Dittler, A. Influence of 3D printed downstream support structures on pressure drop and entrainment of oleophilic and oleophobic oil mist filters. Sep. Purif. Technol. 2022, 290, 120802. [Google Scholar] [CrossRef]
- Xu, C.; Wang, Y.; Yu, Y.; Li, L. Coalescence performance of Janus filter for the removal of oil mist. Chem. Eng. Res. Des. 2024, 212, 185–190. [Google Scholar] [CrossRef]
- Ding, Y.; Chang, C.; Ning, J.; Ji, Z.; Wu, X. Preparation of superoleophobic coalescence filter materials based on a two-step process and oil mist filtration performance optimization. Sep. Purif. Technol. 2025, 362, 131811. [Google Scholar] [CrossRef]
- Chen, F.; Lu, W.; Wang, Q.; Xin, H.; Ji, Z. Modification Strategy for High-Performance Coalescing Filters with a Patterned Surface and Its Application to Cartridges. Ind. Eng. Chem. Res. 2024, 63, 4557–4570. [Google Scholar] [CrossRef]
- Chen, F.; Ji, Z.; Qi, Q. Effect of surface wettability on filtration performance of gas-liquid coalescing filters. Powder Technol. 2019, 357, 377–386. [Google Scholar] [CrossRef]
- Azarafza, A.; King, A.; Mead-Hunter, R.; Schuler, J.; Abishek, S.; Mullins, B. The influence of layer separation on multilayer mist coalescing filter performance. Sep. Purif. Technol. 2021, 273, 118752. [Google Scholar] [CrossRef]
- Starnoni, M.; Manes, C. A multiphase multicomponent flow and transport model for liquid aerosol filtration in coalescing fibrous filters. Sep. Purif. Technol. 2021, 266, 118574. [Google Scholar] [CrossRef]
- Starnoni, M. Modeling oil–mist filtration through coalescence filter media in the presence of gravity-induced flows. J. Aerosol Sci. 2023, 169, 106129. [Google Scholar] [CrossRef]
- Wang, H.; Zhao, H.; Guo, Z.; Zheng, C. Numerical simulation of particle capture process of fibrous filters using Lattice Boltzmann two-phase flow model. Powder Technol. 2012, 227, 111–122. [Google Scholar] [CrossRef]
- Kohanpur, A.H.; Valocchi, A.J. Pore-Network Stitching Method: A Pore-to-Core Upscaling Approach for Multiphase Flow. Transp. Porous Media 2020, 135, 659–685. [Google Scholar] [CrossRef]
- Hoch, D.; Weber, A.; Niessner, J. Modeling and Simulation of Coalescence in the Context of Oil Mist Filtration. Transp. Porous Media 2023, 148, 47–66. [Google Scholar] [CrossRef]
- Kolb, H.E.; Kasper, G. Mist filters: How steady is their steady state? Chem. Eng. Sci. 2019, 204, 118–127. [Google Scholar] [CrossRef]
- Wurster, S.; Meyer, J.; Kolb, H.E.; Kasper, G. Bubbling vs. blow-off – On the relevant mechanism(s) of drop entrainment from oil mist filter media. Sep. Purif. Technol. 2015, 152, 70–79. [Google Scholar] [CrossRef]
- Bredin, A.; Mullins, B.J. Influence of flow-interruption on filter performance during the filtration of liquid aerosols by fibrous filters. Sep. Purif. Technol. 2012, 90, 53–63. [Google Scholar] [CrossRef]
- Krasiński, A.; Kamocki, S.; Stor, M. Blocking of gas-liquid coalescing filters with accumulated oil during the on-off operation of a filtration system. Appl. Sci. 2024, 14, 9006. [Google Scholar] [CrossRef]
- Fink-Metzmacher, A.; Schoeneich, N.; Schultz, J.; Ettel, M.; Burgmann, S.; Janoske, U. Vibration-induced droplet drainage on filter fleeces for compressed air filtration. Phys. Fluids 2025, 37, 087213. [Google Scholar] [CrossRef]
- Zhang, S.; Zhang, W.; Zhou, X.; Lin, Z. Interaction of water mists with bibulous filter media and hygroscopic particles in pressure drop jump of fibrous filter media. Chem. Eng. Sci. 2024, 285, 119544. [Google Scholar] [CrossRef]
- Basha, N.; Kovacevic, A.; Rane, S. Analysis of Oil-Injected Twin-Screw Compressor with Multiphase Flow Models. Designs 2019, 3, 54. [Google Scholar] [CrossRef]
- Xu, J.; Hrnjak, P. Coalescing oil separator for compressors. Int. J. Refrig. 2019, 106, 41–53. [Google Scholar] [CrossRef]
- Lee, H.; Lee, Y.; Kim, Y.J.; Han, B.; Kim, H.J. Oil-Removal Performance of Rotating-Disk-Type Oil Separator. Energies 2022, 15, 6515. [Google Scholar] [CrossRef]
- Persaud, D.; Smirnov, M.; Fong, D.; Sanaei, P. Modeling of the Effects of Pleat Packing Density and Cartridge Geometry on the Performance of Pleated Membrane Filters. Fluids 2021, 6, 209. [Google Scholar] [CrossRef]
- Sedgwick, P. Kaplan-Meier survival analysis: types of censored observations. BMJ 2013, 347, f4663. [Google Scholar] [CrossRef]
- Krasich, M. Accelerated Testing for Demonstration of Product Lifetime Reliability. In Proceedings of the Annual Reliability and Maintainability Symposium (RAMS), Tampa, FL, USA, 2003; pp. 117–123. [Google Scholar] [CrossRef]
- van Schijndel, A.; Wetzer, J.; Wouters, P. Remaining Lifetime Modelling for Replacement of Power Transformer Populations. In Proceedings of the 2008 International Conference on Condition Monitoring and Diagnosis, Beijing, China, 2008; pp. 597–600. [Google Scholar] [CrossRef]
- Son, J.; Zhou, S.; Sankavaram, C.; Du, X.; Zhang, Y. Remaining useful life prediction based on noisy condition monitoring signals using constrained Kalman filter. Reliab. Eng. Syst. Saf. 2016, 152, 38–50. [Google Scholar] [CrossRef]
- International Organization for Standardization. ISO 12500-1:2007; Filters for compressed air — Test methods — Part 1: Oil aerosols. ISO: Geneva, Switzerland, 2007. Available online: https://www.iso.org/standard/41150.html.
- International Organization for Standardization. ISO 8573-1:2010; Compressed air — Part 1: Contaminants and purity classes. ISO: Geneva, Switzerland, 2010. Available online: https://www.iso.org/standard/46418.html.
- International Organization for Standardization. ISO 8573-2:2018; Compressed air — Contaminant measurement — Part 2: Oil aerosol content. ISO: Geneva, Switzerland, 2018. Available online: https://www.iso.org/standard/66999.html.
- International Organization for Standardization. ISO 8573-5:2025; Compressed air — Contaminant measurement — Part 5: Oil vapour content. ISO: Geneva, Switzerland, 2025. Available online: https://www.iso.org/standard/86791.html.
Figure 1.
Representative liquid states and their relevance to coalescing-filter performance. Panels show attached droplets, inter-fiber structures, a connected liquid pathway, an interfacial film, and downstream drainage with bubbling. The drawings are conceptual and not to scale. States can coexist; their positions do not define a universal time sequence. Panel (f) identifies the responses that must be assessed together [3,4,22,26,29].
Figure 1.
Representative liquid states and their relevance to coalescing-filter performance. Panels show attached droplets, inter-fiber structures, a connected liquid pathway, an interfacial film, and downstream drainage with bubbling. The drawings are conceptual and not to scale. States can coexist; their positions do not define a universal time sequence. Panel (f) identifies the responses that must be assessed together [3,4,22,26,29].
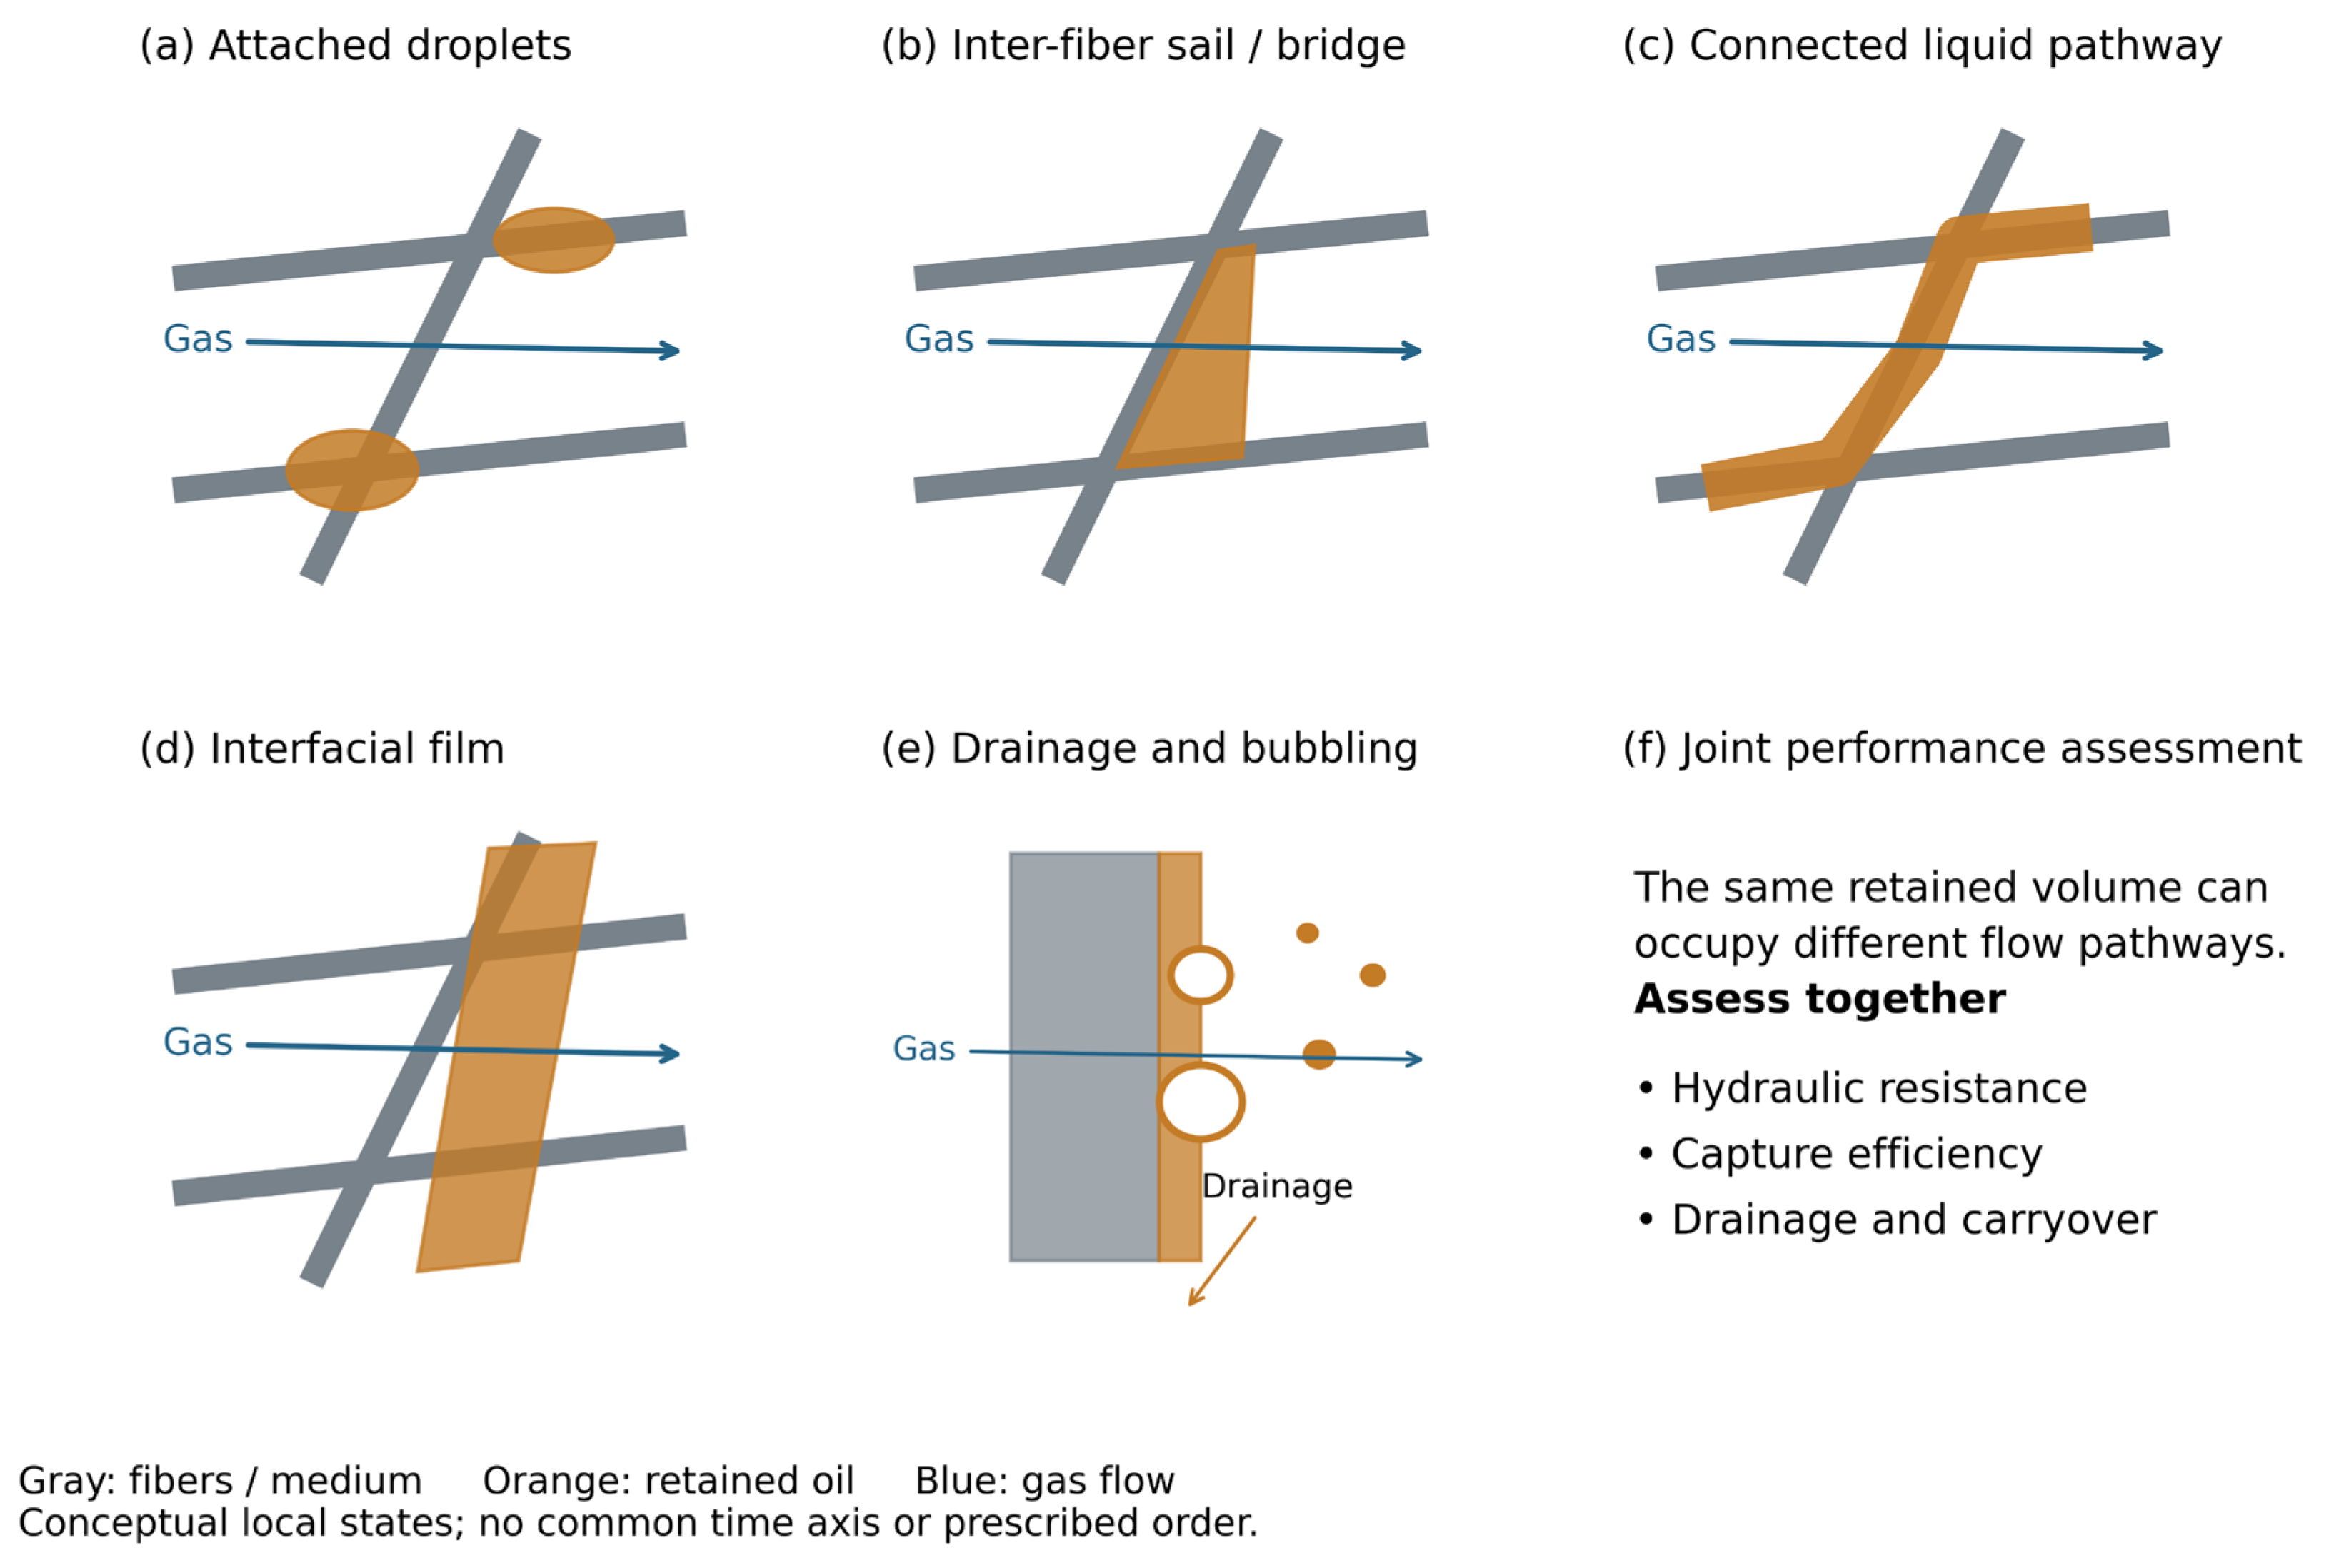
Figure 2.
Whole-filter saturation and source-reported pressure-drop ratio for Hybrid, Janus-F, Janus-R and a commercial comparator. Redrawn by the authors from the data reported in Xu et al. [27] (source Figure 7b–c and 8c); no original figure image from the source paper was reused. Values were read from the plotted points; source error bars were not digitized, and no uncertainty is shown, so the figure should be read as a within-study comparison rather than as a quantitative estimate. The comparator is identified in the source as H13; because H13 also denotes an efficiency class in EN 1822, the label should not be read as an independent efficiency specification, and the comparator is included as context only. The original ratio axis is labeled ΔPs/ΔP0; ratios are retained as reported, subject to the textual inconsistency discussed in Section 2.3. No cross-study normalization or significance comparison is implied.
Figure 2.
Whole-filter saturation and source-reported pressure-drop ratio for Hybrid, Janus-F, Janus-R and a commercial comparator. Redrawn by the authors from the data reported in Xu et al. [27] (source Figure 7b–c and 8c); no original figure image from the source paper was reused. Values were read from the plotted points; source error bars were not digitized, and no uncertainty is shown, so the figure should be read as a within-study comparison rather than as a quantitative estimate. The comparator is identified in the source as H13; because H13 also denotes an efficiency class in EN 1822, the label should not be read as an independent efficiency specification, and the comparator is included as context only. The original ratio axis is labeled ΔPs/ΔP0; ratios are retained as reported, subject to the textual inconsistency discussed in Section 2.3. No cross-study normalization or significance comparison is implied.
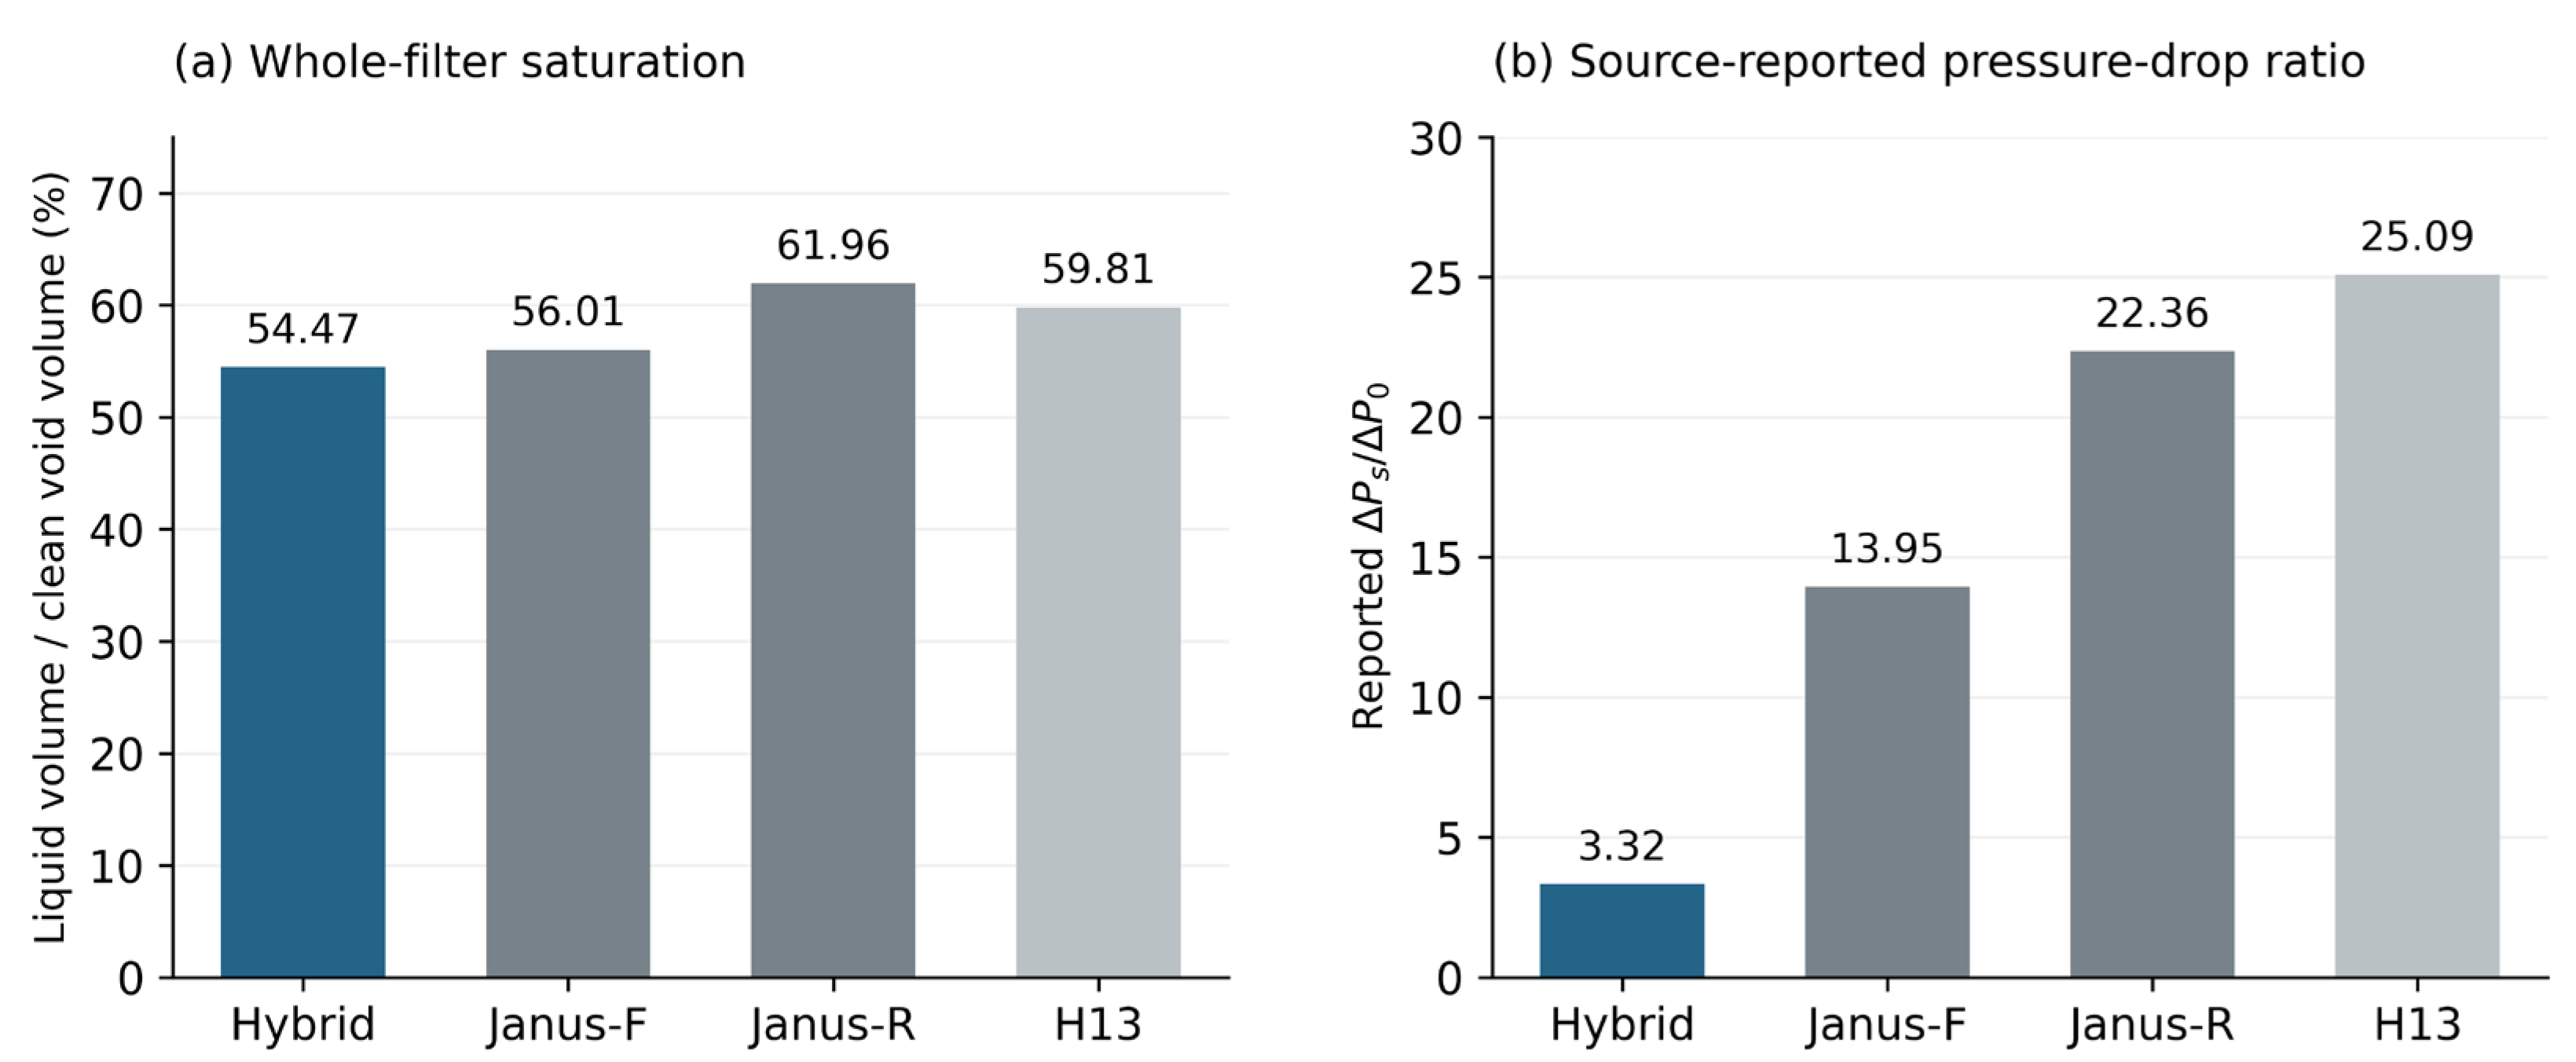
Figure 3.
Different forms of evidence used in service-life discussions. Schematic redrawn by the authors based on the reported values in Refs. [30,34,35]; no original figure image from the cited papers was reused. (a) Kolb et al. observed pressure-drop creep during 1100 h without a defined end-of-life endpoint [30]. (b) Wang et al. reported a life improvement exceeding eightfold relative to commercial filters [34]. The bar at eight indicates the reported lower-bound ratio, not an exact life measurement; the detailed challenge and endpoint are not established by the accessible source record. (c) Yang et al. measured 48 h after stabilization and reported extrapolated total operating times of 599 and 360 h [35]. Short initial gray segments indicate approximately 3 and 2 h preceding the fitted time origin; solid segments show measurement and dashed segments show extrapolation. These are duration diagrams, not reconstructed pressure curves. The panels have different scales and cannot be ranked as intrinsic lifetimes.
Figure 3.
Different forms of evidence used in service-life discussions. Schematic redrawn by the authors based on the reported values in Refs. [30,34,35]; no original figure image from the cited papers was reused. (a) Kolb et al. observed pressure-drop creep during 1100 h without a defined end-of-life endpoint [30]. (b) Wang et al. reported a life improvement exceeding eightfold relative to commercial filters [34]. The bar at eight indicates the reported lower-bound ratio, not an exact life measurement; the detailed challenge and endpoint are not established by the accessible source record. (c) Yang et al. measured 48 h after stabilization and reported extrapolated total operating times of 599 and 360 h [35]. Short initial gray segments indicate approximately 3 and 2 h preceding the fitted time origin; solid segments show measurement and dashed segments show extrapolation. These are duration diagrams, not reconstructed pressure curves. The panels have different scales and cannot be ranked as intrinsic lifetimes.
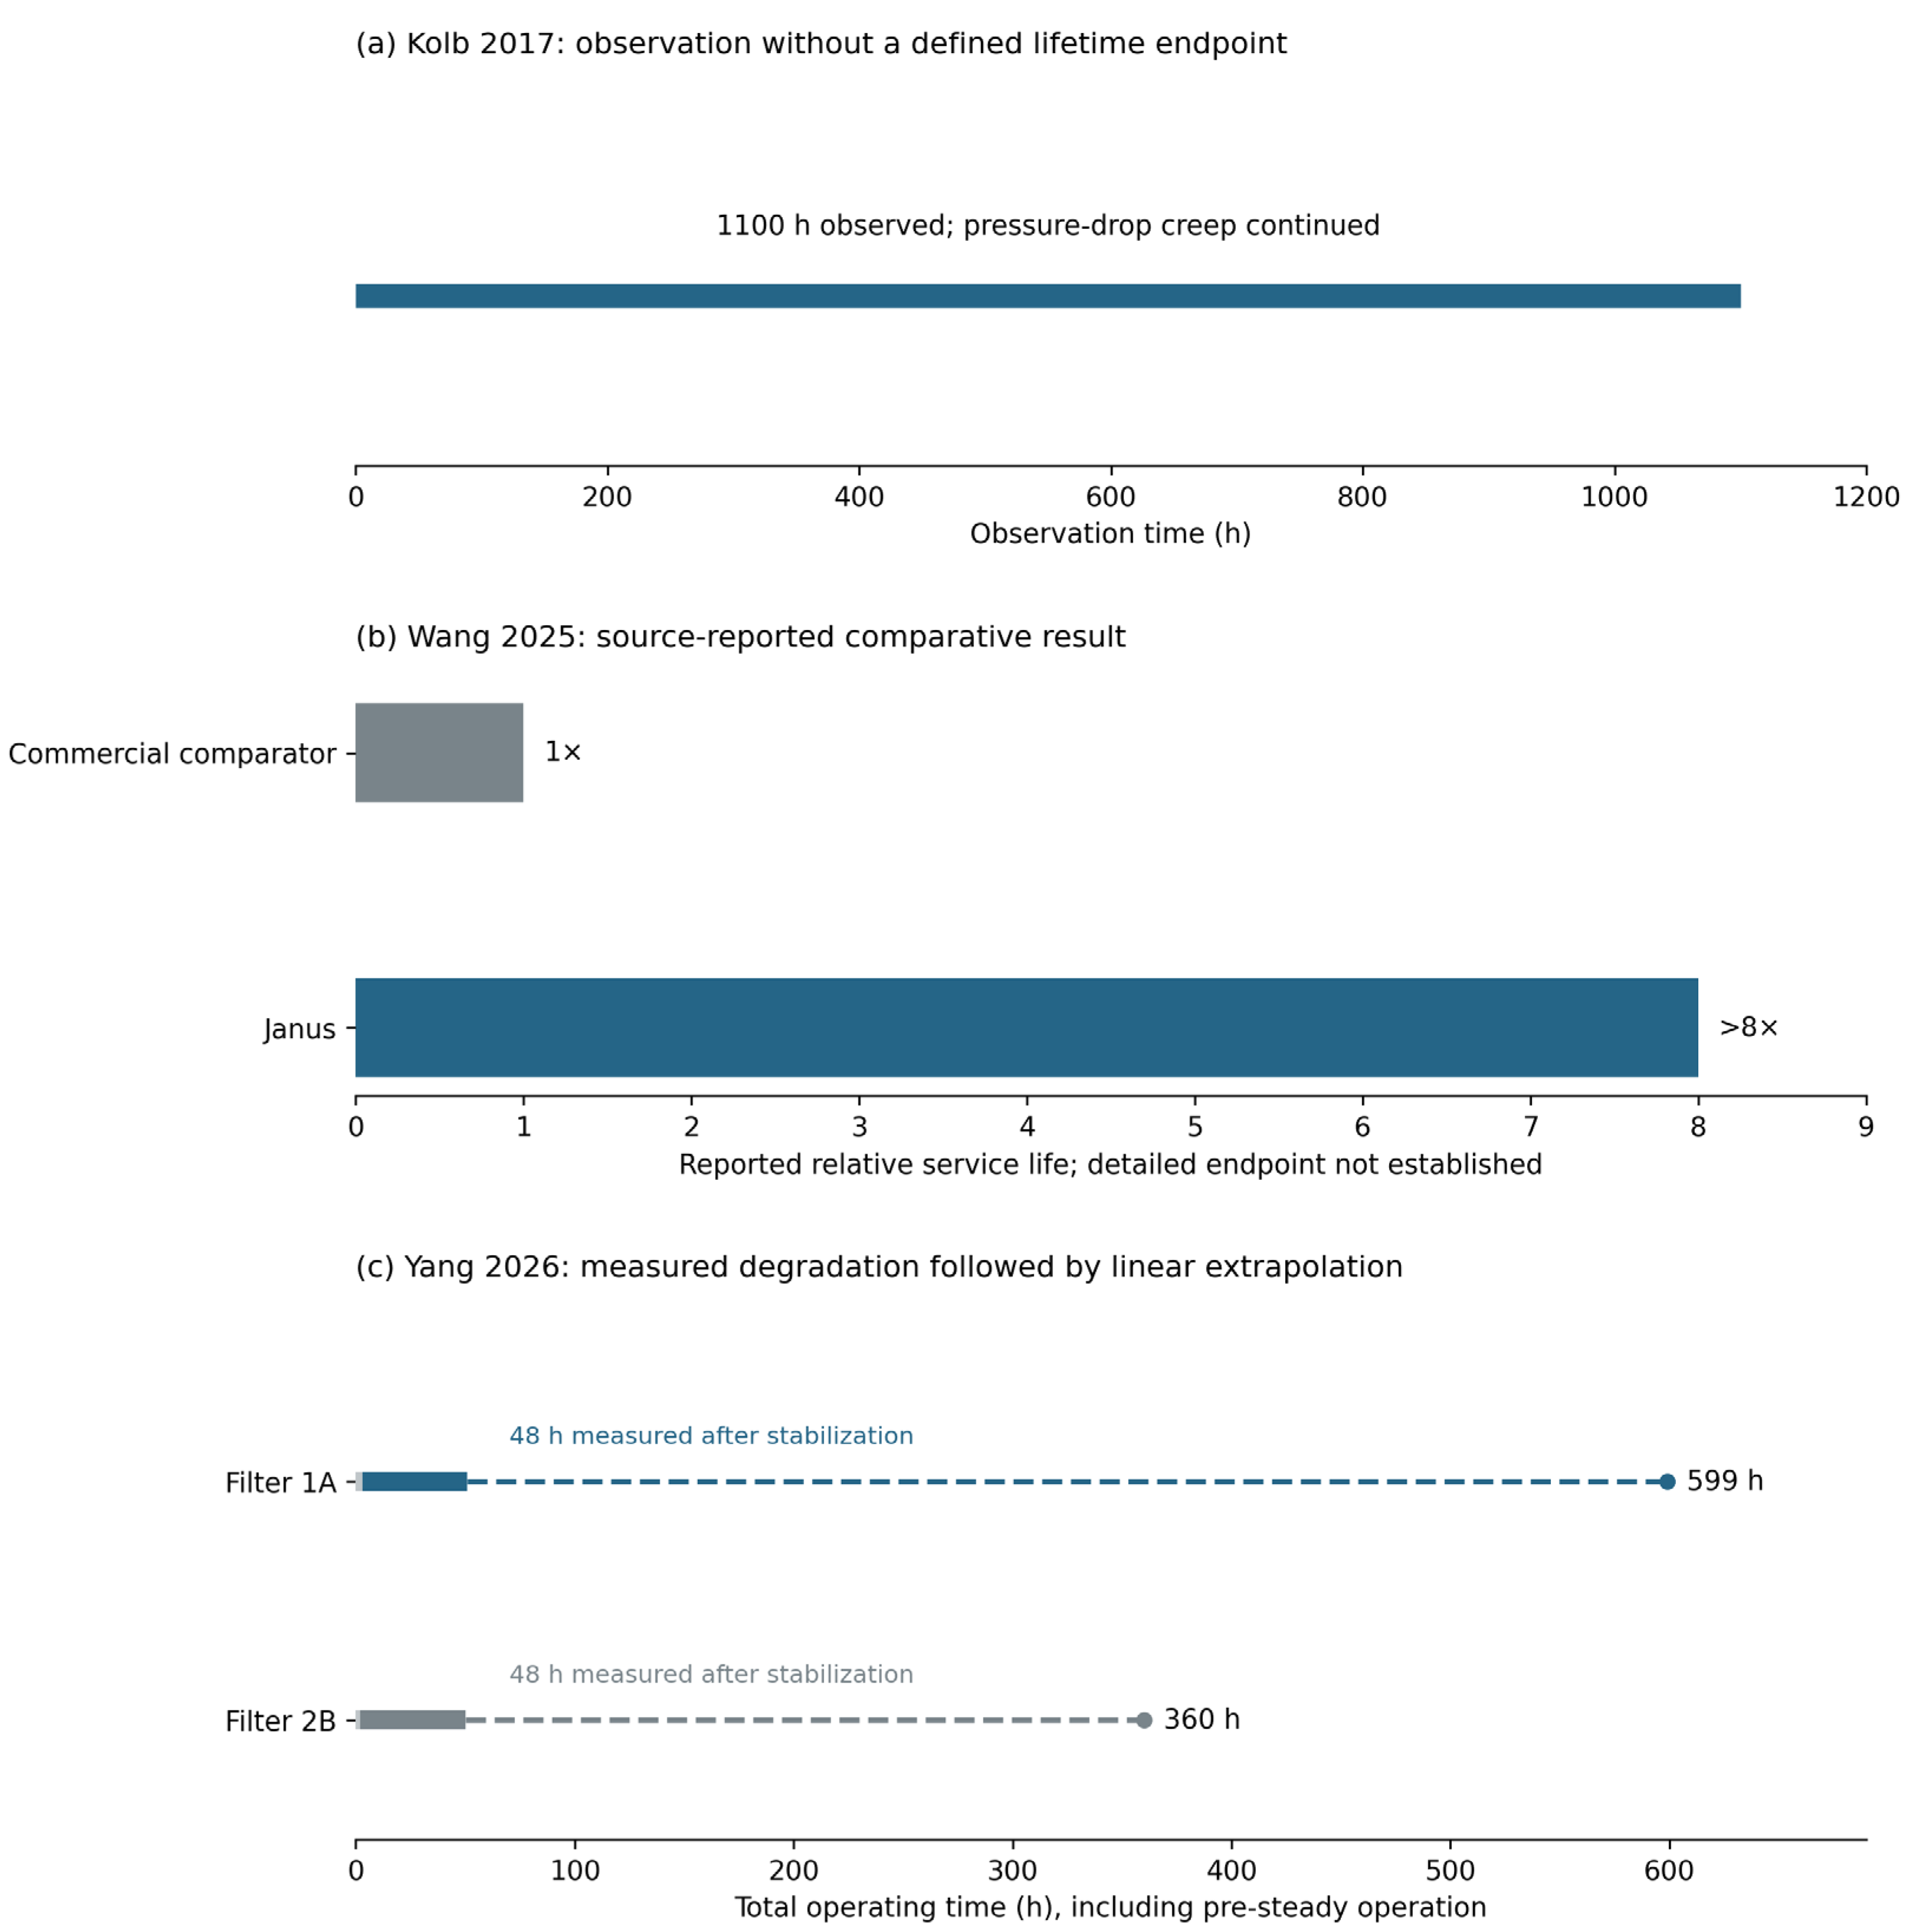
Figure 4.
Proposed reporting framework. Define the challenge and applicable failure limits before testing; record resistance, outlet performance and liquid removal over matched intervals. Distinguish a measured endpoint from an observation stopped before a defined limit, a duration without a lifetime endpoint, and an extrapolated estimate. Formal censoring status requires an explicit failure definition. The framework is an author recommendation, not a certification procedure.
Figure 4.
Proposed reporting framework. Define the challenge and applicable failure limits before testing; record resistance, outlet performance and liquid removal over matched intervals. Distinguish a measured endpoint from an observation stopped before a defined limit, a duration without a lifetime endpoint, and an extrapolated estimate. Formal censoring status requires an explicit failure definition. The framework is an author recommendation, not a certification procedure.
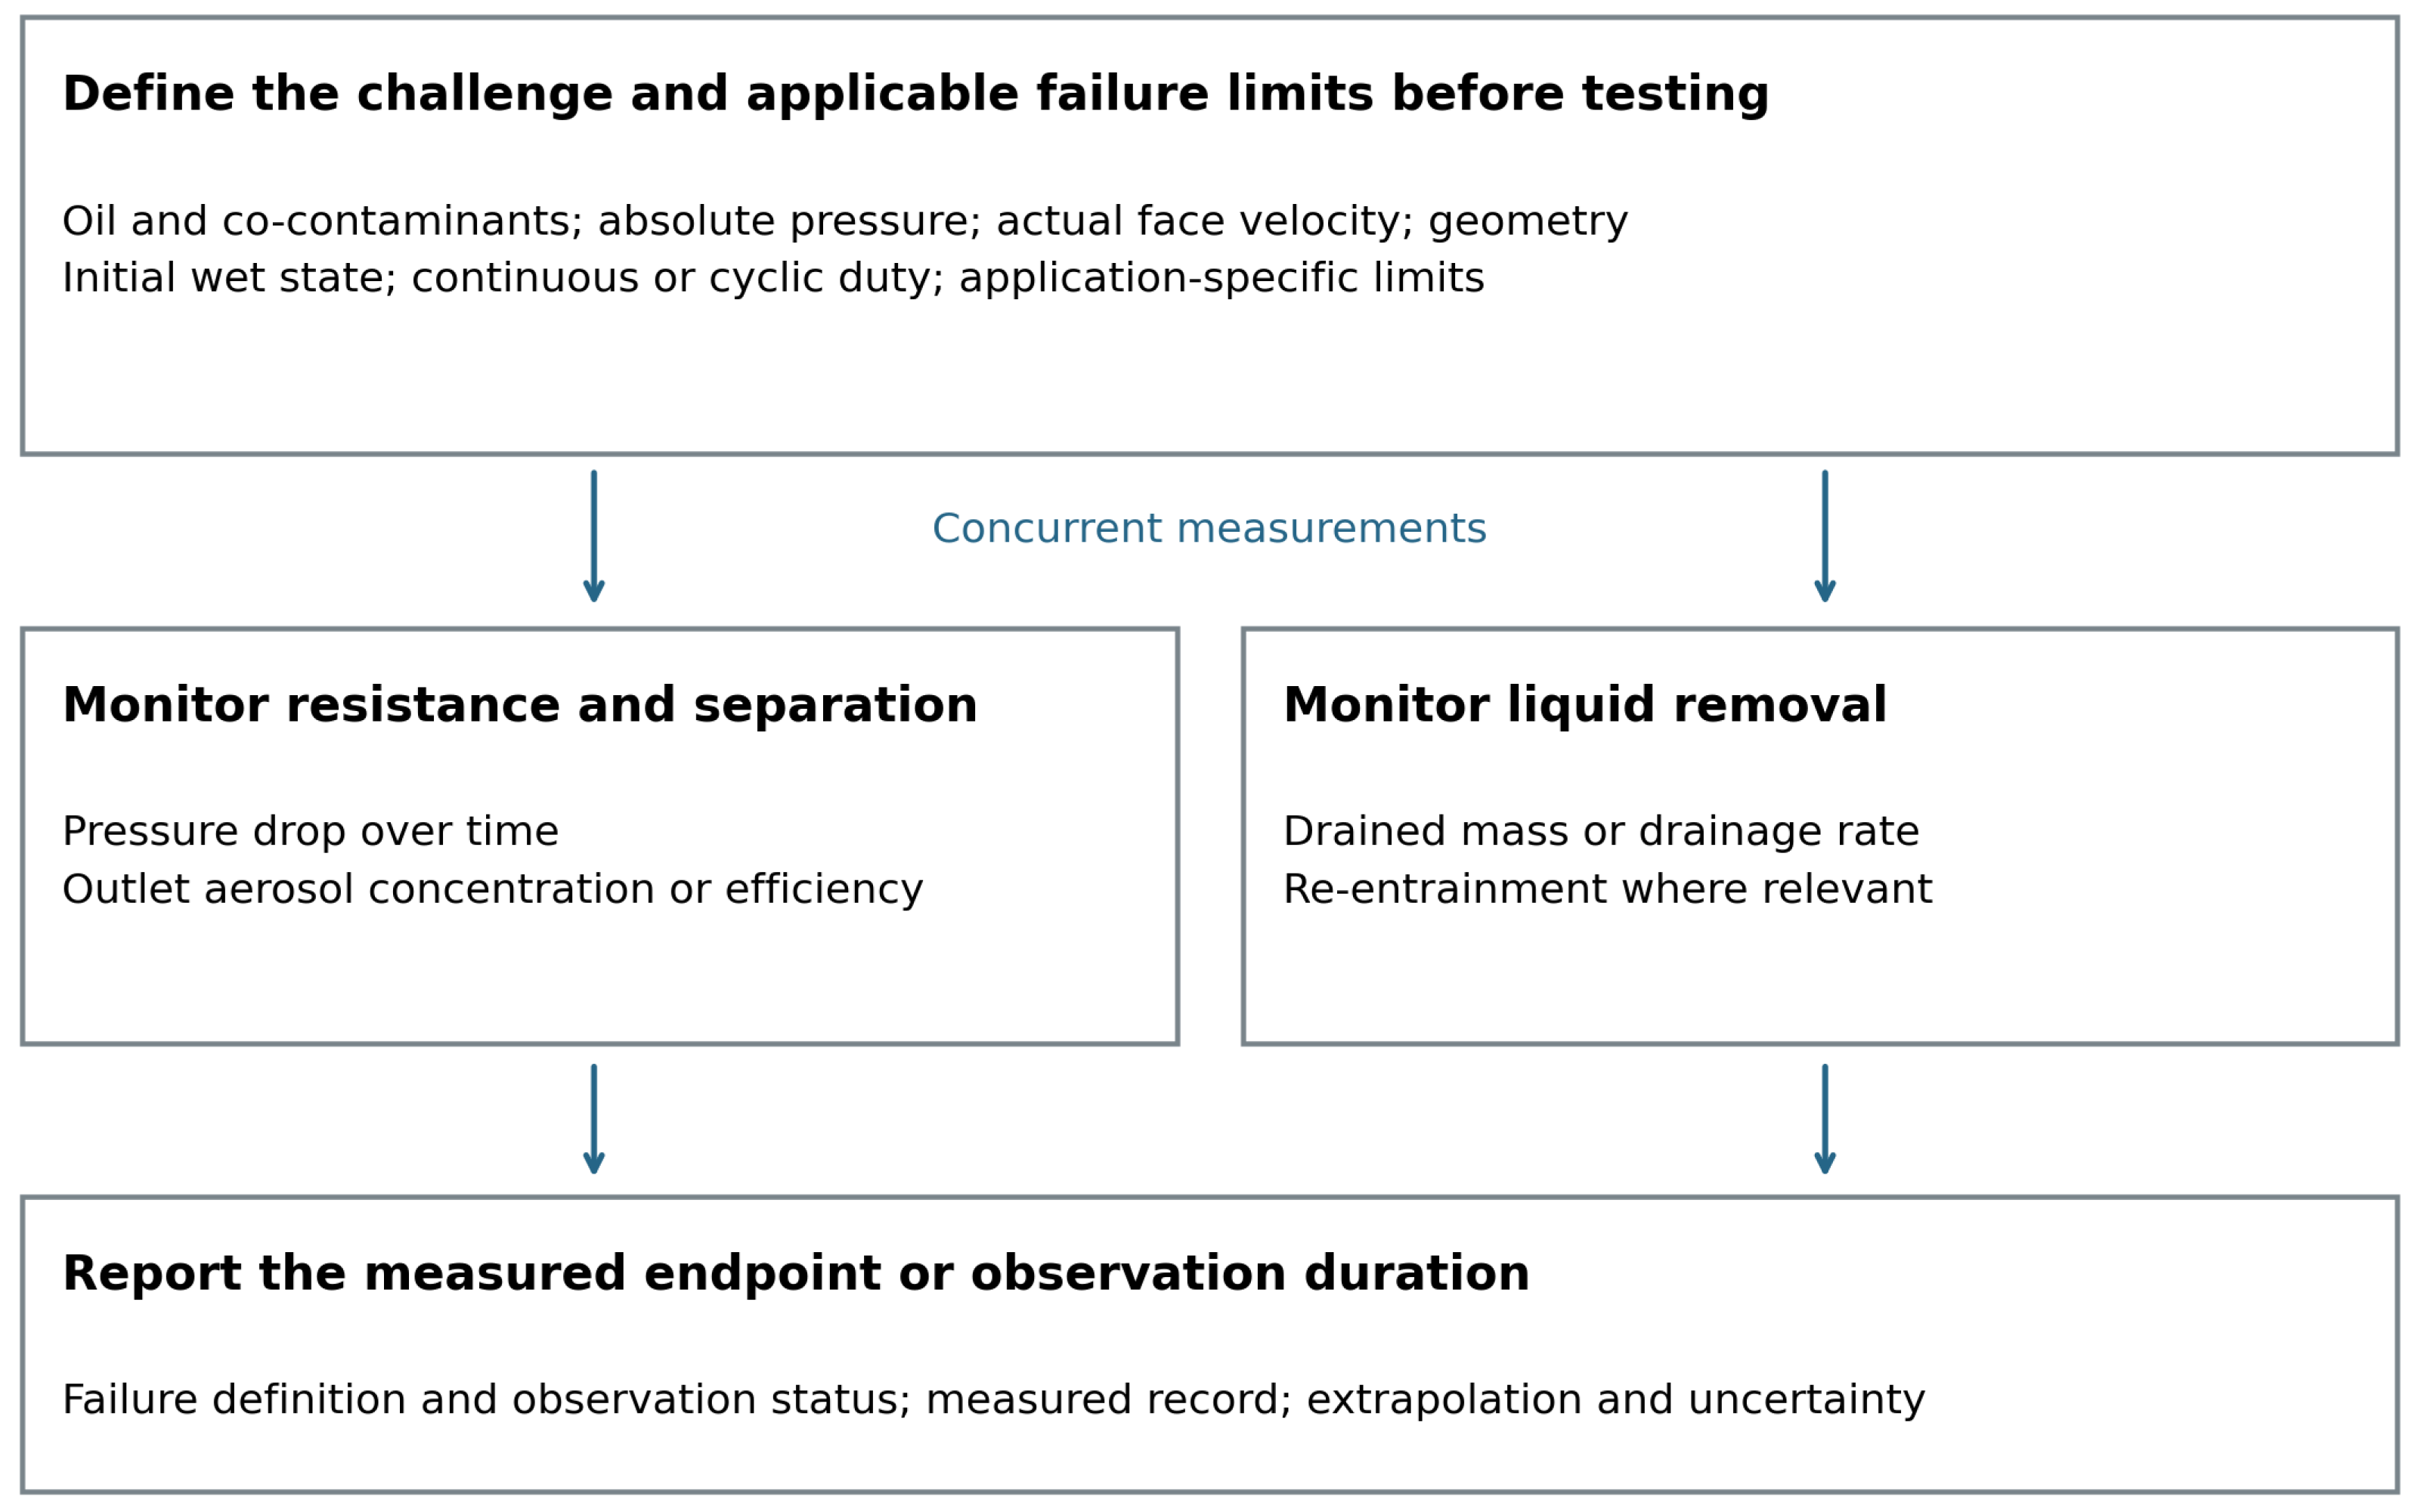

Table 1.
Scope of related reviews and the present synthesis. Descriptions indicate scope, not a quality ranking.
Table 1.
Scope of related reviews and the present synthesis. Descriptions indicate scope, not a quality ranking.
| Review | Primary scope | Relation to the present question |
| Mead-Hunter et al. 2014 [1] | Aerosol-mist coalescence mechanisms and media | Foundational filtration and wet-state context |
| Mandic et al. 2025 [22] | Drainage, entrainment and downstream structures | Mechanisms connecting liquid release to outlet behavior |
| Starnoni 2025 [23] | Numerical and machine-learning approaches | Representation and prediction of the wet state |
| Cui et al. 2026 [24] | Pressure-drop reduction and structural strategies | Material and design approaches to lower resistance |
| Present review | Comparability of wet-state and service-life evidence | Distinguishes measured endpoints, observations and predictions |
Table 2.
Selected quantitative evidence linking liquid organization and wet-state performance. Values are specific to the stated study and should not be pooled. S denotes volumetric saturation; DHC denotes dust-holding capacity.
Table 2.
Selected quantitative evidence linking liquid organization and wet-state performance. Values are specific to the stated study and should not be pooled. S denotes volumetric saturation; DHC denotes dust-holding capacity.
| Study | Conditions / scale | Liquid quantity or observation | Reported response | Interpretation limit |
| Mead-Hunter 2013 [28] | Oleophilic media; velocity and layer-number variation | S = retained oil volume / void volume; gravimetric basis | Capillary model with empirical correction described saturation data | Calibrated relation; pre-saturation and stability convention matter |
| Kampa 2014/2015 [3,4] | Glass microfiber; controlled oil loading | Preferential liquid paths and interfacial films | Channel and capillary-jump pressure contributions | Mechanistic pressure model; no lifetime endpoint |
| Straube 2023 [26] | 72 mg·m−3; 25 cm·s−1; thin layer; X-ray imaging | Local volumetric S: 5.7–39.4%; >80% oil volume in sails | Heterogeneous retention within a specimen | Local imaging does not measure gas-flow distribution |
| Straube 2024 [29] | Thin oleophilic layers; 10, 25, 40 cm·s−1 | Controlled saturation; backlit film imaging | Number efficiency fell up to S ≈ 0.4, then rose at S = 0.6–0.8 | Films improve capture but raise resistance; thresholds are specific |
| Kolb 2017 [30] | Highest condition: 70 cm·s−1; 125 mg·m−2·s−1 | Saturation and wet resistance depend on velocity | Pressure-drop creep during 1100 h | Observation duration; no formal failure endpoint |
| Wurster 2017 [31] | Compressor oil; vertical wettable medium | Rear-film thickness about 30–70 μm | Bubbling about 500–5000 cm−2·s−1 | Film and secondary-aerosol behavior; not a lifetime law |
| Chang 2024 [32] | Surface-modified glass-fiber media; source-reported ranges | Saturation reductions relative to a control: 39–60% | Wet pressure reductions: about 27–35% | Summary-level ranges; configuration pairings not established |
| Xu 2025 [27] | Hybrid, Janus-F and Janus-R; one laboratory study | Integral S: 54.47%, 56.01%, 61.96% | Reported ΔPs/ΔP0: 3.32, 13.95, 22.36 | Original plotted ratios retained; transient text does not directly reconcile |
| Kamiński 2023 [33] | Polypropylene nonwovens; water, oil and soot | Mixture-dependent accumulation and deposition | Liquid mixture changed the pressure maximum; solids affected later growth | Mixed-aerosol dynamics, not pressure-rated life |
| Wang 2025 [34] | Dual-scale Janus design; separate reported performance categories | Reported DHC 286 g·m−2; not a saturation measure | Reported pressure reduction about 30%; life improvement >8× | Publisher-indexed summary; detailed challenge and endpoint not established |
| Yang 2026 [35] | Normal DEHS test and separate accelerated test | Whole-filter wet state; 48 h degradation record | Normal pressure −34.2%; predicted total life 599 vs 360 h | Extrapolation; acceleration, efficiency criterion and axis units have ambiguities |
Table 3.
Observation duration, source-reported comparison and extrapolated life in selected studies. Evidence categories refer to what is established by the cited source record; they do not constitute a pooled lifetime dataset. A verified measured endpoint is distinguished from a reported relative improvement and a model-based estimate (Section 4.7).
Table 3.
Observation duration, source-reported comparison and extrapolated life in selected studies. Evidence categories refer to what is established by the cited source record; they do not constitute a pooled lifetime dataset. A verified measured endpoint is distinguished from a reported relative improvement and a model-based estimate (Section 4.7).
| Study | Measured record and challenge | Endpoint | Data type | Reported result | Permissible interpretation |
| Kolb 2017 [30] | 1100 h at the highest oil-loading / velocity condition | No specified failure; pressure continued to evolve | Observation duration; no defined lifetime endpoint | 1100 h observation | Long wet-state evolution; not demonstrated life above 1100 h |
| Bredin 2012 [57] | Liquid aerosol; interrupted flow | Post-interruption performance | Not a lifetime datum | History-dependent response | Interruption evidence, not a universal life multiplier |
| Krasiński 2024 [58] | Oil loading with repeated on/off operation | Resistance and blocking behavior | Not a lifetime datum | Modified medium retained favorable cyclic behavior | A duty-cycle comparison without a common lifetime value |
| Wang 2025 [34] | Publisher-indexed summary; full challenge protocol not established | Detailed endpoint not established by accessible record | Source-reported comparative result | >8× one commercial comparator; DHC 286 g·m−2 | Reported ratio; not a verified event-time dataset |
| Yang 2026 [35] | 48 h after stabilization; methods specify 1.0 m·s−1 | Pressure limits 1.75 / 2.66 kPa; efficiency criterion ambiguous | Extrapolated point estimates; no observed endpoint failure | 599 / 360 h total predicted life, including pre-steady time | Pressure-fit extrapolation; about 66% predicted improvement, not observed failure |
Table 4.
Baseline pressure scaling at fixed standard volumetric flow and constant temperature under the assumptions in Section 4.6. The last column is the ratio of each quantity to its value at p0, evaluated at p = 10p0 (for example, 10 versus 1 bar absolute). μg denotes gas dynamic viscosity; σ is surface tension; ρl is liquid density. St uses continuum Stokes drag without slip correction; Cag is a gas-phase capillary number. The Bond-number ratio is approximate when ρl is much greater than ρg. These ratios do not quantify liquid drainage velocity or life.
Table 4.
Baseline pressure scaling at fixed standard volumetric flow and constant temperature under the assumptions in Section 4.6. The last column is the ratio of each quantity to its value at p0, evaluated at p = 10p0 (for example, 10 versus 1 bar absolute). μg denotes gas dynamic viscosity; σ is surface tension; ρl is liquid density. St uses continuum Stokes drag without slip correction; Cag is a gas-phase capillary number. The Bond-number ratio is approximate when ρl is much greater than ρg. These ratios do not quantify liquid drainage velocity or life.
| Quantity | Symbol | Baseline scaling at fixed standard flow | Ratio at p = 10p0 |
| Actual face velocity | U | ∝ 1/p | 0.10 |
| Gas density | ρg | ∝ p | 10 |
| Reynolds number | Re = ρgUd/μg | ρU unchanged; independent of p | 1.0 |
| Stokes number | St = ρl dp2U/(18μg df) | ∝ 1/p; continuum drag, no slip correction | 0.10 |
| Gas-phase capillary number | Cag = μgU/σ | ∝ 1/p | 0.10 |
| Weber number | We = ρgU2L/σ | ∝ 1/p | 0.10 |
| Inertial stress scale | ρgU2 | ∝ 1/p | 0.10 |
| Bond number | Bo = (ρl − ρg)gL2/σ | Approximately constant if ρl ≫ ρg | ≈1.0 |
| Gas residence-time scale | τ = L/U | ∝ p | 10 |
Table 5.
Proposed reporting framework for a traceable service-life claim. M denotes core information; R denotes information required when the corresponding mechanism is invoked. The framework does not prescribe a universal test duration or failure limit.
Table 5.
Proposed reporting framework for a traceable service-life claim. M denotes core information; R denotes information required when the corresponding mechanism is invoked. The framework does not prescribe a universal test duration or failure limit.
| Item | Level | What must be reported |
| Challenge specification | M | Liquid identity; concentration with the standard or actual volume basis and the reference conditions; size distribution; generation method; temperature; co-contaminants and their loading sequence |
| Gas condition | M | Absolute pressure; temperature; humidity; actual face velocity; effective filter area; geometry |
| Operating history | M | Initial wet or dry state; continuous or cyclic duty; shutdown duration; restart procedure |
| Pre-declared failure limits | M | All applicable limits (pressure drop, outlet oil-aerosol concentration, minimum efficiency, loss of drainage capacity, structural damage) and the first-reached rule |
| Concurrent time-resolved measurement | M | Resistance and at least one outlet metric over the same interval; sampling interval; availability of the full time series |
| Outlet metric basis | M | Mass or number basis; instrument size range; oil aerosol and oil vapour reported separately |
| Liquid-removal evidence | R | Drained mass or drainage rate; re-entrainment where carryover is part of the claim |
| Endpoint reporting | M | Measured interval; time origin; fitted model and fit window; threshold definitions; predicted time and its uncertainty |
| Result type and observation status | M | Measured endpoint, observation duration or extrapolated estimate; report censoring only with a defined and monitored failure limit (Section 4.7) |
| Replication and uncertainty | M | Number of replicates; variability; digitization uncertainty for values read from published figures |
| Stability criterion | M | Predefined window and metric-specific tolerances (Section 3.4) |
| Mechanism evidence | R | Imaging or equivalent evidence for the liquid structures invoked in the interpretation |
| Digital data availability | R | Time-series data deposited or available on request |
Disclaimer/Publisher’s Note: The statements, opinions and data contained in all publications are solely those of the individual author(s) and contributor(s) and not of MDPI and/or the editor(s). MDPI and/or the editor(s) disclaim responsibility for any injury to people or property resulting from any ideas, methods, instructions or products referred to in the content. |
© 2026 by the authors. Licensee MDPI, Basel, Switzerland. This article is an open access article distributed under the terms and conditions of the Creative Commons Attribution (CC BY) license (http://creativecommons.org/licenses/by/4.0/).
Copyright: This open access article is published under a Creative Commons CC BY 4.0 license, which permit the free download, distribution, and reuse, provided that the author and preprint are cited in any reuse.