
Submitted:
11 November 2026
Posted:
13 November 2026
You are already at the latest version
Abstract
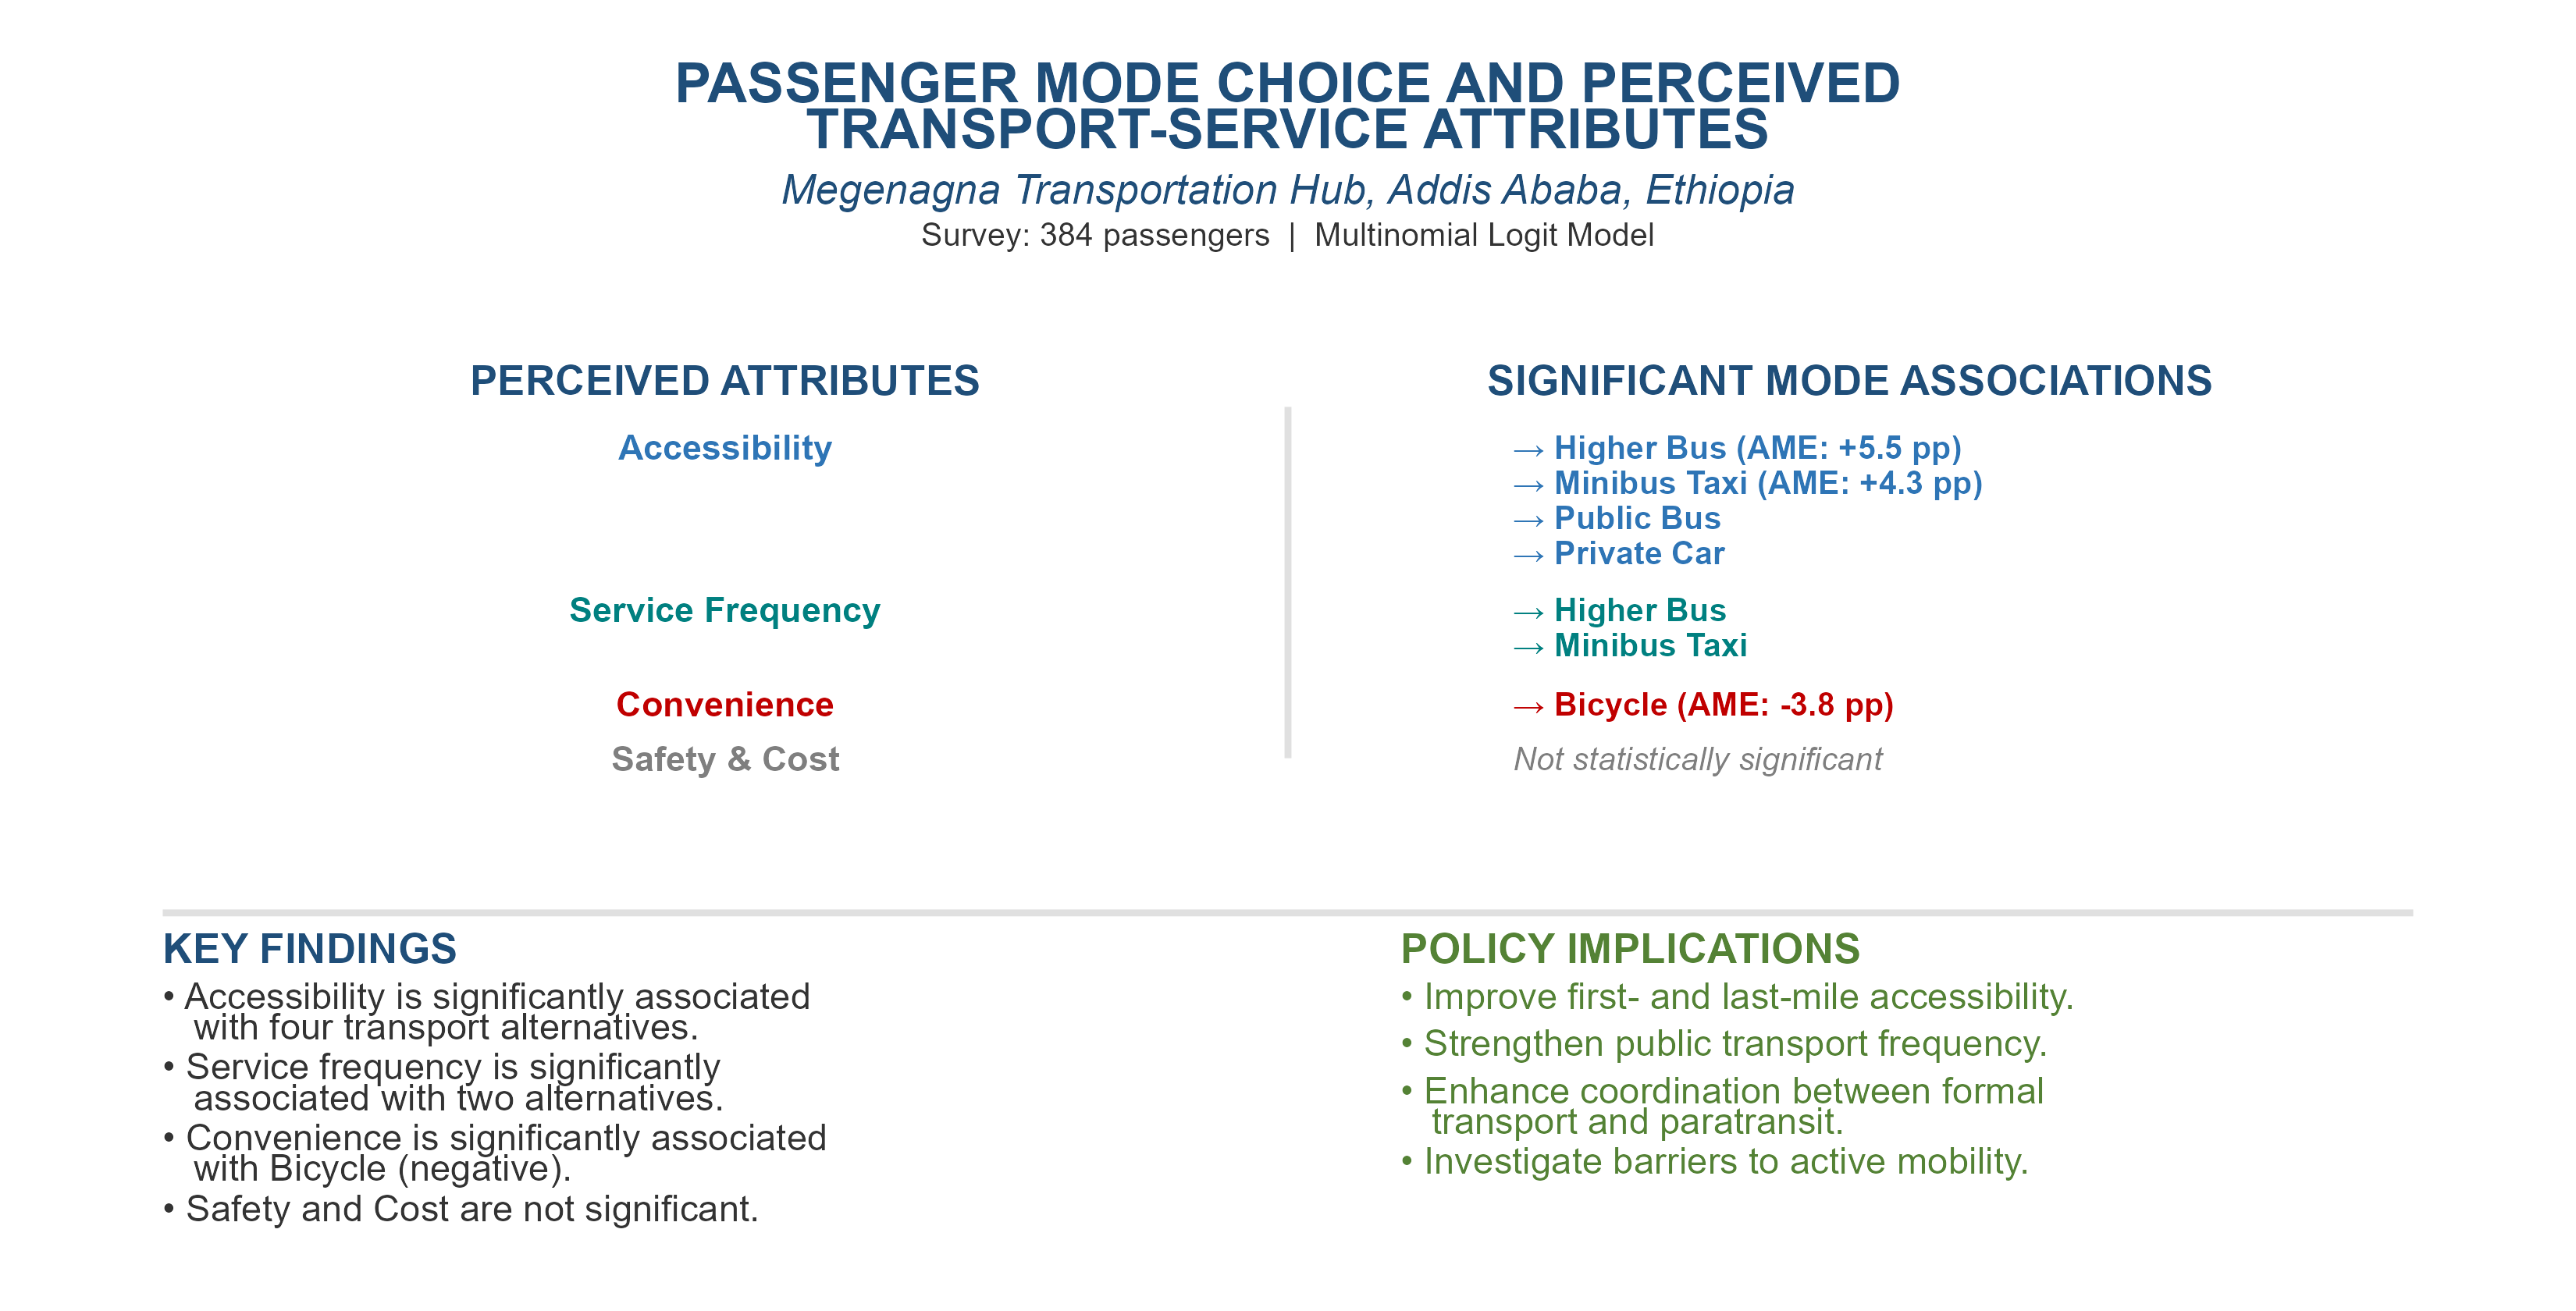
Perceived accessibility, service characteristics, and travel costs shape passenger mode choice at multimodal transportation hubs, yet many African cities have not explored the relative associations of these factors. This study examines reported mode choice at Megenagna Transportation Hub in Addis Ababa, Ethiopia, using survey data from 384 passengers. We estimated a multinomial logit model with five standardized percep-tion-based attributes and alternative-specific constants, and assessed statistical uncer-tainty using 1,000 nonparametric bootstrap replications. Perceived accessibility was significantly associated with four of the seven non-reference transport alternatives, while service frequency was significant for two. A one-standard-deviation increase in perceived accessibility was associated with a 5.5-percentage-point increase in the pre-dicted probability of choosing Higher Bus and a 4.3-percentage-point increase for Minibus Taxi. These are model-based probability estimates, not evidence of observed passenger switching or causal effects. These findings highlight the relevance of acces-sibility and service frequency for hub-level transport planning, including first- and last-mile connections and coordination among public transport, paratransit, and active mobility services. Given the cross-sectional, single-hub design, interpret the findings as context-specific associations.
Keywords:
mode choice
; multimodal transport hubs
; perceived accessibility
; service frequency
; paratransit
; multinomial logit
; urban planning
1. Introduction
1.1. Sustainable Urban Mobility and Public Transport in African Cities
Rapid urbanization and spatial expansion are increasing demand for accessible, affordable, reliable, and sustainable urban transport. These pressures are especially pronounced in sub-Saharan African cities, where public transport often combines formal services with paratransit systems, including privately operated minibuses and shared taxis. These services provide substantial mobility and connect areas poorly served by formal networks, though their operations and service quality vary by location and operator [1,2]. Passengers' assessments of these services may reflect several considerations, including fares, waiting times, frequency, accessibility, safety, convenience, and reliability.
Understanding travel-mode choice is therefore important for transportation planning. Travelers do not necessarily choose the objectively fastest or cheapest option; their decisions may also reflect household resources, trip purpose, the availability of alternatives, prior travel experience, and perceptions of service quality. Discrete-choice theory provides a formal framework for analyzing such decisions by linking the utility of available alternatives to traveler and alternative characteristics [3,4]. Nevertheless, the relative importance of these factors can vary across populations and travel contexts. Research on public-transport demand has identified fares, service quality, income, and car ownership as relevant considerations [5], while reviews of service quality and travel-mode choice emphasize the importance of frequency, reliability, perceptions, and context [6,7].
Evidence from African cities underscores the need for context-sensitive analysis. Tatah et al. [8], comparing Nairobi and Kisumu, documented differences in travel behavior and its correlates between the two Kenyan cities. In Addis Ababa, Gebremeskel et al. [9] examined travel-mode preferences and their associations with socioeconomic and travel-related characteristics. Earlier, Gebeyehu and Takano [10] examined public-transport choice in Addis Ababa, including relationships between choice and perceived fare, convenience, and service frequency.
1.2. Beyond Affordability: The Role of Transport-Service Attributes
Travel cost is a key factor in mode choice, especially for passengers with limited disposable income. However, the relationship between fare and travel behavior cannot be considered in isolation from other service characteristics. A lower-fare service may be less appealing if it involves long waits, inconvenient access, unreliable operations, or difficult transfers. Conversely, passengers may accept a higher fare when an alternative better meets their travel needs. Research on public-transport demand and service quality supports a multidimensional approach. Paulley et al. [5] synthesized evidence on fares, service quality, income, and car ownership, demonstrating the value of considering demand-related factors jointly. Redman et al. [6] found that reliability and frequency are important public-transport attributes and emphasized the role of user perceptions and context. Göransson and Andersson [7] similarly identified frequency and reliability as important to public-transport attractiveness. Research on public-transport satisfaction also shows that perceived service performance varies across user groups [11,12]. However, satisfaction and mode choice are distinct outcomes, and evidence about one should not automatically be interpreted as evidence about the other.
These distinctions are important for the present study. Perceived ratings of accessibility, frequency, safety, convenience, and cost are conceptually distinct from objective measures such as travel time, fare, headway, and walking distance. Their interpretation depends on how they are measured, coded, and incorporated into the model. This study therefore examines the relationship between five selected transport-service attributes (accessibility, service frequency, safety, convenience, and cost) and reported mode choice among passengers surveyed at the Megenagna Transportation Hub.
1.3. Transport Hubs and Multimodal Travel
Transport hubs are important settings for studying passenger travel decisions because they bring together multiple transport services and transfer opportunities. In multimodal systems, they connect local and broader urban networks. Within paratransit-oriented networks, services may serve different functions, including trunk, intermediate, and feeder roles. Using operational and spatial data from Cape Town, du Preez et al. [13] classified paratransit routes by operating characteristics, demonstrating the varied roles of informal transport in urban mobility. These roles matter for interchange planning, where effective connectivity depends not only on the availability of transport modes but also on how services complement one another.
Megenagna Transportation Hub is a major interchange in Addis Ababa, connecting passengers to several parts of the city via major road corridors and public transportation services. It links central destinations, including the city's busiest passenger movement areas such as Piassa, Stadium, and Mexico; eastern residential areas such as Summit, Hayat, and Yeka Abado; and southern destinations, including the Bole residential area and Bole International Airport. These connections underscore Megenagna's importance within the city's transportation network.
Mode choice at a transport hub can involve multiple travel decisions. Passengers may select a mode to access the hub, transfer to another mode, or combine several modes throughout the journey. These decisions may have different determinants. Research on multistage trips indicates that the factors influencing mode-combination choices can vary across journey stages [14]. Recent research on intermodal traveler behavior in megacity regions has further highlighted the complexity of mode-combination choices across different journey stages [29]. Clearly defining the choice context is therefore essential to avoid treating access, transfer, and onward-travel decisions as equivalent.
Passenger behavior at a single hub also reflects the hub's spatial, operational, and socioeconomic context. Findings from one interchange should not be automatically generalized to an entire urban transport system. Nevertheless, studying Megenagna offers an opportunity to examine reported passenger mode choice and its association with perceived service attributes in a major Addis Ababa interchange. Such evidence can inform context-specific interchange planning and multimodal coordination, while acknowledging the limitations of a single-hub case study.
1.4. Research Objectives, Questions and Contributions
This study examines passenger mode choice at Megenagna Transportation Hub in Addis Ababa, Ethiopia, and identifies how perceived transport-service attributes can inform multimodal coordination and sustainable urban mobility planning. Specifically, the study aims to characterize passenger mode-choice patterns and the use of different transport modes at Megenagna Transportation Hub; examine how perceived accessibility, service frequency, safety, convenience, and cost relate to passengers' reported transport mode choices; identify opportunities to improve multimodal transport coordination and interchange services based on observed relationships between transport-service attributes and passenger mode choice; and propose planning strategies to strengthen connectivity between Megenagna Transportation Hub and other urban transport nodes to support more integrated and sustainable urban mobility in Addis Ababa.
In line with these objectives, the study addresses the following research questions: What are the dominant passenger mode-choice patterns at Megenagna Transportation Hub? Which perceived transport-service attributes are significantly associated with passenger mode choice? How can the findings inform improvements in coordination among formal public transport, informal paratransit, and active mobility? What planning strategies could strengthen connectivity between Megenagna Transportation Hub and other transport hubs in Addis Ababa?
The study makes three contributions. First, it provides empirical evidence on passenger mode-choice patterns and on how perceived transport-service attributes relate to mode choice at a major transport hub. Second, it extends the discussion of urban mobility in Addis Ababa by examining passenger mode choice from a hub-level perspective, complementing previous citywide research. Third, it translates the empirical findings into a differentiated planning framework that distinguishes between evidence-informed operational priorities, such as improving first- and last-mile access and evaluating service-frequency improvements, and broader strategic recommendations for hub-to-hub connectivity that require additional network-level evidence.
2. Literature Review
2.1. Conceptual Foundations of Mode Choice
Passenger mode choice is central to urban transport planning because it affects accessibility, household travel expenditure, public transport demand, congestion and the distribution of mobility opportunities. In systems where formal public transport operates alongside privately operated minibuses and other shared services, passengers choose among alternatives based on their travel needs, personal circumstances, and assessments of service quality. Researchers commonly analyze mode choice using discrete choice theory. In random utility models, travelers choose the alternative that yields the highest utility within their feasible choice set [3,4]. However, observed choices do not necessarily reflect unconstrained preferences; travelers may choose a service because it is affordable or available rather than because they consider it the most attractive option. Defining the choice set is therefore critical. An alternative must be accessible, affordable, suitable for the destination, and feasible given the traveler's travel conditions [15]. Research on multi-stage journeys further shows that travelers may select combinations of modes rather than a single alternative for an entire journey [14].
Behavioral factors, including attitudes, habits, and individual perceptions, also influence mode choice alongside conventional transport attributes [16,17]. Psycho-social determinants, such as attitudes and perceived behavioral control, have been shown to influence pro-environmental travel behavior [46]. Car use is motivated not only by instrumental factors but also by symbolic and affective considerations [50]. Broader reviews of car traffic and urban quality of life have emphasized the role of both instrumental and affective motives in travel behavior [49]. Explanations of passenger behavior should therefore consider how service characteristics, journey circumstances, and the alternatives passengers can realistically access interact.
2.2. Paratransit and Urban Mobility in African Cities
2.2.1. The Role of Paratransit
Paratransit plays a substantial role in many African cities, particularly where conventional public transport does not provide adequate coverage, frequency, or flexibility. Cervero and Golub [2] discuss its contribution to mobility while identifying challenges related to congestion, safety, and regulation. Paratransit services often provide direct connections and serve areas that larger fixed-route systems cannot reach, though fares, waiting times, capacity, and reliability vary widely. Falchetta et al. [18] examined paratransit accessibility and network characteristics across seven major African cities, highlighting the importance of spatial coverage. More recent evidence indicates that passenger assessments of service quality also relate to operational and labor conditions affecting drivers [19]. Passenger experience should therefore be understood within the broader institutional and operational environment of transport provision.
2.2.2. The Transport Context of Addis Ababa
These issues are especially relevant to Addis Ababa, where formal public transport operates alongside privately operated minibuses and other shared services. The city's transit profile is dominated by government-operated buses, the Light Rail Transit (LRT), and privately owned midi-buses and minibus taxis. Gebremeskel et al. [9] examined travel-mode preferences among public transport users in the city and identified associations with income, age, travel expenditure, and distance. Earlier, Gebeyehu and Takano [10] investigated relationships between mode choice and perceived fare, convenience, and service frequency. These studies provide a foundation for further research and underscore the importance of clearly defining the specific choice situation and the service attributes under examination.
2.2.3. Multimodal Hubs and Journey Stages
Transport hubs are useful settings for studying travel decisions because passengers encounter multiple services and potential connections at a single location. In paratransit-oriented networks, individual services can serve as trunks, intermediates, or feeders [13]. Mode choice at a hub may refer to the mode used to reach the hub, the mode used to continue the journey, or the combination of modes across a trip. Research on multistage trips shows that the factors associated with mode-combination choices can vary across journey stages [14]. Research on intermodal travel behavior has also shown that passengers' preferences for different mode combinations vary across journey contexts and service attributes [47]. These considerations underscore the need to clearly define the choice being modeled. For the Megenagna Transportation Hub, this perspective supports examining passenger mode use in relation to service availability, travel requirements, and reported service characteristics. Evidence collected at a single hub should not be automatically generalized to the entire city; representativeness depends on the sampling design, survey period, and population covered.
2.3. Passenger and Trip Characteristics
Personal circumstances shape passenger mode choice by affecting affordability, accessibility, and travel needs. Income constrains the range of affordable alternatives, while age, occupation, and household responsibilities may influence how passengers evaluate service attributes. Local evidence from Addis Ababa confirms associations between mode preference and variables such as income, age, travel expenditure, and distance [9]. Trip characteristics also shape mode selection. Travel distance affects the practicality of different modes, while trip purpose influences the relative importance of affordability, speed, and reliability. Multi-stage journeys can incur additional costs and delays that are not captured by in-vehicle travel time alone [14]. Travel-time reliability, the predictability of journey duration, should be distinguished from average travel time and may be particularly important for time-sensitive trips [20].
2.4. Transport-Service Attributes and Mode Choice
2.4.1. Travel Cost and Affordability
Travel cost is the direct monetary burden of using a transportation service. For frequent travelers, small fare differences can accumulate into substantial expenses. However, the cheapest option may not minimize the overall travel burden if it entails longer waits, additional transfers, or higher access costs. Mode choice should therefore be evaluated in relation to the broader combination of cost, time, and convenience. Gebremeskel et al. [9] identified travel expenditure as a relevant factor in Addis Ababa but noted that its influence interacts with other trip and service attributes. Research on public transport economics has also emphasized the importance of considering fares alongside service quality and operational costs when evaluating demand [28].
2.4.2. Accessibility and Service Availability
Accessibility concerns how easily passengers can reach and use transport services to reach desired destinations. Relevant dimensions include access distance, walking conditions, network coverage, and connections between locations. Falchetta et al. [18] demonstrate the importance of network structure and spatial coverage in evaluating paratransit accessibility across African cities. Perceived accessibility, unlike objective measures, reflects an individual's assessment of how easily they can participate in daily activities using the transport system [21]. This finding aligns with recent evidence showing that the transport network's spatial reach to dispersed destinations better predicts mode choice than simple travel time to a central district [22]. In the present study, accessibility is examined through perceived indicators of ease of reaching services and service availability rather than comprehensive objective measures. Recent evidence on mobility hubs integrating high-speed modes suggests that perceived access thresholds significantly influence how passengers evaluate transport alternatives [36].
2.4.3. Perceived Service Quality
Public transportation service quality encompasses several related but distinct dimensions, including reliability, frequency, comfort, safety, and perceived value. Redman et al. [6] identify reliability and frequency as particularly important attributes and emphasize that the effectiveness of service improvements depends on passenger perceptions and circumstances. Recent research shows that perceived accessibility significantly predicts actual transit use and often mediates the relationship between geographical proximity and mode choice [23]. Beirão and Cabral [24] similarly show that mode choice reflects perceived service performance alongside individual and journey characteristics. Service quality assessments in paratransit contexts have also been adapted to capture mobility-as-a-service features and their relevance to the passenger experience [48]. Treat passenger satisfaction, perceived quality, and mode choice as separate outcomes.
2.5. Research Gap and Contribution
While previous studies have provided valuable citywide evidence on transport mode preferences and travel behavior in Addis Ababa [9,10], they have paid less attention to how passengers' perceptions of transport-service attributes relate to mode choice in major multimodal interchange environments. Previous research has highlighted the importance of perceived accessibility, suggesting that passengers' assessments of access to transport services may offer insights beyond measures of objective proximity [21,22]. However, the relationship between perceived transport-service attributes and the selection of competing transport alternatives at major urban transportation hubs remains insufficiently explored in African urban contexts, including Addis Ababa.
This study addresses this gap by examining reported passenger mode choice at Megenagna Transportation Hub and investigating its relationship to five perceived transport-service attributes: accessibility, service frequency, safety, convenience, and cost. By focusing on a major multimodal interchange rather than the citywide transport system, the study offers a context-specific perspective on how passengers evaluate and choose among available transport alternatives.
The study makes three contributions. First, it provides empirical evidence on passenger mode-use patterns at a major multimodal transportation hub, highlighting the coexistence and competition among transport alternatives. Second, it estimates associations between perceived transport-service attributes and the probability of choosing different transport modes using a multinomial logit framework. The analysis is complemented by model-fit assessment and nonparametric bootstrap inference to evaluate the model's explanatory performance and the uncertainty surrounding its estimated coefficients. Third, it translates the empirical findings into context-specific implications for urban transport planning, particularly regarding accessibility, service frequency, passenger convenience, and multimodal coordination. These implications offer insights into how interchange planning and connections between urban transport hubs could be strengthened to support more integrated and sustainable urban mobility.
Importantly, the study distinguishes between policy considerations directly informed by its empirical findings and broader planning recommendations that require additional evidence. Its contribution therefore extends existing research on travel behavior in Addis Ababa, both empirically and contextually, rather than claiming that urban transport mode choice has not been previously investigated.
2.6. Conceptual Framework
The conceptual framework posits that passenger mode choice at Megenagna Transportation Hub is associated with three groups of factors: passenger characteristics, trip characteristics, and transport-service attributes. Passenger characteristics include socioeconomic variables measured in the survey. Trip characteristics include purpose, distance, and travel time. Transport-service attributes comprise the five dimensions examined in this study: cost, accessibility, convenience, safety, and frequency. The outcome is the reported primary mode for the journey segment defined in the survey. The framework proposes associations rather than assuming each variable has an independent effect. Passenger characteristics may relate to affordability and access to alternatives, while trip characteristics may influence the importance assigned to particular service attributes. The study empirically examines the direction and strength of these relationships. Operationally, the framework guides variable selection, model specification, and the development of evidence-based recommendations.
3. Method
3.1. Sample and Data Source
3.1.1. Study Area
This study was conducted at the Megenagna Transportation Hub in Addis Ababa, Ethiopia. The hub is a major interchange serving a mix of formal and informal transport modes, including public buses, higher-capacity buses, minibus taxis, taxis, light rail, private cars, bicycles, and walking. The city's transport system is typical of many rapidly urbanizing cities in sub-Saharan Africa, where motorization has outpaced infrastructure development, resulting in congestion, air pollution, and uneven accessibility [2].
3.1.2. Survey Design
A structured revealed-preference questionnaire was designed to collect data on passengers' observed mode choice and their perceptions of transport-service attributes. The questionnaire comprised four sections: Section A (Primary mode used to access or leave the hub); Section B (Socio-demographic characteristics); Section C (Travel behavior); and Section D (Perceptions of five transport-service attributes rated on a five-point Likert scale: Accessibility, Frequency, Safety, Convenience, and Cost).
The attributes were selected based on established literature on mode choice and service quality. Travel time, cost, frequency, accessibility, and comfort are standard explanatory variables in discrete-choice models [3,35]. Multi-attribute service-quality ratings are widely used in public-transport research [27,39], and perceived safety has been shown to influence mode choice in developing cities [30]. The study used a revealed-preference design to examine observed choices under real-world financial, spatial, and operational constraints, rather than stated intentions under hypothetical conditions [33].
3.1.3. Sampling Procedure
We implemented a systematic sampling procedure across five origin–destination points within the Megenagna hub. At each location, interviewers selected a random starting point and approached every k-th passenger. This approach ensured coverage of all eight transport alternatives and representation across diverse socio-demographic groups. The required sample size was calculated using the standard formula for an infinite population [31]:
where Z = 1.96 (95% confidence level), p = 0.5, q = 1 - p, and d = 0.05. This yields a minimum sample size of 384. We initially recorded and compiled survey responses in IBM SPSS Statistics 26. We also cleaned the data, performed consistency checks, and coded categorical variables in SPSS. This process included checking for missing values, verifying response ranges, and ensuring that all eight transport alternatives were correctly coded and represented in the final dataset. After cleaning, we prepared the data for statistical analyses in R version 4.5. [37]
3.2. Sample Characteristics
After cleaning, we retained 384 complete responses. Table 1 summarizes the sample's sociodemographic and travel behavior characteristics. Most respondents were male (60.9%). Most were of working age: 34.1% were 36–45 years and 31.0% were 26–35 years. Educational attainment was relatively high: 50.8% held a bachelor's degree, and 43.8% held a diploma. Government/public-sector employees constituted the largest occupational group (49.0%), followed by private-sector employees (33.1%). Nearly half of respondents (49.0%) reported monthly incomes of 5,000–10,000 ETB, while 36.5% earned 10,000–15,000 ETB. A large majority (84.9%) had lived in Addis Ababa for more than ten years. Public-transport use was distributed across frequency categories, with the largest shares reporting monthly (23.4%), several times a week (22.4%), and weekly (21.6%) travel. Trip purposes were also diverse: personal business (23.4%), shopping (22.1%), recreation (19.0%), work (18.2%) and education (17.2%). Travel occurred throughout the day, with no single period dominating. Overall, the sample consists predominantly of working-age, relatively well-educated, lower-middle- to middle-income residents who use public transport for a variety of purposes. These characteristics make the sample suitable for examining associations between perceived service attributes and reported mode choice at a major urban hub.
3.3. Modeling Framework
3.3.1. Theoretical Foundation: Random Utility Theory
The analysis is grounded in random-utility theory [34]. An individual is assumed to choose the alternative that maximizes their utility:
where Uij Total utility of alternative j for individual i, Vij Observed utility, and εij= Random error term.
Uij = Vij + εij
3.3.2. The Multinomial Logit Model
The multinomial logit (MNL) model assumes that the error terms are independently and identically distributed as Type I Extreme Value (Gumbel). The choice probability is then:
where Pij Probability that individual i chooses alternative j, vij Systematic utility of alternative j, and J total number of alternatives [4].
3.3.3. Utility Specification
The systematic utility (Vij) is specified as a linear function of attributes:
where αj is the Alternative-Specific Constant (ASC) for mode j, is a vector of alternative-specific coefficients relative to the reference mode, and Xi= is a vector of individual-level perception ratings for respondent
3.3.4. Variable Specification
The dependent variable was the respondent’s reported primary mode for accessing or leaving the hub. The explanatory variables comprised five perception-based attributes: Accessibility, Frequency, Safety, Convenience, and Cost. Each attribute was measured using a five-point Likert scale assessing perceived importance and standardized (z-scored) before model estimation [26]. As these ratings reflected general perceptions rather than evaluations of specific transport modes, they were included as individual-specific covariates. Accordingly, the model estimates associations between perceived attribute importance and reported mode choice, rather than mode-specific responses or elasticities. Comfort, cleanliness, and environmental impact were also measured but excluded from the final specification because they did not improve model fit.
3.3.5. Model Selection
We preferred the standard MNL model for three reasons. First, the sample size of 384 is adequate for an MNL specification with the chosen covariates but insufficient to reliably estimate a mixed-logit model with random parameters [26]. Second, the research objective is to estimate average associations rather than individual-level preference heterogeneity. Third, the MNL model provides a transparent and interpretable baseline.
3.4. Estimation Method
Parameters were estimated by maximum likelihood using the multinom function in the R package nnet [37,38]. The log-likelihood function is:
where yij=1 if individual i chose alternative j and 0 otherwise,pij is the choice probability. The parameters are estimated by maximizing the log-likelihood function with respect to the coefficients β and ASCs α.
We obtained standard errors via nonparametric bootstrapping with 1 000 resamples, providing robust inference without relying on asymptotic normality. This approach is particularly appropriate because standard R packages do not support sandwich covariance estimators for multinom objects, and bootstrapping also yields percentile-based confidence intervals [26]. We selected variables sequentially using likelihood-ratio tests. A baseline model containing Cost, Safety, and Convenience was first estimated; Accessibility and Frequency were added only if they produced a statistically significant improvement in fit (p < 0.10).
3.5. Model Evaluation and Diagnostics
We evaluated model fit using the log-likelihood, Akaike Information Criterion (AIC), likelihood-ratio test against the null model, McFadden’s pseudo-R2, and classification accuracy. is defined as
Values between 0.2 and 0.4 are conventionally considered indicative of good fit in discrete-choice models [34]. We examined multicollinearity using the variance inflation factor (VIF); values above 10 indicate problematic collinearity [26]. We assessed the independence-of-irrelevant-alternatives (IIA) assumption using a coefficient-stability check. Because dropping any non-reference mode removes that mode's coefficients from the estimation, we cannot compare the coefficient vectors element-by-element without re-referencing the model. We did not use the formal Hausman-McFadden test, as it is known to be numerically unstable when the number of alternatives is large relative to the sample size [25].
4. Results
4.1. Descriptive Statistics and Mode Distribution
Figure 1 shows this distribution, highlighting the dominance of the four motorized public and paratransit modes, which together account for approximately 70% of the sample. Public Bus was the most frequently reported primary mode (76 respondents, 19.8%), followed by Minibus taxi (67, 17.4%), Taxi (64, 16.7%), and Higher Bus (61, 15.9%). The LRT accounted for 44 respondents (11.5%), while Bicycle (31, 8.1%) and Walking (27, 7.0%) represented smaller shares. Private Car was the least frequently reported mode (14, 3.6%).
This distribution confirms the hub's role as a multimodal interchange serving a predominantly transit-dependent population. The low share of private-car use aligns with Addis Ababa's broader transit profile, in which formal bus and paratransit services dominate [9]. The presence of 44 LRT users and 64 taxi users further indicates that the hub functions as a genuine interchange rather than a single-mode corridor.
4.2. Bivariate Associations
Chi-square tests assessed whether mode choice varied across passenger and trip characteristics. Table 2 reports the results. None of the tested associations reached statistical significance at the 5% level: trip purpose (χ2=18.69, df=28, p=0.907), trip frequency (χ2=25.15, df=28, p=0.620), time of day (χ2=23.36, df=28, p=0.715), gender (χ2=8.69, df=7, p=0.276), age (χ2=22.18, df=35, p=0.955), and income (χ2=32.32, df=28, p=0.262).
These null results are substantive. In this hub-user sample, the measured demographic and trip characteristics do not significantly differentiate among modes. This finding shifts the explanatory burden to the perceived service attributes examined in the multivariate model.
4.3. Model Estimation and Fit
We estimated the final multinomial logit (MNL) model with Walking as the reference category. The model included five standardized perception covariates (Cost, Safety, Convenience, Accessibility, and Frequency) and alternative-specific constants. As part of the model audit, we confirmed that trip characteristics were not included in this multivariate specification; we retained them only for descriptive bivariate analyses, as the primary objective was to isolate the relationship between perceived service attributes and mode choice. The model converged successfully, yielding finite bootstrap standard errors for all 42 coefficients. Table 3 reports the model fit statistics. The full model's log-likelihood is −715.60, compared with −758.37 for the null model. The likelihood-ratio test confirms that the model performs significantly better than the null model (LR = 85.54, df = 35, p< 0.001).
The McFadden pseudo-R2 is 0.056, which is modest. As noted in the methodological literature, McFadden's R2 often yields low values in cross-sectional revealed-preference models that rely on individual-level perception covariates rather than mode-specific objective attributes [26]. The likelihood-ratio test confirms that the model performs significantly better than a null model (LR = 85.54, df = 35, p< 0.001). To provide an alternative descriptive measure of explanatory power, we also calculated the McKelvey-Zavoina pseudo-R2(0.204). However, we retain the McFadden pseudo-R2 and the likelihood-ratio test as our primary indicators of model fit, and we acknowledge that the model's overall explanatory power remains modest.
The model correctly predicts 24.5% of observed choices. This should be compared with both the uniform-choice baseline (12.5%) and the majority-class baseline (19.8%, corresponding to Public Bus). This accuracy metric reflects in-sample fit and should not be interpreted as out-of-sample predictive validation. Future research using hold-out samples or cross-validation would be required to assess genuine predictive performance. Despite the modest McFadden R2, the model's aggregate calibration is strong. Figure 2 shows the predicted-versus-observed mode-share calibration plot. The model's aggregate predictions fall almost exactly on the 45-degree line, indicating that it accurately reproduces the overall demand distribution across the eight modes, even though individual-level predictive accuracy remains limited.
4.4. Relative Importance of Attributes
Figure 3 shows the standardized attribute-importance ranking, computed as the mean absolute coefficient across the seven non-reference modes. Accessibility has the highest mean absolute coefficient, followed by Frequency, Safety, Convenience, and Cost. This ranking is descriptive and does not constitute a formal statistical test of whether one attribute is more important than another.
4.5. Mode-Specific Effects and Marginal Effects
We calculated Average Marginal Effects (AMEs) by estimating, for each respondent, the marginal effect of each explanatory variable on the predicted probability of choosing each transport alternative, then averaging these individual-level effects across the sample (n = 384). For standardized continuous explanatory variables, the marginal effects represent the average change in predicted choice probability associated with a one-standard-deviation increase in the respective attribute, evaluated at each respondent's observed explanatory-variable values. These estimates reflect changes in predicted probabilities rather than absolute changes in passenger numbers. Three key patterns emerge from the bootstrap coefficient estimates and AMEs: Accessibility is positively and significantly associated with the relative likelihood of choosing several motorized transport alternatives compared with Walking. Frequency is positively and significantly associated with the relative likelihood of choosing Higher Bus and Minibus Taxi compared with Walking. Convenience is significantly and negatively associated with choosing a bicycle, whereas Safety and Cost are not statistically significant predictors of mode choice in the estimated model.
Three key patterns emerge from the bootstrap coefficients and marginal effects. Figure 4 shows the average marginal effects as a heatmap. Accessibility is the strongest driver of motorized mode choice. A one-standard-deviation increase in perceived accessibility is associated with a 5.5-percentage-point increase in the predicted probability of choosing Higher Bus, a 4.3-percentage-point increase for Minibus Taxi, and a 2.4-percentage-point increase for Private Car. The corresponding coefficients are statistically significant: Higher Bus (β= 1.003, p< 0.001), Minibus Taxi (β= 0.916, p< 0.001), and Private Car (β= 1.243, p= 0.003).
Figure 5 shows the coefficient estimates in a forest plot. Frequency significantly predicts use of higher buses and minibus taxis. Frequency has significant positive coefficients for Bus (β= 0.712, p= 0.009) and Minibus Taxi (β= 0.600, p= 0.025).
Figure 6 presents the standardized coefficients as a dot map. Full coefficient estimates are reported in Appendix A. Convenience has a significant negative effect on bicycle choice (β= -0.65, p= 0.015), with a marginal effect of -3.8 percentage points. Respondents who place high importance on convenience are significantly less likely to cycle, reflecting the physical effort and infrastructure barriers associated with cycling in Addis Ababa. Once Accessibility and Frequency are included, Safety and Cost are not statistically significant for any mode. The Safety coefficients range from -0.61 (Private Car) to +0.43 (Bicycle), but none reach the 5% significance level. The Cost coefficients range from -0.03 to +0.33, with all p-values above 0.23.
4.6. Dominant Attributes by Mode
To compare the relative magnitudes of perceived service attributes across transport alternatives, this section identifies the attribute with the largest absolute Average Marginal Effect (AME) for each mode. The comparison uses the AME estimates in Table 4, which show changes in predicted mode-choice probabilities associated with a one-standard-deviation increase in each perceived attribute. This approach provides a descriptive, mode-specific comparison without relying on coefficient ratios involving the perceived-cost coefficient, which was not statistically significant for any alternative.
Accessibility has the largest absolute AME for five of the seven non-reference modes, while Cost has the largest for Public Bus and Safety for Bicycle. These patterns indicate that accessibility has relatively large estimated associations with the predicted probabilities of several transport alternatives in the study sample. However, the rankings are descriptive and do not establish statistically significant differences between attributes or demonstrate the effects of specific policy interventions. The corresponding Accessibility coefficients are statistically significant at the 5% level for Private Car, Minibus Taxi, and Higher Bus, but not for Taxi or LRT. The Cost coefficient for Public Bus and the Safety coefficient for Bicycle are also not statistically significant. These results should therefore be interpreted as descriptive differences in estimated AME magnitudes rather than evidence that the dominant attribute has a statistically stronger effect than other attributes for each mode.
We also examined relative coefficient ratios as an exploratory diagnostic. However, because the perceived-cost coefficients were not statistically distinguishable from zero, the resulting ratios were unstable and had very wide bootstrap confidence intervals. Consequently, we did not use these ratios to interpret attribute importance or formulate policy recommendations.
4.7. Independence of Irrelevant Alternatives (IIA)
The IIA assumption was not formally tested in this study. The Hausman–McFadden test was not applied due to numerical instability in the model estimation [25]. A Nested Logit model was estimated as a robustness check; however, this analysis does not definitively confirm that the IIA assumption holds. Accordingly, interpret the MNL results with this limitation in mind. Future research using larger samples and alternative discrete-choice specifications could provide a more robust assessment of substitution patterns and the IIA assumption
5. Discussion and Policy Implications
5.1. Relative Importance of Cost Versus Service Quality
This study finds that perceived Cost ranks last in relative importance among the five attributes, while Accessibility and Frequency dominate mode choice. This result challenges a widely held assumption in transport policy for developing cities, namely that fares are the primary barrier to public-transport use and that fare subsidies are therefore the most effective policy lever. The absence of a statistically significant Cost coefficient should be interpreted as an inability to detect a cost effect given the available variation, not as evidence that cost is irrelevant. Three explanations are plausible. First, hub users have already incurred an access cost to reach Megenagna, so their subsequent choice is a secondary decision in which accessibility to the final destination and waiting time matter more than marginal fare differences. Second, if fares across motorized modes fall within a relatively narrow band, cost becomes a weak discriminator, while frequency and accessibility become the salient differentiators. Third, the general perception of "Cost" may not map directly onto the actual marginal cost of each specific trip. This finding adds to a growing body of evidence that service-quality attributes can outweigh pure cost considerations in shaping mode choice [6,7,28].
5.2. The Role of Accessibility in Mode Choice
Accessibility emerged as an important attribute in reported mode choice. This finding is relevant to Addis Ababa, where fragmented first- and last-mile connections and the spatial organization of transport services may influence passengers' mode choices. Direct connections to final destinations may offer advantages over alternatives that require additional transfers. This finding aligns with research on mobility hubs and paratransit accessibility in African cities, which highlights variations in network coverage and the spatial distribution of services across modes and operators [18,22,44]. Recent research on mobility hubs also suggests that perceived accessibility influences how passengers evaluate transport alternatives [36].
The marginal effects indicate that a one-standard-deviation increase in perceived accessibility was associated with higher predicted probabilities of choosing Higher Bus (+5.5 percentage points), Minibus Taxi (+4.3 percentage points), and Private Car (+2.4 percentage points), but lower probabilities for Taxi (−3.4 percentage points) and LRT (−2.9 percentage points). These findings underscore the planning relevance of improving hub access and connections to surrounding transport networks. In particular, strengthening feeder connectivity and the spatial reach of public transport services may support more accessible multimodal travel. However, further investigation is needed to determine whether accessibility improvements or fare reductions are more effective.
5.3. The Role of Frequency
Perceived Frequency showed statistically significant positive associations with Higher Bus (β = 0.712, p = 0.009) and Minibus Taxi (β = 0.600, p = 0.025). This finding aligns with the broader service-quality literature, which identifies reliability and frequency as key attributes of public-transport attractiveness [6,7]. At the hub, passengers making a secondary choice among motorized modes are sensitive to expected waiting time and its associated uncertainty. The policy implication is clear: increasing dispatch frequency on higher bus and taxi routes would shift demand more effectively than reducing fares. Operators can implement this operational lever through vehicle scheduling and fleet allocation without requiring large subsidies. Evidence from feeder-transit optimization studies suggests that hybrid scheduling approaches can improve service quality while managing operating costs [32].
5.4. Safety and Convenience
Perceived safety was not statistically significantly associated with transport mode choice. This indicates that, conditional on other perceived attributes, safety did not significantly differentiate mode choice in this sample. However, this does not mean safety is unimportant. Safety remains an important consideration in transport planning and a potential subject for further stated-preference research. Future studies could distinguish among road safety, personal security, and pedestrian conditions [30,50]. Perceived convenience showed positive point estimates for Public Bus (+1.1 percentage points), Higher Bus (+2.6 percentage points) and LRT (+2.6 percentage points), although none were statistically significant. These estimates do not establish an independent association between convenience and the probability of choosing these modes. Nevertheless, factors such as physical effort, weather exposure, and infrastructure conditions warrant further investigation to understand how convenience influences the attractiveness of transport alternatives and informs urban mobility planning [49].
5.5. Policy Implications
The findings identify perceived Accessibility and Frequency as attributes associated with selected transport alternatives at Megenagna Transportation Hub. In contrast, Cost and Safety were not statistically significant predictors of mode choice in the estimated model. Accordingly, the policy recommendations distinguish between planning priorities informed by the empirical findings and broader interventions that require additional evidence. Given the cross-sectional design, the results indicate associations rather than causal policy effects.
5.5.1. Tier A: Evidence-Informed Planning Priorities
Improve First- and Last-Mile Accessibility
The accessibility findings support prioritizing improvements to pedestrian connections, safe crossing facilities, organized access points, and links between surrounding areas and interchange facilities. These measures could improve access to the hub and the usability of its transport services. They align with research emphasizing the role of accessible transport environments in urban mobility planning [42,44,45]. Recent evidence on mobility hubs also highlights the importance of perceived access thresholds in shaping passenger evaluations [36]. Assess their potential effects at Megenagna through pedestrian-accessibility audits, spatial analysis, and passenger-level data.
Improve Service-Frequency Coordination
The findings for Higher Bus and Minibus Taxi support reviewing dispatch intervals, identifying service shortages, and improving coordination among transport operators. These measures could be operational priorities for improving service availability. Previous research on feeder-service scheduling has also examined operational approaches to improving service performance while managing costs [32]. However, pilot interventions supported by before-and-after passenger surveys and service-performance monitoring would be necessary to determine whether such improvements influence passenger mode choice.
5.5.2. Tier B: Policy Areas Requiring Additional Evidence
Improving connectivity between Megenagna and other urban transport nodes is one such consideration. Potential measures include better interchange facilities, designated feeder-service areas for minibuses and taxis, safe pedestrian connections to the LRT, and improved coordination among transport operators. However, the study does not measure origin-destination patterns, passenger transfers, route connectivity, or inter-hub travel times. Further investigation through origin-destination surveys, GIS-based accessibility assessments, and route-network analysis is needed to assess the feasibility and spatial priorities of these interventions [36,47].
Congestion pricing requires additional evidence, such as stated-preference data or dynamic modeling, to assess how passengers might respond to changes in travel costs and departure times [40]. Pricing and integrated ticketing are also broader policy options that require additional evidence. This study does not examine passengers' responses to hypothetical fare changes, existing transfer-fare arrangements, or willingness to adopt integrated payment systems. Stated-preference research and operational assessments would therefore be needed before drawing conclusions about the likely effects of these interventions [41]. Similarly, decisions concerning network expansion require GIS-based accessibility assessments, population and land-use data, and route-coverage analysis to identify areas with limited transport access [18]. Environmental interventions also warrant further investigation because the estimated model did not include environmental attitudes or outcomes [46,49]. Prioritizing these broader policy areas therefore requires evidence beyond the scope of the present study.
5.5.3. Attribute Trade-Offs and Multimodal Integration
Perceived service attributes and predicted mode-choice probabilities. Figure 4 shows the AMEs. Accessibility is positively associated with Higher Bus (+5.5 percentage points) and Minibus Taxi (+4.3 percentage points), while frequency is positively associated with Higher Bus (+3.7 percentage points) and Minibus Taxi (+2.0 percentage points). Convenience is significantly associated with Bicycle (−3.8 percentage points), whereas its positive AME for Higher Bus (+2.6 percentage points) is not statistically significant. Cost has its largest positive point estimate for Public Bus (+3.3 percentage points), while Safety has its largest for Bicycle (+4.1 percentage points) and Public Bus (+3.0 percentage points); neither attribute is statistically significant. These estimates represent changes in predicted probabilities, not observed passenger switching.
The findings underscore the importance of accessibility, service coordination, and active mobility in multimodal transport planning. However, the study focuses on individual mode choices rather than on actual transfers or full multimodal journeys. Further research using origin-destination data, observed transfer behavior, and network analysis is needed to assess hub connectivity and trunk-feeder relationships [29,47].
5.6. Contribution to Sustainable Urban Mobility
This study's empirical findings contribute to the broader discussion of sustainable urban mobility in rapidly urbanizing African cities by highlighting the relationship between perceived transport-service attributes and passenger mode choice at a major urban transportation hub. Sustainable mobility strategies generally aim to reduce excessive dependence on private vehicles while improving the attractiveness, accessibility, and use of public and shared transport. In rapidly developing urban contexts, achieving these objectives requires attention not only to transport affordability but also to the quality, availability, and accessibility of transport services. The findings provide context-specific evidence that service-related attributes matter for passenger mode choice at Megenagna Transportation Hub. In particular, perceived accessibility is positively and significantly associated with the relative log-odds of choosing several motorized transport alternatives over walking, while perceived service frequency is significantly associated with the relative log-odds of choosing higher bus and taxi. These results highlight accessibility and service frequency as important considerations in hub-level transport planning. They also suggest that sustainable mobility strategies should prioritize improvements to pedestrian access, interchange facilities, and the operational performance of transport services alongside fare-related measures. This interpretation aligns with previous research indicating that, although fare incentives may encourage public transport use, service quality attributes, including reliability and frequency, are important for sustaining public transport attractiveness [6]. Furthermore, research on transport-service perceptions underscores the importance of considering passengers' experiences and evaluations when planning infrastructure and service improvements [43].
This study contributes a hub-specific perspective to sustainable urban mobility research by showing how passengers' perceptions of transport-service attributes relate to mode choice in an African urban transport context. It underscores the value of integrating passenger-perception evidence with operational and infrastructure planning when developing strategies for more accessible, attractive, and integrated public transport systems. Although the cross-sectional findings do not establish causal effects of specific interventions or demonstrate actual modal shifts, they provide an empirical basis for identifying priorities for future transport planning and evaluation at the Megenagna Transportation Hub.
5.7. Limitations
This study has several limitations. First, service attributes were based on perceptions rather than objective measures; therefore, the findings reflect associations with reported mode choice, not the effects of actual service changes. Second, the cross-sectional design does not support causal conclusions. Third, the single-hub case study limits generalizability. The study also did not analyze inbound and outbound journeys separately, potentially obscuring directional differences. The McFadden pseudo-(R2) (0.056) indicates modest model fit but does not represent the proportion of variance explained. The McKelvey–Zavoina pseudo-(R^2) (0.204) and the calibration plot (Figure 2) provide additional evidence on model performance. We did not complete the Hausman–McFadden test due to numerical instability. We examined the Nested Logit model as a robustness check, but it should not be interpreted as definitive confirmation of the IIA assumption.
5.8. Future Research
Future studies could combine stated-preference surveys with Mixed Logit models to examine service trade-offs and unobserved preference heterogeneity [26,33]. GIS-based accessibility measures could complement perceived attributes by providing objective network assessments [36]. Larger, more diverse samples would support more complex models and further IIA testing. Comparative studies across transport hubs in Addis Ababa and other African cities could establish the broader applicability of the findings.
6. Conclusions
This study examined reported passenger mode choice at Megenagna Transportation Hub in Addis Ababa, Ethiopia, using survey data and a multinomial logit model. Public Bus (19.8%), Minibus Taxi (17.4%), Taxi (16.7%) and Higher Bus (15.9%) were the most frequently reported modes, together accounting for approximately 70% of responses. The results indicate that perceived accessibility was positively and significantly associated with choosing a Minibus Taxi, higher bus, private car and Public Bus. Perceived service frequency was positively associated with choosing a minibus taxi or higher bus, while perceived convenience was significantly and negatively associated with choosing a bicycle. Perceived safety and cost were not statistically significant predictors of mode choice in the estimated model. The AME estimates further indicate that a one-standard-deviation increase in perceived accessibility was associated with increases of 5.5 percentage points in the predicted probability of choosing Higher Bus and 4.3 percentage points for Minibus Taxi. These estimates represent model-based associations, not observed passenger switching or causal effects. The findings highlight the relevance of accessibility and service frequency for transport planning at Megenagna. Potential priorities include improving first- and last-mile access, coordinating bus and paratransit services, and addressing barriers to active mobility. However, the study did not directly examine actual passenger transfers, complete multimodal journeys, or the effects of specific interventions; these issues require further investigation. Overall, this study contributes hub-specific evidence on the relationships between perceived transport-service attributes and reported mode choice in Addis Ababa. Future research across multiple transport hubs, combining passenger travel data, stated-preference methods, and GIS-based accessibility measures, could strengthen the evidence base for integrated and sustainable urban mobility planning.
Author Contributions
Adisu Gebre contributed to conceptualization, methodology, validation, results analysis and writing the original draft. Meng Xu contributed to the conceptualization, methodology, and review & editing of the paper.
Data Availability Statement
The data presented in this study are available on request from the corresponding author.
Conflicts of Interest
The authors declare no conflicts of interest.
Abbreviations
The following abbreviations are used in this manuscript:
| AME | Average Marginal Effect |
| LRT | Light Railway Transit |
| IIA | Independence of Irrelevant Alternatives |
| MNL | Multinomial logit |
| AIC | Akaike Information Criterion |
Appendix A
Full Bootstrap Coefficient Table

Table A1.
Multinomial logit coefficient estimates with nonparametric bootstrap standard errors (B = 1,000).
Table A1.
Multinomial logit coefficient estimates with nonparametric bootstrap standard errors (B = 1,000).
| Mode | Parameter | Estimate | Boot. SE | z | p-value | 95% CI Lower | 95% CI Upper |
| Bicycle | (Intercept) | 0.052 | 0.382 | 0.136 | 0.892 | -0.698 | 0.802 |
| Bicycle | Cost | 0.190 | 0.302 | 0.628 | 0.530 | -0.403 | 0.782 |
| Bicycle | Safety | 0.427 | 0.270 | 1.584 | 0.113 | -0.101 | 0.956 |
| Bicycle | Convenience | -0.651 | 0.268 | -2.431 | 0.015 | -1.176 | -0.126 |
| Bicycle | Accessibility | 0.392 | 0.269 | 1.458 | 0.145 | -0.135 | 0.920 |
| Bicycle | Frequency | 0.082 | 0.291 | 0.280 | 0.779 | -0.490 | 0.653 |
| Private Car | (Intercept) | -0.804 | 0.739 | -1.088 | 0.276 | -2.251 | 0.644 |
| Private Car | Cost | -0.029 | 0.507 | -0.058 | 0.954 | -1.022 | 0.963 |
| Private Car | Safety | -0.612 | 0.377 | -1.624 | 0.104 | -1.351 | 0.127 |
| Private Car | Convenience | -0.170 | 0.439 | -0.387 | 0.699 | -1.031 | 0.691 |
| Private Car | Accessibility | 1.243 | 0.414 | 3.005 | 0.003 | 0.432 | 2.054 |
| Private Car | Frequency | 0.826 | 0.464 | 1.780 | 0.075 | -0.083 | 1.735 |
| Minibus taxi | (Intercept) | 1.129 | 0.315 | 3.583 | 0.000 | 0.511 | 1.746 |
| Minibus taxi | Cost | -0.006 | 0.270 | -0.021 | 0.983 | -0.536 | 0.525 |
| Minibus taxi | Safety | -0.036 | 0.263 | -0.136 | 0.892 | -0.551 | 0.480 |
| Minibus taxi | Convenience | -0.003 | 0.233 | -0.013 | 0.990 | -0.460 | 0.454 |
| Minibus taxi | Accessibility | 0.916 | 0.247 | 3.702 | 0.000 | 0.431 | 1.401 |
| Minibus taxi | Frequency | 0.600 | 0.269 | 2.234 | 0.025 | 0.074 | 1.126 |
| Taxi | (Intercept) | 1.095 | 0.314 | 3.490 | 0.000 | 0.480 | 1.710 |
| Taxi | Cost | 0.246 | 0.284 | 0.866 | 0.386 | -0.311 | 0.804 |
| Taxi | Safety | -0.255 | 0.262 | -0.973 | 0.331 | -0.770 | 0.259 |
| Taxi | Convenience | -0.004 | 0.233 | -0.016 | 0.987 | -0.460 | 0.452 |
| Taxi | Accessibility | 0.409 | 0.264 | 1.546 | 0.122 | -0.109 | 0.926 |
| Taxi | Frequency | 0.324 | 0.255 | 1.271 | 0.204 | -0.176 | 0.824 |
| Higher Bus | (Intercept) | 0.987 | 0.319 | 3.092 | 0.002 | 0.361 | 1.612 |
| Higher Bus | Cost | 0.153 | 0.265 | 0.578 | 0.563 | -0.367 | 0.673 |
| Higher Bus | Safety | -0.091 | 0.268 | -0.339 | 0.734 | -0.616 | 0.434 |
| Higher Bus | Convenience | 0.210 | 0.230 | 0.914 | 0.361 | -0.241 | 0.662 |
| Higher Bus | Accessibility | 1.003 | 0.249 | 4.033 | 0.000 | 0.516 | 1.491 |
| Higher Bus | Frequency | 0.712 | 0.273 | 2.607 | 0.009 | 0.177 | 1.248 |
| Public Bus | (Intercept) | 1.289 | 0.304 | 4.241 | 0.000 | 0.693 | 1.885 |
| Public Bus | Cost | 0.326 | 0.262 | 1.242 | 0.214 | -0.188 | 0.840 |
| Public Bus | Safety | 0.114 | 0.244 | 0.468 | 0.640 | -0.365 | 0.594 |
| Public Bus | Convenience | 0.104 | 0.219 | 0.474 | 0.636 | -0.326 | 0.534 |
| Public Bus | Accessibility | 0.598 | 0.249 | 2.401 | 0.016 | 0.110 | 1.086 |
| Public Bus | Frequency | 0.498 | 0.267 | 1.866 | 0.062 | -0.025 | 1.020 |
| LRT | (Intercept) | 0.706 | 0.331 | 2.131 | 0.033 | 0.057 | 1.355 |
| LRT | Cost | 0.136 | 0.270 | 0.504 | 0.614 | -0.392 | 0.664 |
| LRT | Safety | -0.168 | 0.271 | -0.621 | 0.534 | -0.699 | 0.363 |
| LRT | Convenience | 0.261 | 0.226 | 1.155 | 0.248 | -0.182 | 0.703 |
| LRT | Accessibility | 0.345 | 0.258 | 1.337 | 0.181 | -0.161 | 0.852 |
| LRT | Frequency | 0.409 | 0.274 | 1.494 | 0.135 | -0.128 | 0.945 |
Appendix B
Bivariate Cross-Tabulations
Table A2.
Cross-tabulation of mode choice by age group (N = 384).
| Mode | 1 | 2 | 3 | 4 | 5 | 6 |
| Walking | 1 | 8 | 9 | 7 | 2 | 0 |
| Bicycle | 0 | 6 | 12 | 9 | 4 | 0 |
| Private Car | 0 | 1 | 4 | 4 | 3 | 2 |
| Higher Bus | 1 | 9 | 19 | 22 | 7 | 3 |
| Minibus taxi | 2 | 8 | 20 | 24 | 10 | 3 |
| Taxi | 1 | 11 | 22 | 21 | 7 | 2 |
| Public Bus | 0 | 13 | 23 | 26 | 11 | 3 |
| LRT | 0 | 7 | 10 | 18 | 7 | 2 |
Age categories: 1 = Under 18, 2 = 18–25, 3 = 26–35, 4 = 36–45, 5 = 46–55, 6 = Over 55.
Table A3.
Cross-tabulation of mode choice by trip frequency (N = 384).
| Mode | 1 | 2 | 3 | 4 | 5 |
| Walking | 3 | 2 | 10 | 8 | 4 |
| Bicycle | 7 | 9 | 7 | 6 | 2 |
| Private Car | 2 | 4 | 3 | 3 | 2 |
| Higher Bus | 11 | 15 | 12 | 18 | 11 |
| Minibus taxi | 9 | 15 | 13 | 15 | 12 |
| Taxi | 10 | 14 | 14 | 17 | 6 |
| Public Bus | 20 | 18 | 13 | 16 | 9 |
| LRT | 5 | 9 | 11 | 7 | 12 |
Trip frequency categories: 1 = Daily, 2 = Several times a week, 3 = Weekly, 4 = Monthly, 5 = Rarely.
Table A4.
Cross-tabulation of mode choice by gender (N = 384).
| Mode | Male | Female |
| Walking | 17 | 10 |
| Bicycle | 20 | 11 |
| Private Car | 5 | 9 |
| Higher Bus | 44 | 23 |
| Minibus taxi | 36 | 28 |
| Taxi | 32 | 29 |
| Public Bus | 51 | 25 |
| LRT | 29 | 15 |
Table A5.
Cross-tabulation of mode choice by monthly income (N = 384).
| Mode | 1 | 2 | 3 | 4 | 5 |
| Walking | 2 | 14 | 9 | 2 | 0 |
| Bicycle | 3 | 12 | 14 | 1 | 1 |
| Private Car | 2 | 4 | 6 | 2 | 0 |
| Higher Bus | 5 | 40 | 18 | 3 | 1 |
| Minibus taxi | 10 | 23 | 31 | 0 | 0 |
| Taxi | 3 | 30 | 22 | 4 | 2 |
| Public Bus | 6 | 38 | 28 | 2 | 2 |
| LRT | 2 | 27 | 12 | 3 | 0 |
Income categories: 1 = <5,000 ETB, 2 = 5,000–10,000 ETB, 3 = 10,000–15,000 ETB, 4 = 15,000–20,000 ETB, 5 = >20,000 ETB.
Table A6.
Cross-tabulation of mode choice by trip purpose (N = 384).
| Mode | 1 | 2 | 3 | 4 | 5 |
| Walking | 5 | 8 | 4 | 5 | 5 |
| Bicycle | 7 | 3 | 8 | 7 | 6 |
| Private Car | 2 | 4 | 2 | 3 | 3 |
| Higher Bus | 8 | 15 | 15 | 13 | 16 |
| Minibus taxi | 16 | 9 | 12 | 14 | 13 |
| Taxi | 10 | 13 | 15 | 9 | 14 |
| Public Bus | 13 | 10 | 17 | 16 | 20 |
| LRT | 9 | 4 | 12 | 6 | 13 |
Trip purpose categories: 1 = Work, 2 = Education, 3 = Shopping, 4 = Recreation, 5 = Personal Business.
Table A7.
Cross-tabulation of mode choice by travel-time band (N = 384).
| Mode | 1 | 2 | 3 | 4 | 5 |
| Walking | 4 | 6 | 3 | 8 | 6 |
| Bicycle | 6 | 6 | 7 | 5 | 7 |
| Private Car | 1 | 6 | 0 | 4 | 3 |
| Higher Bus | 13 | 14 | 11 | 14 | 15 |
| Minibus taxi | 17 | 11 | 8 | 14 | 14 |
| Taxi | 9 | 18 | 12 | 13 | 9 |
| Public Bus | 10 | 16 | 18 | 16 | 16 |
| LRT | 11 | 8 | 10 | 5 | 10 |
Time of travel categories: 1 = Morning, 2 = Midday, 3 = Evening, 4 = Night, 5 = Morning and Evening.
References
- Behrens, R.; McCormick, D.; Mfinanga, D. (Eds.) Paratransit in African Cities: Operations, Regulation and Reform; Routledge: London, UK, 2016. [Google Scholar] [CrossRef]
- Cervero, R.; Golub, A. Informal Transport: A Global Perspective. Transp. Policy 2007, 14, 445–457. [Google Scholar] [CrossRef]
- Ben-Akiva, M.; Lerman, S.R. Discrete Choice Analysis: Theory and Application to Travel Demand; MIT Press: Cambridge, MA, USA, 1985. [Google Scholar]
- Train, K.E. Discrete Choice Methods with Simulation, 2nd ed.; Cambridge University Press: Cambridge, UK, 2009. [Google Scholar] [CrossRef]
- Paulley, N.; Balcombe, R.; Mackett, R.; Titheridge, H.; Preston, J.; Wardman, M.; Shires, J.; White, P. The Demand for Public Transport: The Effects of Fares, Quality of Service, Income and Car Ownership. Transp. Policy 2006, 13, 295–306. [Google Scholar] [CrossRef]
- Redman, L.; Friman, M.; Gärling, T.; Hartig, T. Quality Attributes of Public Transport That Attract Car Users: A Research Review. Transp. Policy 2013, 25, 119–127. [Google Scholar] [CrossRef]
- Göransson, J.; Andersson, H. Factors That Make Public Transport Systems Attractive: A Review of Travel Preferences and Travel Mode Choices. Eur. Transp. Res. Rev. 2023, 15, 32. [Google Scholar] [CrossRef]
- Tatah, L.; Foley, L.; Oni, T.; Pearce, M.; Lwanga, C.; Were, V.; Assah, F.; Wasnyo, Y.; Mogo, E.; Okello, G.; et al. Comparing Travel Behaviour Characteristics and Correlates between Large and Small Kenyan Cities (Nairobi versus Kisumu). J. Transp. Geogr. 2023, 110, 103625. [Google Scholar] [CrossRef]
- Gebremeskel, E.; Woldetensae, B.; Woldeamanuel, M. Travel Mode Preference in Addis Ababa, Ethiopia: Empirical Observations. Urban Plan. Transp. Res. 2023, 11, 2228380. [Google Scholar] [CrossRef]
- Gebeyehu, M.; Takano, S. Diagnostic Evaluation of Public Transportation Mode Choice in Addis Ababa. J. Public Transp. 2007, 10, 27–50. [Google Scholar] [CrossRef]
- de Oña, J.; de Oña, R.; Eboli, L.; Mazzulla, G. Drivers of Customer Satisfaction with Public Transport Services. Transp. Res. Part A Policy Pract. 2015, 78, 1–20. [Google Scholar] [CrossRef]
- Abenoza, R.F.; Cats, O.; Susilo, Y.O. Travel Satisfaction with Public Transport: Determinants, User Classes, Regional Disparities and Their Evolution. Transp. Res. Part A Policy Pract. 2017, 95, 64–84. [Google Scholar] [CrossRef]
- du Preez, D.; Zuidgeest, M.; Behrens, R. A Quantitative Clustering Analysis of Paratransit Route Typology and Operating Attributes in Cape Town. J. Transp. Geogr. 2019, 80, 102493. [Google Scholar] [CrossRef]
- Basheer, M.A.; van der Waerden, P.; Kochan, B.; Bellemans, T.; Shah, S.A.R. Multi-Stage Trips: An Exploration of Factors Affecting Mode Combination Choice of Travelers in England. Transp. Policy 2019, 81, 95–105. [Google Scholar] [CrossRef]
- Bovy, P.H.L.; Hoogendoorn-Lanser, S. Modelling Route Choice Behaviour in Multi-Modal Transport Networks. Transportation 2005, 32, 341–368. [Google Scholar] [CrossRef]
- Johansson, M.V.; Heldt, T.; Johansson, P. The Effects of Attitudes and Personality Traits on Mode Choice. Transp. Res. Part A Policy Pract. 2006, 40, 507–525. [Google Scholar] [CrossRef]
- Lanzini, P.; Khan, S.A. Shedding Light on the Psychological and Behavioral Determinants of Travel Mode Choice: A Meta-Analysis. Transp. Res. Part F Traffic Psychol. Behav. 2017, 48, 13–27. [Google Scholar] [CrossRef]
- Falchetta, G.; Noussan, M.; Hammad, A.T. Comparing Paratransit in Seven Major African Cities: An Accessibility and Network Analysis. J. Transp. Geogr. 2021, 94, 103131. [Google Scholar] [CrossRef]
- Behrens, R.; Zuidgeest, M.; Durant, T. Relationships between Paratransit Passenger Satisfaction and Driver Labour Conditions in Sub-Saharan Africa. Afr. Transp. Stud. 2025, 3, 100030. [Google Scholar] [CrossRef]
- Bhat, C.R.; Sardesai, R. The Impact of Stop-Making and Travel Time Reliability on Commute Mode Choice. Transp. Res. Part B Methodol. 2006, 40, 709–730. [Google Scholar] [CrossRef]
- Olsson, L.E.; Friman, M.; Lättman, K. Accessibility Barriers and Perceived Accessibility: Implications for Public Transport. Urban Sci. 2021, 5, 63. [Google Scholar] [CrossRef]
- Kühnel, F.; Schrömbges, M.; Braun, N.; Kuhnimhof, T. Public Transport Accessibility and Its Effect on Mode Choice. Urban Sci. 2025, 9, 49. [Google Scholar] [CrossRef]
- Baghestani, A.; Delkhak, M.; Mahpour, A.; Vassallo, J.M. From Geographical Accessibility to Subway Use: The Role of Perceived Accessibility Among University Students. Urban Sci. 2026, 10, 580. [Google Scholar] [CrossRef]
- Beirão, G.; Cabral, J.A.S. Understanding Attitudes towards Public Transport and Private Car: A Qualitative Study. Transp. Policy 2007, 14, 478–489. [Google Scholar] [CrossRef]
- Hausman, J.; McFadden, D. Specification Tests for the Multinomial Logit Model. Econometrica 1984, 52, 1219–1240. [Google Scholar] [CrossRef]
- Hensher, D.A.; Rose, J.M.; Greene, W.H. Applied Choice Analysis: A Primer; Cambridge University Press: Cambridge, UK, 2005. [Google Scholar] [CrossRef]
- Hensher, D.A.; Stopher, P.; Bullock, P. Service Quality—Developing a Service Quality Index in the Provision of Commercial Bus Contracts. Transp. Res. Part A Policy Pract. 2003, 37, 499–517. [Google Scholar] [CrossRef]
- Hörcher, D.; Tirachini, A. A Review of Public Transport Economics. Econ. Transp. 2021, 25, 100196. [Google Scholar] [CrossRef]
- Huan, N.; Hess, S.; Yamamoto, T.; Yao, E. Modelling Intermodal Traveller Behaviour in Megacity Regions: Simultaneous versus Sequential Estimation Frameworks. Transportation 2026, 53, 35–70. [Google Scholar] [CrossRef]
- Joewono, T.B.; Kubota, H. User Satisfaction with Paratransit in Competition with Motorization in Indonesia: Anticipation of Future Implications. Transportation 2007, 34, 337–354. [Google Scholar] [CrossRef]
- Kothari, C.R. Research Methodology: Methods and Techniques, 2nd ed.; New Age International: New Delhi, India, 2004. [Google Scholar]
- Liu, L.; Sun, L.; Chen, Y.; Ma, X. Optimizing Fleet Size and Scheduling of Feeder Transit Services Considering the Influence of Bike-Sharing Systems. J. Clean. Prod. 2019, 236, 117550. [Google Scholar] [CrossRef]
- Louviere, J.J.; Hensher, D.A.; Swait, J.D. Stated Choice Methods: Analysis and Applications; Cambridge University Press: Cambridge, UK, 2000. [Google Scholar] [CrossRef]
- McFadden, D. Conditional Logit Analysis of Qualitative Choice Behavior. In Frontiers in Econometrics; Zarembka, P., Ed.; Academic Press: New York, NY, USA, 1974; pp. 105–142. [Google Scholar]
- Ortúzar, J. de D.; Willumsen, L.G. Modelling Transport, 4th ed.; Wiley: Chichester, UK, 2011. [Google Scholar] [CrossRef]
- Park, S.; Shin, D.; Bansal, P.; Cho, S.-H. Perceived Access Thresholds for Mobility Hubs Integrating High-Speed Modes: Evidence from the Seoul Metropolitan Area. J. Transp. Geogr. 2026, 137, 104863. [Google Scholar] [CrossRef]
- R Core Team. R: A Language and Environment for Statistical Computing; R Foundation for Statistical Computing: Vienna, Austria, 2023; Available online: https://www.R-project.org/ (accessed on 1 January 2024).
- Venables, W.N.; Ripley, B.D. Modern Applied Statistics with S, 4th ed.; Springer: New York, NY, USA, 2002. [Google Scholar] [CrossRef]
- Eboli, L.; Mazzulla, G. Service Quality Attributes Affecting Customer Satisfaction for Bus Transit. J. Public Transp. 2007, 10, 21–34. [Google Scholar] [CrossRef]
- Börjesson, M.; Kristoffersson, I. The Swedish Congestion Charges: Ten Years On. Transp. Res. Part A Policy Pract. 2018, 107, 35–51. [Google Scholar] [CrossRef]
- Alhassan, I.B.; Matthews, B.; Toner, J.P.; Susilo, Y.O. Examining the Effect of Integrated Ticketing on Mode Choice for Interregional Commuting: Studies among Car Commuters. Int. J. Sustain. Transp. 2023, 17, 245–257. [Google Scholar] [CrossRef]
- Petrea, M.; Gheorghe, C.; Soica, A. Accessibility in Bus-Based Public Transport Across European Cities: A Bibliometric and Thematic Review of Bus Stop and Station Infrastructure for Inclusive Urban Mobility. Urban Sci. 2026, 10, 399. [Google Scholar] [CrossRef]
- Popescu, C.; Matichescu, M.L.; Răducan, M.-R.; Dragan, A. Public Transport Accessibility Level and Public Perceptions: A Framework for Urban Mobility Analysis. Urban Sci. 2026, 10, 122. [Google Scholar] [CrossRef]
- Azimi, G.; Rahimi, A.; Lee, M.; Jin, X. Mode Choice Behavior for Access and Egress Connection to Transit Services. Int. J. Transp. Sci. Technol. 2021, 10, 136–155. [Google Scholar] [CrossRef]
- Del Mistro, R.; Behrens, R. Integrating the Informal with the Formal: An Estimation of the Impacts of a Shift from Paratransit Line-Haul to Feeder Service Provision in Cape Town. Case Stud. Transp. Policy 2015, 3, 271–277. [Google Scholar] [CrossRef]
- Bamberg, S.; Möser, G. Twenty Years after Hines, Hungerford, and Tomera: A New Meta-Analysis of Psycho-Social Determinants of Pro-Environmental Behaviour. J. Environ. Psychol. 2007, 27, 14–25. [Google Scholar] [CrossRef]
- Chen, L.; Yao, E.; Yang, Y.; Pan, L.; Liu, S. Understanding Passengers' Intermodal Travel Behavior to Improve Air-Rail Service: A Case Study of Beijing-Tianjin-Hebei Urban Agglomeration. J. Air Transp. Manag. 2024, 118, 102615. [Google Scholar] [CrossRef]
- Dzisi, E.; Obeng, D.A.; Tuffour, Y.A. Modifying the SERVPERF to Assess Paratransit Minibus Taxis Trotro in Ghana and the Relevance of Mobility-as-a-Service Features to the Service. Heliyon 2021, 7, e07071. [Google Scholar] [CrossRef]
- Gärling, T.; Steg, L. (Eds.) Threats from Car Traffic to the Quality of Urban Life: Problems, Causes, and Solutions; Elsevier: Oxford, UK, 2007. [Google Scholar]
- Steg, L. Car Use: Lust and Must. Instrumental, Symbolic and Affective Motives for Car Use. Transp. Res. Part A Policy Pract. 2005, 39, 147–162. [Google Scholar] [CrossRef]
Figure 1.
Distribution of reported primary modes at Megenagna Hub.
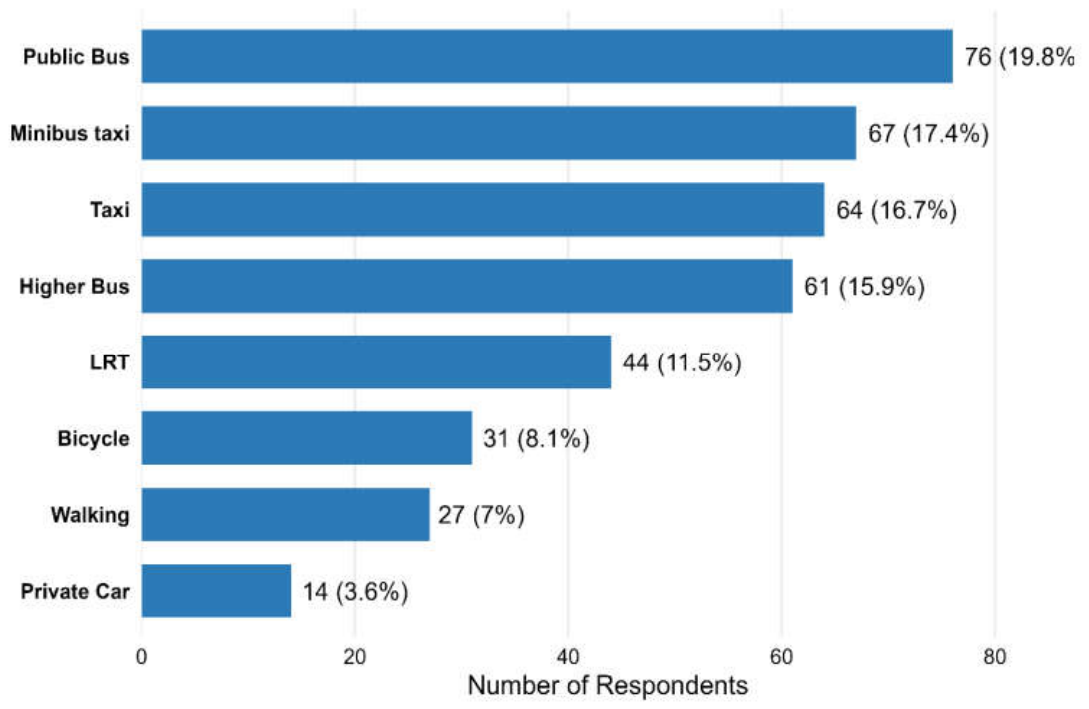
Figure 2.
Predicted vs. observed mode shares (calibration plot).
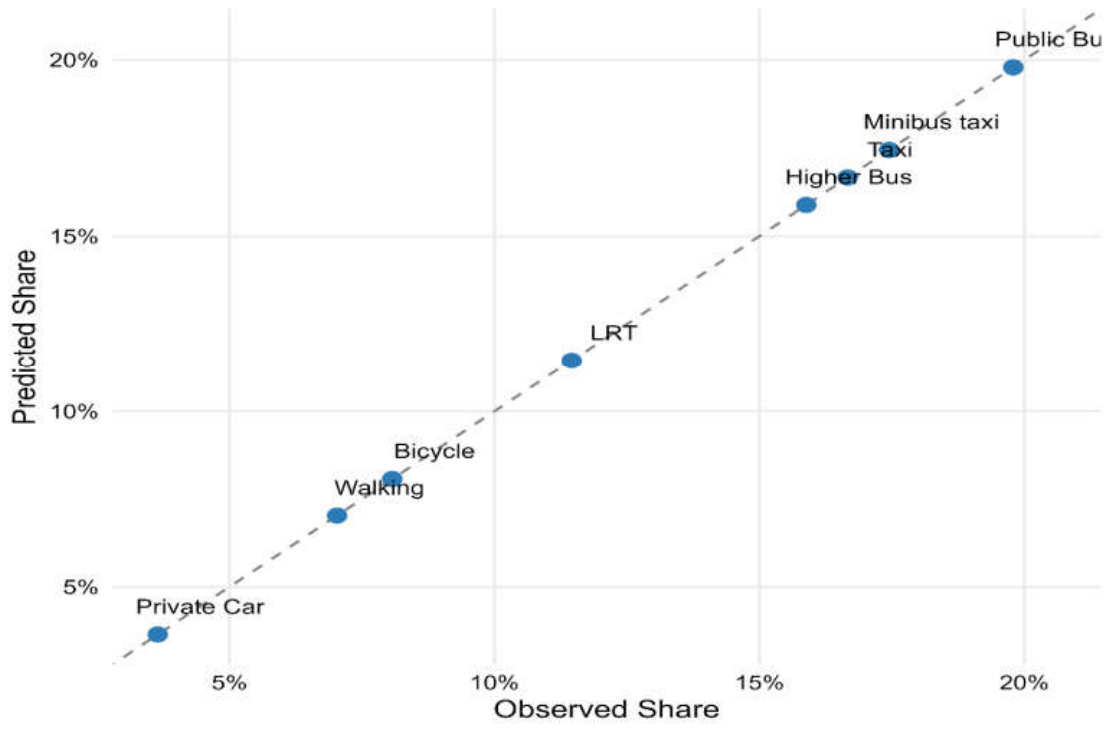
Figure 3.
Relative importance of perceived attributes (mean ∣β∣ across modes).
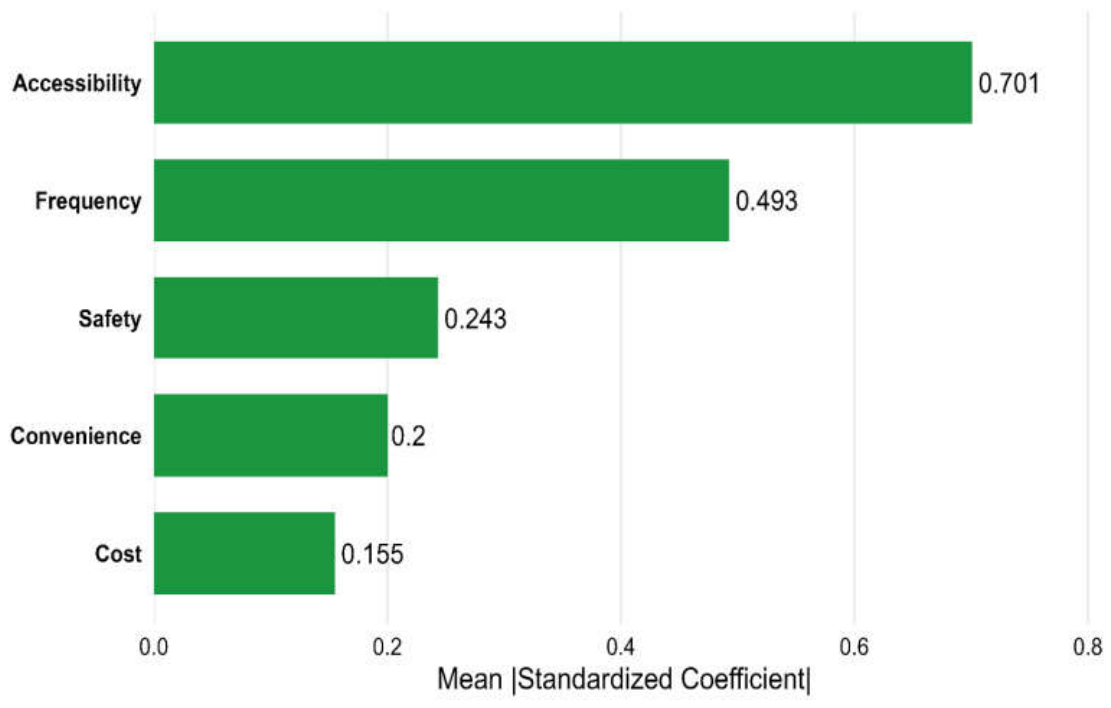
Figure 4.
Average marginal effects of perceived attributes on choice probability.
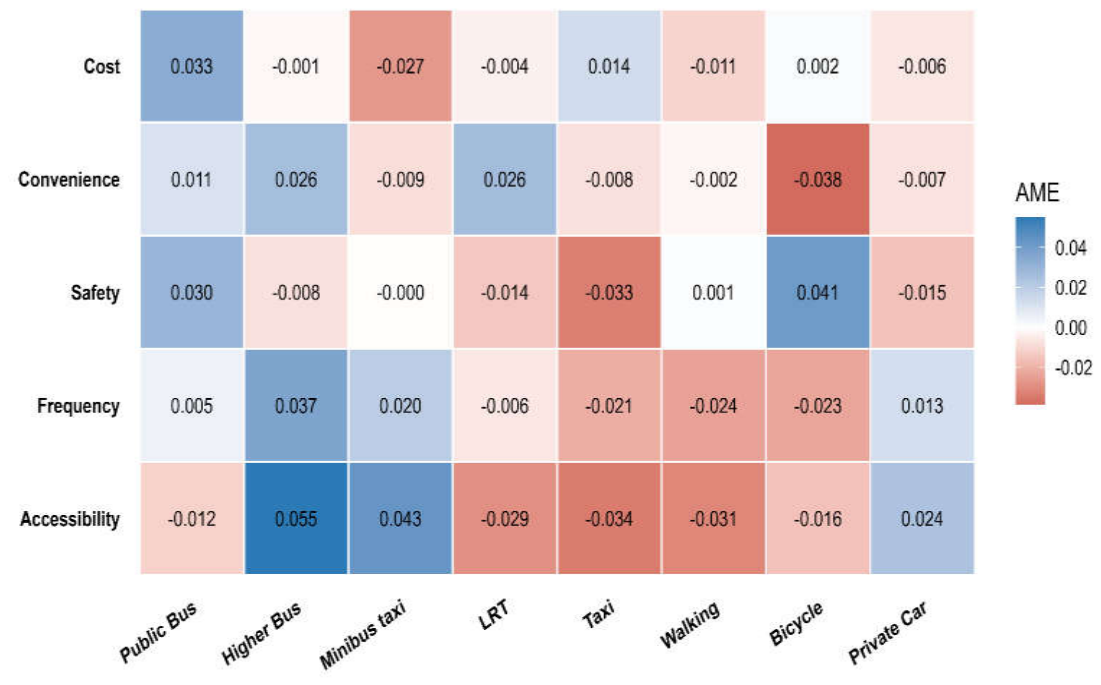
Figure 5.
Coefficient estimates with 95 % bootstrap confidence intervals.
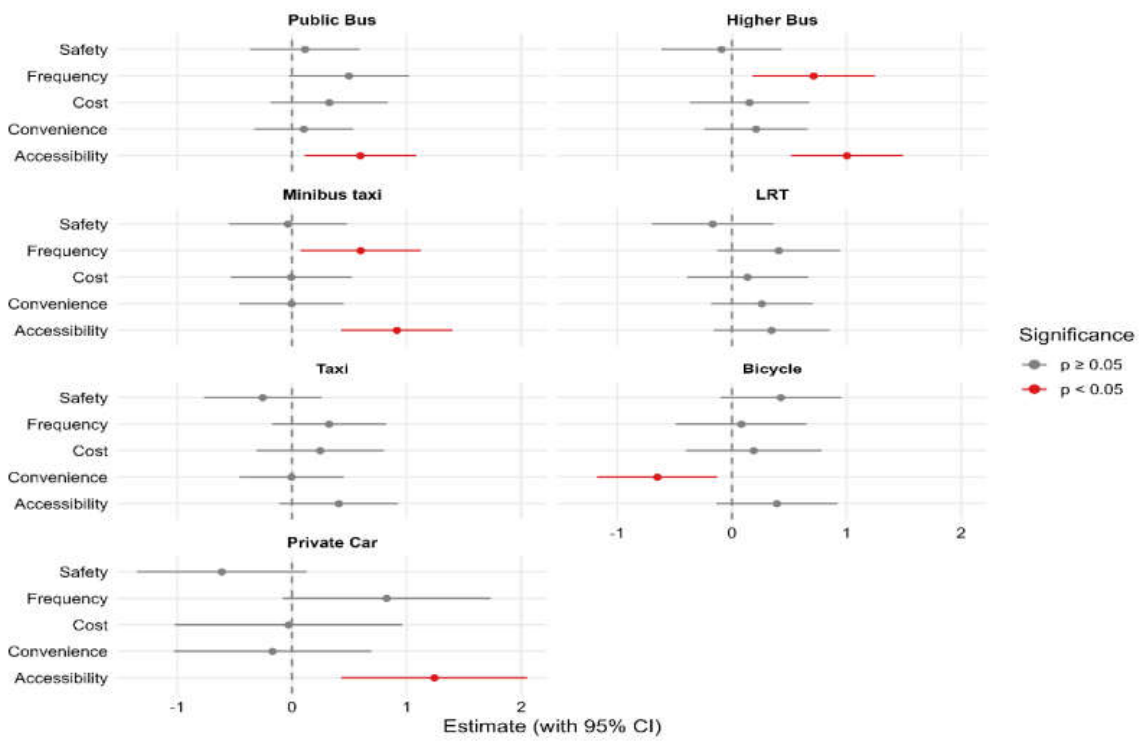
Figure 6.
Standardized coefficients by mode and attribute (filled points: p < 0.05).
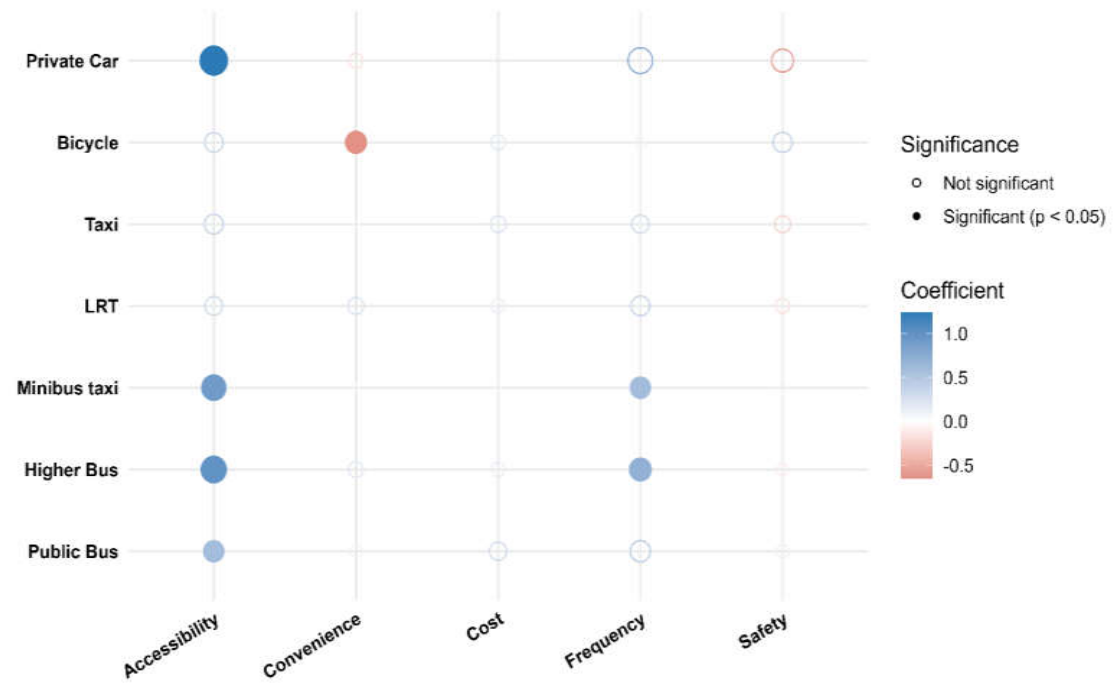
Table 1.
Demographic Characteristics and Travel Behavior of Respondents (n = 384).
| Variable | Category | N | Percent (%) |
| Sex | Male | 234 | 60.9 |
| Female | 150 | 39.1 | |
| Age | Under 18 | 5 | 1.3 |
| 18–25 | 63 | 16.4 | |
| 26–35 | 119 | 31.0 | |
| 36–45 | 131 | 34.1 | |
| 46–55 | 51 | 13.3 | |
| Over 55 | 15 | 3.9 | |
| Education Level | Primary | 2 | 0.5 |
| Secondary | 16 | 4.2 | |
| Diploma | 168 | 43.8 | |
| Bachelor's Degree | 195 | 50.8 | |
| Postgraduate | 3 | 0.8 | |
| Occupation | Student | 17 | 4.4 |
| Government/Public Sector Employee | 188 | 49.0 | |
| Private Sector Employee | 127 | 33.1 | |
| Self-employed/Business Owner | 26 | 6.8 | |
| Homemaker | 10 | 2.6 | |
| Retired | 8 | 2.1 | |
| Unemployed | 8 | 2.1 | |
| Monthly Income | Low (<5,000 ETB) | 33 | 8.6 |
| Lower-middle (5,000–10,000 ETB) | 188 | 49.0 | |
| Middle (10,000–15,000 ETB) | 140 | 36.5 | |
| Upper-middle (15,000–20,000 ETB) | 17 | 4.4 | |
| High (>20,000 ETB) | 6 | 1.6 | |
| Length of Residence in Addis Ababa | Less than 1 year | 1 | 0.3 |
| 1–5 years | 1 | 0.3 | |
| 5–10 years | 55 | 14.3 | |
| More than 10 years | 326 | 84.9 | |
| Other | 1 | 0.3 | |
| Frequency of Public Transportation Use | Daily | 67 | 17.4 |
| Several times a week | 86 | 22.4 | |
| Weekly | 83 | 21.6 | |
| Monthly | 90 | 23.4 | |
| Rarely | 58 | 15.1 | |
| Trip Purpose | Work | 70 | 18.2 |
| Education | 66 | 17.2 | |
| Shopping | 85 | 22.1 | |
| Recreation | 73 | 19.0 | |
| Personal Business | 90 | 23.4 | |
| Usual Time of Travel | Morning | 71 | 18.5 |
| Midday | 85 | 22.1 | |
| Evening | 69 | 18.0 | |
| Night | 79 | 20.6 | |
| Morning and Evening | 80 | 20.8 |
Table 2.
Chi-square tests of mode choice against passenger and trip characteristics.
| Variable | χ2 | df | p-value |
| Trip purpose | 18.69 | 28 | 0.907 |
| Trip frequency | 25.15 | 28 | 0.620 |
| Time of day | 23.36 | 28 | 0.715 |
| Gender | 8.69 | 7 | 0.276 |
| Age | 22.18 | 35 | 0.955 |
| Income | 32.32 | 28 | 0.262 |
Table 3.
Model fit statistics for the final MNL model.
| Metric | Value |
| N | 384 |
| Log-likelihood (full model) | −715.60 |
| Log-likelihood (null model) | −758.37 |
| McFadden pseudo- | 0.056 |
| McKelvey-Zavoina pseudo- | 0.204 |
| Likelihood Ratio statistic (df = 35) | 85.54 |
| LR test -value | < 0.001 |
| AIC | 1515.21 |
| BIC | 1681.14 |
| Classification accuracy | 24.48 % |
Table 4.
Dominant attribute for each mode, based on absolute AME.
| Mode |
Dominant Attribute |
AME (percentage points) | Absolute AME | Coefficient p-value |
| Private Car | Accessibility | +2.4 | 2.4 | 0.003 |
| Minibus Taxi | Accessibility | +4.3 | 4.3 | <0.001 |
| Taxi | Accessibility | −3.4 | 3.4 | 0.122 |
| Higher Bus | Accessibility | +5.5 | 5.5 | <0.001 |
| Public Bus | Cost | +3.3 | 3.3 | 0.214 |
| LRT | Accessibility | −2.9 | 2.9 | 0.181 |
| Bicycle | Safety | +4.1 | 4.1 | 0.113 |
Note: AMEs represent changes in predicted choice probabilities associated with a one-standard-deviation increase in the respective attribute. Walking is the reference category. The p-values refer to the corresponding attribute coefficients in the multinomial logit model, not to the AMEs themselves. Dominant attributes are identified solely by the largest absolute AME point estimate; this ranking does not imply statistical significance.
Disclaimer/Publisher’s Note: The statements, opinions and data contained in all publications are solely those of the individual author(s) and contributor(s) and not of MDPI and/or the editor(s). MDPI and/or the editor(s) disclaim responsibility for any injury to people or property resulting from any ideas, methods, instructions or products referred to in the content. |
© 2026 by the authors. Licensee MDPI, Basel, Switzerland. This article is an open access article distributed under the terms and conditions of the Creative Commons Attribution (CC BY) license (http://creativecommons.org/licenses/by/4.0/).
Copyright: This open access article is published under a Creative Commons CC BY 4.0 license, which permit the free download, distribution, and reuse, provided that the author and preprint are cited in any reuse.