

Submitted:
12 November 2026
Posted:
13 November 2026
You are already at the latest version
Abstract
Railway dynamic inspection generates large volumes of track-condition data, but translating repeated defect records into maintenance priorities remains challenging. This study presents a data-driven approach for railway track maintenance prioritisation using three repeated dynamic inspection campaigns. The dataset comprised 6,977 defect records distributed across 453 kilometre posts. Temporal variation, defect severity and type, track quality index, directional variation, spatial distribution, and inspection recurrence were evaluated. A composite priority index (CPI) was formulated by integrating weighted defect occurrence, recurrence across inspections, and defect diversity to rank affected locations according to relative maintenance priority. The results showed substantial variation between inspections, with 5,071 defects recorded in September compared with 1,111 and 795 in July and August, respectively. Of the 453 affected kilometre posts, 211 (46.6%) contained defects in all three inspections. The CPI identified KM 26 as the highest-priority location, followed by KM 268 and KM 54. The ranking differed from defect-frequency ranking, demonstrating that locations with the greatest defect counts were not necessarily those with the highest maintenance priority. The proposed approach provides an interpretable means of using repeated dynamic inspection data to identify locations requiring further inspection or maintenance attention.
Keywords:
railway dynamic inspection
; maintenance prioritisation
; track geometry
; composite priority index
I. Introduction
Railway track geometry condition directly influences vehicle–track interaction, ride quality, operational reliability, and safety. Repeated traffic loading, environmental effects, degradation of track components, and maintenance interventions progressively alter track geometry and can result in deviations from prescribed condition limits. Dynamic track inspection systems are therefore routinely used to measure track geometry and identify locations requiring maintenance attention [1,2]. This is particularly important because track defects and other infrastructure-related hazards can contribute to derailment and collision risk, highlighting the need for timely detection and intervention [3,4]. Dynamic inspections generate spatially referenced condition data, including defect type, severity, track quality indices, and other quality indicators. Effectively translating these measurements into maintenance priorities is important because infrastructure managers must determine not only where defects occur, but also which locations warrant earlier intervention. Conventional track-condition assessment commonly relies on threshold exceedances and aggregated measures such as the track quality index (TQI). Such indicators provide useful representations of overall track condition and facilitate comparison between track sections [5]. However, aggregated indices can mask localised irregularities, while considering individual defect records or defect counts independently does not account for whether the same location is repeatedly identified in successive inspections. A location containing numerous minor or isolated exceedances may therefore receive greater apparent importance than another location characterised by fewer but more severe and recurrent defects. This distinction is particularly relevant when inspection data are used to support maintenance prioritisation rather than condition reporting alone [6].
Repeated dynamic inspections provide an additional dimension for track-condition assessment because observations from successive campaigns can be used to distinguish isolated exceedances from locations exhibiting recurring condition problems. The value of repeated track geometry measurements has been demonstrated in studies of track degradation. Andrade and Teixeira [7,8], used successive measurements within probabilistic frameworks to model the evolution of track geometry condition and associated uncertainty. More recent studies have employed machine-learning approaches to predict geometry degradation from historical inspection records [9,10,11], while multivariate approaches have been developed to account for relationships between different track geometry parameters [12]. These studies demonstrate that longitudinal inspection information can provide a more informative representation of track condition than an individual inspection. However, their principal emphasis is generally on degradation modelling or future-condition prediction rather than directly ranking currently observed defect locations for maintenance attention.
The use of inspection data for maintenance decision-making has also received increasing attention. Sharma et al. [13] developed a data-driven approach combining TQI, local geometry defects, deterioration modelling, and maintenance optimisation. Related research has examined maintenance limits and intervention strategies based on track geometry deterioration [14], while Zhao et al. [15] used successive geometry measurements to identify ballast degradation states and support maintenance decisions. Measurement-based approaches have also considered defect severity in identifying maintenance priorities [16]. Collectively, these studies demonstrate the potential of track inspection data to support condition-based maintenance. Nevertheless, for routine inspection applications, there remains a practical need for an interpretable approach that converts repeated defect records directly into location-level maintenance priorities without requiring long degradation histories or predictive model training.
Maintenance significance cannot be inferred from defect frequency alone. Locations repeatedly identified across inspections, those containing severe defects, or those exhibiting multiple defect types may warrant greater attention than locations with isolated or minor exceedances. Integrating defect severity, inspection recurrence, and defect diversity can therefore provide a more informative basis for maintenance prioritisation. The Ethio-Djibouti Railway (EDR), a 752 km electrified standard-gauge line in East Africa, provides the empirical basis for the present study. This study presents a data-driven approach for railway track maintenance prioritisation using three repeated dynamic inspection campaigns. The data are analysed to characterise temporal variation, defect severity and type, track quality, directional variation, and defect distribution and recurrence. A composite priority index (CPI) integrates weighted defect occurrence, inspection recurrence, and defect diversity to rank affected kilometre posts by relative maintenance priority. Equipment-quality indicators and field-identified problem locations are also examined as supporting information. The approach provides an interpretable means of identifying locations requiring further inspection or maintenance attention.
II. Study Area and Inspection Data
The EDR is a 752 km electrified standard-gauge railway connecting Ethiopia with the Port of Djibouti. The line comprises uplink and downlink tracks and carries both freight and passenger traffic. Repeated dynamic inspection data from the EDR were used to assess track condition and identify locations requiring maintenance attention. The data were obtained from three inspection campaigns conducted in July, August, and September. The combined dataset contained 6,977 defect records across 453 kilometre posts, comprising 1,111 records in July, 795 in August, and 5,071 in September. Each record included kilometre post, track direction, defect type, measured value, affected length, defect class, track element type, operating speed, and applicable inspection standard. Defects were classified as Class 1 or Class 2, with Class 2 representing the more severe condition. The dataset also included TQI measurements and exceedances, equipment-quality T-values, and field-identified problem locations. Table I summarises the inspection data used in the study.
III. Methodology
The three inspection datasets were processed using a common structure. Track directions and defect-type labels were standardised, numerical variables were converted to consistent formats, and records without valid direction or chainage information were excluded from the corresponding analyses. Field-problem chainages were converted to kilometre values, and defect records were aggregated by kilometre post for repeated-condition assessment. Temporal variation was assessed using defect counts by inspection, defect type, and severity class. Directional differences were evaluated for the uplink and downlink, while track condition was characterised using TQI statistics and TQI-overrun counts. Defect distribution along the railway was evaluated using 5 km chainage intervals. Inspection recurrence was defined as the number of campaigns in which a kilometre post contained at least one defect, giving values from 1 to 3. The number of distinct defect types at each kilometre post was used to represent defect diversity. These measures were combined with defect frequency and severity to calculate the CPI for maintenance ranking. For kilometre post \( i\) , the weighted defect score was defined as:
where N1,i and N2,i are the numbers of Class 1 and Class 2 defects, respectively. A weighting factor of three was assigned to Class 2 defects to give severe exceedances greater influence in the ranking while retaining the contribution of recurrent Class 1 defects. The weighting was used as a prioritisation parameter rather than as a standard-prescribed deterioration factor. The CPI was subsequently calculated as:
where Mi is the number of inspection campaigns in which defects were detected at kilometre post i, and Di is the number of distinct defect types recorded at that location. The multiplicative formulation increases the priority of locations characterised simultaneously by a high weighted defect score, repeated detection across inspections, and multiple defect types. All affected kilometre posts were ranked in descending order of CPI, with higher values indicating greater relative maintenance priority. The CPI was used as a comparative screening measure for prioritising locations for further inspection or maintenance rather than as a direct measure of physical deterioration or remaining service life.
Equipment quality T-values and field-identified problem locations were analysed separately from the CPI. T-value distributions were compared across the three inspection campaigns to provide an additional indicator of track condition. Field-identified problem locations were aggregated along the route using 10 km intervals to examine their distribution across the inspected line. These field observations were not incorporated into the CPI calculation and were retained as an independent source of operational information for comparison with the locations identified through the repeated dynamic inspection analysis.
IV. Results
A total of 6977 track geometry defects were identified across the three dynamic inspection campaigns, comprising 1111 defects in July, 795 in August and 5071 in September. As shown in Figure 1a, the number of detected defects initially decreased by 28.4% between July and August before increasing sharply in September. The September count was 6.4 times that recorded in August and 4.6 times the July count, indicating substantial variation in defect occurrence between successive inspections.
The severity distribution also varied considerably between inspections (Figure 1c). July contained the largest proportion of Class 2 defects, accounting for 27.6% of the classified defects, whereas Class 2 defects represented only 4.2% of the September observations. Consequently, the large September increase was predominantly associated with Class 1 defects rather than a corresponding increase in severe defects.
The distribution by defect type provides further explanation for this behaviour (Figure 1b). Lateral acceleration (LAT ACCEL) was the dominant defect, accounting for 4965 records, or 71.2% of all detected defects. LAT ACCEL increased from 285 records in July and 265 in August to 4415 in September, representing 87.1% of all September defects. Gauge rate, right surface and left surface defects were the next most frequently observed defect types, although their occurrence remained substantially lower. The September increase was therefore primarily associated with LAT ACCEL exceedances and was dominated overall by Class 1 defects rather than a general increase in severe defects.
Despite the substantial increase in individual defect records, the overall TQI remained relatively stable as shown in Figure 2a. Mean TQI decreased slightly from 8.93 in July to 8.60 in August and 8.56 in September. Thus, the sharp increase in defect occurrence in September was not accompanied by a corresponding deterioration in the mean TQI. The distribution of recorded defects also differed by track direction as shown in Figure 2b. In August, 577 defects were recorded on the downlink compared with 218 on the uplink, while the corresponding September counts were 3622 and 1449, giving downlink-to-uplink ratios of 2.65 and 2.50, respectively. July showed the opposite pattern, with 484 downlink and 627 uplink defects.
Defects were distributed across 453 unique kilometre posts, with clear concentrations along particular sections of the line (Figure 3). The 5-km distributions show that these concentrations varied between inspections, with KM 268 prominent in the July and August records and a broader concentration within KM 20–110 in September. Analysis at individual kilometre-post level identified KM 102, KM 27, KM 108, KM 93, and KM 97 among the locations with the highest cumulative defect counts. Of the 453 affected kilometre posts, 211 (46.6%) contained defects in all three inspections, while 310 were detected in at least two inspections, indicating substantial recurrence across the repeated campaigns.
The repeated inspection records were subsequently integrated using the CPI, incorporating the weighted defect score, recurrence across inspections, and number of distinct defect types. The resulting maintenance-priority ranking is shown in Figure 4. KM 26 received the highest CPI of 2904, followed by KM 268 with 2538. KM 54, KM 93, and KM 20 followed with CPI values of 1722, 1596, and 1488, respectively. Importantly, the CPI ranking differed from a ranking based solely on defect frequency. For example, KM 93 contained 123 defects compared with 68 at KM 268. However, KM 268 recorded 13 Class 2 defects, nine distinct defect types, and defects in all three inspections, resulting in a substantially higher maintenance priority. Similarly, KM 26 combined repeated occurrence, severe defects, and multiple defect types to produce the highest overall CPI. These results show that sections with the largest number of detected defects are not necessarily those requiring the highest maintenance priority when severity, recurrence, and defect diversity are considered simultaneously.
The equipment quality assessment and field observations provided additional condition information as shown in Figure 5. The distribution of T-values varied between inspection campaigns (Figure 5a), providing an additional measure of equipment-quality condition. Field-identified problem locations were also non-uniformly distributed along the railway, as shown in Figure 5b. These field observations were not included in the CPI calculation but provide an independent operational dataset against which the locations identified from repeated dynamic inspection can be compared.
V. Conclusion
This study presented a data-driven approach for railway track maintenance prioritisation using repeated dynamic inspection data from the Ethio-Djibouti Railway. Three inspection campaigns comprising 6,977 defect records across 453 kilometre posts were analysed to assess temporal variation, defect characteristics, track condition, and inspection recurrence. The results showed considerable variation between inspections, with September recording 5,071 defects, predominantly associated with lateral acceleration exceedances, while mean TQI remained relatively stable. Of the affected kilometre posts, 211 (46.6%) contained defects in all three inspections, highlighting the importance of considering recurrence alongside individual inspection results. The proposed CPI, integrating weighted defect occurrence, inspection recurrence, and defect diversity, identified KM 26, KM 268, and KM 54 as the highest-priority locations. The CPI ranking differed from that based solely on defect frequency, demonstrating that defect counts alone may not adequately represent relative maintenance priority. The approach provides a transparent and interpretable tool for identifying locations requiring further inspection or maintenance attention. However, the CPI represents a relative prioritisation measure rather than a direct assessment of physical deterioration. Further work should examine its sensitivity to weighting assumptions and validate the rankings against maintenance records and field observations.
Acknowledgments
The authors would like to thank the Ethio-Djibouti Railway Company for providing the data and supporting this research.
References
- Higgins, C.; Liu, X. Modeling of track geometry degradation and decisions on safety and maintenance: A literature review and possible future research directions. Proc. Inst. Mech. Eng. Part F J. Rail Rapid Transit 2018, 232((5)), 1385–1397. [Google Scholar] [CrossRef]
- Peinado Gonzalo, A.; Horridge, R.; Steele, H.; Stewart, E.; Entezami, M. Review of Data Analytics for Condition Monitoring of Railway Track Geometry. IEEE Trans. Intell. Transp. Syst. 2022, 23((12)), 22737–22754. [Google Scholar] [CrossRef]
- Adoh, L.U.; Akello, F.M.; Nyangassa, F.; Ishimwe, P. Prevention of Railway Accident using Arduino Based Safety System: A case Study of Addis Ababa Light Rail Transit. Int. J. Eng. Res. andTechnology 2019, 8((09)), 327–332. [Google Scholar]
- Adoh, L.U.; Mutswatiwa, L.; Akello, F.M. Safety Demonstration and Risk Management at Rail-Road Level Crossing at Addis Ababa Light Rail Transit Network. Int. J. Sci. Res. Sci. Eng. Technol. 2019, 6((5)), 103–109. [Google Scholar] [CrossRef]
- Soleimanmeigouni, I.; Ahmadi, A.; Kumar, U. Track geometry degradation and maintenance modelling: A review. Proc. Inst. Mech. Eng. Part F J. Rail Rapid Transit 2018, 232((1)), 73–102. [Google Scholar] [CrossRef]
- Safari Tarbozagh, A.; Mohammadzadeh, S.; Esmaeili, M.; Nadermohammady, S. Railway track geometry degradation: A review of prediction methods. Results Eng. 2026, 29, 109583. [Google Scholar] [CrossRef]
- Andrade, A.R.; Teixeira, P.F. ‘A Bayesian model to assess rail track geometry degradation through its life-cycle. Res. Transp. Econ. 2012, 36((1)), 1–8. [Google Scholar] [CrossRef]
- Andrade, A.R.; Teixeira, P.F. Statistical modelling of railway track geometry degradation using Hierarchical Bayesian models. Reliab. Eng. Syst. Saf. 2015, 142, 169–183. [Google Scholar] [CrossRef]
- Liao, Y.; Han, L.; Wang, H.; Zhang, H. Prediction Models for Railway Track Geometry Degradation Using Machine Learning Methods: A Review. Sensors 2022, 22((19)), 1–26. [Google Scholar] [CrossRef]
- Khajehei, H.; Ahmadi, A.; Soleimanmeigouni, I.; Haddadzade, M.; Nissen, A.; Latifi Jebelli, M.J. Prediction of track geometry degradation using artificial neural network: a case study. Int. J. Rail Transp. 2022, 10((1)), 24–43. [Google Scholar] [CrossRef]
- Wang, X.; Bai, Y.; Liu, X. Prediction of railroad track geometry change using a hybrid CNN-LSTM spatial-temporal model. Adv. Eng. Inform. 2023, 58, 102235. [Google Scholar] [CrossRef]
- Truong-Ba, H.; Rebello, S.; Cholette, M.E.; Reddy, V.; Borghesani, P. Bayesian multivariate track geometry degradation modeling and its use in condition-based inspection. Railw. Eng. Sci. 2026, 34((2)), 217–241. [Google Scholar] [CrossRef]
- Sharma, S.; Cui, Y.; He, Q.; Mohammadi, R.; Li, Z. Data-driven optimization of railway maintenance for track geometry. Transp. Res. Part C Emerg. Technol. 2018, 90, 34–58. [Google Scholar] [CrossRef]
- Khajehei, H.; Ahmadi, A.; Soleimanmeigouni, I.; Nissen, A. ‘Allocation of effective maintenance limit for railway track geometry’. Struct. Infrastruct. Eng. 2019, 15((12)), 1597–1612. [Google Scholar] [CrossRef]
- Zhao, W.; Qiang, W.; Yang, F.; Jing, G.; Guo, Y. Data-driven ballast layer degradation identification and maintenance decision based on track geometry irregularities. Int. J. Rail Transp. 2024, 12((4)), 581–603. [Google Scholar] [CrossRef]
- Ciotlaus, M.; Marcian, D.; Danciu, A.D.; Marusceac, V.; Dragomir, M.L.; Pau, G. In Situ Assessment of Track Geometry Degradation and Defect Scoring for Maintenance Prioritization: A Case Study on a Railway Section Line M300, Romania. Infrastructures 2026, 1–21. [Google Scholar] [CrossRef]
Figure 1.
Temporal characteristics of detected track defects: (a) total defect count, (b) distribution of principal defect types, and (c) defect severity distribution by inspection month.
Figure 1.
Temporal characteristics of detected track defects: (a) total defect count, (b) distribution of principal defect types, and (c) defect severity distribution by inspection month.
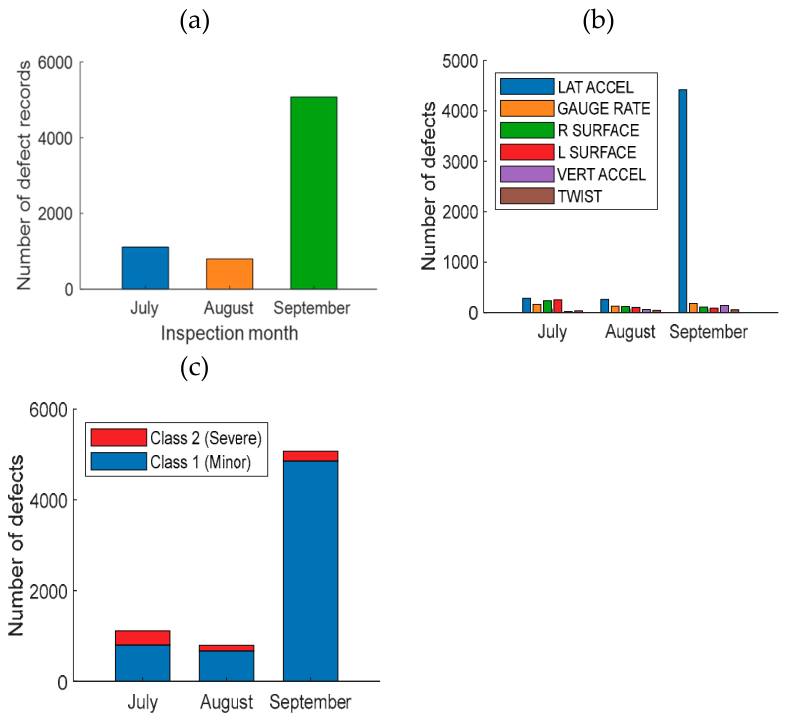
Figure 2.
Track condition and directional variation: (a) mean TQI with standard deviation and TQI-overrun segment counts and (b) defect counts by track direction.
Figure 2.
Track condition and directional variation: (a) mean TQI with standard deviation and TQI-overrun segment counts and (b) defect counts by track direction.
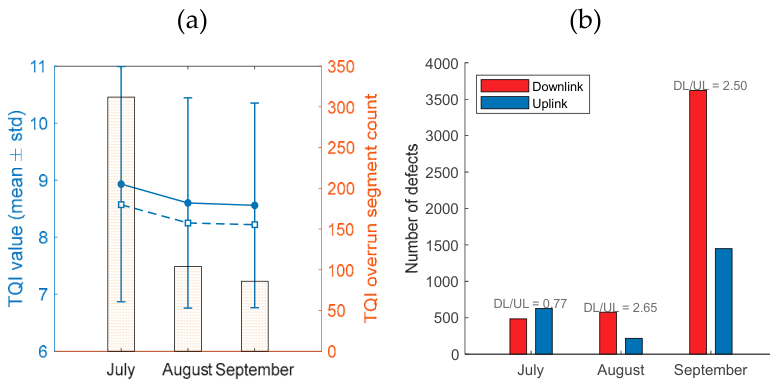
Figure 3.
Distribution of detected track defects along the railway line across the three inspection campaigns.
Figure 3.
Distribution of detected track defects along the railway line across the three inspection campaigns.
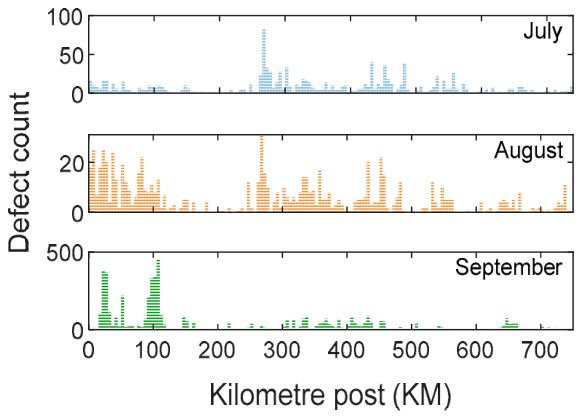
Figure 4.
Top 10 track sections ranked by the CPI.
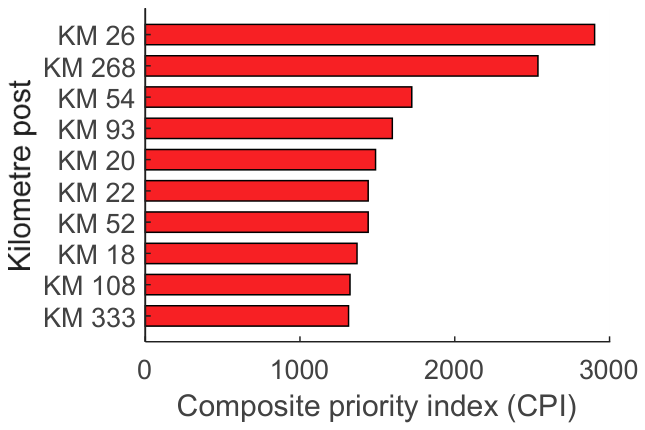
Figure 5.
Supporting track-condition indicators: (a) equipment-quality T-value distribution and (b) distribution of field-identified problem locations across repeated inspections.
Figure 5.
Supporting track-condition indicators: (a) equipment-quality T-value distribution and (b) distribution of field-identified problem locations across repeated inspections.
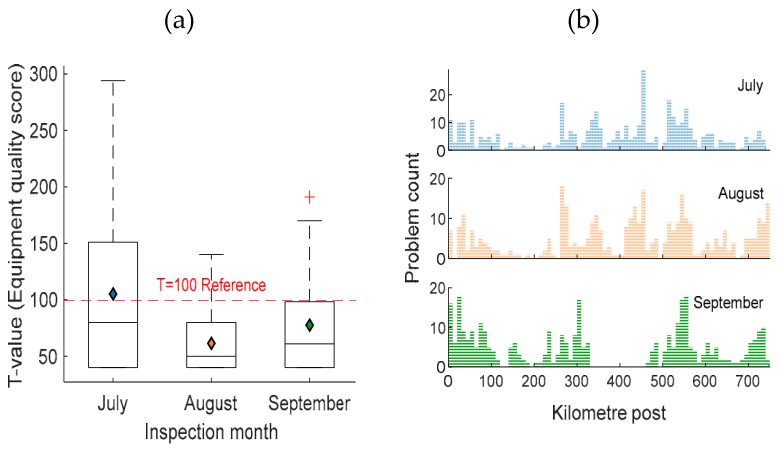

Table 1.
SUMMARY OF REPEATED DYNAMIC INSPECTION DATA.
| Parameter | July | August | September |
|---|---|---|---|
| Defect records | 1,111 | 795 | 5,071 |
| TQI records | 7,019 | 4,004 | 3,989 |
| Uplink defects | 627 | 218 | 1,449 |
| Downlink defects | 484 | 577 | 3,622 |
| Class 1 defects | 804 | 671 | 4,860 |
| Class 2 defects | 307 | 124 | 211 |
Disclaimer/Publisher’s Note: The statements, opinions and data contained in all publications are solely those of the individual author(s) and contributor(s) and not of MDPI and/or the editor(s). MDPI and/or the editor(s) disclaim responsibility for any injury to people or property resulting from any ideas, methods, instructions or products referred to in the content. |
© 2026 by the authors. Licensee MDPI, Basel, Switzerland. This article is an open access article distributed under the terms and conditions of the Creative Commons Attribution (CC BY) license (http://creativecommons.org/licenses/by/4.0/).
Copyright: This open access article is published under a Creative Commons CC BY 4.0 license, which permit the free download, distribution, and reuse, provided that the author and preprint are cited in any reuse.