
Submitted:
11 November 2026
Posted:
12 November 2026
You are already at the latest version
Abstract
The present study examined the relationships between soil properties and the biochemical composition of mulberry (Morus spp.) leaves at different growth stages in six gardens of Jorhat district, Assam, India. Surface and sub-surface soils were analyzed for pH, organic carbon and available nitrogen, phosphorus and potassium. Young, medium-mature and mature leaves were analyzed for total sugar, polyphenols, bound protein, free amino acids, soluble solids and crude fiber. Descriptive statistics, correlation heat-map and partial least squares regression were used to examine the data. Soil reaction was acidic, with mean pH values of 5.07 and 5.05 in the surface and sub-surface layers, respectively. Organic carbon was in medium range for both surface (0.54-0.78% with mean 0.67%) and sub-surface layer (0.51-0.69 with mean 0.61). available nutrients were also in medium range of availability. Mean total sugar content decreased from 10.82 g/kg in young leaves to 9.47 g/kg in medium-mature leaves and 2.80 g/kg in mature leaves. Free amino acid, crud fiber and total soluble solid contents decreased with leaf maturity, whereas, bound protein was found to be in decreasing trend from young leaves (mean content 2.08 g/kg) to medium matured leaves (mean content 1.65 g/kg), then increased slightly at maturity (mean content 1.77 g/kg). Total sugar in young leaves was positively correlated with available phosphorus and potassium at both soil depths. Organic carbon had the largest PLSR coefficients for most biochemical constituents, although the direction of the associations varied with leaf stage and soil depth. The results describe associations between soil properties and leaf biochemical composition within the sampled gardens rather than causal effects.
Keywords:
mulberry
; soil properties
; leaf growth stages
; total polyphenol
; free amino acid
; partial least square regression
1. Introduction
Soil physicochemical properties such as bulk density, pH, organic carbon (OC), and macro- and micronutrient availability play fundamental roles in plant growth and nutrient uptake. These properties also affect plant metabolic processes and biochemical composition [1]. Characterising these properties is also essential for developing crop-specific fertilizer recommendations [2]. An assessment of the existing soil fertility status is therefore a prerequisite for identifying nutrient limitations and formulating appropriate soil management strategies for sustainable crop production. This is particularly important for perennial crops such as mulberry (Morus spp.), which undergo repeated leaf harvesting throughout the year to meet the feed requirements of silkworms [3,4]. Under such production systems, maintaining soil fertility and quality is critical for sustaining leaf productivity and ensuring a continuous supply of nutritionally suitable foliage. Variations in soil properties can influence carbon assimilation, protein synthesis, amino acid metabolism, and the accumulation of secondary metabolites [5]. Consequently, investigating the relationships between soil characteristics and plant biochemical attributes is essential for understanding plant-soil interactions and their contributions to variation in plant composition [6].
Mulberry leaves constitute the principal and exclusive food source of the domesticated silkworm (Bombyx mori L.). The nutritional and biochemical composition of the mulberry leaves substantially influences larval growth, survival, cocoon characteristics, and silk production [7,8]. Improving mulberry leaf quality is therefore a key consideration in enhancing sericulture productivity [9]. Mulberry leaves contain a diverse range of primary metabolites, including proteins, amino acids, soluble sugars, and organic acids, as well as secondary metabolites such as phenolics, flavonoids, alkaloids, and terpenoids [10]. These compounds contribute to plant physiological functions and may influence the nutritional value, palatability, and suitability of leaves as silkworm feed [11]. The relative abundance of these constituents, rather than any single biochemical component, is important when assessing leaf quality in relation to silkworm nutrition and performance.
The biosynthesis and accumulation of plant metabolites are influenced by environmental conditions, particularly soil properties that regulate nutrient availability and the metabolic pathways associated with primary and secondary metabolism [12,13]. Differences in soil fertility and nutrient availability can alter metabolite production and composition, even within the same plant species [14]. In mulberry, balanced nutrient management, particularly the adequate supply of nitrogen, phosphorus, and potassium, has been associated with improved leaf biomass and changes in important biochemical constituents, with potential implications for leaf quality and silkworm nutrition [15,16]. In addition to soil-related influences, leaf developmental stage can also contribute to biochemical variation through changes in nutrient allocation, tissue structure, and metabolic activity. Evaluating biochemical attributes across young, medium-mature, and mature leaves may therefore provide insights into developmental variation in leaf composition and its potential association with soil nutrient availability and plant nutritional status [17].
Previous studies have investigated the relationships between soil chemical properties, plant physiological responses, and the accumulation of secondary metabolites under different cultivation conditions [18,19,20]. However, the relationships between soil physicochemical properties and the biochemical composition of mulberry leaves, particularly across different developmental stages, remain insufficiently characterised. Leaf maturity is also relevant to sericulture management because the nutritional composition and feeding suitability of leaves may vary with developmental stage and silkworm requirements. Kumar et al. reported higher protein, sugar, and moisture contents in young mulberry leaves than in medium and mature leaves across ten selected mulberry clones, suggesting potential differences in their nutritional suitability for silkworms [21] . Conversely, Nguyen et al. highlighted the potential use of medium-mature mulberry leaves to support cocoon productivity and quality and to improve the economic prospects of sericulture in Vietnam [10] . These findings indicate that the nutritional value of mulberry leaves should be considered in relation to both developmental stage and the specific requirements of silkworm rearing. Nevertheless, further investigation is needed to clarify how variations in soil physicochemical properties are associated with the biochemical attributes of mulberry leaves at different developmental stages, particularly under the soil and climatic conditions of northeastern India.
With this background, the present study was carried out to examine the relationships between soil chemical properties and the biochemical composition of mulberry leaves in Jorhat district, Assam. The specific objectives were to characterise the chemical properties of surface and subsurface soils and assess variations in selected biochemical constituents of young, medium-mature, and mature mulberry leaves. Further the relationships between soil properties and leaf biochemical constituents have been statistically examine to identify soil factors associated with differences in leaf quality. The findings are expected to provide a better understanding of soil-plant relationships in mulberry cultivation and a scientific basis for soil fertility management to sustain the production of nutritionally suitable leaves for sericulture.
2. Results
2.1. Soil Nutrient Status and Leaf Biochemical Responses Across Developmental Stages
Soil properties under mulberry cultivation showed homogenous variance for both surface and sub-surface soils (Table 1). Soil reaction is in acidic range for both surface (4.12-6.18 with mean 5.07) and sub-surface (4.25-5.86 with mean 5.05) soil which is preferred situation for mulberry cultivation. OC is mostly in medium range (0.54%-0.78% with mean 0.67%; 0.51%-0.69% with 0.61% for surface and sub-surface soil respectively) in both depth of soil. Low SE (0.04 and 0.03 for surface and sub-surface respectively) and low to medium coefficient of variation (CV) values (14.06% and 10.16% for surface and sub-surface respectively) indicates the homogenous nature of OC in the both the soil depth and true representation of the soil under mulberry cultivation. In case of nutrients (Table 1), available nitrogen (Av N), available phosphorus (Av P) and available potassium (Av K) are found to be in medium range in both the soil depth (Table 1) which shows decreasing trend with depth.
The metabolites of leaf varied considerably among leaf developmental stage (Table 2). Total Sugar (TS) content decreases with leaf growth stages (young leaf: 8.29-13.91 g kg-1 with mean 10.82g kg-1; medium growth leaf: 5.33- 12.94 g kg-1 with mean 9.47 gm kg-1; and matured leaf: 0.47-3.85 gm kg-1 with mean 2.80 gm kg-1) irrespective of location (Table 2). On the contrary, crude fibre (CF) found increasing with advancement of leaf maturity (young leaf: 9.84-22.74 gm kg-1 with mean 14.04 gm kg-1; medium matured leaf: 10.49-17.32 gm kg-1 with mean 14.07 gm kg-1; and matured leaf: 11.21-23.62 g kg-1 with mean 14.92 g kg-1). Other biochemical properties such as total polyphenol (TP), free amino acid (FAA) and total soluble solid (TSS) all shows decreasing trend with leaf aging (Table 2), but bind protein (BP) decreased from young leaf to medium matured leaf then again showed increasing value in matured leaf (Table 2). Higher variability (CV) indicates differences in soil properties, nutrient availability, and leaf developmental stage with precise mean estimates, but soluble solid values found stable irrespective of growth stages although in decreasing trend.
2.2. Correlation Between Soil Properties and Biochemical Attributes of Mulberry Leaves
The correlation analysis was presented in the form of heat-map (p=0.05) for better understanding (1a-1f). For surface soil, correlation heat map showed positive significant correlation for young mulberry leaves (Figure 1a-1c) with TP content and Av P (r = 0.67). TS content was also positively correlated with Av P (r = 0.74) and Av K (r = 0.68). CF exhibited significant positive correlations with OC (OC; r = 0.71) and Av N (N; r = 0.75). In contrast, FAA content showed significant negative correlations with soil pH (r = −0.62), OC (r = −0.67), and Av K (r = −0.64). In medium-aged leaves, BP content was significantly and negatively correlated (Figure 1a-1c) with Av P (r = −0.76) and Av K (r = −0.71). In matured leaves, TP content showed significant positive correlations with soil pH (r = 0.67) and Av P (r = 0.64), whereas BP content was negatively correlated with Av K (r = −0.76). CF content exhibited a significant positive correlation with soil pH (r = 0.72).
Figure 1.
Pearson Correlation heatmaps between different soil and biochemical parameters at young (a,d), medium-mature (b,e), and mature (c,f) leaf growth stages, respectively for surface soil (a,b,c) and sub-surface (d,e,f) soil condition. TP, total polyphenol; TS, total sugar; BP, bind protein; FAA, free amino acids; TSS, total soluble solid; CF, crude fibre; OC, soil organic carbon; Av N, available nitrogen; Av P, available phosphorus; Av K, available potassium.
Figure 1.
Pearson Correlation heatmaps between different soil and biochemical parameters at young (a,d), medium-mature (b,e), and mature (c,f) leaf growth stages, respectively for surface soil (a,b,c) and sub-surface (d,e,f) soil condition. TP, total polyphenol; TS, total sugar; BP, bind protein; FAA, free amino acids; TSS, total soluble solid; CF, crude fibre; OC, soil organic carbon; Av N, available nitrogen; Av P, available phosphorus; Av K, available potassium.
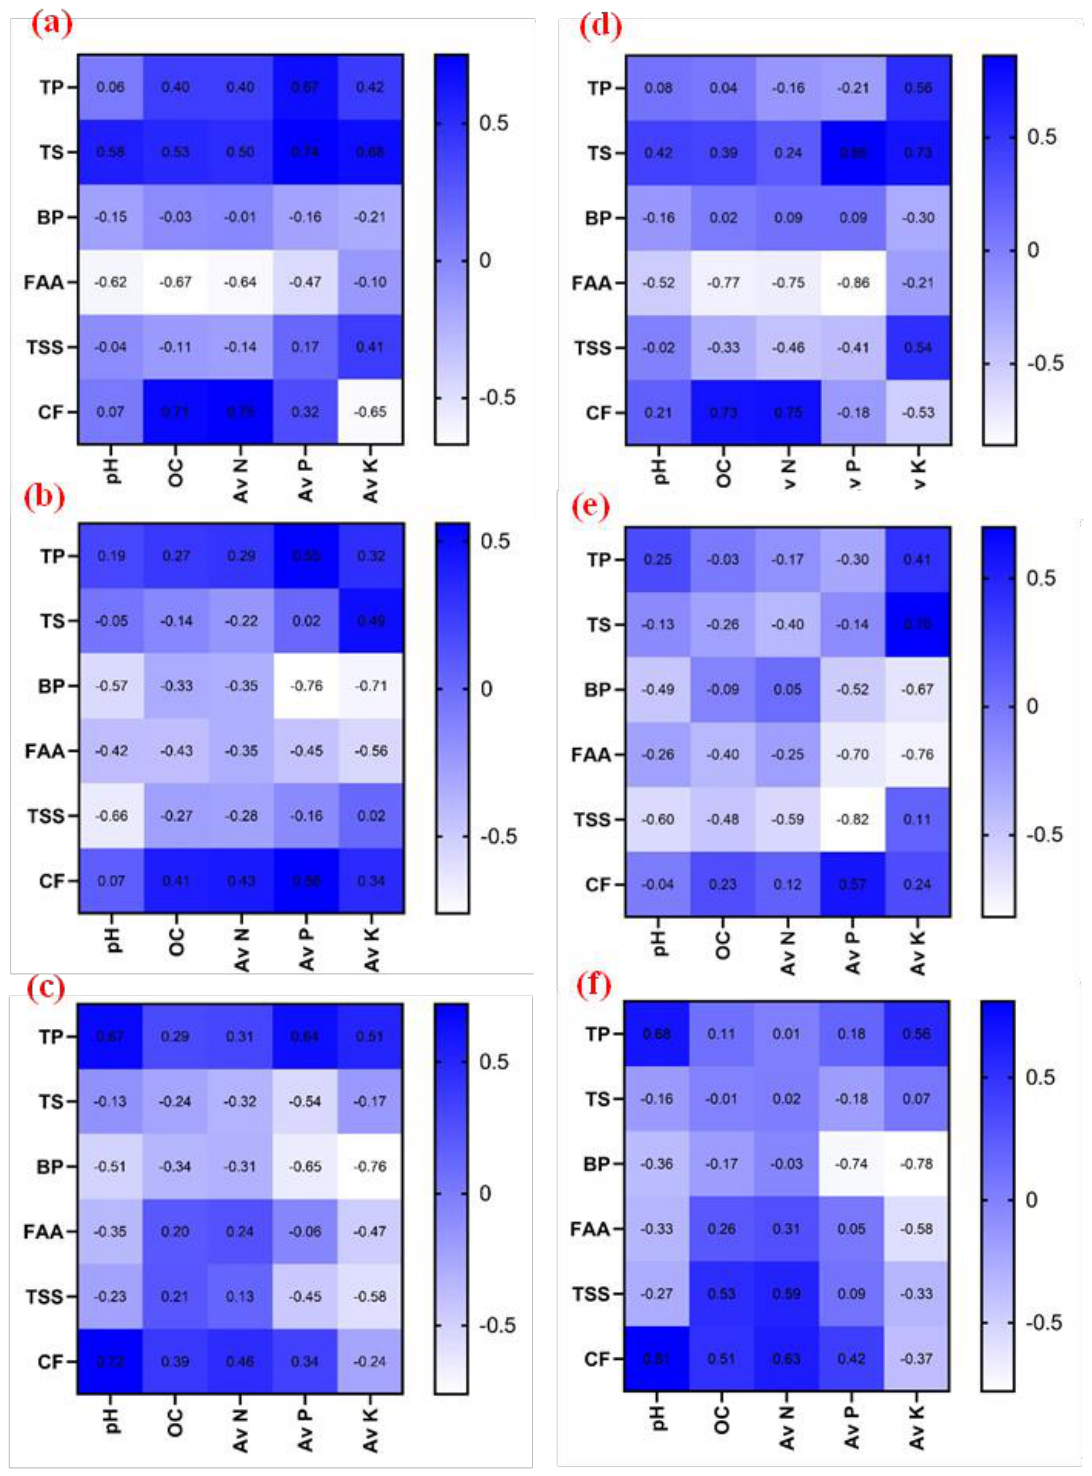
Scheme 1. d-1f) between young leaves with TS content and Av P (r = 0.86) and Av K (r = 0.73). CF content was positively correlated with OC (r = 0.73) and Av N (r = 0.75), whereas FAA content showed significant negative correlations with OC (r = −0.77), Av N (r = −0.75), and Av P (r = −0.86). In medium-aged leaves (Figure 1d-1f), TS content was significantly and positively correlated with Av K (r = 0.70), while BP and FAA contents were negatively correlated with Av K (r = −0.67 and −0.76, respectively). TSS content and FAA content also exhibited significant negative correlations with Av P (r = −0.82 and −0.70, respectively). In matured leaves, TP content showed a significant positive correlation with soil pH (r = 0.68). BP content was significantly and negatively correlated with Av P (r = −0.74) and Av K (r = −0.78), whereas CF content exhibited significant positive correlations with soil pH (r = 0.81) and Av N (r = 0.63).
2.3. Effect of Soil Properties on Plant Biochemical Metabolites
Partial Least Squares regression (PLSR) was employed to examine the relationships between soil chemical properties and leaf biochemical characteristics across different leaf developmental stages and soil depths. To explain the effect of soil properties on plant secondary metabolites partial least square regression (PLS) is carried out as the sample size is small (6nos). The Partial Least Squares Regression (PLSR) analysis classified the predictor (X) dataset, comprising surface soil (0-20cm) chemical properties, into five latent factors for all three mulberry leaf maturity stages (young, medium, and matured). The first latent factor explained 58.10%, 55.48%, and 53.36% of the total X variance for young, medium, and matured leaves, respectively (Figure 2). The cumulative variance increased to approximately 99% after the first four latent factors, while all five factors together accounted for 100% of the predictor variance, indicating that the selected latent factors adequately represented the variability in the surface soil properties.
For the response (Y) dataset for surface soil (0-20cm), representing mulberry leaf quality parameters, the first latent factor explained 25.90%, 25.95%, and 26.83% of the total variance for young, medium, and matured leaves, respectively (Figure 2). The cumulative variance explained by the first three latent factors reached 51.43%, 44.14%, and 50.77%, while all five latent factors explained 76.57%, 73.53%, and 81.03% of the total response variance, respectively. These findings indicate that the PLSR model effectively captured the relationships between surface soil chemical properties and mulberry leaf quality across different leaf maturity stages with all five latent variables. Root-mean press values indicated gradual declines indicating robustness of the model (Table S2a).
Almost similar trend was observed for the sub-surface (20-40 cm) soil dataset. The predictor (X) variables were also represented by five latent factors, with the first factor explaining 58.10%, 55.48%, and 42.70% of the total variance for young, medium, and matured leaves, respectively (Figure 3). The cumulative variance of the predictor dataset exceeded 98% within the first four latent factors and reached 100% after the fifth factor, indicating that most of the variability in the sub-surface soil properties was adequately summarized by a few latent components (Table S2b).
For the response (Y) variables for sub-surface (20-40) soil, the first latent factor explained 25.90%, 25.95%, and 21.86% of the variance in leaf quality parameters for young, medium, and matured leaves, respectively (Figure 3). The cumulative variance explained by the first four latent factors was 51.43%, 59.63%, and 69.37%, while all five latent factors accounted for 76.57%, 73.53%, and 93.97% of the total response variance, respectively.
The coefficients (Table 3a & 3b) of soil properties within the surface (0-20cm) soil, showed greater influence on mulberry leaf biochemical composition compared to sub-surface (20-40 cm). The roots mean press value of both surface and sub-surface soil decreased steadily with increase of latent variables indicating improvement in predictive accuracy of the model (Table S2a;S2b). The regression co-efficient of PLS showed stronger influence of surface soil properties on plant biochemical character compared to sub-surface soil. OC exhibited largest regression co-efficient across most plant biochemical properties for both surface and sub-surface soil. Highest coefficient (negative) was observed for CF (-527.27) against OC for medium growth leaf (Table 3a) followed by BP (-357.46) for young leaf under surface soil; whereas, for sub-surface soil, highest coefficient (positive) was observed for medium leaf for CF (422.09) which is followed by negative coefficient for TS (-287.64) for matured leaf (Table 3a).
Av 3. a;3b). Highest coefficient (negative) was observed for crud fibre (-6.46) for medium growth leaf followed by again negative coefficient (-4.76) for BP for surface soil. But for sub-surface soil, highest coefficient against Av P was recorded for CF (2.38) of medium growth leaf, followed by TS (-1.14) again for medium growth leaf. Other soil properties such as soil reaction (pH) have small effect on most of the biochemical properties for both surface and sub-surface soil, but the effect seems better for sub-surface compared to surface soil. The highest coefficient of pH (4.62) was recorded for CF under sub-surface soil, followed by negative coefficient (-3.79) for soluble solid (Table 3b). Av N and Av K both have weak direct and indirect effect on plant biochemical properties (Table 3a;3b).
3. Discussion
Descriptive statistics, correlation heat-map, and PLSR were used complementarily to characterise the dataset, identify individual soil-leaf associations, and examine the integrated relationships between soil predictors and multiple biochemical responses. This combined analytical framework provided a more comprehensive basis for interpreting variations in mulberry leaf biochemical composition in relation to soil chemical properties.
3.1. Soil Properties Under Mulberry Plant
Mulberry is a heavy feeder and demand continuous supply of nutrients as its leaves are harvested multiple times throughout the year. Soils from mulberry garden both surface and sub-surface of the district found to be in strongly acidic range (Table 1) which is congenial for mulberry cultivation (Table 1) as it can withstand pH up to 5.0 [22], but strongly acidic condition might cause starvation in mulberry crop due to slow nitrification of NH4+ to NO3- (a N-form assimilated by mulberry plant) due to poor microbial activity at such a low pH and can also suffer from aluminium toxicity [15,23]. Mulberry is a heavy feeder and demand continuous supply of nutrients as leaves are harvested multiple times throughout the year [16]. Level of OC help in maintaining the optimum supply of nutrients to mulberry. Soils have moderate to high level of OC (Table 1) for surface soil and low to moderate level for sub-surface soil. The higher OC content observed in the samples might be ascribed to the possible accumulation of organic matter in the surface soil, whereas, low OC indicates the need of rejuvenating soil carbon and health in these gardens as the soil OC content is crucial for deep-rooted mulberry plants. Lower level of OC in sub-surface soil indicates lower microbial activities [15]. Soil showed medium availability of Av N and Av P, indicating infiltration or seepage accompanied by water movement [24]. Nitrogen that infiltrated to deeper soil may further leached down, ultimately resulting in groundwater pollution [25] whereas, phosphorus primarily tends to be lost through surface runoff rather than leaching which also indicates poor soil management and lack of awareness among the farmers regarding scientific soil management practices [26] . But soils of mulberry gardens showed medium to high level of Av K in sub-surface soil than surface soil, which can be due to removal by crops from the surface soil and leaching and accumulation in the subsurface soil containing higher amount of clay or any other binding material (eg; sesquioxides, OC etc) [27]
3.2. Biochemical Properties of Mulberry Leaves
TS content varies across the leaf levels, with the young leaves containing the highest TS levels (Table 2), potentially reflecting metabolic differences related to photosynthate transport [28,29]. FAA content decreases from young leaves to matured leaves (Table 2). The minimum level of protein content can be used to their classification as carbohydrate-rich food sources for the silk-worm. The FAA values observed is in agreement with and it is an indication that Mulberry leaves can be of food value in man, silkworm and animal [30] .
TP compounds are key indicators of the functional and nutritional properties of plant materials and are commonly used to assess their biochemical quality. The data reveals that the leaves, particularly the matured and young ones (Table 2), exhibit the highest bioactivity indicating better sunlight exposure which might have promoted a better synthesis of polyphenol critical to antioxidant potential [31]. The CF content data of mulberry leaves showed increase from young leaves to matured leaves (Table 2). Low fibre in young leaves results in higher moisture, TSS, and BP making them ideal for early-instar silkworms [32]. TSS in mulberry leaves fluctuate significantly across growth stages, presenting a distinct developmental curve. Data showed that TSS decreases from young leaves up maturity indicating the biomolecules converting into structural carbohydrates like starch, biomass, and fibre etc [33]. The BP level in leaves decreased from the young leaf to the medium matured leaf, then increase again in the fully matured leaf-reflects the changing physiological demands and endoplasmic reticulum (ER) stress levels across a leaf’s life cycle [34].
3.3. Effect of Soil Properties on Plant Biochemical Metabolites
Correlation heatmap was used to determine the direction and strength of associations between soil chemical properties and mulberry leaf biochemical attributes. However, correlation heatmap alone cannot adequately characterise the combined relationships between multiple interrelated soil predictors and several biochemical response variables. Therefore, a multivariate approach was required to investigate the integrated relationships between soil properties and leaf biochemical composition. Partial least squares regression (PLSR) was selected because of its ability to model multiple response variables using a set of potentially highly correlated predictors. PLSR extracts latent variables from the predictor matrix (X) that maximise their covariance with the response matrix (Y), thereby enabling the analysis of complex relationships under multicollinearity. The PLSR model accurately predicted the main data variance while keeping its parameters stable and aligned with the latent projections [35] . PLSR was employed to reduce the predictor information into a smaller number of latent components while retaining information relevant to the response variables. This proves that the similarity between the parameters and latent factors is a natural feature of the data structure, not just random noise. This approach was considered suitable for exploring the multivariate relationships between soil chemical properties and mulberry leaf biochemical attributes across soil depths and leaf developmental stages.
The PLSR model in this study was well fitted to the resultant data and successfully predicted the established Y responses (eg; TS, CF, BP etc). The cumulative variance explained for both predictor variables (X) and response variables (Y) increased rapidly with the first few latent variables before approaching saturation [36]. More than half of the total variance was explained efficiently by the first three latent factors (Figure 3 and Figure 4) for both surface and sub-surface soil. The comparatively lower variance explained by the initial response components, relative to the predictor dataset, suggests that mulberry leaf biochemical traits are governed by multiple interactions of soil properties rather than by a few dominant variables [37]. The mature leaf model generally exhibited higher cumulative variance than model for young and medium leaves, indicating stronger soil-plant relationships at later developmental stages [38]. The coefficients of PLSR (Table 3a & 3b) can quantify the direction and magnitude of influence of soil variables on each biochemical trait of mulberry leaves. For surface soil, OC exhibited the strongest positive association with TS in young, medium and matured leaves of mulberry, whereas increasing OC negatively influenced TP, TSS and CF in young leaves, which might be due to increase of root-zone respiration and nutrient transport resulting in higher TS accumulation in younger leaves [31]. On the other hand, soil pH of surface soil showed negative effects on most biochemical variables for young leaves (Table 3a), indicating that increasing acidity may not be favourable in accumulation of several quality parameters in younger leaves. But in matured leaves soil pH positively influenced CF but negatively affected protein accumulation which might be due to the age factor favouring accelerated fibrous growth [39] and net drop in the percentage of protein in matured leaves.
Table 3. b) also identified OC as the major explanatory variable influencing mulberry leaf quality, although its effects were generally weaker than those observed for surface soil. Av N and Av P showed moderate contributions, whereas potassium and pH exerted relatively small effects on most biochemical parameters. These findings suggest that nutrient availability within the surface rooting zone has greater influence on mulberry leaf biochemical composition than nutrients stored in deeper soil layers. The PLSR analysis demonstrates that OC is the most influential predictor of mulberry leaf biochemical quality, followed by Av P and N [40]. Surface soil properties explained a larger proportion of variation and produced more accurate prediction models than sub-surface soil, highlighting the nearly 70–80% of active feeder roots of mulberry which occur within the upper 20 cm soil layer, where nutrient uptake and microbial activity are highest [41]. Consequently, changes in OC and nutrient availability in the surface soil are reflected more readily in leaf biochemical composition than changes occurring in deeper soil layers. Nevertheless, given the limited sample size, the PLSR results were interpreted primarily as exploratory evidence of soil-leaf biochemical relationships rather than as definitive estimates of predictive performance.
4. Materials and Methods
4.1. Chemicals
All chemicals used were of standard analytical grade. Ammonium acetate (≥97%), ammonium fluoride (≥98%), ammonium molybdate tetrahydrate (≥98%), anthrone (≥99.9%), diphenylamine (≥99%), copper sulphate (≥99.9%), gallic acid (≥98%), glucose (≥99.9%), glycine (≥99.5%), methyl red, ninhydrin, orthophosphoric acid (≥85%), potassium dichromate (≥99.9%), potassium dihydrogen phosphate (≥99%), sodium carbonate (≥99.5%), sodium hydroxide (≥97%), sodium potassium tartrate (≥99%), stannous chloride (≥98%), sulphuric acid (≥98%), and trichloroacetic acid (≥99.5%) were purchased from SRL Pvt. Ltd., India. Acetone, hydrochloric acid (≥35%), methanol, and petroleum ether were purchased from CDH Pvt. Ltd., India. Folin-Ciocalteu phenol (FCP) reagent (LR) and bovine serum albumin (≥98%) were procured from HiMedia Laboratories, India. Ethanol was purchased from a local supplier and used after distillation using a rotary evaporator.
4.2. Instrumentation
The optical absorbance of liquid samples was measured using a Varian-made UV-Visible spectrophotometer (Model: Cary 60). pH measurement was carried out using a Mettler-Toledo digital pH meter (Model: SevenDirect SD20) calibrated using pH 4.2, 7.0 and 9.2 buffer tablet from SRL India. Soil organic matter (SOM) was determined using a Shimadzu carbon analyser (Model: SSM-5000A). A KEL PLUS automatic nitrogen analyser (Model: ELITE EX VA) was used to determine available nitrogen (AN). A Systronics flame photometer (Model: 1027) was used to determine available potassium (AK). A Millipore Milli-Q Synthesis (Merck, Germany) water purifier was used to obtain the water required for different experiments.
4.3. Site Description and Sample Collection
The study area is located at 26° 45′ 28″ N latitude and 94° 12′ 35″ E longitude, bounded by the Brahmaputra on the north, Nagaland on the south, Sivasagar on the east, and Golaghat on the west. The total geographical area of Jorhat district is 2,859.35 sq km, which is equivalent to 3.63% of the state. The average annual temperature in Jorhat remains at 26 °C. Summer temperatures in Jorhat range from 25-35 °C, and winter temperatures range from 10-22 °C. The soils of the study area are mostly alluvial soils developed from the deposits of the Brahmaputra River and its tributaries. The soil textures mostly range from silt loam to clay loam, and the soils are well-drained.
Randomized georeferenced (Table S1) soil samples both from surface (0-20 cm) and sub-surface (20-40 cm) layers were collected using auger from six (6) systematic and scientifically maintained mulberry gardens in Jorhat district (Figure 4) during December-January’ 2025. The gardens don’t have similar nutrient management system as they are maintained by separate individual (Farmers). Representative samples were collected, packed, tagged and bought to laboratory for further processing. In laboratory, soils were air dried, then hammered to break big clods and sieved using 2.0 mm sieve. Then samples were packed in the polythene bags with the tag for different laboratory analysis.
Along 5. plants (then complied to one) from each of the six mulberry gardens (variety V1) based on growth stages (young, medium-matured, and matured leaves). The selection of leaves was based on their position on the branch, colour, texture, and size. The top 1st to 3rd leaves were considered young leaves, leaves from the middle section of the branch (4th to 7th) were considered medium-matured leaves, and leaves at the base of the branch (8th and below) were considered matured leaves (Figure 5). The leaf samples were immediately kept in a Thermobox with a cryogel pack to stop any enzymatic activity and maintain the native biochemical status of the leaves. After the leaf samples were received at the laboratory, enzymatic activity was stopped by treating them in a microwave oven for 2 min, followed by drying in a hot-air oven at 60° C overnight. Dried leaf samples were ground, passed through a 500-micron sieve, sealed in silver foil packets to prevent light exposure, and kept at -20° C before analysis. Soil samples were air dried (under shed), powdered and passed through 2 mm sieve and packed in airtight bags for analysis.
4.4. Determination of Soil pH
Soil pH was measured in a soil-water suspension prepared at a ratio of 1:2.5 (w/v) [42]. About 10 gm of soil was taken in a 100 mL beaker mixed with 25 mL distilled water and the suspension was shaken for 30 min to ensure thorough mixing of the soil and water before pH measurement.
4.5. Determination of Soil Organic Carbon
The OC content of the soil was estimated by the chromic acid wet digestion method [43,44] . About 0.5 g of finely ground soil was taken in a 250 mL conical flask and treated with 10 mL of 1 N potassium dichromate solution and 10 mL of concentrated H2SO4 (98%, v/v). The mixture was left for 30 min or until effervescence ceased. A standardisation blank without soil was prepared in the same way. After 30 min, about 200 mL of distilled water, 10 mL of orthophosphoric acid, and about 1 mL of diphenylamine indicator were added. The burette was filled with 0.5 N ferrous ammonium sulphate (FAS) solution, and the mixture was titrated until the colour changed to dark green. The initial and final burette readings were recorded. The process was repeated twice more, and each sample was analysed in triplicate.
4.6. Determination of Available Nitrogen
The Av N in the soil was determined by the alkaline KMnO4 method [44] . About 20 g of soil was placed in the distillation flask of a Kjeldahl distillation set, to which 20 mL of water and 1.0 mL of 0.32% KMnO4 solution were added, and the flask was tightly stoppered. Meanwhile, 25 mL of N/50 H2SO4 was pipetted into a conical flask, and 2-3 drops of methyl red indicator were added. The end of the delivery tube of the distillation set was immersed in this solution. The machine was then set to slowly add 25 mL of 2.5% NaOH solution to the distillation flask. The ammonia gas was distilled and collected in the H2SO4 solution. Distillation was continued until ammonia evolution ceased completely. This was checked by bringing moist litmus paper near the outlet of the condenser, which turned blue as long as ammonia was being evolved. The excess H2SO4 was titrated against N/50 NaOH, and the volume of NaOH used was recorded. The end-point was reached when the colour changed from pink to yellow.
4.7. Determination of Available Phosphorus
The Av P in the soil was determined by Bray’s I method [45]. About 5 g of soil was transferred to a 100 mL conical flask, and 50 mL of the extracting solution (0.03 N NH4F + 0.025 N HCl) was added. The flask was placed in a vertical shaker for 5 min, and the suspension was filtered through Whatman No. 42 filter paper until a clear filtrate was obtained. A blank without soil was prepared in the same way using all the reagents. After filtration, about 5 mL of the soil extract was taken in a 25 mL volumetric flask, and 5 mL of Dickman and Bray’s reagent was added. The contents were mixed thoroughly, and about 5-10 mL of distilled water was added by washing down the neck of the flask to remove any adhering ammonium molybdate. Finally, 1 mL of the working SnCl2 solution was added with immediate mixing, and the volume was made up to the mark with distilled water. The solution was mixed thoroughly again, and the intensity of the blue colour was measured using a spectrophotometer at a wavelength of 660 nm after 10 min. The concentration of Av P was then determined from the standard curve with the formula y=0.3199x+0.0018; R2= 0.9929.
4.8. Determination of Available Potassium
Av K in the soil was extracted using neutral normal NH4OAc [46,47]. About 5 g of soil was transferred to a 150 mL conical flask, and 25 mL of neutral 1 N NH4OAc solution was added. The flask was placed in a horizontal shaker for about 5 min, and the suspension was filtered through Whatman No. 40 filter paper. Potassium standards at concentrations of 40, 80, and 100 ppm were prepared using KCl. The standards were first introduced into the flame photometer for calibration, followed by the sample extracts. The readings were recorded in ppm and then converted to kg/ha.
4.9. Determination of Total Sugar
TS in the leaf samples was measured following the Yemm and Willis spectrophotometric method with slight modifications [48]. A 50 mg of powdered leaf sample was taken in a centrifuge tube and then washed with 10 mL of acetone. It was then sonicated for 2 min, followed by centrifugation for 3 min at 10,000 rpm, and the supernatant was discarded. The above process was repeated twice. The solid pellet was extracted with 2.5 mL of 80% ethanol, incubated at 70 °C for 10 min, and centrifuged for 3 min at 10,000 rpm. The supernatant was collected in a 25 mL volumetric flask. The extraction process was repeated once more, and the volume was made up with water. From the volumetric flask, 1 mL was pipetted into a test tube, and 4 mL of anthrone reagent was added. The mixture was incubated at 90 °C for 11 min and rapidly cooled to room temperature. It was then vortexed, and the absorbance was measured using a UV spectrophotometer at a wavelength of 625 nm. The concentration of total sugar in the sample was calculated from a calibration curve prepared using glucose standards at concentrations of 1000, 2000, 3000, 4000, and 5000 ppm, following the same procedure (y = 0.0526x -0.0539; R2 = 0.9727).
4.10. Determination of Total Polyphenol
The TP content in the leaf samples was measured by a spectrophotometric method using FCP reagent. A 100 mg powdered sample was taken in a centrifuge tube with 10 mL of 70% methanol and incubated in a hot-water bath at 70 °C for 10 min, followed by centrifugation for 3 min at 10,000 rpm. The supernatant was transferred to a 25 mL volumetric flask. The process was repeated twice, and the volume was made up to the mark with water. From the 25 mL volumetric flask, 0.5 mL was transferred to a test tube, and 2.5 mL of 10% FCP reagent was added and mixed, followed by the addition of 2 mL of 7.5% sodium carbonate solution. The test tube was vortexed and kept in the dark for 1 hour, and the absorbance was measured using a UV spectrophotometer at a wavelength of 765 nm. The concentration of TP in the sample was calculated from a calibration curve prepared using gallic acid standard solutions at concentrations of 50, 100, 150, 200, and 250 ppm, following the same procedure (y = 0.0112x -0.349; R2 = 0.9999).
4.11. Determination of Bind Protein
The BP content in the leaf samples was measured following Lowry’s method with slight modifications [49] . A 100 mg sample of ground mulberry leaves was taken in a centrifuge tube. Then, 20 mL of 80% ethanol was added, and the sample was incubated for 5 min at 70 °C, followed by sonication for 5 min. It was then centrifuged for 10 min at 10,000 rpm, and the supernatant was discarded. The pellet was suspended in 10 mL of 10% TCA for 30 min and again centrifuged for 10 min at 10,000 rpm. The pellet was then suspended in 10 mL of 5% TCA, sonicated for 3–5 min, and again centrifuged for 10 min at 10,000 rpm. The protein precipitate was dissolved in 2.5 mL of 1 N NaOH. It was incubated for 30 min at 70 °C, followed by centrifugation for 3 min, and the supernatant was transferred to a 25 mL volumetric flask. The volume was made up with distilled water. From the 25 mL volumetric flask, 1 mL was taken in a test tube, and 5 mL of alkaline copper reagent was added. Each sample was analysed in triplicate. The mixture was vortexed and kept at room temperature for 10 min. After that, 0.5 mL of FCP reagent was added, and the absorbance was measured using a UV spectrophotometer at a wavelength of 750 nm. The concentration of BP in the sample was calculated from a calibration curve prepared using bovine serum albumin standard solutions at concentrations of 20, 40, 60, 80, and 100 ppm, following the same procedure (y = 0.002x + 0.013; R2 = 0.998).
4.12. Determination of Free Amino Acid
The FAA content in the leaf samples was measured by a spectrophotometric method using ninhydrin. A 100 mg sample of ground mulberry leaves was taken in a centrifuge tube with 10 mL of petroleum ether and sonicated for 2 min, followed by centrifugation for 3 min at 10,000 rpm. The supernatant was discarded, and the process was repeated once more. The pellet was extracted with 5 mL of 70% ethanol, incubated for 10 min at 70 °C, and centrifuged for 3 min at 10,000 rpm. The supernatant was transferred to a 10 mL volumetric flask. The extraction process was repeated once more, and the volume was made up with 70% ethanol. From the volumetric flask, 1 mL was transferred to a test tube, and 5 mL of ninhydrin solution was added. The mixture was incubated for 20 min at 70 °C with the cap closed. It was allowed to cool to room temperature, and the absorbance was measured using a UV spectrophotometer at a wavelength of 570 nm. The free amino acid content in the sample was calculated from a calibration curve prepared using glycine standard solutions at concentrations of 50, 100, 150, 200, and 250 ppm, following the same procedure (y = 0.013x + 0.010; R2 = 0.989).
4.13. Determination of Crude Fibre
A 2.0 g sample of ground leaves was placed in a conical flask with 200 mL of 1.25% (w/v) sulfuric acid and boiled for 30 min under reflux on a hot plate. The residue was filtered through Whatman 41 filter paper, washed with hot water, and transferred back to the flask. The process was repeated using 1.25% (w/v) sodium hydroxide in place of the acid. The insoluble residue was transferred to a pre-weighed sintered crucible (porosity No. 1, P160) using boiling water, washed sequentially with ethanol and acetone, and dried in a hot-air oven at 103 ± 2 °C until a constant weight was obtained. The CF content was calculated from the difference in weight.
4.14. Determination of Total Soluble Solid
A 2.5 g sample of ground leaves was weighed into a 250 mL conical flask. Then, 100 mL of water was added, and the flask was fitted with an air condenser and heated to boiling on a hot plate. After 1 hour, the solution was cooled to room temperature and filtered into a 250 mL volumetric flask, and the volume was made up with distilled water. From the volumetric flask, 50 mL of the solution was pipetted into a previously weighed bowl and allowed to dry in a water bath. The bowl was then kept in a hot-air oven at 103 ± 2 °C until a constant weight was obtained. The TSS content was calculated from the difference in weight.
4.15. Data Processing Statistical Analysis
Data management and processing was performed using Microsoft Excel. All results were reported as the ‘mean± standard deviation (SD)’ of three technical replicates. The statistical analysis such descriptive statistics, partial least square regression (PLSR) was performed using Microsoft Excel and Origin 2019b respectively and correlation heatmaps was drawn using GraphPad Prism 8.0.2 software.
5. Conclusions
The study highlights the intricate relationships between soil chemical properties and mulberry leaf biochemical attributes using PLSR. TS content decreased with leaf maturity along with BP and FAA contents. TS of mulberry leaves in all the developmental stage was strongly associated with OC, Av P and Av K at both soil depths. The findings demonstrate that soil OC, alongside available nitrogen and phosphorus, were primary driver of the nutritional and functional quality of mulberry leaves across developmental stages. The soil of both layers behaves differently, surface soil showing significantly stronger influence on leaf biochemical composition compared to sub-surface layers. While acidic conditions and nutrient dynamics present challenges such as leaching and slow nitrification, the PLSR models successfully mapped these complex soil-plant interactions. Instead of focusing on limited data, these findings show that better soil management, specially building up organic carbon, is essential for growing high-quality mulberry leaves for silkworms, animals, and human use.
Supplementary Materials
The following supporting information can be downloaded at the website of this paper posted on Preprints.org; Table S1: Sample tag code with their corresponding location and depth; Table S2a: Explained variations for X variable and Y respaces for surface soil; Table S2b: Explained variations for X variable and Y respaces for sub-surface soil.
Author Contributions
R.B.- Conceptualization, Methodology, Software, Validation, Formal Analysis, Investigation, Data Curation, Visualization, Writing – Original Draft, Review & Editing; P.P.S.- Methodology, Software, Validation, Formal Analysis, Investigation, Data Curation, Visualization, Writing – Original Draft, Review & Editing; A.B.- Methodology, Formal Analysis, Investigation, Data Curation, Visualization; P.D.- Methodology, Formal Analysis, Investigation, Data Curation, Visualization; A.S.- Methodology, Formal Analysis, Data Curation; Z.R.- Methodology, Formal Analysis, Data Curation. All authors have read and agreed to this version of the manuscript.
Institutional Review Board Statement
Not applicable.
Informed Consent Statement
Not applicable.
Data Availability Statement
The original contributions presented in this study are included in the article/Supplementary Materials. Further inquiries can be directed to the corresponding authors.
Acknowledgments
The authors acknowledge the use of ChatGPT (OpenAI; https://chat.openai.com) as a language-support tool during the preparation and revision of the manuscript, particularly for improving academic English, clarity, and coherence of the text only. The author confirms that all scientific content, data analysis, interpretation of results, and conclusions are entirely his own responsibility. ChatGPT was accessed on 9 November 2026.
Conflicts of Interest
The authors declare no known competing financial interests or personal relationships that could have appeared to influence the work reported in this paper.
References
- Todkar, R.; Bhusari, R.; Nathjogi, A.; Sadakal, O.; Holkar, S. Effect of Foliar Application of Different Sources of Nutrients on Growth of Jambheri Seedlings in Secondary Nursery Stage. Int. J. Adv. Biochem. Res. 2025, 9, 220–222. [Google Scholar] [CrossRef]
- Sumithra, S.; Ankalaiah, C.; Janardhana Rao, D.; Yamuna, R.T. A Case Study on Physico - Chemical Characteristics of Soil around Industrial and Agricultural Area of Yerraguntla, Kadapa District, A. P, India. Int. J. Geol. Earth Environ. Sci. 2013, 3, 28–34. [Google Scholar]
- Rafiqui, A.R.; Khan, I.L.; Mir, M.R.; Sofi, J.A.; Chesti, M. ul H.; Nazir, N. Influence of Organic Nutrient Management on Growth and Yield Attributes of Mulberry (Morus Spp.) under Temperate Conditions. Int. J. Adv. Biochem. Res. 2026, 10, 622–628. [Google Scholar] [CrossRef]
- Purad, B.S.; K, P.; R, N.K.; Lokesh, P.; NL, S.; S, M.; S, S.; R, J. Integrated Nutrient Management in Tropical Mulberry Gardens: Recycling Sericulture Waste for Soil Health Sustainability. Int. J. Res. Agron. 2026, 9, 94–101. [Google Scholar] [CrossRef]
- Chaouqi, S.; Moratalla-López, N.; Alonso, G.L.; Lorenzo, C.; Zouahri, A.; Asserar, N.; Haidar, E.M.; Guedira, T. Effect of Soil Composition on Secondary Metabolites of Moroccan Saffron (Crocus Sativus L.). Plants 2023, 12, 711. [Google Scholar] [CrossRef] [PubMed]
- Scavo, A.; Abbate, C.; Mauromicale, G. Plant Allelochemicals: Agronomic, Nutritional and Ecological Relevance in the Soil System. Plant Soil 2019, 442, 23–48. [Google Scholar] [CrossRef]
- Rohela, G.K.; Shukla, P.; Muttanna; Kumar, R.; Chowdhury, S.R. Mulberry (Morus Spp.): An Ideal Plant for Sustainable Development. Trees For. People 2020, 2. [Google Scholar] [CrossRef]
- Ranganatha, K.; Vinoda, K.S.; Hanumanthappa, D.C.; Chethan, M.N.; Banuprakash, K.G. Influence of Hydrogel and Graded Levels of Fertigation on Soil Nutrient Status and Biochemical Compositions of Mulberry. Int. J. Plant Soil Sci. 2026, 38, 11–21. [Google Scholar] [CrossRef]
- Muzamil, A.; Tahir, H.M.; Ali, A.; Bhatti, M.F.; Munir, F.; Ijaz, F.; Adnan, M.; Khan, H.A.; Abdul Qayyum, K. Effect of Amino Acid Fortified Mulberry Leaves on Economic and Biological Traits of Bombyx Mori L. Heliyon 2023, 9. [Google Scholar] [CrossRef] [PubMed]
- Nguyen, H.-H.; Nguyen, T.-N.; Pham, T.-P.; Le, T.-T.-C.; Bui, T.-K.; Jang, D.-C.; Vu, N.-T. Leaf Position of Mulberry (Morus Alba L.) Affects Silkworm Growth, Silk Cocoon Yield and Quality. Vegetos 2024, 38, 1681–1688. [Google Scholar] [CrossRef]
- Suresh, G.; Saha, D.; Kumari, A.; Palsaniya, M.; Garhwal, P.C.; Singh, V.P.; Dadrwal, B.K. Mulberry Leaf Metabolomics: Linking Plant Biochemistry with Silkworm Physiology and Sustainable Sericulture. J. Adv. Biol. Biotechnol. 2026, 29, 57–80. [Google Scholar] [CrossRef]
- Chrysargyris, A.; Xylia, P.; Botsaris, G.; Tzortzakis, N. Antioxidant and Antibacterial Activities, Mineral and Essential Oil Composition of Spearmint (Mentha Spicata L.) Affected by the Potassium Levels. Ind. Crops Prod. 2017, 103, 202–212. [Google Scholar] [CrossRef]
- Yang, L.; Wen, K.S.; Ruan, X.; Zhao, Y.X.; Wei, F.; Wang, Q. Response of Plant Secondary Metabolites to Environmental Factors. Molecules 2018, 23. [Google Scholar] [CrossRef] [PubMed]
- Akula, R.; Ravishankar, G.A. Influence of Abiotic Stress Signals on Secondary Metabolites in Plants. Plant Signal. Behav. 2011, 6, 1720–1731. [Google Scholar] [CrossRef] [PubMed]
- Sudhakar, P.; Gowda, S.; Kumar, J.S.; Sobhana, V.; Sivaprasad, V. Fertility Status of Mulberry (Morus Alba l.) Garden Soils of Bivoltine Sericultural Areas and Their Impact on Cocoon Production in Karnataka; 2018. [Google Scholar] [CrossRef]
- Vrajan, V.; Manna, S.; Banerjee, A.; Pappachan, A.; Chattopadhyay, S. Soil Nutrient Status of Mulberry (Morus Species) Growing Fields in West Bengal, India. 2021. [Google Scholar]
- Ray, P.; Gogoi, S.N.; Bandyopadhyay, S.; Jena, R.K.; Ramachandran, S.; Sharma, G.K.; Sah, K.D.; Singh, S.K.; Ray, S.K. Soil-Cum-Nutrient Management Package for Achieving High Yield and Quality of Mulberry (Morus Indica L.) Leaf in Acid Soil of North Eastern India. J. Plant Nutr. 2021, 44, 2501–2513. [Google Scholar] [CrossRef]
- Muscolo, A.; Panuccio, M.R.; Mallamaci, C.; Sidari, M. Biological Indicators to Assess Short-Term Soil Quality Changes in Forest Ecosystems. Ecol. Indic. 2014, 45, 416–423. [Google Scholar] [CrossRef]
- Boestfleisch, C.; B.Wagenseil, N.; Buhmann, A.K.; Seal, C.E.; MerrettWade, E.; Muscolo, A.; Papenbrock, J. Manipulating the Antioxidant Capacity of Halophytes to Increase Their Cultural and Economic Value through Saline Cultivation. AoB Plants 2014, 6. [Google Scholar] [CrossRef] [PubMed]
- Panuccio, M.R.; Papalia, T.; Attinà, E.; Giuffrè, A.; Muscolo, A. Use of Digestate as an Alternative to Mineral Fertilizer: Effects on Growth and Crop Quality. Arch. Agron. Soil Sci. 2019, 65, 700–711. [Google Scholar] [CrossRef]
- Kumar, K.; Mohan, M.; Tiwari, N.; Kumar, S.; Kaushal Kumar S Azad, C.C. Production Potential and Leaf Quality Evaluation of Selected Mulberry (Morus Alba) Clones. J. Pharmacogn. Phytochem. 2018, 7, 482–486. [Google Scholar]
- Baciu, E.-D.; Baci, G.-M.; Moise, A.R.; Dezmirean, D.S. A Status Review on the Importance of Mulberry (Morus Spp.) and Prospects towards Its Cultivation in a Controlled Environment. Horticulturae 2023, 9, 444. [Google Scholar] [CrossRef]
- Naidu, B.V.; Sobhana, V.; Sudhakar, P.; Sen, S.; Obulapathi, N.; Sneha, M. V.; Tiwari, P. Soil Nutrient Status of Mulberry Gardens in Varied Clusters of Andhra Pradesh. Emergent Life Sci. Res. 2019, 05, 43–51. [Google Scholar] [CrossRef]
- Xiao, M.; Yu, S.; She, D.; Hu, X.; Chu, L. Nitrogen and Phosphorus Loss and Optimal Drainage Time of Paddy Field under Controlled Drainage Condition. Arab. J. Geosci. 2015, 8, 4411–4420. [Google Scholar] [CrossRef]
- Du, E.; Fenn, M.E.; De Vries, W.; Ok, Y.S. Atmospheric Nitrogen Deposition to Global Forests: Status, Impacts and Management Options. Environ. Pollut. 2019, 250, 1044–1048. [Google Scholar] [CrossRef] [PubMed]
- Xie, G.; Su, Z.; Fu, Y.; Li, J.; Mao, D.; Wang, S. Distribution of Subsurface Nitrogen and Phosphorus from Different Irrigation Methods in a Maize Field. Hydrology 2024, 11, 171. [Google Scholar] [CrossRef]
- Zhao, Y.; Zhao, M.; Qi, L.; Zhao, C.; Zhang, W.; Zhang, Y.; Wen, W.; Yuan, J. Coupled Relationship between Soil Physicochemical Properties and Plant Diversity in the Process of Vegetation Restoration. Forests 2022, 13, 648. [Google Scholar] [CrossRef]
- Yaman, R. Phytochemical Properties of Some Mulberry Genotypes Grown in Malatya Province. Yüzüncü Yıl Üniversitesi Tarım Bilim. Derg. 2021, 31, 348–355. [Google Scholar] [CrossRef]
- Kumar, K.; Mohan, M.; Tiwari, N.; Kumar, S.; Kaushal Kumar S Azad, C.C. Production Potential and Leaf Quality Evaluation of Selected Mulberry (Morus Alba) Clones. J. Pharmacogn. Phytochem. 2018, 7, 482–486. [Google Scholar]
- Przeor, M. How Does In Vitro Digestion Change the Amount of Phenolics in Morus Alba L. Leaf? Analysis of Preparations and Infusions. Metabolites 2024, 14, 31. [Google Scholar] [CrossRef] [PubMed]
- Baciu, E.-D.; Cornea-Cipcigan, M.; Moise, A.R.; Baci, G.-M.; Bobiş, O.; Bonta, V.; Ranga, F.; Dezmirean, D.S. Biochemical, Nutritional and Antioxidant Profile of Mulberry (Morus Lat. Var. Kokuso 21) Leaves and Fruits. Heliyon 2026, 12, e45265. [Google Scholar] [CrossRef]
- LS, N.K.; Sugeetha, G.; Mahadeva, J. Comparative Evaluation of Biochemical Constituents in Mulberry Varieties. Int. J. Adv. Biochem. Res. 2026, 10, 727–733. [Google Scholar] [CrossRef]
- Lee, Y.; Hwang, K.T. Changes in Physicochemical Properties of Mulberry Fruits ( Morus Alba L.) during Ripening. Sci. Hortic. 2017, 217, 189–196. [Google Scholar] [CrossRef]
- Kalinski, A.; Rowley, DanielL.; Loer, DeborahS.; Foley, C.; Buta, G.; Herman, EliotM. Binding-Protein Expression Is Subject to Temporal, Developmental and Stress-Induced Regulation in Terminally Differentiated Soybean Organs. Planta 1995, 195. [Google Scholar] [CrossRef] [PubMed]
- Tzanakakis, V.; Mauromoustakos, A.; Angelakis, A. Prediction of Biomass Production and Nutrient Uptake in Land Application Using Partial Least Squares Regression Analysis. Water 2014, 7, 1–11. [Google Scholar] [CrossRef]
- Vicente-Gonzalez, L.; Frutos-Bernal, E.; Vicente-Villardon, J. Partial Least Squares Regression for Binary Data. Mathematics 2025, 13, 458. [Google Scholar] [CrossRef]
- Yaman, M.; Aydınlıoğlu, C.; Karakoç, Y.; Tunç, Y.; Yıldız, E.; Sümbül, A.; Gönültaş, M.; Güneş, A.; Köse, M.A.; Keçe, Y.M.; et al. Deciphering Leaf Morpho-Biochemical and Mineral Diversity in Strawberry Tree (Arbutus Andrachne L.) Genotypes through Multivariate Statistical Approaches. Sci. Rep. 2026, 16, 37103. [Google Scholar] [CrossRef]
- Baciu, E.-D.; Miclea, I.; Cornea-Cipcigan, M.; Baci, G.-M.; Dezmirean, H.; Moise, A.R.; Bonta, V.; Ranga, F.; Bobiș, O.; Dezmirean, D.S. A Comparative Analysis of Different Growing Conditions of Mulberry (Cv. Kokuso 21): From Conventional Nursery to Soil-Less Technique. Agronomy 2025, 15, 1584. [Google Scholar] [CrossRef]
- Karthik, T.; Rathinamoorthy, R. Sustainable Silk Production. In Sustainable Fibres and Textiles; Elsevier, 2017; pp. 135–170. [Google Scholar]
- Ray, P.; Gogoi, S.N.; Bandyopadhyay, S.; Jena, R.K.; Ramachandran, S.; Sharma, G.K.; Sah, K.D.; Singh, S.K.; Ray, S.K. Soil-Cum-Nutrient Management Package for Achieving High Yield and Quality of Mulberry ( Morus Indica L.) Leaf in Acid Soil of North Eastern India. J. Plant Nutr. 2021, 44, 2501–2513. [Google Scholar] [CrossRef]
- Shahbazi, F.; Hughes, P.; McBratney, A.B.; Minasny, B.; Malone, B.P. Evaluating the Spatial and Vertical Distribution of Agriculturally Important Nutrients — Nitrogen, Phosphorous and Boron — in North West Iran. Catena 2019, 173, 71–82. [Google Scholar] [CrossRef]
- Jackson, M.L. Soil Chemical Analysis, 1st edition.; Prentice Hall of India Private Limited: New Delhi, 1973. [Google Scholar]
- Walkley, A.J.; Black, I.A. Estimation of Soil Organic Carbon by the Chromic Acid Titration Method. Soil Sci. 37, 29–38. [CrossRef]
- Subbiah, B.V.; Asija, G.L. A Rapid Procedure for the Estimation of Available Nitrogen in Soils. Curr. Sci. 1956, 25, 259–260. [Google Scholar]
- BRAY, R.H.; KURTZ, L.T. Determination of Total Sugar, and Available Forms of Phosphorus in Soils. Soil Sci. 1945, 59, 39–46. [Google Scholar] [CrossRef]
- Schollenberger, C.J.; Simon, R.H. Determination of Exchange Capacity and Exchangeable Bases in Soil-Ammonium Acetate Method. Soil Sci. 1945, 59, 13–24. [Google Scholar] [CrossRef]
- Merwin, H.D.; Peech, M. Exchangeability of Soil Potassium in the Sand, Silt, and Clay Fractions as Influenced by the Nature of the Complementary Exchangeable Cation. Soil Sci. Soc. Am. J. 1951, 15, 125–128. [Google Scholar] [CrossRef]
- Yemm, E.W.; Willis, A.J. The Estimation of Carbohydrates in Plant Extracts by Anthrone. Biochem. J. 1954, 57, 508–514. [Google Scholar] [CrossRef] [PubMed]
- Lowry, OliverH.; Rosebrough, NiraJ.; Farr, A.L.; Randall, RoseJ. Protein Measurement with the Folin Phenol Reagent. J. Biol. Chem. 1951, 193, 265–275. [Google Scholar] [CrossRef]
Figure 2.
Variance (a, c, e) and cumulative variance (b, d, f) for the X variables and Y responses at the young (a, b), medium-mature (c, d), and mature (e, f) leaf growth stages, respectively, in relation to surface soil.
Figure 2.
Variance (a, c, e) and cumulative variance (b, d, f) for the X variables and Y responses at the young (a, b), medium-mature (c, d), and mature (e, f) leaf growth stages, respectively, in relation to surface soil.
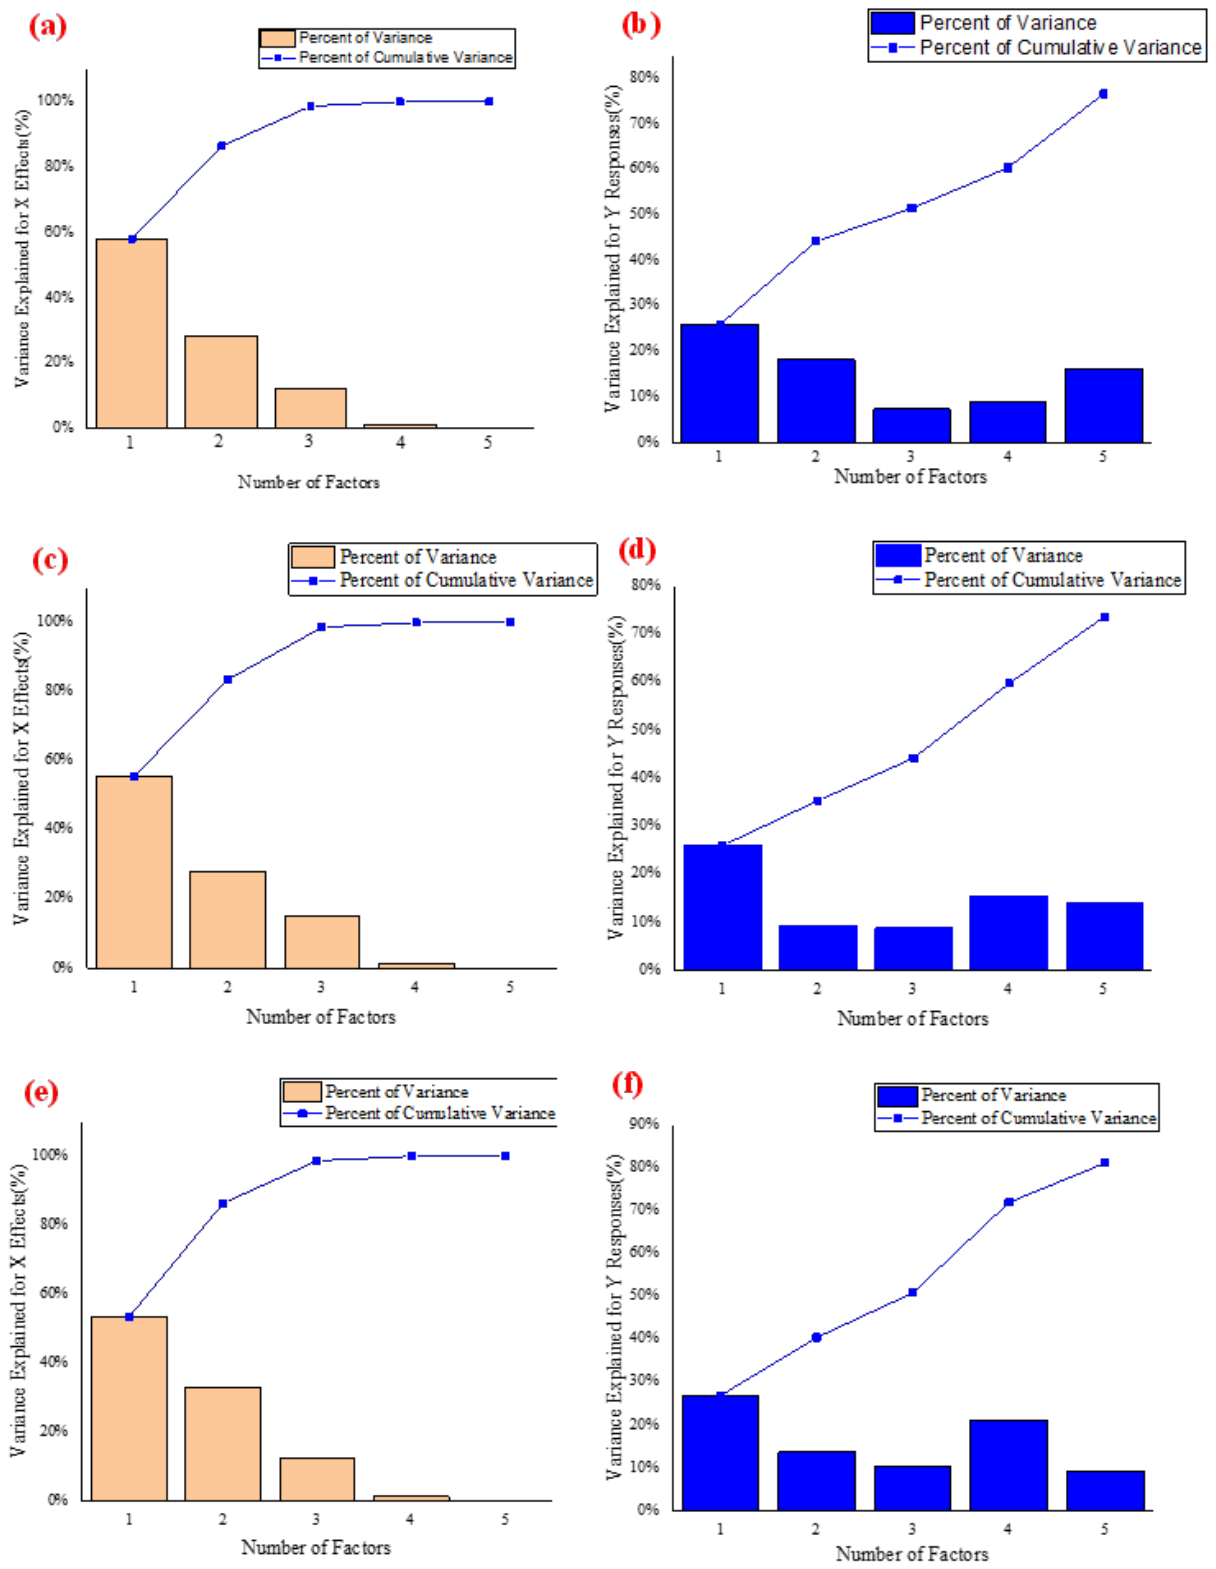
Figure 3.
Variance (a, c, e) and cumulative variance (b, d, f) for the X variables and Y responses at the young (a, b), medium-mature (c, d), and mature (e, f) leaf growth stages, respectively, in relation to sub-surface soil.
Figure 3.
Variance (a, c, e) and cumulative variance (b, d, f) for the X variables and Y responses at the young (a, b), medium-mature (c, d), and mature (e, f) leaf growth stages, respectively, in relation to sub-surface soil.
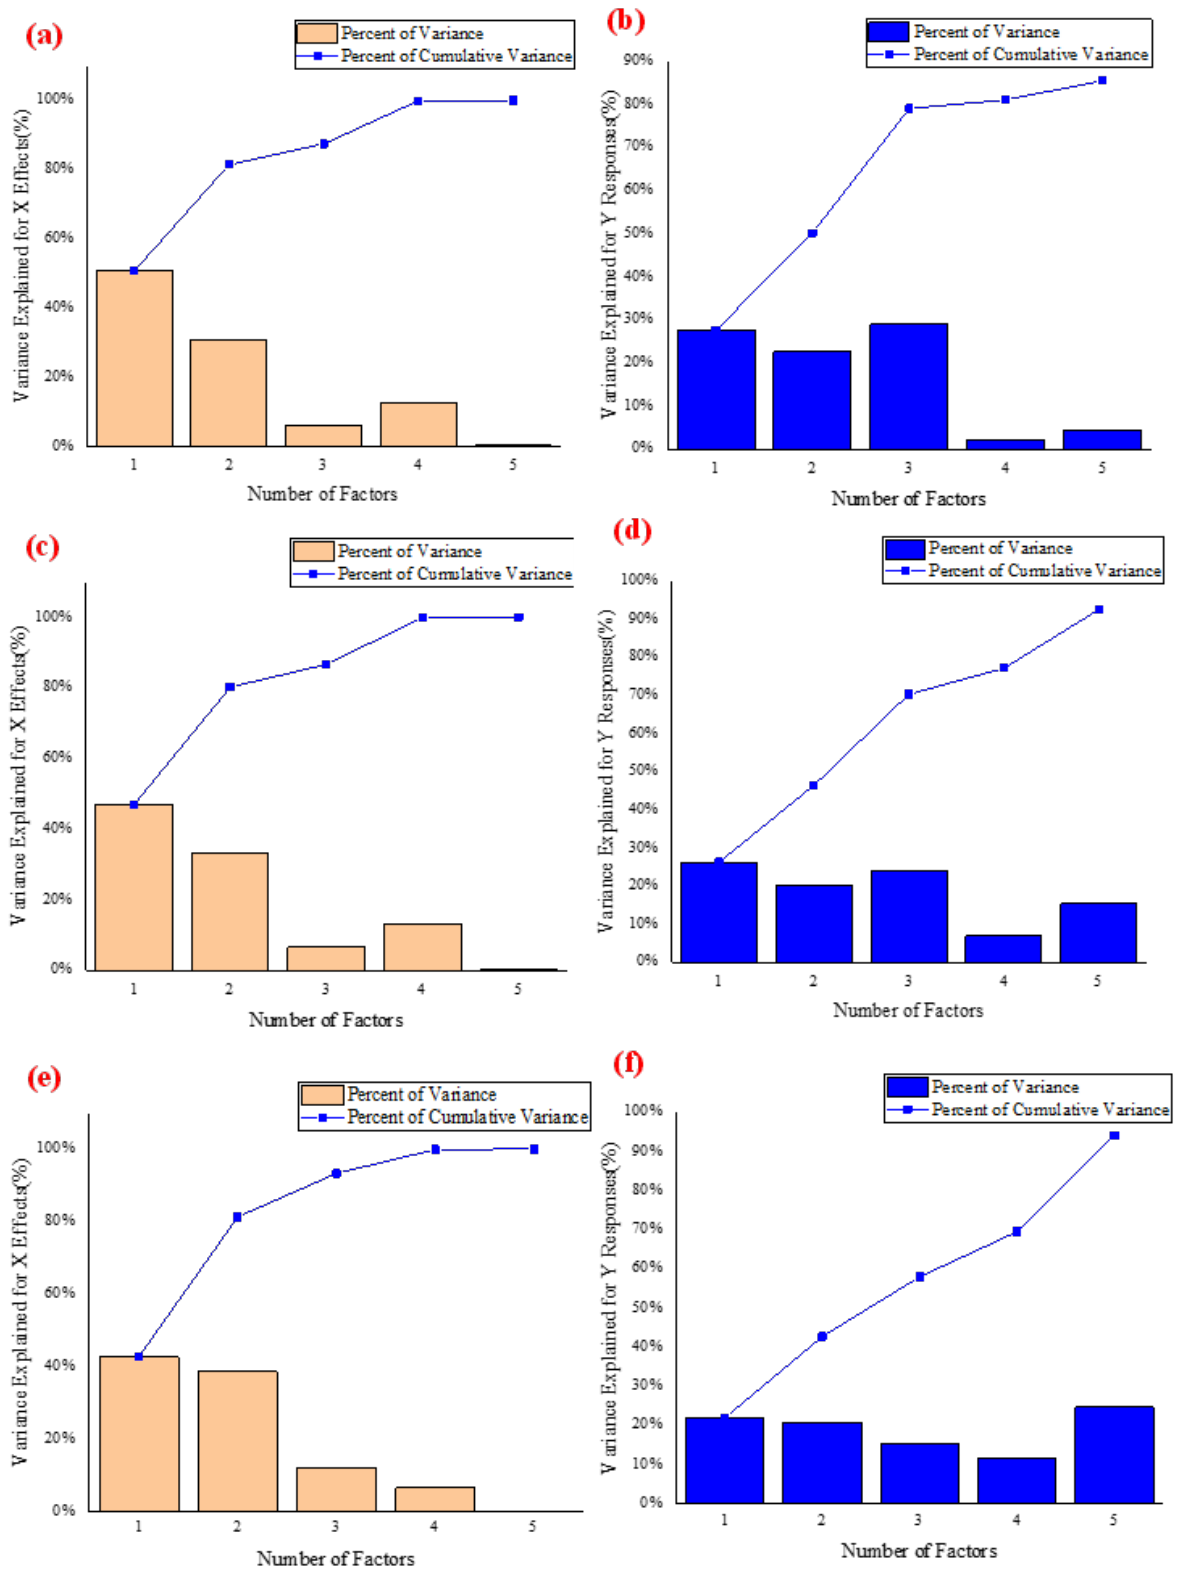
Figure 4.
Sampling locations of mulberry leaves from Jorhat district of Assam, India.
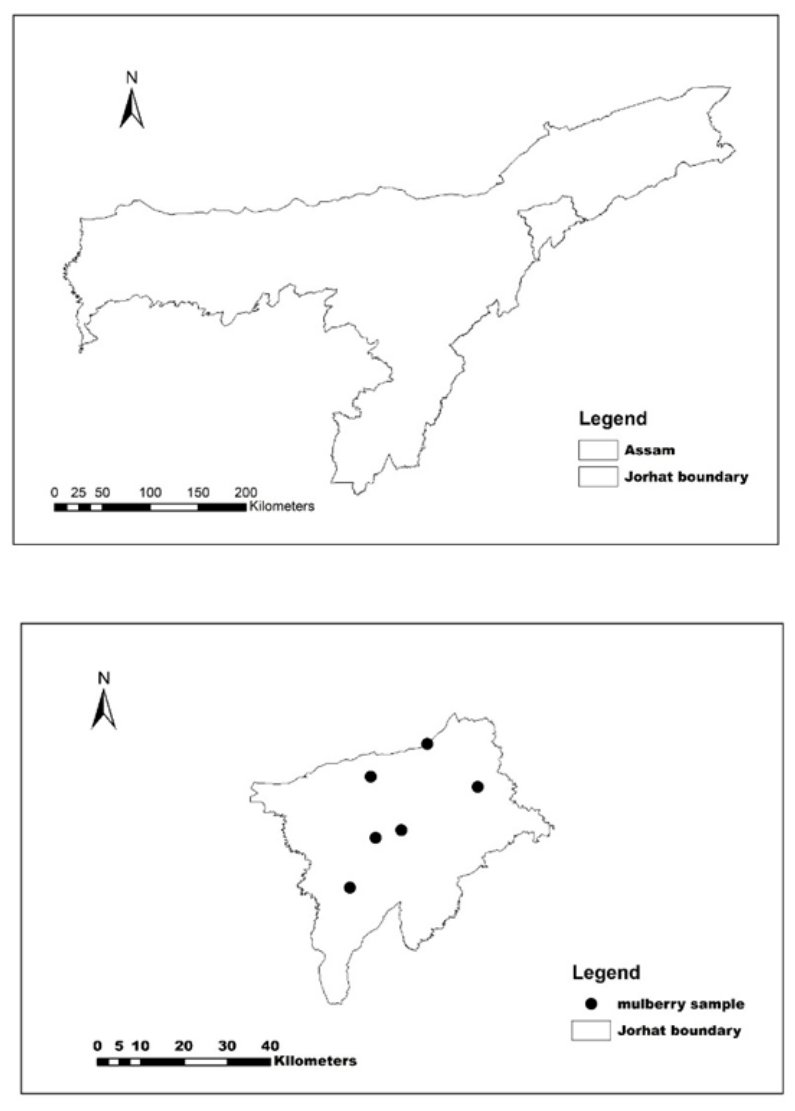
Figure 5.
Mulberry leaves at different maturity stages of young, medium matured and matured.
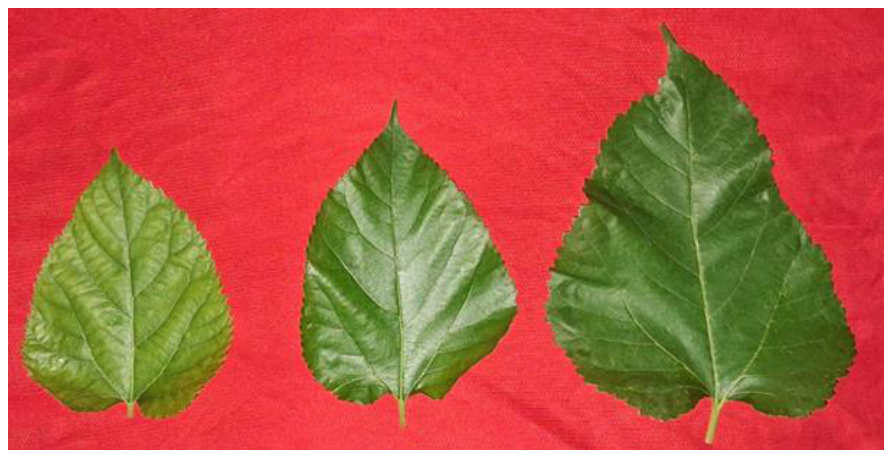

Table 1.
Depth wise distribution of soil chemical properties of the sampling sites.
| Parameters | Surface | |||
|---|---|---|---|---|
| Range | Mean± SD | SE | CV | |
| pH (1:2.5) | 4.12- 6.18 | 5.07± 0.75 | 0.31 | 14.77 |
| OC (%) | 0.54-0.78 | 0.67 ± 0.09 | 0.04 | 14.06 |
| Av N (kg ha-1) | 221.40-300.3 | 262.00 ± 29.59 | 12.08 | 11.29 |
| Av P (kg ha-1) | 16.33-24.19 | 20.91 ± 2.99 | 1.22 | 14.32 |
| Av K (kg ha-1) | 132.52-188.03 | 165.02 ± 21.67 | 8.85 | 13.13 |
| Sub-surface | ||||
| pH (1:2.5) | 4.25-5.86 | 5.05 ± 0.56 | 0.23 | 11.18 |
| OC (%) | 0.51- 0.69 | 0.61 ± 0.06 | 0.03 | 10.16 |
| Av N (kg ha-1) | 206.55-262.2 | 236.78 ± 17.83 | 7.28 | 7.53 |
| Av P (kg ha-1) | 15.42- 23.89 | 19.32 ± 2.96 | 1.21 | 15.33 |
| Av K (kg ha-1) | 142.20 - 188.83 | 167.08 ± 17.14 | 7.00 | 10.26 |
OC, soil organic carbon; Av N, available nitrogen; Av P, available phosphorus; Av K, available potassium.
Table 2.
Biochemical properties of the mulberry leaves at different growth stages.
| Parameters | Young leaf | |||
|---|---|---|---|---|
| Range | Mean± SD | SE | CV | |
| TS (g/kg) | 8.29 - 13.91 | 10.82 ±2.25 | 0.92 | 20.76 |
| TP (g/kg) | 1.89-4.52 | 3.35 ± 0.87 | 0.36 | 26.02 |
| BP (g/kg) | 1.72-2.36 | 2.08 ± 0.22 | 0.09 | 10.35 |
| FAA (g/kg) | 1.51-3.17 | 2.16 ± 0.56 | 0.23 | 26.06 |
| CF (g/kg) | 9.84-22.74 | 14.04 ±4.56 | 1.84 | 30.16 |
| TSS (g/kg) | 40.36-44.33 | 42.10 ± 1.68 | 0.68 | 3.98 |
| Medium matured leaf | ||||
| TS (g/kg) | 5.33-12.94 | 9.47± 2.97 | 1.21 | 31.38 |
| TP (g/kg) | 1.66-3.39 | 2.46 ± 0.64 | 0.26 | 13.14 |
| BP (g/kg) | 1.37- 1.87 | 1.65± 0.22 | 0.09 | 27.44 |
| FAA (g/kg) | 0.92 -1.75 | 1.31 ± 0.36 | 0.15 | 27.44 |
| CF (g/kg) | 10.49-17.32 | 14.07 ± 2.46 | 1.86 | 32.46 |
| TSS (g/kg) | 36.38-42.96 | 38.96 ± 2.48 | 1.01 | 6.35 |
| Matured leaf | ||||
| TS (g/kg) | 0.47-3.85 | 2.80 ± 2.63 | 0.47 | 33.80 |
| TP (g/kg) | 1.98 - 3.12 | 2.28 ± 0.43 | 0.18 | 18.85 |
| BP (g/kg) | 1.23 - 2.11 | 1.77 ± 0.38 | 0.15 | 21.38 |
| FAA (g/kg) | 0.76-1.4 | 1.15 ± 0.23 | 0.09 | 20.20 |
| CF (g/kg) | 11.21-23.62 | 14.92 ± 4.50 | 1.00 | 17.48 |
| TSS (g/kg) | 34.90-40.47 | 37.77 ± 1.96 | 0.80 | 5.18 |
TS, total sugar; TP, total polyphenol; BP, bind protein; FAA, free amino acids; CF, crude fibre; TSS, total soluble solid.
Table 3.
a: Coefficients of Xs in PLSR regression for the model of surface soil with mulberry leaves at different growth stages. b: Coefficients of Xs in PLSR regression for the model of sub-surface soil with mulberry leaves at different growth stages.
Table 3.
a: Coefficients of Xs in PLSR regression for the model of surface soil with mulberry leaves at different growth stages. b: Coefficients of Xs in PLSR regression for the model of sub-surface soil with mulberry leaves at different growth stages.
| a | ||||||
| Parameters | Young leaf | |||||
| TP | TS | BP | FAA | TSS | CF | |
| Intercept | 27.10 | -88.57 | -113.70 | 22.37 | 122.47 | 78.04 |
| pH | -0.21 | 0.15 | -1.70 | -0.30 | 0.33 | 0.99 |
| OC | 67.85 | -126.44 | -357.46 | 28.71 | 220.63 | 127.11 |
| Av N | -0.30 | 0.68 | 1.55 | -0.16 | -0.98 | -0.58 |
| Av P | 1.24 | -2.68 | -4.76 | 0.73 | 3.14 | 3.24 |
| Av K | -0.09 | 0.32 | 0.42 | -0.06 | -0.25 | -0.41 |
| Medium matured leaf | ||||||
| Intercept | 23.11 | 88.17 | 44.97 | 4.76 | 142.66 | -207.14 |
| pH | 0.10 | 0.34 | -0.13 | -0.13 | -1.65 | -4.12 |
| OC | 51.40 | 289.03 | 58.98 | -11.57 | 231.13 | -527.27 |
| Av N | -0.24 | -1.13 | -0.25 | 0.02 | -1.07 | 2.33 |
| Av P | 1.02 | 2.31 | 0.43 | 0.16 | 3.85 | -6.46 |
| Av K | -0.08 | -0.15 | -0.10 | -0.02 | -0.32 | 0.72 |
| Matured leaf | ||||||
| Intercept | 13.15 | 77.79 | 101.19 | -6.52 | 24.25 | -8.78 |
| pH | 0.39 | 1.49 | -0.04 | -0.20 | 0.27 | 2.53 |
| OC% | 33.49 | 233.90 | 122.35 | -23.82 | 26.71 | -81.43 |
| N | -0.15 | -0.87 | -0.64 | 0.10 | 0.05 | 0.28 |
| P | 0.56 | 1.03 | 2.51 | -0.26 | -1.57 | -0.13 |
| K | -0.04 | -0.15 | -0.33 | 0.02 | 0.08 | -0.04 |
| b | ||||||
| Parameters | Young leaf | |||||
| TP | TS | BP | FAA | TSS | CF | |
| Intercept | 11.82 | 1.97 | 46.45 | 10.78 | 16.86 | 68.44 |
| pH | 1.06 | 0.31 | -1.53 | 0.11 | 1.01 | 4.62 |
| OC | 49.62 | 70.51 | 24.36 | 3.85 | -21.74 | 239.92 |
| Av N | -0.17 | -0.25 | -0.13 | -0.03 | 0.10 | -0.72 |
| Av P | -0.23 | 0.65 | 0.65 | -0.11 | -0.71 | -0.58 |
| Av K | 0.01 | 0.01 | -0.12 | -0.01 | 0.13 | -0.25 |
| Medium matured leaf | ||||||
| Intercept | 4.93 | -99.91 | -11.60 | 11.60 | 53.04 | 197.33 |
| pH | 1.03 | -1.88 | -2.01 | 0.26 | -0.17 | -0.02 |
| OC | 24.94 | -193.23 | -89.33 | 11.50 | 30.79 | 422.09 |
| Av N | -0.09 | 0.81 | 0.36 | -0.06 | -0.11 | -1.70 |
| Av P | -0.22 | -1.14 | -0.24 | 0.00 | -0.77 | 2.38 |
| Av K | 0.01 | 0.41 | 0.04 | -0.03 | 0.05 | -0.50 |
| Matured leaf | ||||||
| Intercept | -2.11 | -122.79 | 16.86 | 10.15 | -37.02 | 37.69 |
| pH | 0.76 | -3.37 | -0.36 | -0.10 | -3.79 | 4.09 |
| OC% | 4.89 | -287.64 | -53.91 | 16.20 | -153.92 | 79.76 |
| N | -0.01 | 1.19 | 0.21 | -0.07 | 0.69 | -0.30 |
| P | -0.11 | -0.97 | -0.62 | 0.10 | -0.18 | 0.32 |
| K | 0.02 | 0.37 | -0.04 | -0.03 | 0.16 | -0.16 |
OC, soil organic carbon; Av N, available nitrogen; Av P, available phosphorus; Av K, available potassium.
Disclaimer/Publisher’s Note: The statements, opinions and data contained in all publications are solely those of the individual author(s) and contributor(s) and not of MDPI and/or the editor(s). MDPI and/or the editor(s) disclaim responsibility for any injury to people or property resulting from any ideas, methods, instructions or products referred to in the content. |
© 2026 by the authors. Licensee MDPI, Basel, Switzerland. This article is an open access article distributed under the terms and conditions of the Creative Commons Attribution (CC BY) license (http://creativecommons.org/licenses/by/4.0/).
Copyright: This open access article is published under a Creative Commons CC BY 4.0 license, which permit the free download, distribution, and reuse, provided that the author and preprint are cited in any reuse.