

Submitted:
11 November 2026
Posted:
12 November 2026
You are already at the latest version
Abstract
36 isolates of Pantoea agglomerans were obtained from seeds of three varieties of the Ural-Siberian forest-steppe ecogeographical group (Omskaya 35, Uralosibirskaya and Uralosibirskaya 2), an agroecotype adapted to the soil-climatic conditions of Western Siberia. Cluster analysis revealed two distinct groups of P. agglomerans: a universal cluster comprising isolates from all three varieties, and an agroecotype-specific cluster comprising isolates exclusively from Omskaya 35 and Uralosibirskaya 2, the two varieties previously identified as the most typical representatives of this agroecotype. A representative strain O11 of the universal cluster, isolated from Omskaya 35, was subjected to whole-genome sequencing. Comparative genomic analysis with 33 publicly available P. agglomerans genomes from wheat seeds collected worldwide identified 208 private families in the accessory genome of O11, of which 111 were functionally informative. Phage structural, packaging and lysis functions (46 families) formed the largest category of the functionally informative private families. DNA replication/recombination (19), enzymes/metabolism (12) and defence/restriction–modification (10) followed, then mobility/plasmids (9), regulation of expression (9), transport/secretion (4) and other annotated functions (2). This genome provides a quality-ranked resource for studying Pantoea–wheat interactions and generates testable hypotheses on how phage-associated functions may contribute to the biocontrol potential of seed-borne endophytes during cold germination.
Keywords:
Triticum aestivum L.
; Ural-Siberian forest-steppe ecogeographical group
; agroecotype
; seed endophytes
; beneficial microorganism
; Pantoea agglomerans
; accessory genome
; prophage
; phage-plasmid
; mobile genetic elements
1. Introduction
The seed microbiome is one of the main components of the holobiont. It has been shown that seeds ensure the vertical transmission of key microbial taxa that have evolved through long-term coevolution with the host plant. Although the functional roles of these taxa remain incompletely understood, they are recognized as important for seed germination, plant development and adaptation to stress factors [1]. This makes the seed microbiome a valuable source of beneficial microorganisms for improving crop productivity and resilience, including for the development of highly effective microbial biologicals [2,3,4,5,6]. Therefore, knowledge of the taxonomic composition of the seed microbiome enables the targeted search for and selection of endophytic microorganisms that are genuinely associated with the host plant and its agroecological characteristics.
Previously, we performed 16S rRNA gene amplicon sequencing of the bacterial seed microbiome of three spring bread wheat (Triticum aestivum L.) varieties of the forest-steppe Ural-Siberian ecogeographical group - Omskaya 35, Uralosibirskaya and Uralosibirskaya 2 [7]. This group, hereafter also referred to as the Ural-Siberian forest-steppe agroecotype, comprises mid-late varieties cultivated in the forest-steppe zone of Western Siberia adjacent to the Ural Mountains, that is, in one of the northernmost regions of large-scale spring bread wheat cultivation (Figure 1).
The agroclimatic conditions of this agricultural region are characterized by low mean annual temperatures and frequent spring and early summer droughts, which have driven the evolution of a unique adaptive strategy in the varieties of this group. This strategy consists of slow growth during the germination–heading period followed by active development fueled by abundant rainfall in the second half of summer.
16S rRNA gene amplicon analysis showed that the genus Pantoea is the key taxon for the studied varieties [7]. These results are consistent with recent metagenomic surveys of wheat seeds from different regions of the world, in which the genus Pantoea has been repeatedly detected as a common, and in several cases dominant, member of the seed endophytic community [8,9,10,11,12,13]. Among the representatives of this genus, P. agglomerans is the most frequently identified and best-studied member of the wheat seed microbiome [10,14]. At the same time, the genus Pantoea is characterized by a marked lifestyle plasticity: strains of the same species may act as mutualists, commensals or opportunistic pathogens, and pathogenicity involves secretion systems, quorum sensing, exopolysaccharide production and toxin synthesis, so that beneficial and potentially harmful strains are phylogenetically indistinguishable and cannot be reliably predicted from the genome alone [15]. This plasticity is not merely a taxonomic curiosity: P. agglomerans includes strains that cause bacterial blight, soft rot and galls in crops such as maize, rice, sorghum, onion and fruit trees, and the species is classified as a BSL-2 organism because of its potential to cause opportunistic human infections [15]. Nevertheless, many P. agglomerans strains are well-documented beneficial microorganisms, including the ability to suppress the growth of potentially pathogenic and spoilage microorganisms through the production of antimicrobial compounds such as pantocins, herbicolins and agglomerins, the induction of systemic resistance, nitrogen fixation in non-symbiotic associations, and the solubilization of inorganic phosphate and potassium, as well as the production of phytohormones (e.g., auxins) and siderophores [14,15].
All this makes the genus Pantoea, and P. agglomerans in particular, a logical candidate for the search of microorganisms that combine the ability to colonize the seed niche with beneficial agronomic traits. Thus, the aim of the present work was to carry out a targeted isolation of culturable representatives of the genus Pantoea from surface-sterilized seeds of three spring bread wheat varieties of the forest-steppe Ural-Siberian ecogeographical group, to identify them, and to assess which species, and where possible which strains, are shared by all three varieties. The work also included whole-genome sequencing of representative Pantoea isolates followed by comparative genomic analysis to identify strain-specific gene content that may underlie the adaptation of these strains to the Ural-Siberian seed niche and that can be prioritized for future functional studies.
2. Results
2.1. Isolation and MALDI-TOF Identification of Pantoea Isolates from Wheat Seeds
A total of 40 presumptive Pantoea isolates were obtained from surface-sterilized seeds of the three wheat varieties. MALDI-TOF MS identified 36 isolates as P. agglomerans, and 4 as P. ananatis. P. agglomerans was recovered from all three varieties, while P. ananatis was isolated only from the seeds of cv. Uralosibirskaya 2. We therefore selected P. agglomerans for further study.
2.2. Cluster Analysis of MALDI-TOF Mass Spectra of Pantoea Agglomerans Isolates
We examined MALDI-TOF spectral variation among the isolates using principal component analysis (PCA) followed by hierarchical clustering. The dendrogram separated the isolates into two main clusters. The first cluster, designated as the “universal” cluster, comprised isolates obtained from all three wheat varieties (Omskaya 35, Uralosibirskaya and Uralosibirskaya 2). The second cluster, designated as the “agroecotype-specific” cluster, included isolates recovered only from the varieties Omskaya 35 and Uralosibirskaya 2, which were previously identified as the most typical representatives of this agroecotype [7] (Figure 2).
We examined subclusters that contained isolates from all three cultivars (cluster 1) or both cultivars represented in cluster 2. Several subclusters varied between clustering runs. The most stable subclusters were those containing isolates No. 11 from O-35 (cluster 1) and No. 15 from O-35 (cluster 2). As Omskaya 35 is the reference cultivar for this wheat group, we selected these isolates, designated O11 and O15, for further characterization. The present study focuses on O11, the representative of the universal cluster; O15 was retained for subsequent analysis.
2.3. Genome Sequencing, Assembly and Quality
Paired-end sequencing of O11 yielded 6019990 read pairs (3285582451 bases). Quality filtering retained 5931197 pairs (mean read lengths 272 and 271 nt), with 96.44% of bases at Q20 or higher and 91.88% at Q30 or higher. The median insert size was 356 bp (robust SD 126 bp; MAPQ ≥ 20), and the genome-wide mean read depth was approximately 620×. The assembly used all retained pairs without subsampling.
Six short-read assemblers (SPAdes, SKESA, MEGAHIT, MaSuRCA, A5-miseq and Unicycler) were run on the full set of 5931197 cleaned read pairs. Each assembly was scaffolded against three P. agglomerans guide genomes, C-406 (GCF_059509315.1), LuF5004 (GCF_051136245.1) and FDAARGOS 1447 (GCF_019048385.1). Guide selection involved screening 561 publicly available P. agglomerans genomes (retrieved from NCBI, GTDB R232 and BV-BRC; Section 4.6.3). Among the complete long-read assemblies, C-406 (GCF_059509315.1; skani ANI 99.01% to O11) was the closest relative of O11 and was chosen as the primary guide. It represents a wheat isolate from Spain. LuF5004 (GCF_051136245.1; ANI 98.59%) was included as a second complete long-read genome to test the sensitivity of scaffolding to the choice of guide. FDAARGOS 1447 is the only RefSeq reference genome for the species, an assembly from type material, and the most divergent of the three guides (97.43%). Using three guides allowed us to assess the effect of reference choice on scaffold organization.
SKESA contigs scaffolded against C-406 (SKESA→C-406) ranked first among the 18 assembler–guide combinations and were selected for the final assembly. Under the applied read-support criterion (MAPQ ≥ 20), this was the only combination with no unsupported non-N bases, and its BUSCO completeness was 99.4% for the native contigs and 99.2% for the scaffolds. CheckM2 estimated 100% completeness and 0.16% contamination for the final assembly. The selected native SKESA assembly contained 145 contigs. After reference-guided scaffolding, the assembly comprised 4969270 bp distributed across eight sequence records: a 4177689-bp chromosome scaffold, two plasmid-like components (P1, 537056 bp; P2, 154263 bp), and five unplaced contigs (U1–U5, 100262 bp in total; Figure 3). The chromosome is a reference-guided scaffold of 129 contigs with 128 gaps of unknown length (12800 Ns), not a closed molecule. The P1 scaffold contained ten SKESA contigs and ten reported N-marked gap intervals (1382 Ns in total), whereas P2 was represented by a single contig. The organization of P1 remains provisional because some proposed joins lacked paired-read support. SKESA flagged U1 and U2 as circular, and end-spanning read pairs were detected. However, the short-read data do not establish closed circular molecules or distinguish circularity from tandem duplication.
The reference-guided assembly retains several unresolved joins. Of the 134 gaps in the original SKESA–C-406 scaffold (i.e., before the P1 contigs were joined into a single record), 10 are not spanned by any read pair with MAPQ ≥ 20, and 14 are spanned by fewer than five such pairs; their placement follows the C-406 guide without direct read support. After the ten P1 contigs were joined, the final 8-record assembly contains 138 gaps: 128 chromosomal gaps and 10 junction gaps in P1 (14182 N in total). The P1 junction between former U5 and U3 has no spanning read pairs and is supported only by homology to C-406. ABySS-Sealer, SOAPdenovo2 GapCloser and RagTag patch analyses with alternative assemblies produced no joins that met the acceptance criteria, so the assembly was unchanged. Collinearity of the O11 chromosome with C-406 and with the more divergent FDAARGOS 1447 is consistent with the guide-derived order, but it cannot exclude rearrangements within gaps or unsupported joins. Because the chromosome is a reference-guided draft with 128 gaps, and because rRNA operon copies collapse in the short-read assembly, gene order in gap regions and copy numbers of rRNA, tRNA and other repeated families should not be inferred from this draft. Long reads would be needed to resolve the remaining joins and confirm the structures of the plasmid-like and phage-like elements.
2.4. Genome Annotation
The final eight-record assembly of P. agglomerans O11 (4969270 bp; G+C content 54.62%) was annotated with Bakta v1.12.2 using the full database v6.0. Bakta identified 4660 conventional coding sequences (CDS) and 10 small open reading frames (sORFs), giving 4670 protein-coding features (Table 1). These features were located on the chromosome scaffold (3899), P1 (522), P2 (144), U1 (95) and U2 (10), with none on U3–U5. Of the 4670 features, 340 (7.28%) were annotated as hypothetical proteins, and 19 had candidate-pseudogene flags within this set.
Bakta also identified 64 tRNA genes, 4 rRNA features, 1 tmRNA, 47 ncRNAs, 47 regulatory RNA regions and 2 putative oriC sites; no CRISPR arrays were detected. The rRNA features comprise 2 chromosomal 5S rRNAs and partial 16S and 23S rRNA sequences on the short unplaced contigs U3 and U4, respectively. The partial rRNA sequences prevent a reliable estimate of rRNA operon copy number.
We annotated all 4670 Bakta full protein sequences using eggNOG-mapper v3.0.0-beta6 and eggNOG database v7.0.0. The output contained annotation records for 4366 unique proteins (93.49%); 4043 (86.57%) had at least one nonempty functional or domain field under the stated counting criteria. KEGG Orthology (KO) identifiers were assigned to 3142 proteins (67.28%), representing 2660 distinct KO identifiers. Table 2 summarizes the main annotation categories.
An eggNOG annotation record denotes a reported match; specific functional assignments are summarized in Table 2. The proportion with annotation records differed by component: 3689/3899 proteins on the chromosome (94.61%) and 71/95 on U1 (74.74%) had a final record.
Numerical COG identifiers from eggNOG v3 were converted to functional letters using the COG2024 definitions [16]. All 3418 identifiers were mapped. Applying nine COG-based categories adapted from Wdowiak-Wróbel et al. [17], 3086 proteins (66.08% of all 4670) were assigned to at least one category (Table 3). Metabolism (1141 proteins), regulation and cell signaling (568), and protein processing (412) were the largest categories. Some proteins were assigned to multiple categories (232 proteins). These COG-derived categories use a different method from PATRIC subsystems.
The genomic characterization in Section 2.4 uses Bakta full and eggNOG v7. The same final assembly and uniform Bakta full annotation were used to generate the O11 input for the 34-genome pangenome comparison (Section 2.6 and Section 4.9). Bakta light CDS coordinates were used for genomic-island prediction (Section 2.5; Methods, Section 4.8), and its structural summary remains in Supplementary Table S3. The other mobile-element tools analyzed the assembly FASTA directly.
2.5. Mobile Genetic Elements and Horizontal Gene Transfer
The eight-record O11 draft assembly was screened for prophages, genomic islands (GIs), integrons and insertion sequences. geNomad identified four viral regions. Three were located within the chromosome scaffold. PP2 (2691549–2740293; 48.7 kb, 79 genes, 18 viral hallmark genes) was assessed by CheckV as a high-completeness Caudoviricetes prophage candidate (99.9% completeness, AAI-based, no host contamination) and begins with a prophage integrase (IntS) gene immediately adjacent to (<0.3 kb) a tRNA-Arg(CCT) gene, a typical attachment site. PP1 (17.9 kb) and PP3 (16.5 kb) were classified as low-quality genome fragments (36–38% completeness) and probably represent partial or degenerate prophages. The fourth viral region encompassed U1 (91016 bp), classified by geNomad as a Caudoviricetes virus (virus score 0.96; plasmid score 0.03) and CheckV as a high-quality genome (98.0% completeness). U1 contains an extensive set of predicted phage structural and lysis genes (terminase, portal, capsid, tail sheath, tape measure, baseplate, tail fibres, holin, lysis determining protein, Rz) together with plasmid-type maintenance genes (initiator RepB, a replication protein and a StbA-family partition protein), was flagged as circular by SKESA, had no alignment of at least 1 kb to any other O11 record, and had about 1.6-fold higher read depth than the chromosome (989× vs. 628×). These features support interpreting U1 as a phage–plasmid-like candidate. Autonomous maintenance, circularity and infectious activity have not been established.
An IslandPath-DIMOB-like analysis (dinucleotide-bias runs of at least eight genes combined with mobility genes) detected six GIs, five on the chromosome and one on P2 (4.2–21.9 kb; GC 35.3–47.1% vs. 54.6% genome average), and five further regions with compositional signatures alone. The largest, GI2 (chromosome 878797–900672; 21.9 kb; 36.3% GC), contains tyrosine recombinases, a transposase and MobA/VirD2-like mobilization genes and lies next to a tRNA-Arg gene. Other GIs contain phage-related genes (tail tape measure, phage proteins and capsid) or an IS3-family (ISRaq1-like) transposase and a tyrosine recombinase. GIs were predicted using the earlier Bakta light CDS annotation (Supplementary Table S3; Methods, Section 4.8); the remaining MGE tools used the assembly FASTA and do not depend on gene annotation. ISEScan found nine IS elements (9.8 kb, 0.20% of the assembly), seven on the chromosome and two on P1. IntegronFinder found no complete integrons or CALIN elements. geNomad classified P1 and P2 as plasmid sequences (plasmid scores ≥ 0.99); sequences that scored as separate high-scoring plasmid-like unplaced contigs before P1 joining are now part of the joined P1 record. In summary, the predicted mobile-element repertoire of O11 includes one high-completeness chromosomal prophage candidate, two lower-completeness chromosomal viral regions, a large phage–plasmid-like candidate (U1), and several putative genomic islands. Because the chromosome is a reference-guided draft with 128 gaps, island boundaries and the absence of elements in gap regions should be interpreted with caution.
2.6. Comparative Genomic Analysis and Identification of Unique Genes
To characterize the O11 gene repertoire within a wheat-seed comparison panel, the genome was compared with publicly available P. agglomerans genomes associated with Triticum aestivum seeds. We identified 33 public genomes meeting the criteria (taxonomic assignment to P. agglomerans; host T. aestivum; isolation source, seed; assembled and annotated genome publicly available) and were retrieved from NCBI (Table S1); together with O11, they formed a panel of 34 genomes. The 33 public genomes originated from wheat seeds collected in Spain (n = 14), Germany (n = 7), Turkey (n = 6), Kenya (n = 3), Canada (n = 2) and New Zealand (n = 1), thus covering Eurasia, Africa, North America and Oceania, and came from several independent BioProjects (PRJNA578090, PRJNA315986, PRJNA255804 and PRJNA1201053). These 33 public genomes had high completeness and low contamination (Table S1), and all 34 genomes were re-annotated with Bakta 1.12.2 using the full database (version 6.0) for consistent gene prediction before pangenome analysis.
The pangenome accumulation curve did not reach a plateau within the analysed sampling range (Figure 4), consistent with an open pangenome, although the present data do not formally establish this. This is consistent with the open pangenome reported for P. agglomerans on a much larger panel of 165 genomes, in which the accessory fraction continued to expand with additional genomes [18]. The O11-specific families in this panel provide candidates for studying variation among wheat-seed isolates.
The pangenome of the 34 genomes comprised 8825 gene families, of which 3532 were strict core (present in all 34 genomes), 31 were soft-core (present in 33 of 34), 1614 were shell (present in 6–32 genomes) and 3648 were cloud (present in 1–5 genomes). The strict core represented 40.02% of the pangenome, whereas the accessory fraction, defined here as the combined soft-core, shell and cloud categories, comprised 5293 families (59.98%). The accumulation curve remained upward-sloping over the sampled range. The 3532 strict-core families are numerically close to the 3782 persistent families reported for a separate panel of 165 P. agglomerans genomes analyzed with PPanGGOLiN [18], although the categories arise from different methods and sampling schemes. The 3532 strict-core families provided a defined basis for the concatenated core-genome phylogenomic analysis described below.
The phylogenomic position of O11 was inferred from a concatenated alignment of core-gene nucleotide sequences from all 34 genomes. Panaroo identified 3532 gene families present in all 34 genomes; after core-gene alignment and entropy-based filtering, the final concatenated alignment contained 3221211 nucleotide positions, including 132003 parsimony-informative sites. Maximum-likelihood phylogenomic reconstruction under the GTR+F+I+R3 substitution model placed O11 within a cluster comprising the Spanish isolates C-390, C-394 and C-396 (Figure 5).
In this tree, O11 and C-390 formed a sister pair, whereas C-394 and C-396 formed a second sister pair. The reference strain C-406, previously used for reference-guided scaffolding of the O11 assembly, was positioned in a different subclade, illustrating the difference between phylogenomic placement and reference selection for scaffolding. C-406 was selected as the scaffolding guide because it is the closest complete genome to O11 (Section 2.3), not because it is the closest relative in the core-genome phylogeny. Branch support was evaluated using SH-aLRT and ultrafast bootstrap analyses; the phylogeny revealed several closely related groups with short internal branches, consistent with limited sequence divergence among subsets of the examined genomes.
Comparative pangenome analysis identified 208 gene families present only in O11 within the examined 34-genome dataset under the selected Panaroo settings (Table 4). These families were distributed unevenly across the assembly: 111 on the chromosome, 95 on the unplaced contig U1, and 2 on the plasmid-like replicon P2, whereas P1 and the remaining unplaced contigs (U2–U5) contained no private families. Their functional categories are described in Section 2.7 and summarized in Table 4.
Coordinate mapping showed that 169 of the 208 O11-private gene families (81.25%) overlapped regions predicted as viral by geNomad: 54 families in one chromosomal viral region, 20 in another chromosomal viral region, and 95 on the whole-contig viral candidate U1. No O11-private families overlapped the third chromosomal viral region. The remaining 39 families were located outside these regions. The overlap indicates genomic location, not necessarily viral protein function for all 169 families.
2.7. Functional Annotation of the O11-Private Gene Families
Functional categories of the 208 private families were assigned from the same Bakta re-annotation used for the pangenome. Of these, 111 families had an informative functional annotation (109 level A and 2 level B), whereas the remaining 97 families comprised 27 families with a domain or family of unknown precise function (level C) and 70 families annotated as hypothetical proteins (level D). The 111 level A/B families were assigned to eight functional categories, with phage structural, packaging and lysis functions forming the largest category, followed by DNA replication and recombination, enzymes/metabolism, defence/restriction–modification, mobility/plasmids, regulation of expression, transport/secretion and other annotated functions (Table 4).
Representative Bakta annotations for the 111 level A/B families are provided in Table S2. These Bakta-based categories provide a broad functional grouping; they do not imply that the encoded proteins are functionally novel, nor that O11 carries more phage genes than other P. agglomerans genomes. On the chromosome, the private families were concentrated in four regions. CHR-1 (2.69–2.74 Mb) corresponds to the PP2 prophage described in Section 2.5 and contains 54 private families, of which 12 are phage-annotated. CHR-2 (3.335–3.352 Mb) contains 20 private families, of which 7 are phage-annotated; its markers (terminase, portal, capsid, prophage protease and recombinase) identify it as a second candidate phage island. CHR-3 (2.947–2.957 Mb) is enriched in restriction/mobility functions (SacI endonuclease, methyltransferase, relaxase and mobilization proteins), and CHR-4 (3.393–3.403 Mb) in recombination/primase functions (recombinase, primase-helicase and endonuclease). These regions are windows of enrichment of private families and do not necessarily coincide with the precise boundaries of the mobile elements. U1 (91016 bp) carried the highest density of private families (95), including 27 phage-annotated families, 10 replication/recombination families and several mobility and restriction-modification families; its GC content (52.56%) is lower than that of the chromosome (54.94%), consistent with possible compositional differences but insufficient by itself to demonstrate horizontal transfer.
Of the 111 informative O11-private families, 46 belonged to the largest annotated category, phage-associated functions, and they were concentrated mainly in two chromosomal regions (CHR-1, the PP2 prophage, and CHR-2, a second candidate phage island) and on the unplaced contig U1 (Table S2). Notably, U1 carried a complete lysis module (holin, lysis determining protein and the Rz lytic protein) together with the structural and packaging genes of a tailed phage, and it also had the highest density of private families. Because the strain was isolated from wheat seeds of the Ural-Siberian forest-steppe ecogeographical group, in which germination occurs at low temperatures, these elements may affect persistence or microbial interactions in the seed niche, although this remains a hypothesis, as the elements are resolved only to the class level (Caudoviricetes) and their functions, activity at low temperature and ecological roles have not been tested. These observations are discussed in Section 3.4.
3. Discussion
3.1. Pantoea Agglomerans as a Culturable Component of the Seed Microbiome of Ural-Siberian Wheat
Recovery of P. agglomerans from all three cultivars agrees with our earlier 16S rRNA gene survey of these cultivars, in which the genus Pantoea was identified as the key taxon [7]. Because isolation targeted Pantoea, the collection does not estimate the overall composition of the culturable seed microbiota. Other studies have likewise detected Pantoea in wheat seed microbiomes worldwide [9,10,19,20]. Pantoea was also recorded in Russian wheat cultivars [21], and seed-mediated transmission of P. agglomerans has been demonstrated in wheat [10].
The universal and agroecotype-specific MALDI-TOF clusters indicate spectral variation among the collected isolates. Their genetic relationships remain to be examined by genome sequencing. Some subclusters varied between runs (Section 2.2), and relatively few colonies were sampled per cultivar. The agroecotype-specific designation reflects its observed distribution among the studied cultivars. The agroecotype-specific cluster was found in Omskaya 35 and Uralosibirskaya 2; the universal cluster included isolates from all three cultivars.
For genome characterization, we selected O11 from cv. Omskaya 35, a representative of the universal spectral cluster and the reference cultivar of the group. Because this cluster includes isolates from all three cultivars, O11 provides a useful starting point for genome comparison. Isolate O15, representing the agroecotype-specific cluster, was reserved for future study. We examined the position of O11 within the 34-genome phylogeny.
3.2. Phylogenomic Structure of the 34-Genome Panel and the Hypothesised Mediterranean Origin of Pantoea agglomerans Strain O11
In the core-genome phylogeny of the 34-genome panel, the isolates fell into two broad branches at the top level (Figure 5). O11 fell in the first branch, together with part of the Spanish isolates and all Turkish isolates. The second branch contained the remaining Spanish isolates together with all German, Canadian, New Zealand and Kenyan isolates. The partition is compatible with, but does not demonstrate, a Mediterranean versus Euro-Atlantic division. The placement of the Canadian, New Zealand and Kenyan isolates in the second branch could be read as consistent with the historical integration of these regions into Atlantic-European agricultural and seed-exchange networks, but it could equally reflect the small number of genomes per region and the fact that the panel is drawn from a limited number of BioProjects. The presence of Spanish isolates in both branches could reflect the dual Mediterranean and Atlantic exposure of the Iberian Peninsula, or simply the uneven sampling within Spain. Under the Mediterranean-origin hypothesis — and only as a hypothesis — the O11 lineage would have been introduced into the European part of Russia from the Mediterranean region via the Black Sea region and subsequently moved to Western Siberia. We stress that the dataset contains no direct evidence for any of these movements.
We emphasize that this is a working hypothesis, not a demonstrated scenario. It is nevertheless worth stating here, because the conceptual framework of this study makes the phylogeographic pattern directly relevant rather than incidental. That framework treats the seed microbiome as a vertically transmitted, evolutionarily stabilized component of the plant holobiont. It is supported by the demonstration that seed-associated bacterial communities in Zea are conserved across boundaries of evolution, domestication and migration. A core microbiota persists from wild teosintes to modern maize, and community composition tracks host phylogeny rather than the environment in which the plants are grown [22]. Pantoea was among the genera cultured from seeds across all Zea genotypes in that study, so its association with seeds appears not to be a recent or cultivar-specific phenomenon but an evolutionarily stable one. This view is reinforced at a broader taxonomic scale by a meta-analysis of 63 seed microbiota studies covering 50 plant species, which identified a stable core fraction of about 30 bacterial and fungal taxa present in most plant species worldwide, with P. agglomerans among the dominant core taxa of seeds [23]. The stability of the seed-associated community against environmental change is further supported by a comparison of initial seeds and the next seed generation of Noccaea caerulescens grown on two contrasting soils. Root, stem and leaf endophytic communities depended on soil type, whereas the seed endophytic community remained essentially unchanged between the initial and the new seed generation [24]. If P. agglomerans is transmitted through seeds across generations [10], the genealogy of its strains may be expected to track, at least in part, the genealogy of the wheat seed material itself. This expectation is plausible but untested for the present panel, and it does not by itself identify the direction or timing of any movement. A Mediterranean-to-Siberia route of the O11 lineage is therefore a biologically motivated question worth testing, although the present data neither support nor exclude it.
Several limitations must be kept in view. The panel is unevenly sampled, the historical routes of wheat seed exchange are not documented in our dataset, and the intermediate regions of the hypothesised route (the Black Sea region, European Russia and Western Siberia) are not represented. In addition, the topology of a 34-genome core phylogeny is sensitive to the removal of individual BioProjects and to the uneven regional sampling, so the branch assignment of O11 should be regarded as provisional until denser sampling along the hypothesised route is available. Until these gaps are addressed, the biogeographic pattern should be read as compatible with a Mediterranean origin of the O11 lineage, but not as evidence for it.
3.3. Phage-Associated Functions Are Prominent Among the O11-Private Gene Families
Among 208 O11-private Panaroo families, 46 had phage-related annotations, the largest functional category (41% of the 111 families with Bakta annotation levels A or B). Other categories included DNA replication/recombination (19 families), defence/restriction-modification (10) and mobility/plasmid functions (9). These sequence-based assignments describe the private set; they do not measure total phage-gene abundance across the panel (Section 2.7 and Section 3.5).
Mobile elements are common in plant-associated bacteria. Prophages are widespread in prokaryotic genomes and are enriched in plant-associated bacteria, including Enterobacterales, Pseudomonas and Xanthomonadales [25]. In plant pathogens such as Pseudomonas, Xanthomonas, Pectobacterium and Dickeya, phage genes are found in 86–100% of sequenced genomes and make up 1.25–2.35% of their genetic content[25]. These studies place the viral regions of O11 within a broader pattern of phage-associated sequence diversity in plant-associated bacteria.
Mobile genetic elements, including prophages, contribute to accessory genome diversity in P. agglomerans. A recent pangenome analysis of 165 P. agglomerans genomes showed an open pangenome whose shell and cloud partitions are enriched in mobile-element functions, with the cloud genome enriched in COG categories for replication and repair, cell-envelope biogenesis, motility, defense and mobilome-related functions, including prophages and transposons [18]. O11 also contains a substantial phage-associated fraction among the families found only in this comparison panel. Among the functionally informative O11-private families, phage-associated genes formed the largest category, alongside genes associated with DNA mobility and restriction–modification systems. U1 also exhibited both viral and plasmid-associated sequence features, supporting its classification as a candidate phage–plasmid-like element. Long-read sequencing would help resolve its topology and replicon status (Section 2.5).
A survey of 38912 bacterial isolate genomes and 6073 metagenomes reported fewer prophages, plasmids and defense systems in plant-associated bacteria, particularly in the phyllosphere [26]. The authors discussed possible drivers, including plant-derived antiviral compounds, bacterial density and plant immunity [26]. Against this background, retention of phage-associated elements in O11 raises the possibility of benefits under some seed-associated conditions. If these elements persist through seed-mediated transmission, selection could favor functions that offset their maintenance costs. Transmission of particular P. agglomerans strains through wheat seeds has been demonstrated [10], although neither vertical transmission nor a fitness effect has been established for O11. Its phage-rich private regions therefore provide candidates for testing this hypothesis.
3.4. Possible Role of the Phage Arsenal of Pantoea Agglomerans O11 in Plant-Microbe Interactions
Studies of plant-associated phages focus mainly on Pseudomonas, Xanthomonas, Erwinia and Pectobacterium [25,27]. These studies provide a context for examining possible roles of phage-associated elements in seed endophytes.
Experimental studies of phages infecting P. agglomerans have primarily examined isolated viruses [28,29,30,31,32,33]. Some of these phages infect several bacterial strains. In fire blight biocontrol systems, P. agglomerans strains are used as carrier bacteria for lytic phages against Erwinia amylovora [34,35]. The predicted phage-associated elements of O11 may influence interactions among seed-associated bacteria. If U1 or chromosomal prophage PP2 proves inducible, phage release could affect neighboring susceptible bacteria during germination.U1 contains a predicted lysis module (holin, lysis-determining protein and Rz) and tailed-phage structural genes. The activity of these elements in the seed niche has not been tested.
Temperature may influence the activity of O11 phage-associated elements during wheat germination in Western Siberia. As germination begins, seed-associated bacteria resume growth, potentially altering their interactions with phages. Cold-active phages infecting P. agglomerans have been reported. Vid5, AAS21 and AAS23 form plaques at 4 °C, have an optimum around 20–22 °C, and infect only certain strains of P. agglomerans, whereas other strains of the same species and other Pantoea species are resistant [29,31,33]. These observations motivate testing whether U1 is active at germination temperatures. Activity during early germination could influence microbial competition in the seed niche.
A second context potentially relevant to the Ural-Siberian forest-steppe ecogeographical group comes from the Baltic studies. Nafs113, isolated from a grasshopper in Latvia, and LIET2, isolated from berries in Lithuania, are taxonomically so close that they have been proposed to be considered representatives of the same genus Lietduovirus, despite different sources and different countries [36]. The close relationship between Nafs113 and LIET2 is consistent with the idea that phages of P. agglomerans can form regionally connected pools circulating between different environments and hosts. If such pools exist, a West Siberian pool associated with the Ural-Siberian wheat group is a plausible — though untested — possibility. O11, a representative of the universal MALDI-TOF cluster (a cluster that includes isolates from all three varieties, although O11 itself was recovered from cv. Omskaya 35), could, in principle, be a candidate carrier of such a pool. This analogy is suggestive but does not constitute evidence for a West Siberian pool. The Baltic phages were isolated from insects and berries, not from wheat seeds, and no phage has yet been isolated from the Ural-Siberian wheat seed niche. The phage elements of O11 have not been resolved taxonomically below the class level, so their relationship to any regional pool remains unknown.
The extended early growth phase of these wheat cultivars also raises questions about variation in their seed-associated bacterial genomes. O11 represents the universal cluster, which is present in all three varieties, including the more plastic Uralosibirskaya [7]. Its phage-associated private families may reflect conditions shared by these cultivars, including cool germination. Comparing O11 with O15, the representative of the agroecotype-specific cluster, could help examine this possibility. The specificity of the O15 accessory genome may also reside in non-phage functions, for example in genes modulating plant stress signalling or metabolism. Genome comparison and functional characterization of O15 would help identify any differences associated with the two MALDI-TOF clusters.
3.5. Limitations and Future Directions
The Panaroo analysis defines O11-private families within the selected comparison panel. An independent protein-homology comparison could help distinguish divergent homologs from families absent in the panel. The number of private families also depends on clustering settings and panel composition. The predominance of phage annotations among these families does not measure the total viral gene content of other genomes. The activity and host range of the predicted viral elements require experimental study.
The private-family comparison did not assess the strain phenotype or functions encoded by genes shared across the panel. Experiments on plant growth effects, pathogen antagonism, cold tolerance and seedling colonization could relate the genomic findings to the ecological performance of O11.
The two MALDI-TOF clusters provide candidates for further genome-level comparison. Characterizing O15, the representative of the agroecotype-specific cluster, would be a useful next step. Comparing O11 and O15 could reveal differences in accessory genes and mobile elements associated with their distribution among cultivars. Testing the proposed phylogeographic route would require broader sampling and historical evidence of wheat seed exchange.
4. Materials and Methods
4.1. Plant Material and Seed Sampling
We studied three cultivars of spring bread wheat (Triticum aestivum L.)—Omskaya 35, Uralosibirskaya, and Uralosibirskaya 2—belonging to the Ural-Siberian forest-steppe ecogeographical group [7]. Seeds of all studied varieties were obtained from the Ketovsky district of the Kurgan Region, Russia (55.251347, 65.130131), and were provided by the agricultural company “KURGANSEMENA”. The same seed lots were used in our previous 16S rRNA gene (V3–V4) amplicon sequencing study of the bacterial seed microbiome of these varieties and in the present work. The raw paired-end reads from the previous study were deposited in the NCBI Sequence Read Archive under BioProject accession PRJNA1371621.
4.2. Isolation of Bacterial Endophytes from Surface-Sterilized Seeds
Because the genus Pantoea was identified as the key taxon in the seed bacterial microbiome of the studied wheat varieties in our previous 16S rRNA gene amplicon survey [7], we focused on isolating culturable representatives of this genus. For isolation, visually healthy and undamaged seeds were selected from each variety. Seeds were surface-sterilized in two stages. During the preliminary cleaning stage, seeds were thoroughly washed first with distilled water and then with a 0.1% soap solution, followed by rinsing with sterile water. The main sterilization was then carried out by treating the seeds with 70% ethanol for 5 min, after which the seeds were washed five times with sterile water. Surface sterilization was assessed using two controls: plating 100 µL of the final wash water onto LB agar and by the seed imprint method, in which sterilized seeds were pressed onto the surface of LB agar. In both cases, plates were incubated at 28 °C for 48 h; no microbial growth was observed.
Surface-sterilized seeds (1 g) were homogenized in 9 mL of sterile distilled water, and serial dilutions were plated onto LB agar. Plates were incubated at 28 °C for 48 h. Colonies with Pantoea-like morphology (yellow-pigmented, smooth, round, convex colonies) were picked and streaked onto fresh LB agar for purification. Purification was repeated three times to obtain pure cultures.
4.3. Identification of Isolates by MALDI-TOF MS
Presumptive Pantoea isolates were identified by matrix-assisted laser desorption/ionization time-of-flight mass spectrometry (MALDI-TOF MS) using a Bruker MALDI Biotyper system (Bruker Daltonics, Bremen, Germany). Before analysis, each isolate was subcultured on LB agar at 28 °C for 24 h to obtain fresh, well-isolated colonies. A single colony was transferred with a sterile toothpick onto a spot of a 96-spot polished steel MALDI target plate (Bruker Daltonics). For protein extraction, 1 µL of 70% (v/v) formic acid was applied to the spot and allowed to dry at room temperature, after which 1 μL of matrix solution (10 mg/mL α-cyano-4-hydroxycinnamic acid dissolved in 50% acetonitrile, 2.5% trifluoroacetic acid) (Bruker Daltonics) was overlaid and air-dried. Each isolate was spotted in duplicate.
Mass spectra were acquired on the MALDI Biotyper instrument in linear positive ion mode over the m/z range of 2000–20000, using FlexControl software (ver. 3.3, build 108; Bruker Daltonics). Calibration was performed with the Bruker Bacterial Test Standard according to the manufacturer’s instructions. For each spot, spectra were accumulated from at least 240 laser shots. Spectra were processed with MBT Compass / MALDI Biotyper software (version 3.0) and matched against the Bruker reference library.
Identification scores were interpreted according to the manufacturer’s criteria: a score ≥2.00 was interpreted as reliable species-level identification; a score of 1.70–1.99 indicated identification to the genus level; and a score of <1.70 was regarded as unreliable. Isolates with a species-level score for Pantoea agglomerans of ≥2.00 were retained for further analysis. Isolates that yielded scores below the species-level threshold or ambiguous results were re-extracted and re-analyzed. Escherichia coli ATCC 25922 was used as a quality-control strain.
4.4. Cluster Analysis of MALDI-TOF Mass Spectra and Strain Selection
To examine spectral diversity among the P. agglomerans isolates and select candidates for whole-genome sequencing, cluster analysis of the MALDI-TOF mass spectra was performed using the MALDI Biotyper Compass Explorer software (Bruker Daltonics). Principal component analysis (PCA) was applied to reduce the dimensionality of the peak intensity matrix and to project the spectra onto the principal components, followed by hierarchical clustering in the PCA space. The resulting PCA dendrogram was used to visualize the relationships among isolates and to define operational clusters.
The analysis revealed a clear division of the Pantoea agglomerans isolates into two major clusters. The first cluster comprised isolates obtained from all three wheat varieties, and was designated the universal cluster. The second cluster included isolates exclusively from the varieties Omskaya 35 and Uralosibirskaya 2, which in our previous study were identified as the most typical representatives of this agroecotype [7], and was designated the agroecotype-specific cluster. Based on the dendrogram topology and the distance levels, one representative strain was selected from each cluster. Both selected strains originated from the seeds of the variety Omskaya 35, which represents the reference member of the Ural-Siberian forest-steppe ecogeographical group. In the present work, we focused on the representative strain of the universal cluster, which was designated as P. agglomerans O-11 and subjected to whole-genome sequencing and comparative genomic analysis. The representative strain of the agroecotype-specific cluster was retained in the culture collection for future analysis.
4.5. DNA Extraction and Whole-Genome Sequencing
Genomic DNA was extracted from a fresh overnight culture of the selected P. agglomerans strain O11 using the FastDNA™ SPIN Kit for Soil (MP Biomedicals, USA) according to the manufacturer’s instructions. DNA integrity was checked by electrophoresis in a 0.8% agarose gel, and DNA concentration was measured on a Qubit® 2.0 fluorometer (Invitrogen, USA). The library (O11_WGS) was prepared with the NEBNext Ultra II DNA Library Prep Kit for Illumina (New England Biolabs, USA) and sequenced on a GeneMind FASTASeq 300 (Shenzhen GeneMind Biosciences, China) with paired-end 2 × 300 cycles.
4.6. Genome Assembly
4.6.1. Read Quality Control
Reads were processed with fastp 1.4.0 [37] with the following filtering criteria. A minimum base quality of 15 was required, and reads were discarded if more than 40% of their bases fell below this threshold, if they contained more than five ambiguous bases, or if they were shorter than 50 bp after trimming. Paired-end overlap analysis was enabled with a minimum overlap of 30 bp and at most five mismatches or 20% mismatches within the overlap. Adapter detection was enabled for paired-end reads, and poly-G trimming was disabled. All 5931197 retained pairs (mean read lengths 272 and 271 nt) were used for every assembly without subsampling. Insert size was estimated from properly paired alignments with MAPQ ≥ 20 and is reported for information only.
4.6.2. Genome Assembly
Six assemblers were run on the full set of 5931197 cleaned read pairs: SPAdes 4.3.0 [38], SKESA 2.5.1 [39], MEGAHIT 1.2.9 [40], MaSuRCA 4.1.4 [41], A5-miseq 20160825 [42] and Unicycler 0.5.1 [43]. The assemblers represent several short-read approaches: multi-k-mer de Bruijn graphs (SPAdes), conservative k-mer extension (SKESA), succinct de Bruijn graphs (MEGAHIT), a super-read and overlap-layout hybrid (MaSuRCA), an integrated pipeline (A5-miseq) and SPAdes-graph optimisation (Unicycler). SPAdes was run in careful mode with k-mer sizes of 21, 33, 55, 77, 99 and 127 and with the coverage cutoff disabled. SKESA was run with a minimum contig length of 200 bp. For MaSuRCA, the contigs from the CA/9-terminator output were used. MEGAHIT, A5-miseq and Unicycler were run with default settings. Each assembly was scaffolded against three guides (Section 4.6.3) and evaluated as described in Section 4.6.4.
4.6.3. Reference-Guided Scaffolding and Construction of the P1 Record
Contigs from each assembler were ordered and oriented with RagTag 2.1.0 scaffold [44] against three P. agglomerans guide genomes. Guide genomes were selected from publicly available P. agglomerans genomes. All assemblies of P. agglomerans (NCBI taxon 549) were listed with NCBI Datasets [45] on 22 October 2026 (981 records; 521 unique assemblies after merging GenBank/RefSeq pairs) and supplemented with members of the species in GTDB release R232 [46] (GTDB R232 release: https://gtdb.ecogenomic.org/stats/r232) (36 additional assemblies) and with BV-BRC genome listings [47] (12 additional listings; 128 BV-BRC entries lacked an assembly accession and could not be retrieved). Assemblies were downloaded with NCBI Datasets 18.39.0, and one GenBank/RefSeq duplicate was removed, giving 561 public genomes plus O11. From this panel, three complete genomes were chosen as guides to span the range from the closest complete wheat isolate to the official reference: C-406 (GCF_059509315.1), the closest complete long-read assembly to O11 (skani ANI 99.01%); LuF5004 (GCF_051136245.1; ANI 98.59%), a second complete long-read genome included to test the sensitivity of scaffolding to the choice of guide; and FDAARGOS 1447 (GCF_019048385.1), the only RefSeq reference genome for the species, an assembly from type material and the most divergent of the three guides (97.43%). This produced 18 assembler–guide combinations. Gaps introduced by RagTag were filled with 100 Ns to mark unknown length.
After scaffolding, the three SKESA contigs left unplaced by RagTag that aligned to C-406 plasmid unnamed2 at single-copy depth (93510, 53608 and 8948 bp; formerly U3, U4 and U5) were joined with the seven RagTag-placed P1 contigs into a single P1 record (537056 bp) in their order and orientation on C-406 NZ_JCAKJG010000003.1. Junction gaps were filled with N; their lengths were estimated from the distance between the flanking contig ends on C-406, or set to 100 N where this could not be estimated (1382 N in total). Each junction was checked for read pairs with MAPQ ≥ 20 and mates on both flanks and for single reads spanning it. Nine of the ten junctions were bridged by 3–61 read pairs, none was spanned by a single read, and the junction between former U5 and former U3 was bridged by no read pair, so its placement rests on homology to C-406 only. The P1 contig order and orientation therefore depend partly on reference homology; the scaffold is not a confirmed closed plasmid. The remaining unplaced contigs were renumbered U3–U5 (formerly U6–U8).
4.6.4. Assembly Assessment and Ranking
Completeness was measured with BUSCO 6.1.0 [48,49] in genome mode using the pantoea_odb12.2 lineage dataset (1717 markers), on all contigs and on contigs of at least 1 kb. Completeness and contamination were estimated with CheckM2 1.1.0 [50]. Reads were mapped with minimap2 2.31 [51] (short-read preset, secondary alignments reported, up to 20 per read) and processed with SAMtools 1.19.2 [52]. Depth and breadth of coverage were computed over non-N bases, and each RagTag join was assessed by the number of read pairs with MAPQ ≥ 20 spanning it. Structural discordance was assessed by projecting raw contigs onto each guide with minimap2 (asm5 preset) and recording candidate discordant contigs, orientation switches and sequence switches. Bidirectional ANI to the guides was computed with fastANI 1.34 [53] for the assembly ranking, whereas the ANI values given in Section 2.3 were obtained with skani 0.4.0 [54]. The 18 candidates were ranked on 15 pre-defined metrics covering contiguity (e.g., N50 and number of contigs), completeness (BUSCO), read support (unsupported non-N bases and breadth of coverage), unplaced sequence, structural consistency (orientation and sequence switches) and ANI to the guide, and the mean rank with equal weights was used to select the final assembly. Circularity evidence for each replicon (terminal overlaps and end-spanning read pairs with MAPQ ≥ 20) and per-record depth were computed from full-depth alignments.
4.6.5. Read Support of Joins and Gap-Closing Attempts
Each RagTag join in the 18 scaffolds was assessed by the number of read pairs with MAPQ ≥ 20 spanning it, as described in Section 4.6.4. Computational gap closing was attempted on the SPAdes scaffolds with ABySS-Sealer 2.3.10 [55] and SOAPdenovo2 GapCloser 1.12 [56], and RagTag patch [44] was tested with the other assemblies as donors. Proposed junctions were evaluated for read support before acceptance. A junction was accepted only if it was spanned by at least five read pairs with MAPQ ≥ 20 with mates on both flanks and did not conflict with the guide order. No proposed junction met these criteria, so the assembly was not modified.
4.7. Genome Annotation
The final eight-record SKESA→C-406 assembly (4969270 bp) was annotated using Bakta v1.12.2 [57] with the full database v6.0. The original run used --genus Pantoea --species agglomerans --locus-tag PANG34 --keep-contig-headers --threads 16 --skip-plot. The Bakta GFF3, TSV, JSON and FAA outputs were used to distinguish 4660 conventional CDS from 10 sORFs, count RNA features and identify hypothetical proteins and pseudogene flags. All 4670 protein-coding features were included in the protein set used for downstream functional annotation; pseudogene flags were not counted as additional genes. This full-database annotation supplied the gene tracks in Figure 3 and the O11 gene calls used in the 34-genome pangenome comparison (Section 4.9). The same eight-record assembly had previously been annotated separately with Bakta v1.12.2 and the light database v6.0 solely for the genomic-island scan (Section 4.8). The light annotation is summarized in Supplementary Table S3.
The 4670 Bakta full protein sequences were annotated with eggNOG-mapper v3.0.0-beta6 against eggNOG database v7.0.0 [58,59]. Seed orthologs were identified by iterative DIAMOND v2.2.8 [60] protein searches in sensitive mode (--itype proteins -m diamond --dmnd_sensmode sensitive --dmnd_iterate yes --cpu 16; E-value threshold 10^-3). The search produced 5149 hit rows covering 4537 distinct protein queries with seed orthologs. An annotation-only recovery step reused the saved seed orthologs (-m no_search --annotate_hits_table <seed_orthologs> --cpu 2 --report_dropped --override). The final annotation file contained records for 4366 unique protein queries; 133 input proteins had no seed ortholog, and another 171 seed-bearing proteins had no final annotation record. Coverage was calculated using unique query identifiers and the 4670-protein input as the denominator. Nonempty functional or domain fields (preferred name, GO, EC, KEGG KO/pathway/module, CAZy and Pfam) were counted separately. Numerical COG-family identifiers were subsequently converted to standard COG functional-category letters for the subsystem-style summary (Table 3).
For the COG-derived subsystem summary, numerical COG identifiers in the eggNOG v3 COG_category field were converted to functional-category letters with the NCBI COG2024 cog-24.def.tab definitions [16]. All 3418 proteins with numerical COG identifiers were mapped; 463 proteins with category S and 485 without a COG assignment in the final eggNOG output were tracked separately, as were 304 proteins without an eggNOG annotation record. The following fixed COG-to-subsystem mapping was applied as a descriptive adaptation of the nine subsystem headings used for Pantoea trifolii MMK2ᵀ [17]: metabolism (E, F, G, H, I, Q); regulation and cell signaling (K, T); protein processing (J, O); cell envelope (M); energy (C); membrane transport (P, U); cellular processes (B, D, L, N, Z); stress response, defense and virulence (V); and RNA processing (A). Categories R, S, X and W, and missing assignments, were not included in these nine groups. Each protein was counted once within each subsystem, but proteins assigned to multiple subsystems were included in each corresponding group. Percentages were based on all 4670 Bakta full protein-coding features. These categories are COG-derived approximations and are not directly comparable with PATRIC subsystem counts.
4.8. Prediction of Mobile Genetic Elements and Horizontally Acquired Regions
The final 8-record SKESA→C-406 assembly (4969270 bp) was screened for prophages, genomic islands, integrons and insertion sequences. Viral and plasmid sequences, including integrated proviruses, were identified with geNomad 1.13.0 [61] using database 1.9 in end-to-end mode, and the completeness and contamination of viral regions were estimated with CheckV 1.1.1 [62] using database 1.5. Insertion sequences were identified with ISEScan 1.7.3 [63], and integrons were searched with IntegronFinder 2.0.6 [64] using local-maximum detection with functional annotation of integron genes enabled. All four tools were run directly on the assembly FASTA and were independent of gene annotation.
Genomic islands were predicted with an in-house Python (version 3.11.18) reimplementation of the IslandPath-DIMOB procedure [65]. For each CDS in the Bakta light annotation [57] (Supplementary Table S3), the dinucleotide relative-abundance difference δ* from the whole-genome signature was computed. Runs of at least eight consecutive CDSs with δ* above the genome-wide 90th percentile, tolerating one non-biased CDS within a run, were taken as candidate islands. A candidate was classified as a genomic island when it contained a mobility gene (integrase, recombinase, transposase, phage, conjugation or mobilization gene, by Bakta product name) within the region or within 5 kb of it. Candidates without such genes are reported as compositional-only, and tRNA genes within 2 kb of island boundaries were recorded. Because genomic islands were inferred from the light-database CDS calls, these predictions depend on that separate annotation (Table S3); the other mobile-element tools do not.
Per-record read depth was taken from the read-mapping validation described in Section 4.6.4. Coordinates are 1-based on the final 8-record assembly.
4.9. Pangenome Analysis and Gene-Family Composition
Comparative pangenome analysis was performed using 34 genome assemblies of Pantoea agglomerans, including the newly characterized isolate O11 and 33 comparative genomes. All assemblies were annotated with Bakta v1.12.2 using the full reference database (version 6.0), and the resulting GFF3 annotations were processed with Panaroo v1.8.1 [66] in sensitive cleaning mode with removal of invalid gene annotations enabled. The sensitive cleaning mode was selected to retain low-frequency gene families, including those potentially associated with plasmids, prophages and other mobile genetic elements, which were a focus of this study. This mode reduces the risk of excluding biologically relevant accessory genes during graph cleaning, although it may also retain spurious gene clusters resulting from annotation or assembly errors. Gene families were extracted from the Panaroo sensitive matched analysis output. Matrix entries were converted into binary presence–absence values, with 1 indicating that a gene family was detected in the corresponding genome and 0 indicating its absence; each gene family was counted once, irrespective of its copy number within an individual genome.
To determine the genomic distribution of O11-private gene families, Panaroo family assignments were linked to O11 coding-sequence coordinates from the uniform full-database Bakta annotation used for the 34-genome comparison. The coordinates were intersected with the geNomad-predicted viral regions on the same final eight-record assembly (Section 4.8), including U1 as a whole-contig viral candidate. Each family was counted once; it was classified as overlapping a viral region if at least one O11 coding sequence assigned to that family overlapped such a region. Families with no such overlap were counted outside the predicted regions. This analysis describes positional overlap with predicted regions.
Gene families were classified according to their prevalence across the 34 genomes. Strict core families were defined as those present in all 34 genomes (100%), soft-core families as those present in 33 genomes (97.1%), shell families as those occurring in 6–32 genomes (17.6–94.1%), and cloud families as those detected in 1–5 genomes (2.9–14.7%). For plotting, we defined the accessory genome as the union of soft-core, shell and cloud families, i.e. all families absent from at least one analysed genome.
To estimate gene-family accumulation as genomes were added, 1000 random permutations of the order of the 34 genomes were generated using Python 3.11.18 [67] and NumPy 2.4.6 [68] with a fixed random seed. Each permutation sampled the complete set of genomes without replacement. For each permutation and each successive number of sampled genomes (1–34), the cumulative pangenome size was calculated as the number of gene families present in at least one genome of the corresponding subset, and the shared core-genome size as the number of families present in every genome of that subset. Pangenome sizes used the union of families and shared-core sizes their intersection. For every sample size, the median was calculated across the 1000 permutations, and the 2.5th and 97.5th percentiles were used to represent the central 95% permutation interval. The intervals describe variation with genome ordering.
The relative abundance of the four pangenome categories was calculated by dividing the number of families in each category by the total number of distinct families detected across the 34 genomes. The two-panel figure was generated in Python 3.11.18 using NumPy 2.4.6 and Matplotlib 3.11.2 [69].
4.10. Core-Genome Phylogenomic Analysis
Phylogenomic inference used the same 34 genomes. All genomes were annotated with Bakta 1.12.2 using the full reference database (version 6.0), and the resulting GFF3 annotations were subjected to pangenome analysis with Panaroo 1.8.1 in sensitive cleaning mode with removal of invalid gene annotations. Orthologous gene families present in all 34 genomes were defined as the strict core genome, comprising 3532 gene families before alignment filtering.
Core-gene nucleotide sequences were extracted and aligned using the Panaroo core-genome alignment workflow with MAFFT v7.526 [70], with the core threshold set to 1.0. Gene alignments were concatenated after Panaroo entropy-based filtering of outlying alignments. The filtered concatenated nucleotide alignment, comprising 3221211 aligned positions across 34 genomes, was used for phylogenetic inference.
A maximum-likelihood phylogeny was inferred with IQ-TREE 3.1.4 [71]. ModelFinder selected the nucleotide substitution model [72] according to the Bayesian information criterion (BIC); the GTR+F+I+R3 model was identified as the best-fitting model and applied to the concatenated alignment without gene-specific partitioning. We assessed branch support using 1000 ultrafast bootstrap replicates (UFBoot2) [73] and 1000 SH-like approximate likelihood ratio test (SH-aLRT) replicates [74], with nearest-neighbor interchange optimization of the ultrafast bootstrap trees enabled. A fixed random seed was used.
The resulting maximum-likelihood tree was visualized using Biopython 1.88 [75] and Matplotlib 3.11.2 [69]. The tree was midpoint-rooted for display. Branch lengths were displayed as substitutions per site. Nodes satisfying both SH-aLRT ≥ 80 and UFBoot ≥ 95 were indicated by filled circles; these thresholds were used to display supported branches. Strain designations, genome assembly accessions and reported countries of isolation were obtained from the genome metadata. The O11 isolate was highlighted in red.
5. Conclusions
This study reports the first draft genome assembly of Pantoea agglomerans isolated from wheat seeds of the West Siberian forest-steppe. Whole-genome sequencing of strain O11, a representative of the universal MALDI-TOF cluster recovered from all three wheat varieties examined, provides a quality-ranked genomic resource for this agroecotype. Comparative genomic analysis with 33 publicly available P. agglomerans genomes from wheat seeds worldwide identified 208 private gene families in O11, of which 111 received functionally informative annotations. Phage structural, packaging and lysis functions dominated this private arsenal (46 of 111 families), indicating that the accessory genome of O11 is organized around phage elements.
This is notable in light of evidence that plant-associated bacteria tend to be depleted, rather than enriched, in mobile genetic elements relative to non-plant-associated and soil bacteria. If this depletion reflects plant-imposed selection against mobile elements, then the prophages and the candidate phage-plasmid (U1) retained by O11 are unlikely to be neutral passengers and may instead contribute to fitness in the seed niche. The phage-plasmid status of U1 is inferred from short-read data and remains to be confirmed with long reads (Section 2.5); the argument here does not depend on the precise nature of this element, but only on the observation that phage-related functions dominate the private gene set of O11. We cautiously hypothesize that these elements could be relevant to the cold germination conditions characteristic of the West Siberian forest-steppe, where wheat seeds germinate at low temperatures. This hypothesis remains untested, but it makes the strain a candidate for further investigation as a biocontrol agent under low-temperature conditions.
Crucially, the present work does not demonstrate biocontrol activity, cold adaptation, or phage function. What it provides is a genome-anchored framework that transforms the search for beneficial traits from a blind screen into a targeted investigation. The private gene families identified here constitute a defined set of candidates whose roles can now be tested directly. In this sense, the study establishes a path from genotype to beneficial phenotype: the genomic comparison generates specific, testable hypotheses about which functions may underlie the strain’s performance in the seed and germination niche, and these hypotheses can guide experimental work on antagonism against phytopathogens, plant growth promotion, stress tolerance and colonization behaviour. Such experimental validation is required before any biocontrol application can be considered, but the genomic resource and the candidate list reported here make that validation feasible and, for the first time for this agroecotype, precisely directed.
Supplementary Materials
The following supporting information can be downloaded at the website of this paper posted on Preprints.org. Supplementary data comprise Table S1, comparative genome metadata for 33 public P. agglomerans wheat-seed isolates and O11; Table S2, Bakta-based functional annotations of 111 informative O11-private gene families; and Table S3, structural-annotation statistics from the Bakta light dataset used for genomic-island prediction.
Author Contributions
Conceptualization, R.Y.; methodology, R.Y., I.K., D.K., E.P., K.K. and U.Y.; software, D.K., E.P., K.K. and U.Y.; validation, D.K., E.P., K.K. and U.Y.; formal analysis, R.Y., D.K., E.P., K.K. and U.Y.; investigation, R.Y., I.K., A.S. and D.K.; resources, R.Y., I.K., D.K., E.P., K.K. and U.Y.; data curation, R.Y., K.K. and U.Y.; writing—original draft preparation, R.Y.; writing—review and editing, R.Y., C.A., A.A., S.V. and U.Y.; visualization, R.Y., C.A., D.K., K.K. and U.Y.; supervision, R.Y. and U.Y.; project administration, R.Y.; funding acquisition, R.Y. All authors have read and agreed to the published version of the manuscript.
Funding
This research was funded by Russian Science Foundation, grant number 25-26-00324 (https://rscf.ru/project/25-26-00324/).
Institutional Review Board Statement
Not applicable.
Informed Consent Statement
Not applicable.
Data Availability Statement
The raw whole-genome sequencing reads generated in this study have been deposited in the NCBI Sequence Read Archive under BioProject PRJNA1548801 (BioSample SAMN64363475). The corresponding genome assembly accession is pending and will be provided once the assembly becomes publicly available. The comparative genome accessions and functional annotations of the 111 informative O11-private families are provided in Supplementary Tables S1 and S2, respectively.
Acknowledgments
The authors are grateful to the leadership of the agricultural holding “KURGANSEMENA” for providing seeds of the spring wheat cultivars used in this study.
Conflicts of Interest
The authors declare no conflicts of interest. The funders had no role in the design of the study; in the collection, analyses, or interpretation of data; in the writing of the manuscript; or in the decision to publish the results.
Abbreviations
The following abbreviations are used in this manuscript:
| nt | Nucleotide |
| MAPQ | Mapping Quality |
| ANI | Average Nucleotide Identity |
| CDS | Coding Sequence |
| GI | Genomic Island |
References
- Qi, X.; Jin, D.; Olimi, E.; Chen, X.; Cernava, T. What do we know about the seed microbiome? Microbiome 2026, 14, 106. [Google Scholar] [CrossRef] [PubMed]
- Chen, J.; Sharifi, R.; Khan, M.S.S.; Islam, F.; Bhat, J.A.; Kui, L.; Majeed, A. Wheat microbiome: Structure, dynamics, and role in improving performance under stress environments. Front. Microbiol. 2022, 12, 821546, Corrgendum in Front. Microbiol. 2022, 13. [Google Scholar] [CrossRef] [PubMed]
- Sun, Z.; Adeleke, B.S.; Shi, Y.; Li, C. The seed microbiomes of staple food crops. Microb. Biotechnol. 2023, 16, 2236–2249. [Google Scholar] [CrossRef] [PubMed]
- Kumar, A.; Solanki, M.K.; Wang, Z.; Solanki, A.C.; Singh, V.K.; Divvela, P.K. Revealing the seed microbiome: Navigating sequencing tools, microbial assembly, and functions to amplify plant fitness. Microbiol. Res. 2024, 279, 127549. [Google Scholar] [CrossRef] [PubMed]
- Romão, I.R.; do Carmo Gomes, J.; Silva, D.; Vilchez, J.I. The seed microbiota from an application perspective: an underexplored frontier in plant-microbe interactions. Crop Health 2025, 3, 12. [Google Scholar] [CrossRef] [PubMed]
- Xu, X.-Y.; Wang, C.-L.; Xu, J.-Y.; Dong, C.-J.-H.; Tan, C.; He, Y.-X.; Hu, H.-W.; Shu, K.; Dai, C.-C.; Chen, Z.-H.; et al. Seed-microbiome interactions: Mechanistic insights and utilization toward seed performance for sustainable agriculture. Plant Commun. 2026, 7, 101716. [Google Scholar] [CrossRef] [PubMed]
- Yuldashev, R.; Maslennikova, D.; Koryakov, I.; Gerasimov, N.; Kuznetsov, K.; Suleymanov, A.; Allagulova, C.; Avalbaev, A.; Ponomareva, E.; Yunusbaev, U. Seed bacterial microbiome in spring bread wheat varieties of the Ural-Siberian forest-steppe ecogeographical group. Russ. J. Plant Physiol. 2026, 73, 81. [Google Scholar] [CrossRef]
- Kuźniar, A.; Włodarczyk, K.; Grządziel, J.; Goraj, W.; Gałązka, A.; Wolińska, A. Culture-independent analysis of an endophytic core microbiome in two species of wheat: Triticum aestivum L. (cv. ‘Hondia’) and the first report of microbiota in Triticum spelta L. (cv. ‘Rokosz’). Syst. Appl. Microbiol. 2020, 43, 126025. [Google Scholar] [CrossRef] [PubMed]
- Aswini, K.; Suman, A.; Sharma, P.; Singh, P.K.; Gond, S.; Pathak, D. Seed endophytic bacterial profiling from wheat varieties of contrasting heat sensitivity. Front. Plant Sci. 2023, 14, 1101818. [Google Scholar] [CrossRef] [PubMed]
- Sanz-Puente, I.; Redondo-Salvo, S.; Torres-Cortés, G.; de Toro, M.; Fernandes, S.; Börner, A.; Lorenzo, Ó.; de la Cruz, F.; Robledo, M. Seed-mediated vertical transmission of Pantoea core endophytes. ISME J. 2025, 19, wraf192. [Google Scholar] [CrossRef] [PubMed]
- Zhou, H.; Zhao, M.; Xiong, Q.; Feng, C.; Pu, Z.; Chen, G.; Wang, S.; Dong, Y.; Wang, X.; Long, H.; et al. Effect of wheat varieties and cultivation environments on grain endophytes, microbial communities, and quality of medium-high temperature Daqu in Chinese baijiu. Foods 2025, 14, 982. [Google Scholar] [CrossRef] [PubMed]
- Martinez, M.; Ballesteros, G.; Arata, A.F.; Ueno, A.C.; Gundel, P.E.; Stenglein, S.A. Preliminary screening of the impact of high night temperatures on the Fusarium graminearum–wheat pathosystem and wheat seed microbiome: an exploratory assessment. Physiol. Mol. Plant Pathol. 2026, 144, 103290. [Google Scholar] [CrossRef]
- Shi, W.; Yu, K.; Li, R.; Chen, Z.; Sun, Y.; Zhang, Y.; Ma, Z.; Zhang, Q.; Han, D. Diversity and predicted functional profiles of wheat seed endophytic microbiota associated with grain nutritional quality traits. Agronomy 2026, 16, 1929. [Google Scholar] [CrossRef]
- Lorenzi, A.S.; Bonatelli, M.L.; Chia, M.A.; Peressim, L.; Quecine, M.C. Opposite sides of Pantoea agglomerans and its associated commercial outlook. Microorganisms 2022, 10, 2072. [Google Scholar] [CrossRef] [PubMed]
- Coutinho, T.A.; Venter, S.N. Pantoea and plants: Friends, foes, and everything in between. Phytopathology, 2026; online ahead of print. [CrossRef] [PubMed]
- Galperin, M.Y.; Vera Alvarez, R.; Karamycheva, S.; Makarova, K.S.; Wolf, Y.I.; Landsman, D.; Koonin, E.V. COG database update 2024. Nucleic Acids Res. 2025, 53, D356–D363. [Google Scholar] [CrossRef] [PubMed]
- Wdowiak-Wróbel, S.; Kalita, M.; Palusińska-Szysz, M.; Marek-Kozaczuk, M.; Sokołowski, W.; Coutinho, T.A. Pantoea trifolii sp. nov., a novel bacterium isolated from Trifolium rubens root nodules. Sci. Rep. 2024, 14, 2698. [Google Scholar] [CrossRef] [PubMed]
- Sulman, M.; Svircev, A.M.; Tambong, J.T.; Ellouze, W. Integrative genomic and network analyses map horizontal gene transfer dynamics in Pantoea agglomerans. Res. Sq. 2026; preprint. [CrossRef] [PubMed]
- Díaz Herrera, S.; Grossi, C.; Zawoznik, M.; Groppa, M.D. Wheat seeds harbour bacterial endophytes with potential as plant growth promoters and biocontrol agents of Fusarium graminearum. Microbiol. Res. 2016, 186–187, 37–43. [Google Scholar] [CrossRef] [PubMed]
- Pang, F.; Tao, A.; Ayra-Pardo, C.; Wang, T.; Yu, Z.; Huang, S. Plant organ- and growth stage-diversity of endophytic bacteria with potential as biofertilisers isolated from wheat (Triticum aestivum L.). BMC Plant Biol. 2022, 22, 276. [Google Scholar] [CrossRef] [PubMed]
- Dolgov, A.R.; Utkin, D.V.; Khachaturov, E.G.; Polivanov, D.A.; Shcherbakova, N.E.; Karlov, M.V.; Kasatkin, M.Yu.; Stepanov, S.A.; Shutareva, G.I. Comparative analysis of the biodiversity of endophytic microorganisms of spring durum wheat at different phases of plant growth and development. Bull. Perm Univ. Biol. 2024, 2, 165–175. [Google Scholar] [CrossRef]
- Johnston-Monje, D.; Raizada, M.N. Conservation and diversity of seed associated endophytes in Zea across boundaries of evolution, ethnography and ecology. PLoS ONE 2011, 6, e20396. [Google Scholar] [CrossRef] [PubMed]
- Simonin, M.; Briand, M.; Chesneau, G.; Rochefort, A.; Marais, C.; Sarniguet, A.; Barret, M. Seed microbiota revealed by a large-scale meta-analysis including 50 plant species. New Phytol. 2022, 234, 1448–1463. [Google Scholar] [CrossRef] [PubMed]
- Durand, A.; Leglize, P.; Lopez, S.; Sterckeman, T.; Benizri, E. Noccaea caerulescens seed endosphere: a habitat for an endophytic bacterial community preserved through generations and protected from soil influence. Plant Soil 2022, 472, 257–278. [Google Scholar] [CrossRef]
- Huerta, A.I.; Joglekar, P.; Totsline, N.; D’Amico-Willman, K.M.; Ritchie, D.F. Plant-associated phages across scales: ecological and evolutionary principles for a neglected virosphere. Phil. Trans. R. Soc. B 2026, 381, 20250124. [Google Scholar] [CrossRef] [PubMed]
- Bograd, A.; Oppenheimer-Shaanan, Y.; Levy, A. Plasmids, prophages, and defense systems are depleted from plant microbiota genomes. Genome Biol. 2025, 26, 163. [Google Scholar] [CrossRef] [PubMed]
- Smith, R.E.; Holtappels, D. The role of phages in plant-associated microbial communities. Essays Biochem. 2026, 70, 433–444. [Google Scholar] [CrossRef] [PubMed]
- Adriaenssens, E.M.; Ceyssens, P.-J.; Dunon, V.; Ackermann, H.-W.; Van Vaerenbergh, J.; Maes, M.; De Proft, M.; Lavigne, R. Bacteriophages LIMElight and LIMEzero of Pantoea agglomerans, belonging to the “phiKMV-like viruses”. Appl. Environ. Microbiol. 2011, 77, 3443–3450. [Google Scholar] [CrossRef] [PubMed]
- Simoliunas, E.; Simoliuniene, M.; Kaliniene, L.; Zajanckauskaite, A.; Skapas, M.; Meskys, R.; Kaupinis, A.; Valius, M.; Truncaite, L. Pantoea bacteriophage vB_PagS_Vid5: a low-temperature siphovirus that harbors a cluster of genes involved in the biosynthesis of archaeosine. Viruses 2018, 10, 583. [Google Scholar] [CrossRef] [PubMed]
- McDougall, D.L.; Soutar, C.D.; Perry, B.J.; Brown, C.; Alexander, D.; Yost, C.K.; Stavrinides, J. Isolation and characterization of vB_PagP-SK1, a T7-like phage infecting Pantoea agglomerans. PHAGE 2020, 1, 45–56. [Google Scholar] [CrossRef] [PubMed]
- Simoliuniene, M.; Truncaite, L.; Petrauskaite, E.; Zajanckauskaite, A.; Meskys, R.; Skapas, M.; Kaupinis, A.; Valius, M.; Simoliunas, E. Pantoea agglomerans-infecting bacteriophage vB_PagS_AAS21: a cold-adapted virus representing a novel genus within the family Siphoviridae. Viruses 2020, 12, 479. [Google Scholar] [CrossRef] [PubMed]
- Truncaitė, L.; Šimoliūnienė, M.; Alijošius, L.; Petrauskaitė, E.; Kiaušaitė, L.; Meškys, R.; Skapas, M.; Šimoliūnas, E. Complete genome analysis of Pantoea agglomerans-infecting bacteriophage vB_PagM_AAM22. Arch. Virol. 2020, 165, 2111–2114. [Google Scholar] [CrossRef] [PubMed]
- Zukauskiene, E.; Simoliuniene, M.; Truncaite, L.; Skapas, M.; Kaupinis, A.; Valius, M.; Meskys, R.; Simoliunas, E. Pantoea bacteriophage vB_PagS_AAS23: a singleton of the genus Sauletekiovirus. Microorganisms 2021, 9, 668. [Google Scholar] [CrossRef] [PubMed]
- Gayder, S.; Parcey, M.; Nesbitt, D.; Castle, A.J.; Svircev, A.M. Population dynamics between Erwinia amylovora, Pantoea agglomerans and bacteriophages: exploiting synergy and competition to improve phage cocktail efficacy. Microorganisms 2020, 8, 1449. [Google Scholar] [CrossRef] [PubMed]
- Ibrahim, N.; Nesbitt, D.; Guo, Q.T.; Lin, J.; Svircev, A.; Wang, Q.; Weadge, J.T.; Anany, H. Improved viability of spray-dried Pantoea agglomerans for phage-carrier mediated control of fire blight. Viruses 2024, 16, 257. [Google Scholar] [CrossRef] [PubMed]
- Zrelovs, N.; Jansons, J.; Kazaka, T.; Kazaks, A.; Dislers, A. Three phages one host: isolation and characterization of Pantoea agglomerans phages from a grasshopper specimen. Int. J. Mol. Sci. 2023, 24, 1820. [Google Scholar] [CrossRef] [PubMed]
- Chen, S.; Zhou, Y.; Chen, Y.; Gu, J. fastp: an ultra-fast all-in-one FASTQ preprocessor. Bioinformatics 2018, 34, i884–i890. [Google Scholar] [CrossRef] [PubMed]
- Bankevich, A.; Nurk, S.; Antipov, D.; Gurevich, A.A.; Dvorkin, M.; Kulikov, A.S.; Lesin, V.M.; Nikolenko, S.I.; Pham, S.; Prjibelski, A.D.; et al. SPAdes: A new genome assembly algorithm and its applications to single-cell sequencing. J. Comput. Biol. 2012, 19, 455–477. [Google Scholar] [CrossRef] [PubMed]
- Souvorov, A.; Agarwala, R.; Lipman, D.J. SKESA: strategic k-mer extension for scrupulous assemblies. Genome Biol. 2018, 19, 153. [Google Scholar] [CrossRef] [PubMed]
- Li, D.; Liu, C.-M.; Luo, R.; Sadakane, K.; Lam, T.-W. MEGAHIT: an ultra-fast single-node solution for large and complex metagenomics assembly via succinct de Bruijn graph. Bioinformatics 2015, 31, 1674–1676. [Google Scholar] [CrossRef] [PubMed]
- Zimin, A.V.; Salzberg, S.L. The MaSuRCA genome assembler. Bioinformatics 2013, 29, 2669–2677. [Google Scholar] [CrossRef] [PubMed]
- Coil, D.; Jospin, G.; Darling, A.E. A5-miseq: an updated pipeline to assemble microbial genomes from Illumina MiSeq data. Bioinformatics 2015, 31, 587–589. [Google Scholar] [CrossRef] [PubMed]
- Wick, R.R.; Judd, L.M.; Gorrie, C.L.; Holt, K.E. Unicycler: resolving bacterial genome assemblies from short and long sequencing reads. PLoS Comput. Biol. 2017, 13, e1005595. [Google Scholar] [CrossRef] [PubMed]
- Alonge, M.; Lebeigle, L.; Kirsche, M.; Jenike, K.; Ou, S.; Aganezov, S.; Wang, X.; Lippman, Z.B.; Schatz, M.C.; Soyk, S. Automated assembly scaffolding using RagTag elevates a new tomato system for high-throughput genome editing. Genome Biol. 2022, 23, 258. [Google Scholar] [CrossRef] [PubMed]
- O’Leary, N.A.; Cox, E.; Holmes, J.B.; Anderson, W.R.; Falk, R.; Hem, V.; Tsuchiya, M.T.N.; Schuler, G.D.; Zhang, X.; Torcivia, J.; et al. Exploring and retrieving sequence and metadata for species across the tree of life with NCBI Datasets. Sci. Data 2024, 11, 732. [Google Scholar] [CrossRef] [PubMed]
- Parks, D.H.; Chaumeil, P.-A.; Mussig, A.J.; Rinke, C.; Chuvochina, M.; Hugenholtz, P. GTDB release 10: a complete and systematic taxonomy for 715,230 bacterial and 17,245 archaeal genomes. Nucleic Acids Res. 2026, 54, D743–D754, Erratum in Nucleic Acids Res. 2026, 54, D1818. [Google Scholar] [CrossRef] [PubMed]
- Shukla, M.; Wattam, A.R.; Aleman, A.; Bhattacharya, R.; Bowers, N.; Brettin, T.; Capria, A.; Chia, N.; Cucinell, C.; Davis, J.J.; et al. BV-BRC: a unified bacterial and viral bioinformatics resource with expanded functionality and AI integration. Nucleic Acids Res. 2026, 54, D715–D723. [Google Scholar] [CrossRef] [PubMed]
- Manni, M.; Berkeley, M.R.; Seppey, M.; Simão, F.A.; Zdobnov, E.M. BUSCO update: novel and streamlined workflows along with broader and deeper phylogenetic coverage for scoring of eukaryotic, prokaryotic, and viral genomes. Mol. Biol. Evol. 2021, 38, 4647–4654. [Google Scholar] [CrossRef] [PubMed]
- Tegenfeldt, F.; Kuznetsov, D.; Manni, M.; Berkeley, M.; Zdobnov, E.M.; Kriventseva, E.V. OrthoDB and BUSCO update: Annotation of orthologs with wider sampling of genomes. Nucleic Acids Res. 2025, 53, D516–D522. [Google Scholar] [CrossRef] [PubMed]
- Chklovski, A.; Parks, D.H.; Woodcroft, B.J.; Tyson, G.W. CheckM2: a rapid, scalable and accurate tool for assessing microbial genome quality using machine learning. Nat. Methods 2023, 20, 1203–1212, Author correction in Nat. Methods 2023, 21, 735. [Google Scholar] [CrossRef] [PubMed]
- Li, H. Minimap2: pairwise alignment for nucleotide sequences. Bioinformatics 2018, 34, 3094–3100. [Google Scholar] [CrossRef] [PubMed]
- Danecek, P.; Bonfield, J.K.; Liddle, J.; Marshall, J.; Ohan, V.; Pollard, M.O.; Whitwham, A.; Keane, T.; McCarthy, S.A.; Davies, R.M.; Li, H. Twelve years of SAMtools and BCFtools. GigaScience 2021, 10, giab008. [Google Scholar] [CrossRef] [PubMed]
- Jain, C.; Rodriguez-R, L.M.; Phillippy, A.M.; Konstantinidis, K.T.; Aluru, S. High throughput ANI analysis of 90K prokaryotic genomes reveals clear species boundaries. Nat. Commun. 2018, 9, 5114. [Google Scholar] [CrossRef] [PubMed]
- Shaw, J.; Yu, Y.W. Fast and robust metagenomic sequence comparison through sparse chaining with skani. Nat. Methods 2023, 20, 1661–1665. [Google Scholar] [CrossRef] [PubMed]
- Paulino, D.; Warren, R.L.; Vandervalk, B.P.; Raymond, A.; Jackman, S.D.; Birol, I. Sealer: A scalable gap-closing application for finishing draft genomes. BMC Bioinform. 2015, 16, 230. [Google Scholar] [CrossRef] [PubMed]
- Luo, R.; Liu, B.; Xie, Y.; Li, Z.; Huang, W.; Yuan, J.; He, G.; Chen, Y.; Pan, Q.; Liu, Y.; et al. SOAPdenovo2: An empirically improved memory-efficient short-read de novo assembler. GigaScience 2012, 1, 18, Erratum in GigaScience 2015, 8, 20. [Google Scholar] [CrossRef] [PubMed]
- Schwengers, O.; Jelonek, L.; Dieckmann, M.A.; Beyvers, S.; Blom, J.; Goesmann, A. Bakta: Rapid and standardized annotation of bacterial genomes via alignment-free sequence identification. Microb. Genom. 2021, 7, 000685. [Google Scholar] [CrossRef] [PubMed]
- Cantalapiedra, C.P.; Hernández-Plaza, A.; Letunic, I.; Bork, P.; Huerta-Cepas, J. eggNOG-mapper v2: functional annotation, orthology assignments, and domain prediction at the metagenomic scale. Mol. Biol. Evol. 2021, 38, 5825–5829. [Google Scholar] [CrossRef] [PubMed]
- Hernández-Plaza, A.; Deng, Z.; Robledo-Yagüe, F.; Szklarczyk, D.; von Mering, C.; Bork, P.; Huerta-Cepas, J. eggNOG v7: phylogeny-based orthology predictions and functional annotations. Nucleic Acids Res. 2026, 54, D402–D408. [Google Scholar] [CrossRef] [PubMed]
- Buchfink, B.; Reuter, K.; Drost, H.-G. Sensitive protein alignments at tree-of-life scale using DIAMOND. Nat. Methods 2021, 18, 366–368. [Google Scholar] [CrossRef] [PubMed]
- Camargo, A.P.; Roux, S.; Schulz, F.; Babinski, M.; Xu, Y.; Hu, B.; Chain, P.S.G.; Nayfach, S.; Kyrpides, N.C. Identification of mobile genetic elements with geNomad. Nat. Biotechnol. 2024, 42, 1303–1312. [Google Scholar] [CrossRef] [PubMed]
- Nayfach, S.; Camargo, A.P.; Schulz, F.; Eloe-Fadrosh, E.; Roux, S.; Kyrpides, N.C. CheckV assesses the quality and completeness of metagenome-assembled viral genomes. Nat. Biotechnol. 2021, 39, 578–585. [Google Scholar] [CrossRef] [PubMed]
- Xie, Z.; Tang, H. ISEScan: automated identification of insertion sequence elements in prokaryotic genomes. Bioinformatics 2017, 33, 3340–3347. [Google Scholar] [CrossRef] [PubMed]
- Néron, B.; Littner, E.; Haudiquet, M.; Perrin, A.; Cury, J.; Rocha, E.P.C. IntegronFinder 2.0: Identification and analysis of integrons across bacteria, with a focus on antibiotic resistance in Klebsiella. Microorganisms 2022, 10, 700. [Google Scholar] [CrossRef] [PubMed]
- Bertelli, C.; Brinkman, F.S.L. Improved genomic island predictions with IslandPath-DIMOB. Bioinformatics 2018, 34, 2161–2167. [Google Scholar] [CrossRef] [PubMed]
- Tonkin-Hill, G.; MacAlasdair, N.; Ruis, C.; Weimann, A.; Horesh, G.; Lees, J.A.; Gladstone, R.A.; Lo, S.; Beaudoin, C.; Floto, R.A.; et al. Producing polished prokaryotic pangenomes with the Panaroo pipeline. Genome Biol. 2020, 21, 180. [Google Scholar] [CrossRef] [PubMed]
- Python Software Foundation. Python 3.11.18 release. 2026. Available online: https://www.python.org/downloads/release/python-31118/ (accessed on 10 October 2026).
- Harris, C.R.; Millman, K.J.; van der Walt, S.J.; Gommers, R.; Virtanen, P.; Cournapeau, D.; Wieser, E.; Taylor, J.; Berg, S.; Smith, N.J.; et al. Array programming with NumPy. Nature 2020, 585, 357–362. [Google Scholar] [CrossRef] [PubMed]
- Hunter, J.D. Matplotlib: A 2D graphics environment. Comput. Sci. Eng. 2007, 9, 90–95. [Google Scholar] [CrossRef]
- Katoh, K.; Standley, D.M. MAFFT multiple sequence alignment software version 7: improvements in performance and usability. Mol. Biol. Evol. 2013, 30, 772–780. [Google Scholar] [CrossRef] [PubMed]
- Wong, T.K.F.; Ly-Trong, N.; Ren, H.; Demotte, P.; Baños, H.; Roger, A.J.; Susko, E.; Bielow, C.; De Maio, N.; Goldman, N.; et al. IQ-TREE 3: phylogenomic inference software using complex evolutionary models. Mol. Biol. Evol. 2026, 43, msag117. [Google Scholar] [CrossRef] [PubMed]
- Kalyaanamoorthy, S.; Minh, B.Q.; Wong, T.K.F.; von Haeseler, A.; Jermiin, L.S. ModelFinder: fast model selection for accurate phylogenetic estimates. Nat. Methods 2017, 14, 587–589. [Google Scholar] [CrossRef] [PubMed]
- Hoang, D.T.; Chernomor, O.; von Haeseler, A.; Minh, B.Q.; Vinh, L.S. UFBoot2: improving the ultrafast bootstrap approximation. Mol. Biol. Evol. 2018, 35, 518–522. [Google Scholar] [CrossRef] [PubMed]
- Guindon, S.; Dufayard, J.-F.; Lefort, V.; Anisimova, M.; Hordijk, W.; Gascuel, O. New algorithms and methods to estimate maximum-likelihood phylogenies: assessing the performance of PhyML 3.0. Syst. Biol. 2010, 59, 307–321. [Google Scholar] [CrossRef] [PubMed]
- Cock, P.J.A.; Antao, T.; Chang, J.T.; Chapman, B.A.; Cox, C.J.; Dalke, A.; Friedberg, I.; Hamelryck, T.; Kauff, F.; Wilczynski, B.; de Hoon, M.J.L. Biopython: freely available Python tools for computational molecular biology and bioinformatics. Bioinformatics 2009, 25, 1422–1423. [Google Scholar] [CrossRef] [PubMed]
Figure 1.
Ural–Siberian forest-steppe wheat cultivation area in (a) northern Asia and (b) Western Siberia and northern Kazakhstan. Green shading: forest-steppe ecoregions; red ellipse: approximate cultivation area. Map sources: RESOLVE Ecoregions 2017, Natural Earth and GSHHG. WGS 84 (EPSG:4326)..
Figure 1.
Ural–Siberian forest-steppe wheat cultivation area in (a) northern Asia and (b) Western Siberia and northern Kazakhstan. Green shading: forest-steppe ecoregions; red ellipse: approximate cultivation area. Map sources: RESOLVE Ecoregions 2017, Natural Earth and GSHHG. WGS 84 (EPSG:4326)..
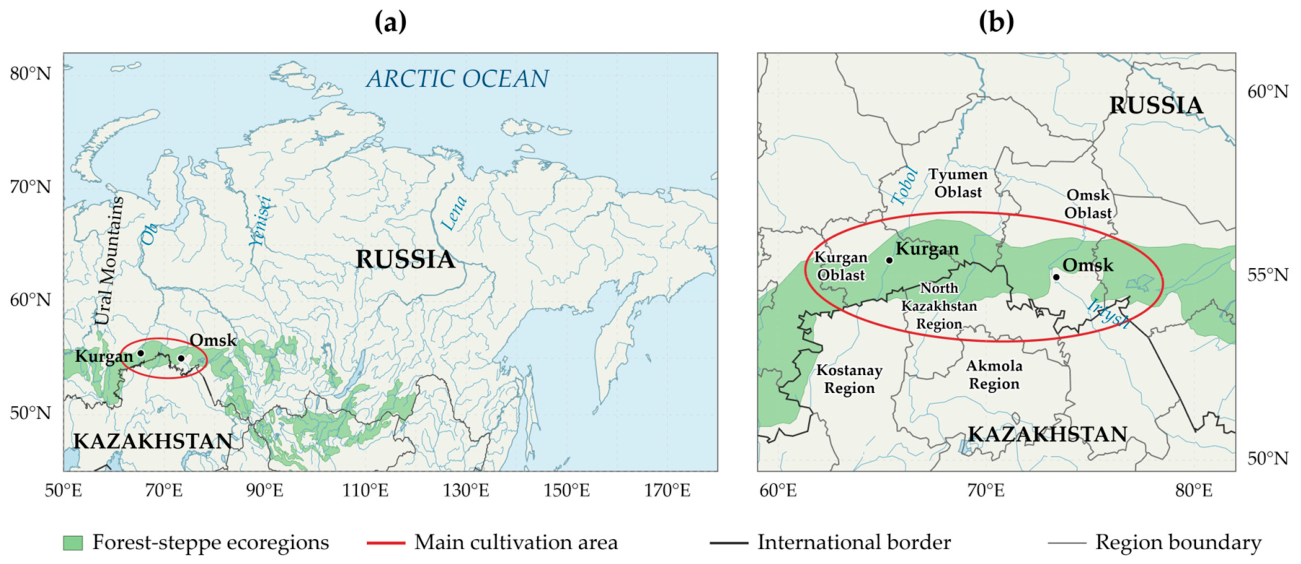
Figure 2.
PCA-based clustering of MALDI-TOF spectra from 36 P. agglomerans isolates obtained from three spring wheat cultivars: Omskaya 35 (n = 13), Uralosibirskaya (n = 16), and Uralosibirskaya 2 (n = 7). The asterisk marks isolate O11 from Omskaya 35, selected for genome sequencing. The dendrogram was redrawn without changing isolate order or clustering distances.
Figure 2.
PCA-based clustering of MALDI-TOF spectra from 36 P. agglomerans isolates obtained from three spring wheat cultivars: Omskaya 35 (n = 13), Uralosibirskaya (n = 16), and Uralosibirskaya 2 (n = 7). The asterisk marks isolate O11 from Omskaya 35, selected for genome sequencing. The dendrogram was redrawn without changing isolate order or clustering distances.
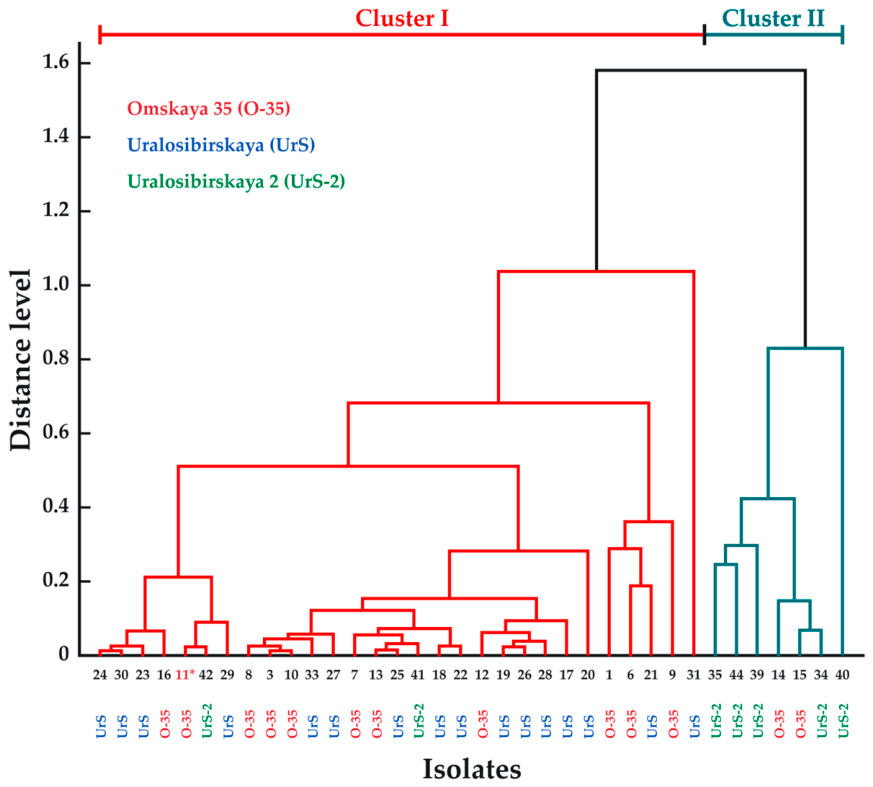
Figure 3.
Genome map of the 4.97-Mb draft assembly of P. agglomerans O11. The chromosome (1×) contains 128 N-marked gaps; plasmid-like P1 and P2 are shown at ×5. U1–U5 are unplaced; U1 (91016 bp) is phage-like. P1 contains ten reported N intervals, one without paired-read support. The inferred replicon structures are not confirmed as closed. Gene tracks use the Bakta full annotation. From outside inward, rings show genes on both strands, contig blocks and gaps (red: 100-N; blue: reference-estimated), read depth in 2-kb windows, and GC skew. The red triangle marks the predicted oriC. The inset shows P1 and P2 at chromosome scale.
Figure 3.
Genome map of the 4.97-Mb draft assembly of P. agglomerans O11. The chromosome (1×) contains 128 N-marked gaps; plasmid-like P1 and P2 are shown at ×5. U1–U5 are unplaced; U1 (91016 bp) is phage-like. P1 contains ten reported N intervals, one without paired-read support. The inferred replicon structures are not confirmed as closed. Gene tracks use the Bakta full annotation. From outside inward, rings show genes on both strands, contig blocks and gaps (red: 100-N; blue: reference-estimated), read depth in 2-kb windows, and GC skew. The red triangle marks the predicted oriC. The inset shows P1 and P2 at chromosome scale.
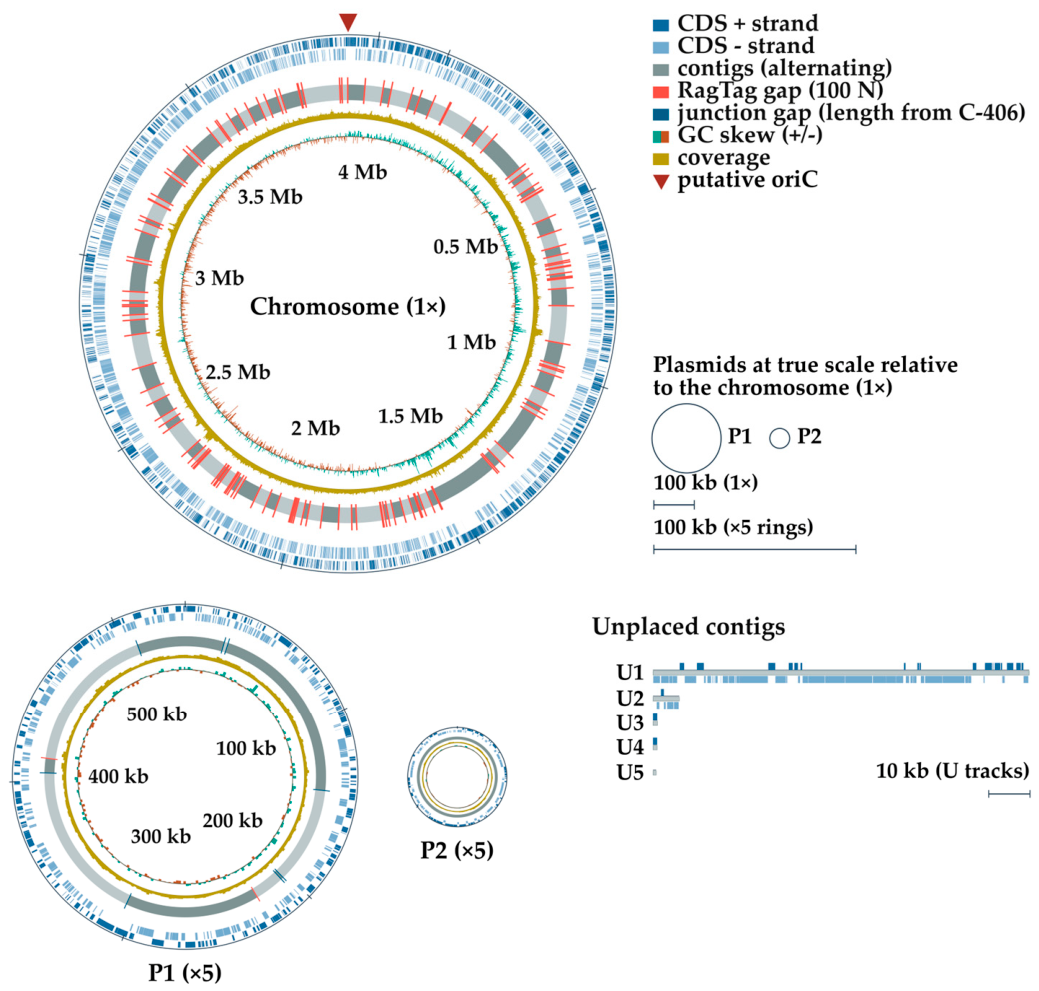
Figure 4.
Pangenome accumulation and composition across 34 Pantoea agglomerans genomes. (a) Pangenome accumulation and shared core-genome decay as a function of the number of sampled genomes. Curves show medians from 1000 genome-order permutations; shading marks the 2.5th–97.5th percentiles. Pangenome and shared-core sizes represent the union and intersection of sampled gene-family sets, respectively. (b) Relative composition of the pangenome inferred using Panaroo v1.8.1. Categories are strict core (present in 34/34 genomes), soft-core (33/34), shell (6–32) and cloud (1–5). Each family was counted once per genome.
Figure 4.
Pangenome accumulation and composition across 34 Pantoea agglomerans genomes. (a) Pangenome accumulation and shared core-genome decay as a function of the number of sampled genomes. Curves show medians from 1000 genome-order permutations; shading marks the 2.5th–97.5th percentiles. Pangenome and shared-core sizes represent the union and intersection of sampled gene-family sets, respectively. (b) Relative composition of the pangenome inferred using Panaroo v1.8.1. Categories are strict core (present in 34/34 genomes), soft-core (33/34), shell (6–32) and cloud (1–5). Each family was counted once per genome.
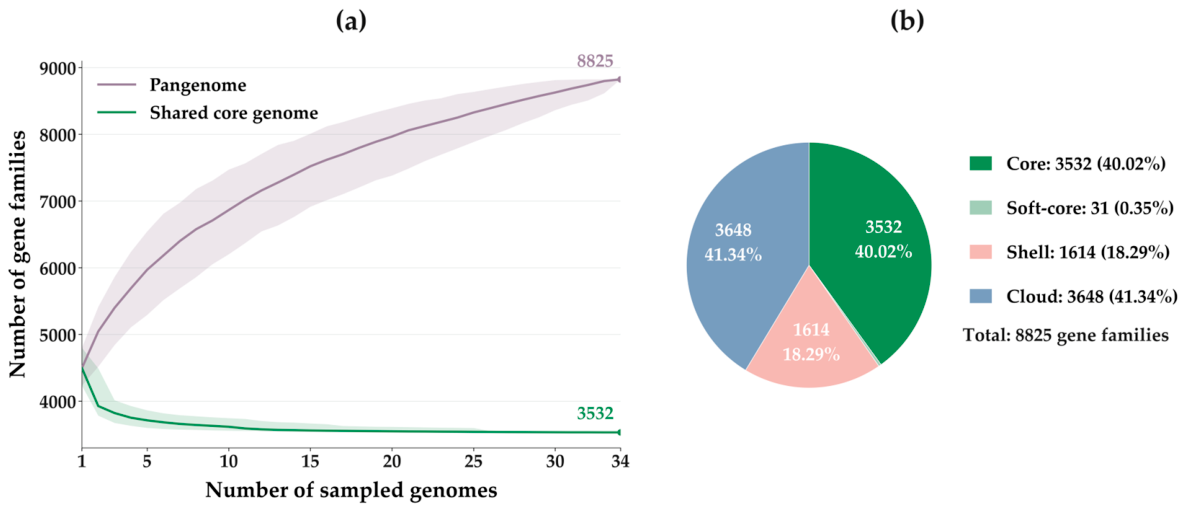
Figure 5.
Core-genome phylogeny of P. agglomerans O11 and 33 other wheat-seed isolates. The tree was inferred from a 3221211-bp Panaroo/MAFFT core-gene alignment using IQ-TREE 3.1.4 and GTR+F+I+R3. Support was assessed with 1000 SH-aLRT and ultrafast bootstrap replicates. Black circles mark SH-aLRT ≥80 and UFBoot ≥95. Scale: 0.002 substitutions per site; midpoint-rooted for display.
Figure 5.
Core-genome phylogeny of P. agglomerans O11 and 33 other wheat-seed isolates. The tree was inferred from a 3221211-bp Panaroo/MAFFT core-gene alignment using IQ-TREE 3.1.4 and GTR+F+I+R3. Support was assessed with 1000 SH-aLRT and ultrafast bootstrap replicates. Black circles mark SH-aLRT ≥80 and UFBoot ≥95. Scale: 0.002 substitutions per site; midpoint-rooted for display.
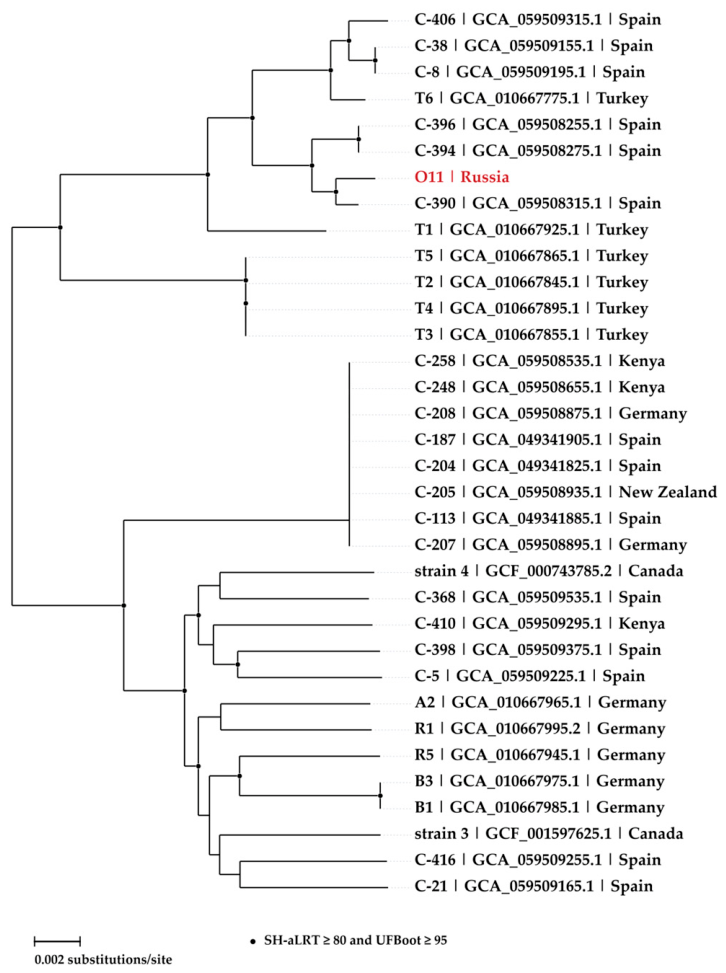

Table 1.
Structural features of the P. agglomerans O11 draft genome (Bakta v1.12.2, full database v6.0).
Table 1.
Structural features of the P. agglomerans O11 draft genome (Bakta v1.12.2, full database v6.0).
| Feature | Number |
|---|---|
| Genome assembly length (bp) | 4969270 |
| Genome G+C content (%) | 54.62 |
| Sequence records | 8 |
| Conventional CDS | 4660 |
| Small ORFs (sORFs) | 10 |
| Total protein-coding features (CDS + sORFs) | 4670 |
| Hypothetical proteins, n (% of proteins) | 340 (7.28%) |
| Candidate pseudogene flags within CDS* | 19 |
| tRNA genes | 64 |
| rRNA features (5S / partial 16S / partial 23S) | 4 (2/1/1) |
| tmRNA | 1 |
| Other ncRNA features | 47 |
| Regulatory RNA regions | 47 |
| Putative oriC sites | 2 |
| CRISPR arrays detected | 0 |
Pseudogene flags are included in the protein-coding total. Partial 16S and 23S rRNAs on U3 and U4 prevent an accurate operon count.
Table 2.
Functional annotation summary for the Pantoea agglomerans O11 genome (Bakta full; eggNOG-mapper v3.0.0-beta6, eggNOG database v7.0.0).
Table 2.
Functional annotation summary for the Pantoea agglomerans O11 genome (Bakta full; eggNOG-mapper v3.0.0-beta6, eggNOG database v7.0.0).
| Feature | Number | % |
|---|---|---|
| Proteins with a final eggNOG annotation record | 4366 | 93.49 |
| Proteins with a COG identifier or category S | 3881 | 83.10 |
| Proteins with GO terms | 1857 | 39.76 |
| Proteins with a KEGG Orthology (KO) identifier | 3142 | 67.28 |
| Proteins assigned to ≥1 KEGG pathway | 1834 | 39.27 |
| Proteins with Pfam domain assignments | 3994 | 85.52 |
| Proteins with an Enzyme Commission (EC) number | 1533 | 32.83 |
Percentages are relative to all 4670 Bakta full protein-coding features. The eggNOG v3 COG_category field includes 3418 numerical COG-family identifiers and 463 category-S annotations; these values require conversion before functional-letter classification. A protein may receive several functional assignments.
Table 3.
Major protein-coding genes of Pantoea agglomerans O11 and their distribution by subsystem category, mapped from eggNOG COG functional categories (category scheme adapted from P. trifolii MMK2ᵀ [17]).
Table 3.
Major protein-coding genes of Pantoea agglomerans O11 and their distribution by subsystem category, mapped from eggNOG COG functional categories (category scheme adapted from P. trifolii MMK2ᵀ [17]).
| Subsystem category | Number of proteins |
|---|---|
| Metabolism | 1141 |
| Regulation and cell signaling | 568 |
| Protein processing | 412 |
| Cell envelope | 294 |
| Energy | 173 |
| Membrane transport | 317 |
| Cellular processes | 298 |
| Stress response, defense, virulence | 113 |
| RNA processing | 7 |
COG identifiers were converted to functional category letters using NCBI COG2024 definitions. Proteins were counted once per category; multiple-category assignments were retained. The nine-category mapping is given in Section 4.7; the categories follow a COG-based mapping. The category total is 3323 assignments among 3086 distinct proteins.
Table 4.
Functional categories of the 208 O11-private gene families across the chromosome, U1 and P2.
Table 4.
Functional categories of the 208 O11-private gene families across the chromosome, U1 and P2.
| Functional category | Chromosome | U1 | P2 | Total |
|---|---|---|---|---|
| Phage structural/packaging/lysis | 19 | 27 | 0 | 46 |
| DNA replication/recombination | 9 | 10 | 0 | 19 |
| Enzymes/metabolism | 3 | 9 | 0 | 12 |
| Defence/restriction/modification | 5 | 5 | 0 | 10 |
| Mobility/plasmids | 6 | 3 | 0 | 9 |
| Regulation of expression | 8 | 1 | 0 | 9 |
| Transport/secretion | 3 | 1 | 0 | 4 |
| Other annotated functions | 1 | 1 | 0 | 2 |
| Domain/family without precise function (level C) | 13 | 14 | 0 | 27 |
| Unknown/hypothetical (level D) | 44 | 24 | 2 | 70 |
P1 and the unplaced contigs U2–U5 contained no private families and are therefore not shown.
Disclaimer/Publisher’s Note: The statements, opinions and data contained in all publications are solely those of the individual author(s) and contributor(s) and not of MDPI and/or the editor(s). MDPI and/or the editor(s) disclaim responsibility for any injury to people or property resulting from any ideas, methods, instructions or products referred to in the content. |
© 2026 by the authors. Licensee MDPI, Basel, Switzerland. This article is an open access article distributed under the terms and conditions of the Creative Commons Attribution (CC BY) license (http://creativecommons.org/licenses/by/4.0/).
Copyright: This open access article is published under a Creative Commons CC BY 4.0 license, which permit the free download, distribution, and reuse, provided that the author and preprint are cited in any reuse.