

Submitted:
11 November 2026
Posted:
12 November 2026
You are already at the latest version
Abstract
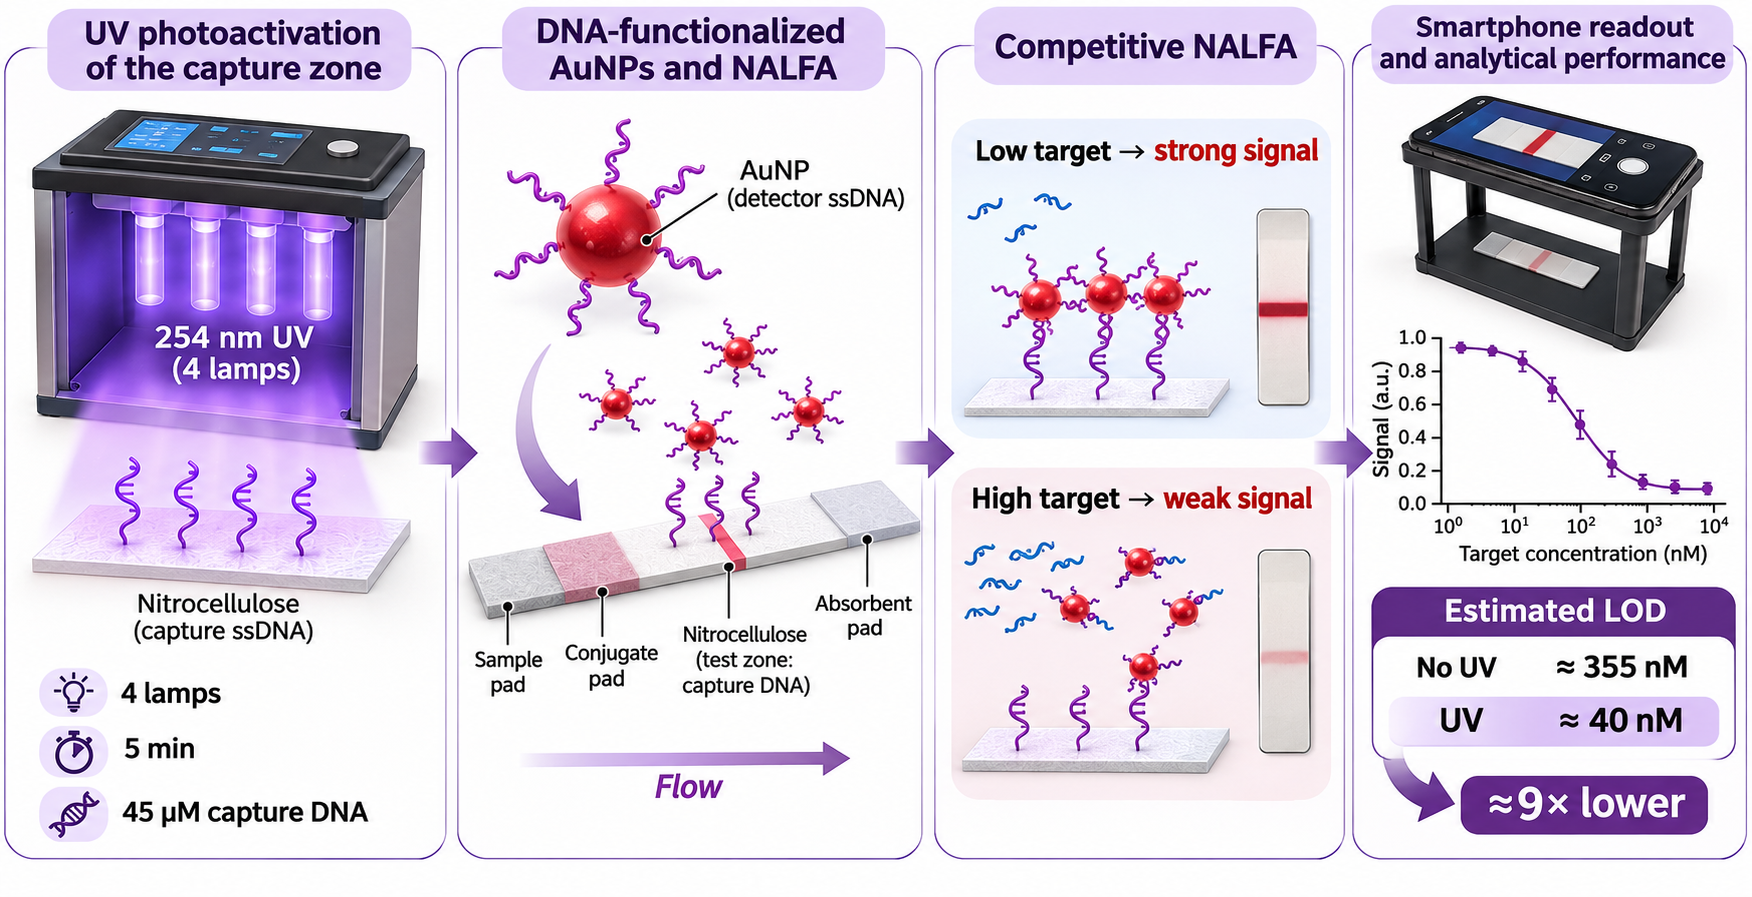
Preparation of a reproducible and functionally accessible DNA capture zone on nitrocellulose is a critical step in nucleic-acid lateral flow assay (NALFA) fabrication. Here, we repurpose and characterize a four-lamp 254 nm UV photoactivation chamber, originally developed for antibody immobilization, for the preparation of DNA capture zones on nitrocellulose. Lamp configuration, exposure time, and capture-DNA spotting concentration were evaluated through the hybridization-dependent capture of DNA-functionalized gold nanoparticles (AuNPs), prepared by freeze-thaw conjugation and used as colorimetric reporters. Smartphone images acquired under fixed geometry were quantified using a grayscale-calibrated ImageJ workflow. Activating all four lamps produced the highest functional hybridization signal, approximately 2.2-fold above the untreated condition. A 5 min exposure was selected as a practical compromise between response magnitude, observed variability, and processing time, and 45 µM capture DNA was selected as the working spotting concentration. In a proof-of-concept competitive assay, UV-treated membranes showed greater separation between the blank and low-target responses, corresponding to an estimated concentration-based limit of detection of approximately 40 nM, compared with approximately 355 nM for untreated membranes under the investigated conditions. These results establish chamber-specific operating conditions and a measurement-guided workflow for UV-assisted fabrication of functional DNA capture zones, while distinguishing functional assay response from direct claims of quantitative DNA retention or a specific attachment mechanism.
Keywords:
nucleic acid lateral flow assay
; nitrocellulose
; UV irradiation
; capture probe
; DNA hybridization
; gold nanoparticles
; smartphone readout
; photoactivation
1. Introduction
Lateral flow assays (LFAs) are among the most established point-of-care analytical platforms because they combine rapid capillary-driven operation, low manufacturing cost, portability, and visual interpretation [1,2]. In colorimetric formats, gold nanoparticles (AuNPs) are the most widely used signal reporters owing to their localized surface plasmon resonance, chemical stability, and compatibility with different bioconjugation strategies [3,4]. Together with a wide variety of biorecognition elements, including antibodies, aptamers, and nucleic acid probes, and different classes of signal reporters, they enable readouts ranging from qualitative visual detection to quantitative analysis [5,6].
In nucleic acid lateral flow assays (NALFAs), these elements are combined with sequence-specific hybridization to detect DNA or RNA targets through an interpretable optical signal, and their use for direct DNA recognition and for the detection of amplified nucleic acids is well established [7,8].
For a reproducible NALFA, however, the capture zone must be treated as an engineered interface: the amount of deposited oligonucleotide is only one aspect of performance, since capture probes must also remain on the membrane and stay accessible to complementary strands during flow. Nitrocellulose is the most common porous support for LFA devices, yet immobilizing short, protein-free DNA sequences on it is not trivial. Recent approaches rely on modified capture oligonucleotides and selected membrane architectures [9], or on buffer conditions that promote DNA deposition, retention, and hybridization [10]. These studies show that functional DNA capture on nitrocellulose must be optimized experimentally rather than inferred from the applied DNA.
UV irradiation offers a practical approach to DNA immobilization on membranes, avoiding the need for coupling reagents, elevated temperatures, prolonged fixation times, or modifications to the strip architecture [11].
UV fixation of DNA on nitrocellulose has been known since early membrane blotting studies, which showed that treatment conditions affect subsequent hybridization and retention [12,13]. The outcome, however, is substrate- and protocol-dependent, and UV exposure should not be equated with quantitative, irreversible, or covalent fixation of every deposited oligonucleotide. In NALFAs, the relevant endpoint is the fraction of capture probes that remain able to recognize the flowing DNA target. UV-assisted NALFA preparation has precedent: Pongsuchart and co-workers reported improved responses after UV treatment, including with non-biotinylated capture sequences [14], and a more recent study compared UV, thermal, and streptavidin–biotin immobilization in terms of probe loss and functional detection [15]. These works establish the feasibility of UV-based capture-zone preparation but leave room for the adaptation and systematic characterization of dedicated irradiation platforms for this application.
In this context, the ImmunoLyte© device provides a relevant technological starting point. Originally developed for the Photochemical Immobilization Technique, the platform uses UV irradiation to promote the oriented immobilization of IgG antibodies on metallic surfaces, including gold substrates and nanostructures. This process relies on UV-induced photoreduction of disulfide bridges in specific tryptophan-cysteine environments within immunoglobulins, generating thiol groups capable of interacting with metal surfaces [16]. Although designed for antibody functionalization, the same multi-source irradiation architecture can be repurposed for a different biomolecule-substrate combination. Here, we investigate its use for UV-assisted preparation of DNA capture zones on nitrocellulose membranes for NALFAs.
This adaptation requires dedicated characterization of the irradiation conditions because the nominal electrical power of a lamp does not directly describe the optical exposure delivered to the sample. Power (W), irradiance (W cm−2), and radiant exposure (J cm−2) are distinct quantities [17], and source geometry, detector area, measurement position, and dosimetric reporting all affect the interpretation of UV exposure [18]. Accordingly, chamber-specific optical characterization is required before irradiation settings can be linked to functional assay performance.
Exposure time is equally important: insufficient irradiation may result in poor capture-zone functionality, whereas prolonged exposure does not necessarily improve hybridization, since UVC radiation can induce photochemical modifications in nucleic acids [19,20]. Therefore, identifying the shortest reproducible exposure that ensures an effective hybridization response is essential.
In this study, we repurpose and characterize the previously described device, equipped with four independently selectable 254 nm low-pressure mercury lamps, for NALFA fabrication. Rather than proposing UV crosslinking of DNA to nitrocellulose as a new phenomenon, our objective is to establish chamber-specific operating conditions and a reproducible, measurement-guided workflow for preparing functional DNA capture zones. We systematically investigate the effects of lamp configuration, exposure time, and capture-DNA spotting concentration on the hybridization-dependent lateral-flow response.
AuNPs serve as the mobile colorimetric reporters. They are conjugated to a thiolated DNA probe by a freeze-thaw procedure [21,22] kept constant throughout the study; this solution-phase freezing approach, previously applied to DNA detection in nucleic-acid/nanoparticle assays [23], is distinct from the UV treatment of membrane-deposited DNA investigated here. Test-spot intensity is quantified from smartphone images acquired with fixed geometry and processed using an identical ImageJ background-correction workflow. In the final competitive experiment, we distinguish the signal threshold from the corresponding concentration-based detection limit [25]. Overall, the study focuses on technology repurposing and fabrication-process characterization, using functional hybridization response as the experimentally measured endpoint.
2. Experimental
2.1. Instrumentation and Materials
Milli-Q ultrapure water (resistivity 18.5 MΩ·cm) was used throughout the experiments. Tetrachloroauric acid trihydrate (HAuCl4·3H2O), sodium citrate (Na3C6H5O7), sodium borate (Na2B4O7), sucrose (C12H22O11), sodium chloride (NaCl), polysorbate 20 (Tween-20, C26H50O10), phosphate-buffered saline (PBS, pH 7.4), Tris (2-carboxyethyl) phosphine hydrochloride (TCEP), lyophilized bovine serum albumin (BSA) fraction V, and sodium azide (NaN3), nitrocellulose membranes (Hi-FloTM Plus 120), glass fiber conjugate pads, absorbent pads, sample pads were purchased from Sigma-Aldrich (Milano, Italy). The ssDNA sequences (Table 1) were synthesized by Biogenerica Srl (Pedara, Italy) as lyophilized powders. The sequence was derived from Pseudotsuga menziesii.
The instrumentation used for AuNP synthesis and optical characterization included a hot plate (DLAB MS-H28-PRO) and a spectrophotometer (Jenway 6715 UV/VIS).
Hydrodynamic size and ζ-potential measurements were carried out using a Zetasizer Nano ZS (Malvern Instruments). Morphological characterization was performed by transmission electron microscopy (TEM) using a JEOL JEM-2100 microscope (JEOL Ltd., Japan).
The UV irradiation chamber was supplied by Immunolyte© and housed four low-pressure mercury (Hg) lamps, each 10 cm in length and 1 cm in diameter, with a nominal power of 2 W and an emission wavelength of 254 nm.
Optical power at the sample plane was measured with a Thorlabs power meter PM100D2 using a 1 cm diameter measurement aperture. The instrument covers an optical power range of 500 pW-0.5 mW, up to 50 mW with the appropriate filter, over a wavelength range of 200-1100 nm. Mean irradiance was calculated by dividing the measured optical power by the circular aperture area (0.785 cm²). The reported values therefore represent aperture-averaged irradiance at the specified measurement positions within the chamber.
2.2. AuNPs Synthesis
Spherical gold nanoparticles were synthesized by adapting a previously reported citrate-reduction method [26]. A gold salt solution composed of 40 mL of ultrapure water and 500 μL of HAuCl4·3H2O (10 mg/mL) was prepared and brought to boiling under constant vigorous stirring. Once boiling was reached, 1.5 mL of sodium citrate (23.5 mg/mL) was added, and the reaction was maintained for a further 15 min to allow particle nucleation and growth. At the end of the synthesis, the suspension appeared wine-red and showed an extinction of approximately 1 at λ = 522 nm by UV-Vis spectroscopy (Figure 1a), allowing the AuNP concentration to be estimated at approximately 10^11 particles mL−1. Dynamic light scattering (DLS) analysis showed a hydrodynamic diameter of approximately 25 nm (Figure 1b), while ζ-potential measurements indicated a negative surface charge of approximately −30 mV, consistent with colloidal stability (Figure 1c). Transmission electron microscopy (TEM) confirmed the predominantly spherical morphology and particle size distribution (Figure 1d). The AuNP colloid was stored in the dark at 4 °C. For assay preparation, the AuNP suspension was concentrated to an extinction of 4 by centrifugation at 3500 × g for 30 min, followed by resuspension in Milli-Q ultrapure water.
2.3. Preparation of ssDNA Sequences
Stock solutions of ssDNA (100 µM) were prepared by dissolving lyophilized oligonucleotides in Milli-Q water and stored frozen as recommended by the supplier. The three ssDNA sequences used in this study were designated as Probe, complementary probe (C_Probe), and target sequence (TS). Both Probe and C_Probe were modified at the 5′ end with a thiol-C6 group and included a 10-base spacer to reduce steric hindrance and improve target accessibility.
Prior to AuNP functionalization, the Probe was chemically activated by treatment with TCEP at a 100:1 molar ratio (TCEP:ssDNA) for 1 h at room temperature (RT) to generate free thiol groups for Au-S bond formation. The activated Probe was used immediately after the reduction step.
The C_Probe, although also bearing a 5′ thiol-C6 group and a 10-base spacer, was used without chemical pretreatment. The thiol-C6 modification of the C_Probe was not exploited as a specific immobilization chemistry in the present study; the oligonucleotide was used as supplied. Similarly, the TS was used as received, without additional pretreatment.
2.4. AuNPs Functionalization
AuNPs surface functionalization with ssDNA relied on the formation of Au–S bonds [27]. The Probe was first activated using TCEP, and several ssDNA:AuNPs molar ratios were tested, ranging from 200:1 up to 1000:1. The resulting mixture was then subjected to a short freeze–thaw treatment, consisting of a 2 min incubation on dry ice followed by thawing at room temperature [29]. Unbound ssDNA in excess was subsequently eliminated through centrifugation (16,000 × g, 4 °C, 10 min), and the pellet obtained was redispersed in 5 mM PBS to a final optical density (OD) of 5.
2.5. Lateral Flow Strip Assembly
Each LFA strip consisted of four distinct functional components: a nitrocellulose (NC) membrane, a sample pad, a conjugate pad, and an absorbent pad. The NC membrane was trimmed to a width of 0.5 cm using a guillotine cutter, while the glass-fiber sample pad was cut into 1 × 2 cm pieces. The glass-fiber conjugate pad was cut into 1 × 0.5 cm pieces and pre-treated with a blocking solution containing 1% BSA, 5% sucrose, and 0.5% Tween-20, followed by drying. After treatment, 3 μL of the functionalized AuNPs (f-AuNPs) suspension was spotted onto the conjugate pad and allowed to dry at room temperature for 2 h.
The absorbent pad was cut into 0.5 × 1 cm pieces, soaked in 0.05% Tween-20, and subsequently dried at 50 °C.
For preparation of the NC capture zone, 0.3 μL of C_Probe (45 μM under the selected working condition) was deposited onto the membrane. The deposited DNA was allowed to dry/adsorb for 2 h at 37 °C. For UV-treated strips, the membrane was then placed in the irradiation chamber at the position located 4 cm from lamp 1 and irradiated using the lamp configuration and exposure time specified for each optimization experiment. Untreated controls were handled identically without UV exposure. After optimization, subsequent experiments used four active lamps and a 5 min exposure.
2.6. Sensor Operating Principle
The sensor operates according to a competitive NALFA with an inverse signal response. Briefly, 180 μL of sample is applied onto the sample pad and migrates along the strip by capillary flow. The buffer in which the TS is dissolved consists of 20 mM sodium borate (pH 8.0), 2% (w/v) sucrose, 0.6 M NaCl, 0.2% (v/v) Tween 20, and 0.1% (w/v) sodium azide.
The sample first reaches the conjugate pad, where f-AuNPs are pre-loaded. During migration, the f-AuNPs can hybridize with the target sequence (TS), if present, forming f-AuNPs–TS complexes.
Because the TS and the C_Probe have the same nucleotide sequence, the TS competes with the C_Probe immobilized on the nitrocellulose membrane for hybridization with the Probe sequence used to functionalize the AuNPs.
At low or absent TS concentrations, a larger fraction of the Probes remains available to hybridize with the immobilized C_Probe, resulting in a stronger test signal. As the TS concentration increases, more Probes are occupied by the target DNA in solution, reducing their availability for binding at the test zone and consequently decreasing the signal intensity. Thus, the test signal progressively decreases with increasing TS concentration.
After 20 min from sample deposition, the signal was quantified by acquiring an image of the strip using a smartphone. The images were processed using ImageJ, and the intensity of the test zone was correlated with the TS concentration.
For the optimization experiments investigating the number of UV lamps, irradiation time, and C_Probe concentration on the nitrocellulose membrane, the running buffer did not contain TS. Under these conditions, the measured signal originated exclusively from the hybridization between the Probe on the f-AuNPs and the C_Probe immobilized on the nitrocellulose membrane, allowing the effect of the UV treatment on DNA immobilization to be evaluated independently of target competition. In contrast, for the analytical calibration curve, the TS was added to the running buffer and the competitive assay described above was used to evaluate the dependence of the test signal on target concentration.
2.7. Image Processing and Data Analysis
Images of the NALFA strips were acquired using an iPhone 15 under standardized conditions. To ensure reproducible imaging geometry, all photographs were captured using a custom 3D-printed smartphone holder. The device consists of an upper platform supporting the smartphone at a fixed height of 12 cm and a lower compartment designed to accommodate the LFA strips. This configuration was maintained for all acquisitions to provide a constant camera-to-strip geometry (Figure 2). Images were converted to 8-bit grayscale and analyzed using ImageJ software. Prior to signal quantification, image intensity was calibrated using a grayscale calibration card (Figure 3a).
The grayscale reference was analyzed by measuring the intensity of each grayscale level using the “Measure” function in ImageJ. The resulting intensity values were normalized by assigning a value of 1 to the darkest level (black) and 0 to the brightest level (white). A calibration curve was generated from the normalized grayscale values (Figure 3b) and applied to subsequent image analyses using the “Rodbard” calibration function in ImageJ. For each strip, a region of interest (ROI) corresponding to the test spot was manually defined using the polygon selection tool, and the mean grayscale intensity was measured. An identically sized ROI was positioned immediately below the test zone in an area without a test spot to determine the local background intensity. The background value was subtracted from the corresponding test-spot intensity to obtain the background-corrected signal. Each experimental condition was evaluated on three strips (n = 3), and data are reported as mean ± standard deviation (SD). For the competitive calibration experiment, the decreasing dose-response data were described using logistic fits, as shown in Figure 10. Because the assay response decreases with increasing target concentration, the signal threshold for detection was defined as the mean blank signal minus 3 SD of the blank. The corresponding target concentration was estimated from the intersection of this threshold with the fitted response curve. Accordingly, the reported concentration-based LOD values are treated as estimates under the investigated experimental conditions.
3. Results and Discussion
3.1. AuNPs Functionalization
The functionalization of AuNPs with the Probe was optimized following the approach previously described in our earlier study [23] .
The ratio between the extinction at 610 nm, corresponding to the red-side shoulder of the plasmon band, and the signal near the plasmon maximum (A610/A525) was used as an empirical indicator of DNA surface coverage and colloidal behavior. In our previous optimization framework, an A610/A525 value of 0.28 was adopted as a practical criterion balancing colloidal stability and probe accessibility.
Since the optimal ssDNA:AuNP molar ratio depends on the specific DNA sequence used for functionalization, the optimization procedure was repeated with the Probe sequence. The A610/A525 ratio was monitored at different ssDNA:AuNP molar ratios to identify the condition corresponding to the empirical target value of 0.28. The extinction spectra obtained at the different ratios are shown in Figure 4. For the Probe sequence used here, an ssDNA:AuNP molar ratio of 400:1 produced an A610/A525 ratio of approximately 0.28.
3.2. Lamp Irradiance Characterization
Figure 5 shows the Immunolyte© UV unit used throughout the study, including the external case (panel a), the internal lamp chamber containing the four low-pressure mercury lamps (panel b), and the top view showing the lamp numbering scheme (1-4) used to define the investigated lamp configurations (panel c).
The aperture-averaged irradiance measured under the different lamp configurations is reported in Figure 6. Measurements were acquired at increasing distances from lamp 1 (0, 1, 2, and 4 cm) to characterize the spatial distribution of UV exposure within the chamber. With lamp 1 alone, irradiance decreased with increasing distance from the lamp. Activating additional lamps increased the overall irradiance and reduced its variation across the investigated positions. In the four-lamp configuration, the measured irradiance decreased by only 29% across the investigated distance range, indicating a more spatially uniform irradiation field than in the single-lamp configuration.
This improved spatial uniformity is advantageous for reproducible UV treatment because it reduces the dependence of the delivered exposure on the precise membrane position within the chamber. Since the functional response depends on both irradiation conditions and probe accessibility, a relatively homogeneous field is desirable for consistent processing. Based on these measurements, DNA-modified nitrocellulose membranes were positioned 4 cm from lamp 1 in subsequent experiments. This position provided a comparatively uniform field while maintaining separation from the lamp assembly.
3.3. Effect of UV Lamp Configuration on Functional Capture-Zone Response
To investigate the effect of UV irradiation configuration on the functional capture-zone response, NC strips were treated under identical conditions while maintaining a C_Probe concentration of 45 µM and a fixed exposure time of 5 min and varying the number of active lamps. Signal intensity was quantified by ImageJ analysis (Figure 7). The highest mean signal was obtained with all four lamps activated, corresponding to an approximately 2.2-fold increase relative to the untreated condition. The four-lamp configuration also showed the lowest observed variability among the irradiated conditions.
The increased signal observed with UV-treated membranes is consistent with previous reports showing that UV exposure can improve retention and subsequent hybridization of nucleic acids on membrane supports [14]. In the present assay, however, the measured endpoint is a functional hybridization signal and therefore reflects the combined effects of probe retention, accessibility, and subsequent binding rather than the absolute amount of immobilized DNA.
However, the response was not directly proportional to the number of active lamps: the signals obtained with two and three lamps were similar in magnitude, whereas activation of all four lamps produced a marked increase. This behavior suggests that lamp geometry and the spatial distribution of the UV field, in addition to the number of active sources, influence the functional response obtained from the membrane. The more uniform field observed with four lamps may therefore contribute to the higher and less variable response.
Overall, the four-lamp configuration provided the highest signal and the lowest variability among the tested conditions and was therefore selected for subsequent experiments.
3.4. Effect of UV Exposure Time on Functional Response
Since the highest signal intensity was obtained with all four lamps activated, the effect of exposure time on the functional capture-zone response was investigated using irradiation times from 0 to 80 min (Figure 8).
The signal increased rapidly during the first minutes of irradiation, with a further increase between 5 and 10 min, reaching a maximum at 10 min. The corresponding signal enhancement was approximately 1.7-fold relative to the untreated control. Although the magnitude of the enhancement differed from that observed in the previous lamp-number optimization (approximately 2.2-fold under four-lamp irradiation), this variation is consistent with the variability observed in the untreated control signals across independent experiments.
The initial increase indicates a progressive improvement in the functional retention and/or accessibility of the capture DNA under UV treatment. UV exposure time is a critical parameter in nucleic-acid fixation protocols, with increasing exposure initially improving subsequent hybridization response whereas excessive irradiation can reduce it [29]. The present data are therefore consistent with an exposure window in which the membrane retains a larger fraction of functionally available capture probes.
Beyond 10 min, prolonged irradiation did not further improve the signal. Instead, the mean response decreased at 20 and 40 min, followed by a partial recovery at 80 min. This non-monotonic behavior indicates that prolonged exposure does not simply translate into a continuously increasing functional response. One possible explanation is that higher cumulative UVC exposure may negatively affect the functionality of the deposited DNA. UVC irradiation can induce DNA photoproducts, including cyclobutane pyrimidine dimers and pyrimidine (6-4) photoproducts, which can alter nucleic-acid structure and interfere with probe hybridization [30]. Because DNA retention and molecular integrity were not measured independently in the present study, this mechanistic interpretation should be regarded as a plausible explanation rather than a direct demonstration.
Although the 10 min exposure yielded the highest mean signal, the 5 min response was similar in magnitude and showed lower observed variability. The 5 min exposure was therefore selected as a practical operating condition that balanced functional response, variability, and processing time.
3.5. Effect of Capture-DNA Spotting Concentration
With the number of lamps fixed at four and the irradiation time at 5 min, the effect of the DNA concentration used for spotting on the nitrocellulose membrane was investigated by varying the concentration from 10 to 94 µM under constant UV irradiation conditions (Figure 9). The signal intensity increased from 10 to 50 µM. Further increases in DNA concentration did not result in a corresponding increase in signal: the response remained comparable at 50 µM and decreased from 60 to 94 µM.
The modest change in signal across the intermediate concentration range indicates that the amount of DNA deposited is not the only determinant of assay response. Increasing probe loading does not necessarily produce a proportional increase in hybridization signal; at higher local probe densities, reduced accessibility and steric effects can contribute to a plateau or decline in response [31]. In a porous nitrocellulose matrix, heterogeneous probe distribution and local transport effects may also contribute, and the present data do not allow these mechanisms to be separated.
A spotting concentration of 45 µM was selected as the working condition because it provided a response close to the maximum observed at 50 µM while using less capture DNA and avoiding the decline observed at higher concentrations.
3.6. Competitive Calibration and Estimated Assay Sensitivity
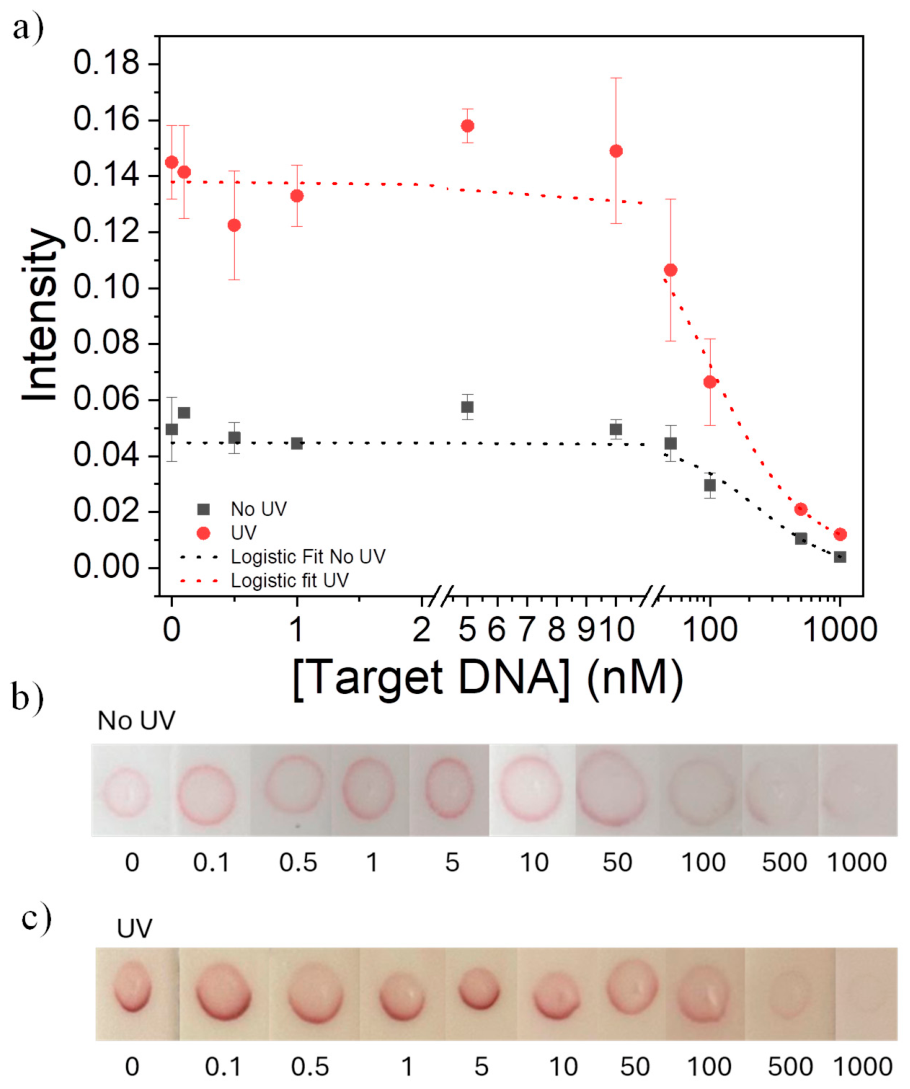
With the UV lamp number, irradiation time, and DNA concentration fixed at the optimized conditions, UV-treated and untreated membranes were compared using an LFA with target DNA concentrations ranging from 0 to 1000 nM (Figure 10).
The UV-treated membranes exhibited an overall higher response than untreated membranes across most of the investigated concentration range. In both cases, the signal decreased with increasing target DNA concentration, as expected for the competitive assay format. For the inverse response, the detection threshold was defined as the mean blank signal minus 3 SD. The corresponding concentration was estimated from the intersection of this threshold with the logistic response curve, yielding an estimated concentration-based LOD of approximately 355 nM for untreated membranes.
For the UV-treated membranes, the higher response at low target concentrations increased the separation between the blank and low-concentration signals. Applying the same threshold and fitting criterion yielded an estimated concentration-based LOD of approximately 40 nM. Under the investigated conditions, UV treatment therefore produced an approximately nine-fold reduction in the estimated LOD relative to untreated membranes. These values should be interpreted as method-specific estimates derived from the present proof-of-concept calibration rather than as a complete analytical validation.
Overall, these results show that the selected UV treatment increases the measurable functional hybridization response of the capture zone and improves discrimination of low target concentrations in this experimental configuration. Because the strip uses the test-zone response as the analytical readout and does not include a dedicated control line, the present calibration should be regarded as proof-of-concept performance rather than a fully validated diagnostic format.
Figure 10.
(a) Dose–response curves as a function of target concentration for strips without (b) and with (c) UV treatment.
Figure 10.
(a) Dose–response curves as a function of target concentration for strips without (b) and with (c) UV treatment.
4. Conclusions
This study demonstrates the repurposing of a four-lamp 254 nm photoactivation chamber, originally developed for antibody-oriented surface functionalization, as a fabrication tool for DNA capture zones in nucleic acid lateral flow assays. Lamp configuration, exposure time, and capture-DNA spotting concentration all affected the functional hybridization response of the DNA-modified nitrocellulose test zone. For the investigated chamber, the selected working conditions were four active lamps, a membrane position 4 cm from lamp 1, a 5 min exposure, and 0.3 µL of 45 µM capture DNA. These conditions provided a practical balance between signal response, observed variability, reagent use, and processing time. In the proof-of-concept competitive assay, UV-treated membranes yielded an estimated concentration-based LOD of approximately 40 nM, compared with approximately 355 nM for untreated membranes under the same analytical framework. The optical measurements and optimization are chamber-specific and should not be interpreted as establishing a universal UV exposure condition. Moreover, the measured lateral-flow signal reflects functional probe retention and accessibility rather than a direct measurement of the absolute amount of immobilized DNA or a specific attachment mechanism. Future analytical development should include independent probe-retention measurements, sequence-specificity testing, and integration of a dedicated control line. Overall, the work establishes a measurement-guided strategy for transferring a multi-source UV platform to reproducible NALFA capture-zone fabrication.
Author Contributions
D. M.: Investigation, Methodology, Formal analysis, Visualization, Writing – review & editing. E. C.: Investigation, Methodology, Formal analysis, Visualization, Writing – review & editing. L. L. L.: Investiga tion, Validation, Writing – original draft. T. D.: Investigation, Validation. V. I.: Formal analysis, Writing – review & editing. R. V.: Funding acquisition, Supervision, Writing – review & editing. B. D. V.: Conceptualization, Funding acquisition, Supervision, Methodology, Writing – review & editing. .
Funding
This research was funded by Ministero dell’Università MUR, PRIN PNRR 2022, P2022J3ZPW.
Conflicts of Interest
The authors declare no conflicts of interest.
Abbreviations
AuNPs, gold nanoparticles; BSA, bovine serum albumin; DLS, dynamic light scattering; f-AuNPs, DNA-functionalized gold nanoparticles; LFA, lateral flow assay; NC, nitrocellulose; OD, optical density; PBS, phosphate-buffered saline; ROI, region of interest; SD, standard deviation; ssDNA, single-stranded DNA; TCEP, tris(2-carboxyethyl)phosphine; TEM, transmission electron microscopy; UV, ultraviolet.
References
- J. Kim et al., “Recent Trends in Lateral Flow Immunoassays with Optical Nanoparticles,” Int. J. Mol. Sci., vol. 24, no. 11, p. 9600, May 2023. [CrossRef]
- D. M. Kinyua, D. M. Memeu, C. N. Mugo Mwenda, B. Della Ventura, and R. Velotta, “Advancements and Applications of Lateral Flow Assays (LFAs): A Comprehensive Review,” Sensors, vol. 25, no. 17, p. 5414, Sep. 2025. [CrossRef]
- P. Andreeva, V. G. Grigorenko, A. M. Egorov, and A. P. Osipov, “Quantitative Lateral Flow Immunoassay for Total Prostate Specific Antigen in Serum,” Anal. Lett., vol. 49, no. 4, pp. 579–588, Mar. 2016. [CrossRef]
- W. A. Arcos Rosero, A. Bueno Barbezan, C. Daruich de Souza, and M. E. Chuery Martins Rostelato, “Review of Advances in Coating and Functionalization of Gold Nanoparticles: From Theory to Biomedical Application,” Pharmaceutics, vol. 16, no. 2, p. 255, Feb. 2024. [CrossRef]
- D. Marra et al., “Fe3O4-Au cluster-satellite particles as direct colorimetric reporters in a smartphone-quantified lateral flow immunoassay for prostate-specific antigen,” Mikrochim. Acta, vol. 193, no. 10, 2026. [CrossRef]
- J. Kim et al., “Simultaneous Detection of Infectious Diseases Using Aptamer-Conjugated Gold Nanoparticles in the Lateral Flow Immunoassay-Based Signal Amplification Platform,” Anal. Chem., vol. 96, no. 4, pp. 1725–1732, 2024. [CrossRef]
- X. Mao, Y. Ma, A. Zhang, L. Zhang, L. Zeng, and G. Liu, “Disposable Nucleic Acid Biosensors Based on Gold Nanoparticle Probes and Lateral Flow Strip,” Anal. Chem., vol. 81, no. 4, pp. 1660–1668, 2009. [CrossRef]
- B. A. Rohrman, V. Leautaud, E. Molyneux, and R. R. Richards-Kortum, “A Lateral Flow Assay for Quantitative Detection of Amplified HIV-1 RNA,” PLoS One, vol. 7, no. 9, p. e45611, 2012. [CrossRef]
- N. Subhashini et al., “Enhancing Colorimetric Detection of Nucleic Acids on Nitrocellulose Membranes: Cutting-Edge Applications in Diagnostics and Forensics,” Biosensors (Basel)., vol. 14, no. 9, p. 430, 2024. [CrossRef]
- H. Lee, H. Hwang, J. Y. Lee, M. Y. Lee, and Y. Kim, “Immobilizing and Patterning DNA on Simplified Protein-Free DNA-Based Lateral Flow Assays,” ACS Omega, vol. 10, no. 14, pp. 14115–14120, 2025. [CrossRef]
- M. Abdolhosseini et al., “Comparison of Oligonucleotide Immobilization Methods for Paper-Based Diagnostics, With a Focus on Nucleic Acid Lateral Flow Assays,” J. Sens., vol. 2026, no. 1, 2026. [CrossRef]
- E. W. Khandjian, “Optimized Hybridization of DNA Blotted and Fixed to Nitrocellulose and Nylon Membranes,” Nat. Biotechnol., vol. 5, no. 2, pp. 165–167, 1987. [CrossRef]
- S. A. Nierzwicki-Bauer, J. S. Gebhardt, L. Linkkila, and K. Walsh, “A comparison of UV cross-linking and vacuum baking for nucleic acid immobilization and retention,” Biotechniques, vol. 9, no. 4, pp. 472–478, 1990, [Online]. Available: https://pubmed.ncbi.nlm.nih.gov/2257145/.
- M. Pongsuchart, A. Sereemaspun, and K. Ruxrungtham, “Sensitivity enhancement of nucleic acid detection by lateral flow strip test using UV crosslink method,” Asian Biomedicine, vol. 6, no. 3, pp. 459–463, 2012. [CrossRef]
- M. Abdolhosseini et al., “Comparison of Oligonucleotide Immobilization Methods for Paper-Based Diagnostics, With a Focus on Nucleic Acid Lateral Flow Assays,” J. Sens., vol. 2026, p. 5942280, 2026. [CrossRef]
- B. Della Ventura et al., “Biosensor surface functionalization by a simple photochemical immobilization of antibodies: Experimental characterization by mass spectrometry and surface enhanced Raman spectroscopy,” Analyst, vol. 144, no. 23, pp. 6871–6880, 2019. [CrossRef]
- S. E. Braslavsky, “Glossary of terms used in photochemistry, 3rd edition (IUPAC Recommendations 2006),” Pure and Applied Chemistry, vol. 79, no. 3, pp. 293–465, 2007. [CrossRef]
- J. R. Bolton and K. G. Linden, “Standardization of Methods for Fluence (UV Dose) Determination in Bench-Scale UV Experiments,” Journal of Environmental Engineering, vol. 129, no. 3, pp. 209–215, 2003. [CrossRef]
- T. Douki and J. Cadet, “Formation of the spore photoproduct and other dimeric lesions between adjacent pyrimidines in UVC-irradiated dry DNA,” Photochemical & Photobiological Sciences, vol. 2, no. 4, pp. 433–436, 2003. [CrossRef]
- J.-M. Park and T.-H. Kang, “DNA Slot Blot Repair Assay,” Bio. Protoc., vol. 5, no. 8, p. e1453, 2015. [CrossRef]
- B. Liu and J. Liu, “Freezing Directed Construction of Bio/Nano Interfaces: Reagentless Conjugation, Denser Spherical Nucleic Acids, and Better Nanoflares,” J. Am. Chem. Soc., vol. 139, no. 28, pp. 9471–9474, 2017. [CrossRef]
- C. A. Mirkin, R. L. Letsinger, R. C. Mucic, and J. J. Storhoff, “Macroscopic Materials,” Nature, vol. 382, no. August, pp. 607–609, 1996.
- E. Cavaliere et al., “Rapid label-free colorimetric ssDNA biosensor based on gold nanoparticles: Application to fusarium oxysporum detection in soil,” Microchemical Journal, vol. 229, no. December 2025, 2026. [CrossRef]
- Mudanyali, S. Dimitrov, U. Sikora, S. Padmanabhan, I. Navruz, and A. Ozcan, “Integrated rapid-diagnostic-test reader platform on a cellphone,” Lab Chip, vol. 12, no. 15, pp. 2678–2686, 2012. [CrossRef]
- L. A. Currie, “Nomenclature in evaluation of analytical methods including detection and quantification capabilities (IUPAC Recommendations 1995),” Pure and Applied Chemistry, vol. 67, no. 10, pp. 1699–1723, 1995. [CrossRef]
- J. Turkevich, P. C. Stevenson, and J. Hillier, “A study of the nucleation and growth processes in the synthesis of colloidal gold,” Discuss. Faraday Soc., vol. 11, no. c, pp. 55–75, 1951. [CrossRef]
- D. Y. Choi, S. Kim, J. W. Oh, and J. M. Nam, “Conjugation strategies of DNA to gold nanoparticles,” Dec. 01, 2022, John Wiley and Sons Inc. [CrossRef]
- B. Liu and J. Liu, “Freezing Directed Construction of Bio/Nano Interfaces: Reagentless Conjugation, Denser Spherical Nucleic Acids, and Better Nanoflares,” J. Am. Chem. Soc., vol. 139, no. 28, pp. 9471–9474, Jul. 2017. [CrossRef]
- Parwez, S. Kumar, S. Bala, and S. Ali, “Relevance of empirical optimization for cross-linking DNA by using an ordinary ultraviolet-light source,” Genet. Anal., vol. 10, no. 3–4, pp. 95–98, 1993. [CrossRef]
- K. Heil, D. Pearson, and T. Carell, “Chemical investigation of light induced DNA bipyrimidine damage and repair,” Chem. Soc. Rev., vol. 40, no. 8, pp. 4271–4278, 2011. [CrossRef]
- N. Kimura, R. Oda, Y. Inaki, and O. Suzuki, “Attachment of oligonucleotide probes to poly carbodiimide-coated glass for microarray applications.,” Nucleic Acids Res., vol. 32, no. 7, 2004. [CrossRef]
Figure 1.
Characterization of AuNPs. (a) Extinction spectrum of the synthesized AuNPs, showing a well-defined plasmon resonance peak centered at 522 nm. (b) DLS analysis showing an average hydrodynamic diameter of approximately 25 nm. (c) ζ-potential measurements showing a surface charge of approximately −30 mV. (d) TEM micrographs confirming the predominantly spherical morphology of the nanoparticles.
Figure 1.
Characterization of AuNPs. (a) Extinction spectrum of the synthesized AuNPs, showing a well-defined plasmon resonance peak centered at 522 nm. (b) DLS analysis showing an average hydrodynamic diameter of approximately 25 nm. (c) ζ-potential measurements showing a surface charge of approximately −30 mV. (d) TEM micrographs confirming the predominantly spherical morphology of the nanoparticles.
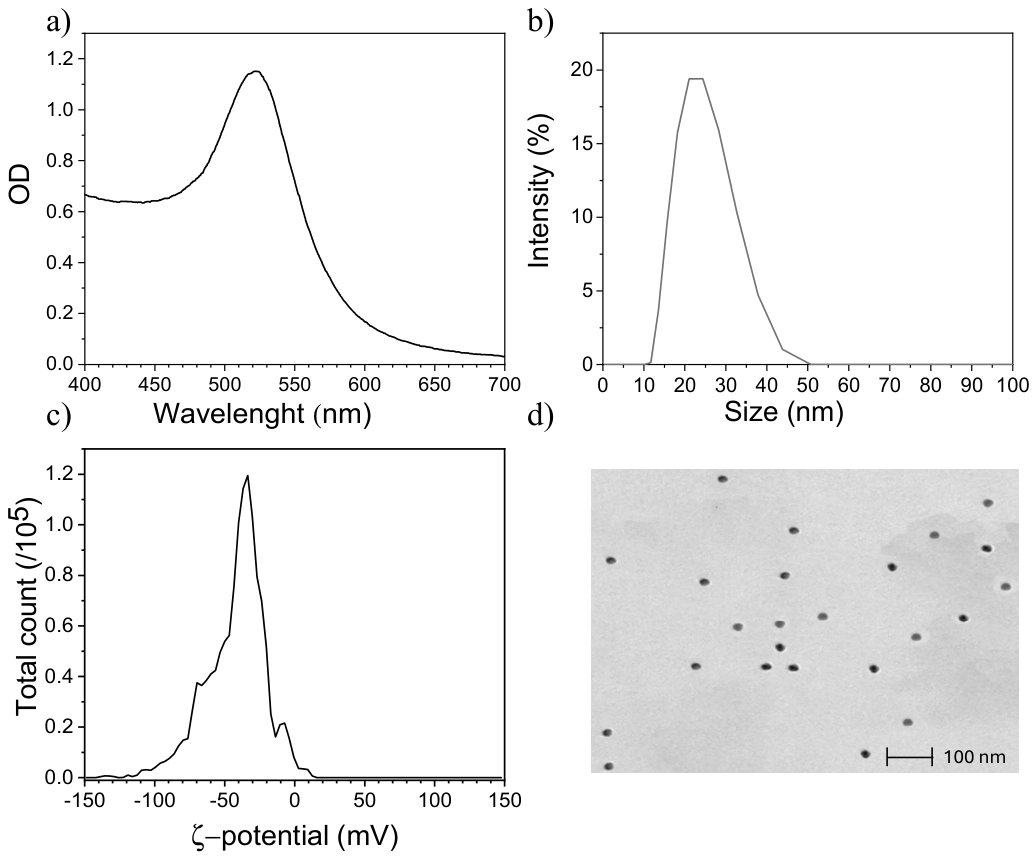
Figure 2.
Custom 3D-printed smartphone holder used to ensure reproducible imaging conditions during LFA analysis.
Figure 2.
Custom 3D-printed smartphone holder used to ensure reproducible imaging conditions during LFA analysis.
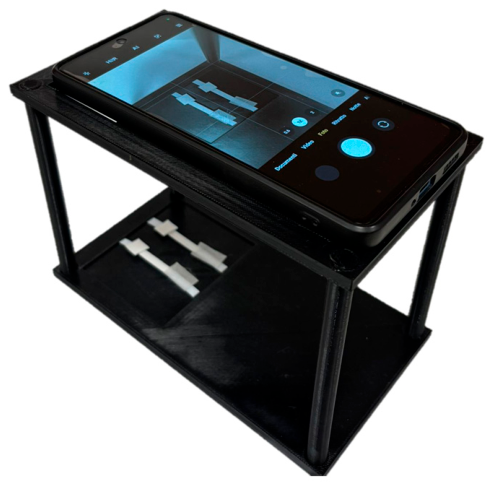
Figure 3.
(a) Grayscale calibration card used to calibrate image intensity prior to analysis. (b) Calibration curve generated from the normalized grayscale values (black = 1, white = 0) and applied to LFA image analysis.
Figure 3.
(a) Grayscale calibration card used to calibrate image intensity prior to analysis. (b) Calibration curve generated from the normalized grayscale values (black = 1, white = 0) and applied to LFA image analysis.
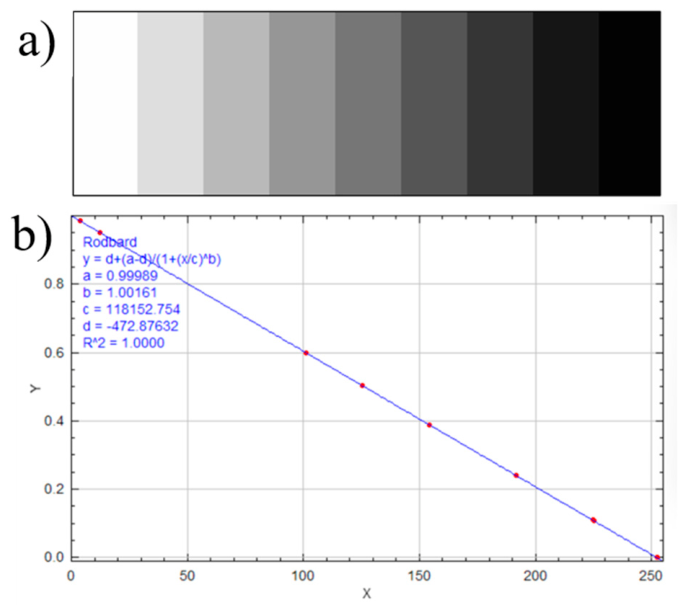
Figure 4.
(a) Normalized UV-Vis extinction spectra of AuNPs functionalized with Probe at different ssDNA:AuNP molar ratios. (b) Corresponding A610/A525 ratio, with the empirical target value of approximately 0.28 reached at a ratio of 400:1. Error bars represent duplicate experiments.
Figure 4.
(a) Normalized UV-Vis extinction spectra of AuNPs functionalized with Probe at different ssDNA:AuNP molar ratios. (b) Corresponding A610/A525 ratio, with the empirical target value of approximately 0.28 reached at a ratio of 400:1. Error bars represent duplicate experiments.
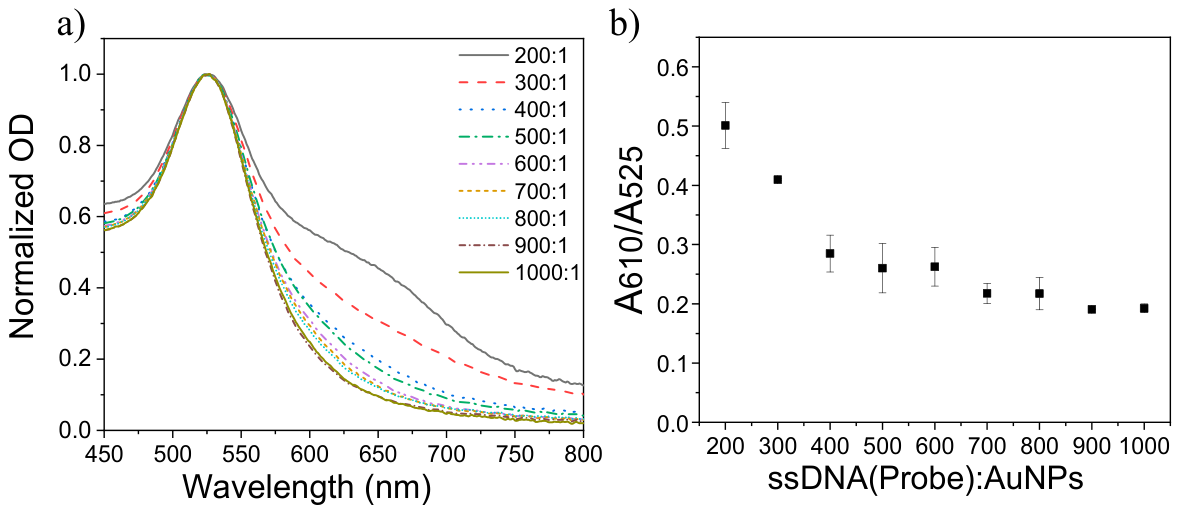
Figure 5.
(a) Front view of the Immunolyte© lamp. (b) Side view showing the internal components with the metal casing removed, including the position of the nitrocellulose strip during UV treatment. (c) Internal top view illustrating the numerical arrangement of the UV lamps.
Figure 5.
(a) Front view of the Immunolyte© lamp. (b) Side view showing the internal components with the metal casing removed, including the position of the nitrocellulose strip during UV treatment. (c) Internal top view illustrating the numerical arrangement of the UV lamps.
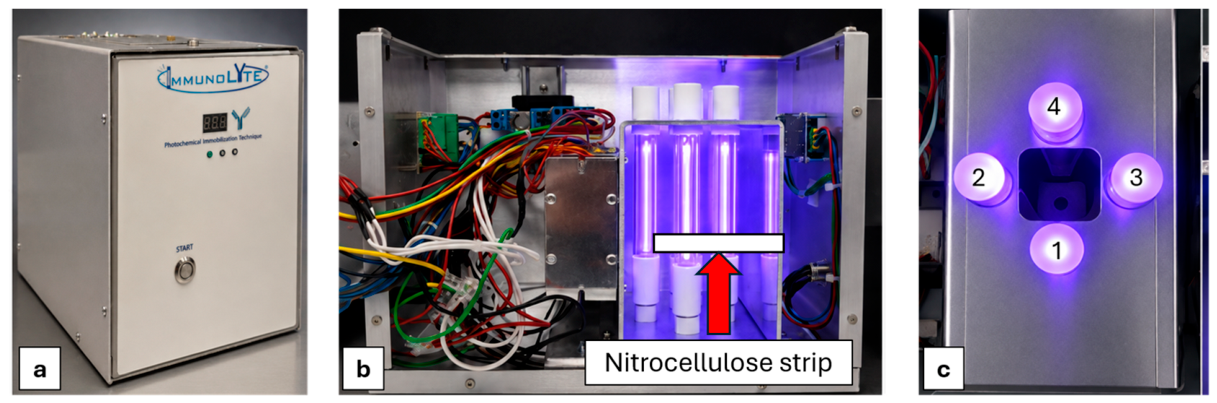
Figure 6.
Mean irradiance measured using different numbers of lamps at different distances from the source.
Figure 6.
Mean irradiance measured using different numbers of lamps at different distances from the source.
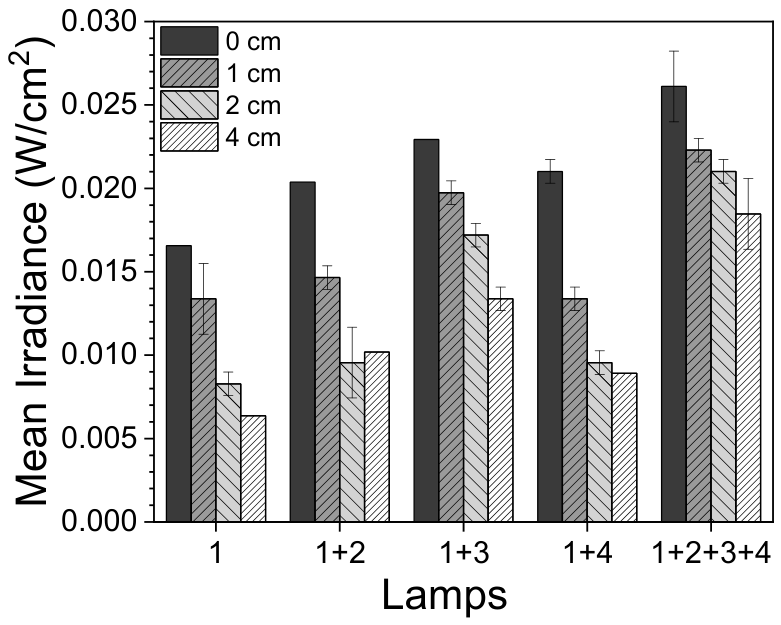
Figure 7.
Effect of the number of UV lamps on DNA immobilization on nitrocellulose membranes using 45 µM DNA after 5 min of irradiation. (a) Lateral flow signal intensity as a function of the number of UV lamps used for DNA immobilization. (b) Representative images of the corresponding lateral flow strips.
Figure 7.
Effect of the number of UV lamps on DNA immobilization on nitrocellulose membranes using 45 µM DNA after 5 min of irradiation. (a) Lateral flow signal intensity as a function of the number of UV lamps used for DNA immobilization. (b) Representative images of the corresponding lateral flow strips.
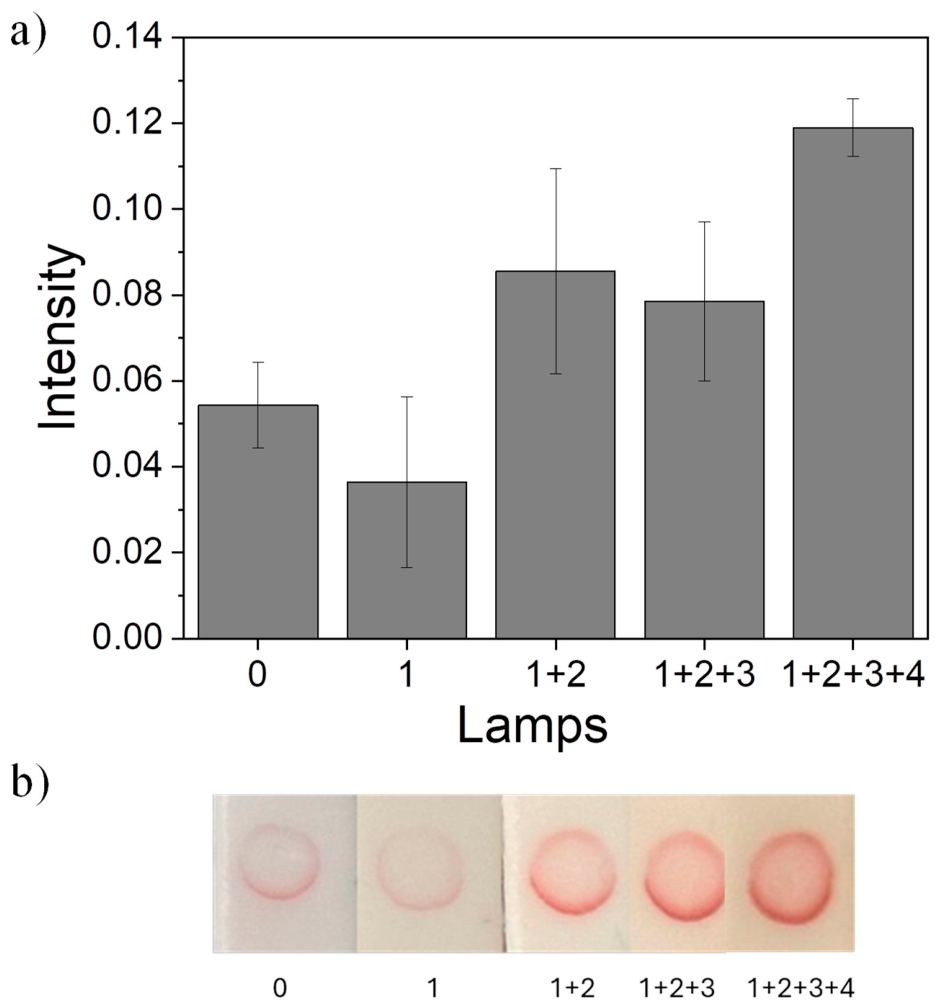
Figure 8.
(a) Lateral flow signal intensity as a function of UV exposure time using four lamps and a DNA concentration of 45 µM on the nitrocellulose membrane. (b) Representative images of the corresponding lateral flow strips.
Figure 8.
(a) Lateral flow signal intensity as a function of UV exposure time using four lamps and a DNA concentration of 45 µM on the nitrocellulose membrane. (b) Representative images of the corresponding lateral flow strips.
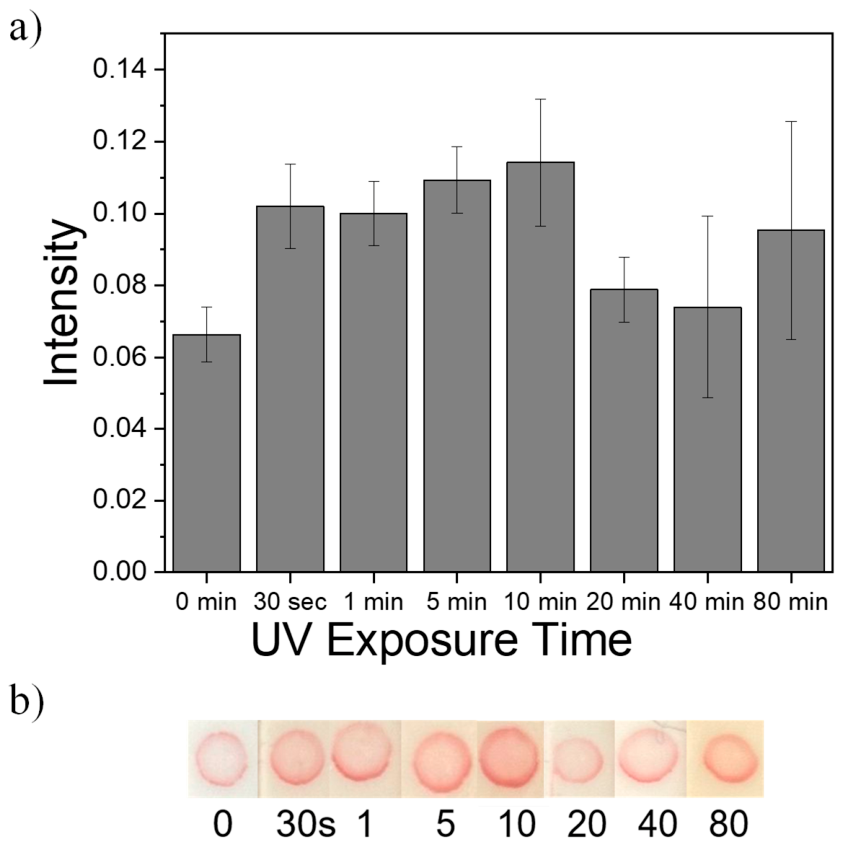
Figure 9.
(a) Lateral flow signal intensity as a function of DNA concentration on the nitrocellulose membrane using four UV lamps and 5 min of irradiation. (b) Representative images of the corresponding lateral flow strips.
Figure 9.
(a) Lateral flow signal intensity as a function of DNA concentration on the nitrocellulose membrane using four UV lamps and 5 min of irradiation. (b) Representative images of the corresponding lateral flow strips.
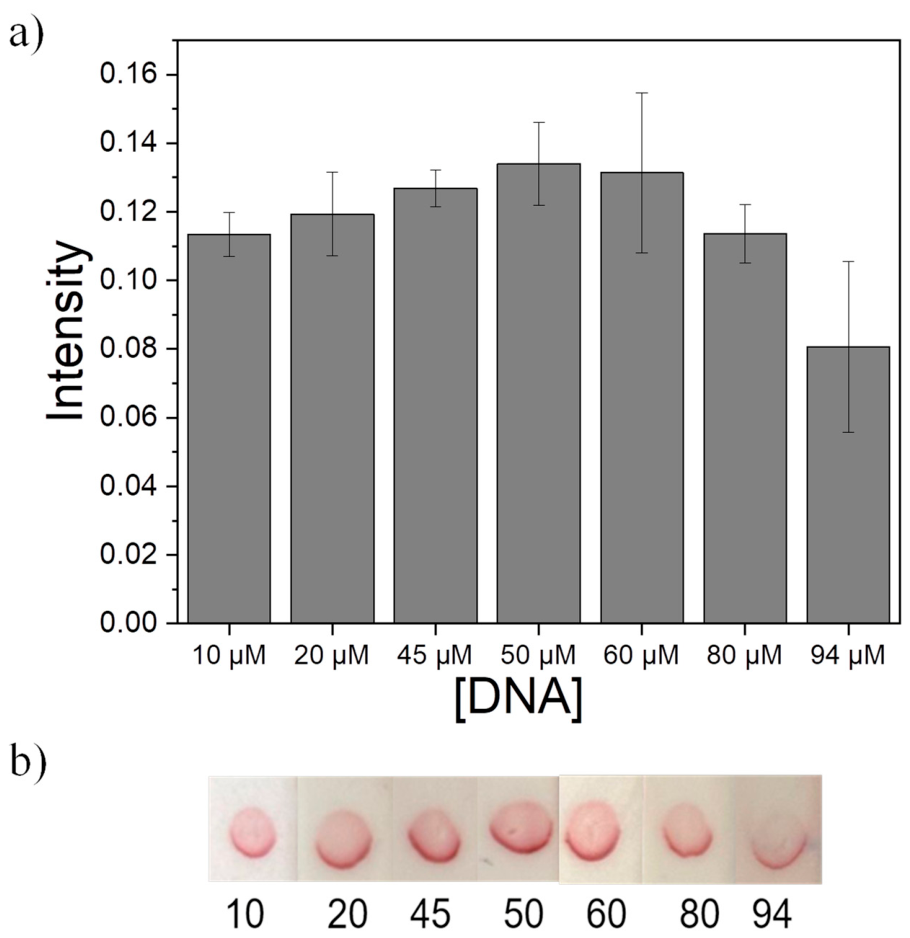

Table 1.
List of ssDNA sequences used in this work.
| ssDNA sequences | Sequence 5’ to 3’ | |
|---|---|---|
| 1 | Probe (Used to functionalize AuNPs) | Thiol-C6- AAAAACCCCC GCT CTT GAG CCT CTT GAC AC |
| 2 | Complementary_Probe (C_Probe used to functionalize the nitrocellulose) | Thiol-C6- AAAAACCCCC GTG TCA AGA GGC TCA AGA GC |
| 3 | Target sequence (TS used for the detection) | GTG TCA AGA GGC TCA AGA GC |
Disclaimer/Publisher’s Note: The statements, opinions and data contained in all publications are solely those of the individual author(s) and contributor(s) and not of MDPI and/or the editor(s). MDPI and/or the editor(s) disclaim responsibility for any injury to people or property resulting from any ideas, methods, instructions or products referred to in the content. |
© 2026 by the authors. Licensee MDPI, Basel, Switzerland. This article is an open access article distributed under the terms and conditions of the Creative Commons Attribution (CC BY) license (http://creativecommons.org/licenses/by/4.0/).
Copyright: This open access article is published under a Creative Commons CC BY 4.0 license, which permit the free download, distribution, and reuse, provided that the author and preprint are cited in any reuse.