
Submitted:
11 November 2026
Posted:
12 November 2026
You are already at the latest version
Abstract
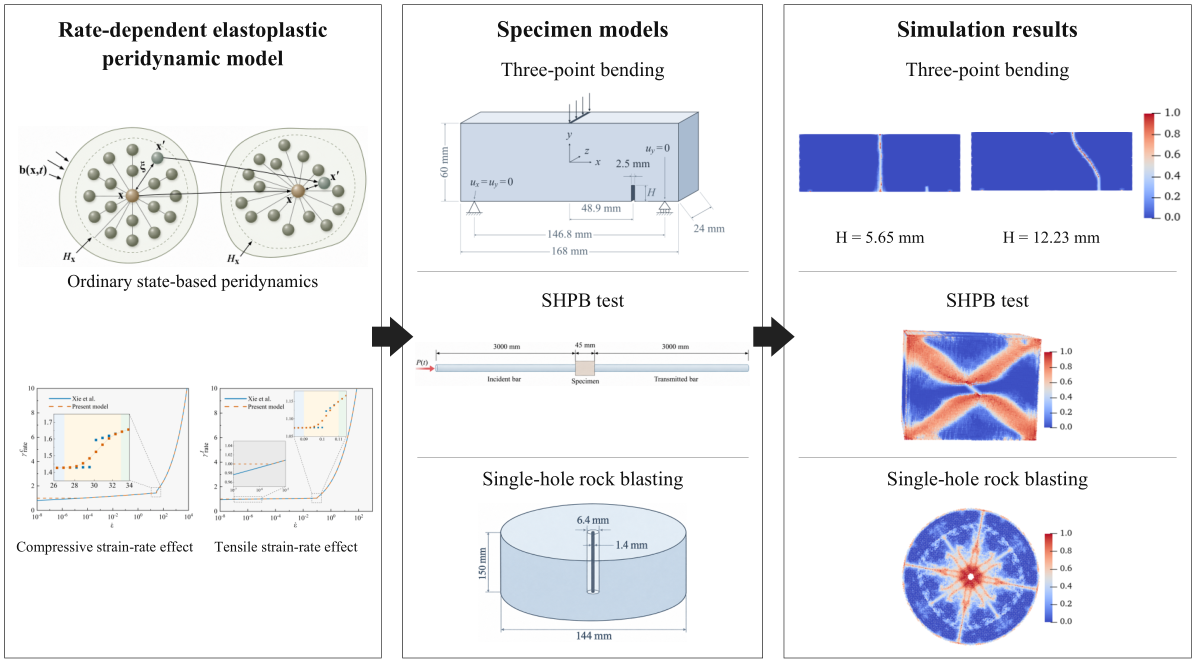
Rocks exhibit complex mechanical behavior under impact loading, including strain-rate dependence, pressure sensitivity, tension-compression asymmetry, and nonlinear volumetric response, posing challenges for accurate prediction of their dynamic response and fracture behavior. This study presents a Holmquist-Johnson-Cook (HJC) elastoplastic model within the ordinary state-based peridynamic (OSB-PD) framework, accounting for distinct strain-rate effects in tension and compression. It incorporates pressure-dependent yielding, nonlinear volumetric response, and plastic damage evolution. The strain-rate strengthening factor is modified using a lower-bound constraint and a quintic smoothing function. A heterogeneous CPU-GPU parallel framework for fluid-solid interaction (FSI) simulations is developed by coupling the model with smoothed particle hydrodynamics (SPH). The model is validated using simulations of three-point bending, SHPB test, and single-hole rock blasting. The predicted crack patterns and stress responses show good agreement with previously reported results. In three-point bending, higher loading velocities intensify local compaction, reduce deviatoric plastic strain accumulation at the same displacement, and delay crack propagation. The displacement required for crack penetration increases from 0.104 to 0.29 mm. SHPB simulations capture irreversible volumetric compaction in compressed regions near crack tips and deviatoric plastic strain accumulation along crack paths. Single-hole rock blasting simulations reproduce near-borehole crushing, radial cracks, and localized annular damage, with early volumetric compaction followed by deviatoric plastic strain accumulation. Heterogeneous parallelization reduces runtime by approximately 53.1% relative to the CPU parallel scheme. The proposed model demonstrates significant potential for investigating the relationships among local compaction, plastic strain accumulation, and fracture evolution in rock under dynamic loading.
Keywords:
peridynamic
; constitutive model
; return-mapping algorithm
; strain rate
; smoothed particle hydrodynamics
1. Introduction
Rock deformation and failure under static and dynamic loading influence excavation efficiency and the stability of the surrounding rock mass. During blasting, damage evolution and crack propagation affect fragmentation and the integrity of the remaining rock mass (Zhu and Zhao, 2021). After detonation, shock waves act on the borehole wall, forming a crushed zone in the surrounding rock and initiating tensile cracks beyond this zone (Han et al., 2020; Li et al., 2019; Shen et al., 2021). Stress-wave amplitude decays with distance, typically following a power-law or exponential relationship (Lu et al., 2010). Detonation gases subsequently penetrate cracks in the damaged rock and drive further crack growth (Chi et al., 2019; Zhang et al., 2021). Peridynamics (PD) describes interactions between material points through nonlocal integral equations and accommodates displacement discontinuities associated with crack propagation (Silling, 2000). Elastoplastic constitutive models have been incorporated into PD to capture nonlinear deformation before fracture. Madenci and Oterkus (Madenci and Oterkus, 2016) developed an OSB-PD elastoplastic model with isotropic hardening. Liu et al. (Liu et al., 2020b) developed an OSB-PD model to describe deformation and fracture in materials with nonlinear hardening. Zhang et al. (Zhang et al., 2024) developed an elastoplastic OSB-PD model using the bond extension state and an energy dissipation rate criterion for bond failure. For pressure-sensitive rock-like materials, Zhou et al. (Zhou et al., 2021) developed an OSB-PD elastoplastic model incorporating the Drucker-Prager yield criterion and a non-associated flow rule. Strain-rate effects also influence dynamic damage and fracture in rock (Sun et al., 2025; Wang et al., 2025a). Huang et al. (Huang et al., 2021) investigated dynamic tensile failure in concrete using a rate-dependent PD model. Wu and Huang (Wu and Huang, 2022) incorporated hydrostatic pressure and volumetric changes into a dynamic failure model for concrete.
Rock-like materials exhibit distinct strain-rate sensitivities under tensile and compressive loading, which should be reflected in their rate-dependent strength relations. Zhang and Zhao (Zhang and Zhao, 2014) systematically reviewed dynamic rock testing methods and the strain-rate dependence of rock strength and fracture behavior. Xie et al. (Xie et al., 2017) fitted separate strain-rate relations for tension and compression and incorporated them into the Riedel-Hiermaier-Thoma (RHT) constitutive model. Liu et al. (Liu et al., 2020a) introduced a hyperbolic function into the HJC model to describe strain-rate effects under dynamic loading. These constitutive developments were primarily implemented within the finite element method (FEM) framework. However, extending these rate-dependent relations to OSB-PD requires consistent treatment of strain-rate strengthening, pressure-dependent plasticity and plastic damage evolution.
Smoothed particle hydrodynamics (SPH) (Gingold and Monaghan, 1977) is a meshfree particle method suited to simulating shock-wave propagation (Tian and Xu, 2026) and detonation products (Fakhimi and Lanari, 2014). PD is effective in describing damage evolution and crack propagation in solids (Fan et al., 2016). By combining the complementary strengths of SPH and PD, various coupling approaches have been developed for fluid-solid interaction (FSI) simulations. Common interface treatments include virtual particle methods (Xu et al., 2013; Xu et al., 2025) and short-range repulsive force methods (Huang et al., 2024; Yao and Huang, 2022). FSI interface identification and treatment are also important in particle-based simulations. Wang et al. (Wang et al., 2019) improved free-surface identification and particle shifting methods, providing a useful reference for identifying and treating particles at the FSI interface. In blast engineering, Fan et al. (Fan et al., 2016) employed SPH-PD to simulate soil fragmentation and ejection. Huang et al. (Huang et al., 2025) and Liu et al. (Liu et al., 2025) investigated concrete failure caused by underwater explosions and internal charge detonations, respectively. Chen et al. (Chen et al., 2020) and Ba et al. (Ba et al., 2026a) simulated shaped charge jet formation and penetration, examining detonation wave propagation and liner collapse.
As meshfree methods involving nonlocal interactions, SPH and PD require neighborhood searches and particle interaction evaluations, leading to higher computational costs than conventional FEM. Existing acceleration strategies primarily rely on multicore CPU or GPU parallelization. Fan et al. (Fan and Li, 2017) used OpenMP to simulate blast-induced fragmentation involving nearly five million particles. Huang et al. (Huang et al., 2025) employed OpenMP parallelization to investigate damage to concrete dams subjected to underwater explosions. Ba et al. (Ba et al., 2026b) reduced the computational cost of SPH-PD simulations by combining OpenMP multithreading with an optimized family search algorithm. For GPU acceleration, Chen et al. (Chen et al., 2026) developed a multi-GPU SPH-PD framework using domain decomposition and data exchange. Zheng et al. (Zheng et al., 2026) implemented a GPU-accelerated SPH-PD solver using Taichi. Despite these advances, many existing SPH-PD frameworks rely on either CPU or GPU parallelization, with limited exploration of heterogeneous CPU-GPU computing. The SPH fluid and PD solid domains can be computed largely independently, exchanging kinematic states and interaction forces through their coupling interface. This computational structure is inherently suited to heterogeneous CPU-GPU parallelization.
To address these limitations, this study develops a modified HJC elastoplastic constitutive model within the OSB-PD framework, incorporating distinct strain-rate effects in tension and compression. A heterogeneous CPU-GPU parallel framework is also established for SPH-PD FSI simulations. The nonlocal constitutive formulation incorporates the pressure-dependent yielding, nonlinear volumetric response and plastic damage evolution of the HJC model. The strain-rate strengthening relations are modified using a lower-bound constraint and quintic smoothing. An in-house solver is developed using Fortran/OpenMP and C++/CUDA, enabling concurrent PD and SPH computations on the CPU and GPU, respectively.
The outline of this paper is as follows: Section 2 introduces the proposed rate-dependent elastoplastic OSB-PD constitutive model, the SPH-PD coupling method, and its heterogeneous CPU-GPU implementation. Section 3 evaluates the constitutive model through simulations of three-point bending of eccentrically notched sandstone and SHPB test. Section 4 examines cylindrical TNT charge detonation and applies the coupled framework to single-hole rock blasting. Section 5 summarizes the main conclusions.
2. Methodology
2.1. OSB-PD
In OSB-PD (Silling et al., 2007), continuum deformation and failure are described by nonlocal interactions between particles, with each particle interacting with its neighbors within a finite horizon. In the reference configuration, the horizon of a particle x is defined as Hx = {x′ ∈ R,‖x′ − x‖<δ}, where δ denotes the horizon radius. In this study, we set δ = 3.015Δx, where Δx is particle spacing. The equation of motion for a particle is given by:
where ρ denotes the mass density, u is the displacement vector, V is the particle volume, and b represents the external force density. Figure 1 illustrates the particle distribution within the horizon. For a bond connecting particles x and x′, the reference bond vector is defined as X〈ξ〉 = x′ − x.
The force vector state in Eq. (1) can be expressed as , where denotes the scalar force state. The scalar states and represent the deformed and initial bond lengths, respectively. The bond extension scalar state is defined as . To distinguish volumetric and deviatoric deformations, the bond extension scalar state is decomposed into isotropic and deviatoric components as , where is the isotropic extension component, and is the deviatoric extension component. The nonlocal dilatation is given by , where denotes the weighted volume. The influence function is set to unity in this study. For three-dimensional problems, the scalar force state is given by:
where µ, E, and v denote the shear modulus, Young’s modulus, and Poisson’s ratio, respectively. α and k′ are given by α = 15μ/q and k′ = E/(3(1 − 2v)), respectively.
2.2. Rate-Dependent Elastoplastic Peridynamic Model
Rock-like materials exhibit pronounced pressure sensitivity. Accordingly, the nonlocal dilatation θ and deviatoric extension scalar state are decomposed into elastic and plastic components as follows:
where θe and θp denote the elastic and plastic dilatations, respectively. and denote the elastic and plastic deviatoric extension scalar states, respectively. The scalar force state can be decomposed into isotropic and deviatoric components as follows:
where P denotes the hydrostatic pressure, with positive values indicating compression.
Following the conventional HJC model, the volumetric response of rock-like materials is divided into three stages: linear elastic, transition, and fully compacted. In the linear elastic stage, volumetric deformation is predominantly recoverable. When the hydrostatic pressure reaches the crushing pressure Pcrush, the material enters the transition stage, where pore compression produces irreversible volumetric deformation. In this stage, pressure varies linearly with dilatation. Once the pressure exceeds the locking pressure Plock, the material becomes fully compacted, and the pressure-dilatation relationship is described by a cubic polynomial. The equation of state during loading is expressed as follows:
where k′ denotes the bulk modulus in the linear elastic stage, and θcrush is the dilatation at Pcrush. The pressure response coefficient in the transition stage is defined as Kcrush = (Plock − Pcrush)/(−θplock + θcrush), where θplock denotes the dilatation at Plock. The parameters K1, K2, and K3 are material constants in the equation of state for the fully compacted stage. The modified dilatation in this stage is defined as , where θlock is the reference dilatation for the fully compacted equation of state. To account for the effect of damage on hydrostatic tensile strength, the tensile cutoff pressure is set to −T(1 − D), where T denotes the maximum hydrostatic tensile stress sustained by the undamaged material and is taken as positive, and D represents cumulative plastic damage. The equation of state during unloading is expressed as:
where Kav = [(1 − Fc)k′ + FcK1] denotes the effective bulk modulus during unloading. The interpolation factor Fc is defined as Fc = (−θmin + θcrush)/(−θplock + θcrush). Pmax and θmin denote the maximum pressure and minimum dilatation attained during the loading history, respectively.
2.3. Yield Criterion and Plastic Flow Rule
The HJC yield criterion is employed to describe the deviatoric plastic response of rock-like materials, accounting for the effects of hydrostatic pressure, strain rate, and plastic damage. In the PD framework, the equivalent stress is defined in terms of the elastic distortional energy density as follows (Liu et al., 2020b):
where denotes the deviatoric part of the energy function W. The yield function F is defined as:
where denotes the normalized equivalent stress. The quantities ψ and fc denote the normalized yield strength and compressive strength, respectively. For F < 0, the material response is elastic, whereas F = 0 indicates that the stress state lies on the yield surface. If the trial stress state yields F > 0, a plastic correction is required to restore yield consistency. A nonnegative plastic multiplier increment Δλ is introduced, subject to the Kuhn-Tucker complementarity conditions: F ≤ 0, Δλ ≥ 0, ΔλF = 0. The increment of the plastic deviatoric extension scalar state is expressed as:
where ∇dF denotes the deviatoric component of the Frechet derivative of the yield function F. The volumetric plastic response is updated separately using the equation of state. The preceding equation therefore describes only deviatoric plastic flow. The equivalent plastic strain increment and the equivalent plastic strain rate can be expressed as:
where Δt denotes the time step.
2.4. Yield Strength and Strain-Rate Strengthening Factor
The normalized yield strength in Eq. (8) is based on the HJC model and accounts for pressure hardening, softening due to plastic damage, and the effects of strain rate. Separate expressions are adopted for compressive and tensile pressure states as follows:
where A, B, D, and N denote the dimensionless cohesive strength parameter, pressure hardening coefficient, plastic damage parameter, and pressure hardening exponent, respectively. The parameters ψmax and γrate denote the maximum normalized yield strength in compression and the strain-rate strengthening factor, respectively.
The conventional HJC model accounts for strain-rate effects on material strength through a logarithmic expression:
where C denotes the strain-rate sensitivity coefficient, denotes the normalized strain rate, is the equivalent plastic strain rate, and is the reference strain rate.
Previous studies indicate that the conventional HJC logarithmic relation does not fully capture the distinct strain-rate sensitivities of rock-like materials in tension and compression (Xie et al., 2017). Accordingly, strain-rate strengthening relations fitted to existing dynamic test data are adopted. Separate power-law expressions are used for different strain-rate regimes. Under compression, the strain-rate strengthening factor is expressed as:
where is the reference compressive strain rate. Under tension, the strain-rate strengthening factor is expressed as:
where is the reference tensile strain rate. At strain rates below the corresponding reference value, the strengthening factors fall below unity, leading to an unintended reduction in the baseline strength. Moreover, the low and high strain-rate branches yield different values at the switching point, resulting in discontinuities in the strengthening factor and yield strength. To address these issues, the strengthening factors are bounded below by unity, and a finite transition interval is introduced around the critical strain rate, as shown in Figure 2. The two branches are smoothly connected using the following quintic function:
h(η) = 10η3 − 15η4 + 6η5, 0 ≤ η ≤ 1
The function satisfies h(0) = 0, h(1) = 1, and its first and second derivatives vanish at both endpoints. These conditions ensure continuity of the piecewise function and its first two derivatives at the transition boundaries, providing a smooth transition between the rate relations. Under compression, the strain-rate strengthening factor is expressed as:
Under tension, the strain-rate strengthening factor is expressed as:
The smoothing intervals for compression and tension are 27-33 s-1 and 0.09-0.11 s-1, respectively, each extending 10% on either side of its critical strain rate (30 and 0.1). Within each interval, the quintic smoothing function h increases continuously from 0 to 1 with increasing strain rate, ensuring a smooth transition between different strain-rate branches. A lower bound of unity is also imposed on the strain-rate strengthening factor to prevent the predicted strength from falling below its quasistatic value at low strain rates.
2.5. Plastic Damage Evolution and Fracture Criterion
Plastic damage accumulates progressively with increasing plastic deformation. The plastic damage variable D is defined as:
where D ranges from 0 to 1. and Δθp denote the increments of equivalent plastic strain and plastic dilatation at each time step, respectively. The summation accounts for damage accumulation over the loading history. The plastic strain at fracture is expressed as:
where γ1 and γ2 are experimentally determined material constants, and denotes the minimum allowable plastic strain at fracture. The bond damage variable Dmg at each PD material point is defined as the fraction of broken bonds within its horizon:
where μ(x, x′, t) denotes the bond status variable, taking a value of 1 for an intact bond and 0 for a broken bond. Bond failure is assessed using hydrostatic tension and critical stretch criteria. The bond status is defined as μ(x, x′, t) = β1β2, where β1 = 0 when the hydrostatic pressures at both bond endpoints reach the tensile cutoff pressure (Wang et al., 2025b), and β2 = 0 when the bond stretch exceeds its critical value. The critical stretch is determined using an energy-based criterion (Zhu and Zhao, 2019) as follows:
where Gc denotes the critical fracture energy. Once either failure criterion is satisfied, the bond breaks irreversibly.
2.6. Return-Mapping Algorithm and History Variable Updates
This section describes the constitutive integration procedure and the iterative scheme used to enforce yield consistency. The volumetric and deviatoric responses are updated sequentially. The equation of state first determines the hydrostatic pressure and the volumetric contribution to plastic damage. The trial deviatoric force state is then corrected through radial return mapping. With the smoothed strain-rate strengthening factor, yield consistency is enforced through a single scalar nonlinear equation incorporating the deviatoric plastic increment, tensile cutoff, and compressive strength cap. The equation is solved using Brent’s method. The subscripts n, n+1, and tr denote the previous, updated, and elastic trial states, respectively. Under compression, hydrostatic pressure is taken as positive and dilatation as negative.
At the start of step n+1, each particle retains the history variables from step n. These include the plastic dilatation , plastic damage Dn, and equivalent plastic strain . The maximum recorded pressure Pmax, n, minimum recorded dilatation θmin, n, and unloading bulk modulus Ku, n are also retained. Each bond retains its plastic deviatoric extension . During the volumetric update, bond extensions and particle dilatations are computed from the deformation state at step n+1:
where the reference state and weighted volume q remain constant throughout the simulation. Both are therefore computed once during preprocessing. The elastic trial state is constructed by assuming that no additional plastic deformation occurs during the current time step:
If Ptr ≤ Pmax, n, no additional volumetric plastic deformation occurs, and the volumetric plastic history variables remain unchanged. The material follows an unloading or reloading path within the historical loading envelope, with the pressure calculated using Eq. (6). If Ptr > Pmax, n, the material follows the loading branch, and the pressure is calculated using Eq. (5):
where θcrush = −Pcrush/k′. The unloading bulk modulus Ku, n+1 is updated using Eq. (6). The corresponding state variables are then updated as follows:
Pmax, n+1 = max(Pmax, n, Pn+1), θmin, n+1 = min(θmin, n, θn+1)
Assuming no additional deviatoric plastic deformation , the damage increment arises solely from volumetric plasticity. The predicted damage Dtr and plastic strain at fracture are given by:
where Dtr denotes the trial plastic damage evaluated using Eq. (18) under the assumption of no additional deviatoric plastic deformation. At step n+1, the deviatoric extension scalar state is given by . The trial elastic deviatoric extension scalar state is then obtained as . The corresponding trial deviatoric scalar force state is given by . The trial equivalent stress of the particle is expressed as:
The trial yield function at step n+1 is . If the strain-rate strengthening factor γrate is neglected, the trial normalized yield strength ψtr is given by:
If Ftr ≤ 0, the deviatoric response is elastic, and the trial values are adopted as the updated values at step n+1. If Ftr > 0, a plastic correction is required to satisfy Fn+1 = σn+1/fc − ψn+1 = 0. During this correction, the elastic and plastic components of the total deviatoric extension satisfy:
Combining Eqs. (9) and (28), can be expressed as follows:
Substituting the plastic increment from Eq. (31) into yields:
As shown in Eq. (32), plastic correction changes only the magnitude of the trial deviatoric force state while preserving its direction. Combining Eqs. (32) and (28) yields a scalar relation for updating the equivalent stress:
Based on this relation, a radial scaling factor r is introduced. The deviatoric scalar force state and elastic deviatoric extension scalar state are then updated as follows:
Once Δλ is determined, the deviatoric response of each bond is updated. For elastic steps, r = 1. The total scalar force state is then obtained by combining the volumetric and deviatoric contributions, while the equivalent plastic strain is updated as follows:
With the trial state and volumetric response known, the plastic multiplier Δλ is the only unknown in the plastic correction. The equivalent plastic strain increment is related to Δλ through Eq. (10). This increment is used to update the plastic damage D through Eq. (18) and determine the corresponding tensile cutoff pressure −T(1 − D). The strain-rate strengthening factor γrate is evaluated using Eqs. (16) and (17), and the normalized yield strength ψ is determined from Eq. (11). The corrected stress state must satisfy the yield consistency condition Fn+1 = σn+1/fc − ψn+1 = 0. Combining this condition with Eq. (33) yields . The plastic correction thus reduces to a scalar nonlinear problem. The corresponding consistency equation in terms of takes the form:
The equivalent stress σn+1 in Eq. (33) must satisfy . The equivalent plastic strain increment must therefore satisfy:
During plastic correction, the residual satisfies R(0) < 0 at the lower bound of the solution interval. At the upper bound, the nonnegative yield strength gives . The nonlinear equation is solved using Brent’s method (Brent, 1971) for its computational efficiency and robustness. This method combines inverse quadratic interpolation, the secant method, and bisection. It typically converges faster than bisection and requires no derivative evaluations. It therefore avoids the convergence difficulties that Newton-Raphson iterations may encounter when the derivative approaches zero. The quintic smoothing function ensures continuity across strain-rate branches, enabling robust application of Brent’s method. For each candidate value, the plastic damage D is evaluated first. The tensile cutoff is then applied to the hydrostatic pressure according to Pn+1 = max[Pn+1,−T(1 − D)]. The corresponding strain-rate strengthening factor γrate and normalized yield strength ψn+1 are then evaluated. The residual is calculated from Eq. (36) and used to update the bracketing interval. The iteration continues until the following convergence criterion is met:
Figure 3 illustrates the solution strategy for the volumetric and deviatoric responses.
2.7. Riemann SPH
Fluid motion is governed by the Navier-Stokes equations. During the rapid transient expansion associated with the explosion, viscous effects are neglected and an inviscid approximation is adopted. In the Riemann-based SPH formulation, the governing equations (Parshikov and Medin, 2002) take the form:
where ρ, v, e, p, and m denote the fluid density, velocity, internal energy, pressure, and mass, respectively. N is the total number of fluid particles within the support domain of particle i. The one-dimensional Riemann problem is formulated along the direction defined by the unit vector e = −(xi − xj)/|xi − xj|. The velocity component in this direction is v* = v*e, as shown in Figure 4. The intermediate velocity v* and pressure p* are obtained using the Riemann solver (Meng et al., 2020):
where the subscripts L and R denote the left and right states of the Riemann problem, respectively. In SPH, these states are typically defined by the primitive variables of particles i and j. The velocity components along the Riemann direction are vL = vi ⋅ e and vR = vj ⋅ e, respectively.
The Lagrangian sound speed S is expressed as:
where cL and cR denote the sound speeds of fluid particles in the left and right states, respectively.
The quintic spline kernel (Del Castillo et al., 2021) is adopted in this study and is given by:
where h denotes the smoothing length of the particle, and q = ‖xi − xj‖/h denotes the normalized distance between particles i and j.
The detonation products are modeled using the Jones-Wilkins-Lee (JWL) equation of state, which is expressed as:
where A and B denote pressure-related constants. R1, R2, and ωjwl are constants, ρ0 denotes the initial density, and e0 denotes the specific internal energy.
2.8. FSI Interface Treatment, Computational Efficiency, and Numerical Implementation
Modern computer systems often include both a CPU and a GPU, yet relying exclusively on one can leave the other underutilized. To exploit these resources, a heterogeneous CPU-GPU parallel framework is developed for SPH-PD FSI simulations. The framework is implemented in a Windows environment using Visual Studio, with Fortran/OpenMP for CPU parallelization and C++/CUDA for GPU parallelization. SPH computations in the fluid domain are performed on the GPU, while PD computations in the solid domain run concurrently on the CPU. Following the time integration strategy in Ref. (Shi et al., 2024), the two domains advance with independent time steps and exchange interface data at common synchronization times. This task allocation enables concurrent CPU-GPU utilization and can improve computational efficiency in three-dimensional FSI simulations. The overall computational workflow is illustrated in Figure 5.
To reduce the overhead of CPU-GPU interface data exchange, an interface particle identification method based on the divergence of the position vector is developed. Inspired by SPH free-surface detection (Wang et al., 2019), the method identifies PD particles participating in FSI, as illustrated in Figure 6.
In a three-dimensional continuum, the position vector satisfies the following identity:
For interface particle detection, the smoothing length is set to h = δ/2, where δ is the PD horizon radius. Using the PD particle coordinates and volumes, we construct a discrete divergence criterion Di based on SPH kernel consistency. For PD particles that are not fully damaged, the discrete divergence criterion Di is defined as:
For particles in the solid interior, Di remains close to 3 under small deformations. It may exceed 3 under compression but falls markedly below 3 near free surfaces. In this study, PD particles satisfying Di < 2.95 are selected as interface candidates for subsequent FSI force calculations.
Penalty methods are widely used in SPH-based FSI simulations (Gharehdash et al., 2020). Following the SPH-FEM coupling approach (Xu and Wang, 2013), a contact model consisting of a penalty spring and a damper connected in parallel is adopted. The damping coefficient η and penalty stiffness Ki are set to 0.1 and 2 × 10⁵, respectively. The displacement u, velocity v, and acceleration a are updated using the velocity-Verlet algorithm (Wu and Huang, 2022) as follows:
The PD time step is set to 0.1 µs. The SPH time step is taken as the minimum value permitted by the Courant-Friedrichs-Lewy condition (Adami et al., 2012), the maximum particle acceleration constraint (Wang et al., 2022), and the contact stiffness constraint (Xu and Wang, 2013). Following Ref. (Shi et al., 2024), an adaptive strategy is used to predict the next SPH time step (Figure 5). The final SPH time step is adjusted as needed to reach the target PD time, ensuring temporal synchronization between the two solvers. All particle searches are performed using the classical linked-list method (Quentrec and Brot, 1973).
3. Numerical Simulations and Discussion
3.1. Fracture Simulation of Eccentrically Notched Sandstone Under Three-Point Bending
To assess the model’s ability to predict crack propagation in sandstone with different notch heights, the three-point bending tests on eccentrically notched sandstone specimens reported in Ref. (Lin et al., 2009) are reproduced. Figure 7 shows the geometry and dimensions of the numerical model. The particle spacing is set to 1 mm, and a loading velocity of 5 mm/s is prescribed. The strain-rate strengthening factors are determined using Eqs. (16) and (17), while the remaining HJC model parameters are taken from Ref. (Ling et al., 2018). The critical fracture energy of sandstone is Gc = 70 N/m (Yang et al., 2020).
Figure 8 compares the present numerical results with previous numerical and experimental results. At H = 5.65 mm, the main crack propagates nearly vertically near midspan, with its location and overall path broadly consistent with previous results. At H = 12.23 mm, the main crack propagates obliquely from the notch tip toward midspan along a curved path. The present and previous simulations predict similar overall crack propagation directions. However, local damage is more spatially dispersed in the previous simulation, whereas the present model produces a smoother crack path. This difference may be attributed to the pore-induced heterogeneity represented by randomly pre-broken bonds in the previous model. The overlay in Figure 8(f) further shows that the experimental acoustic emission (AE) events are concentrated near the notch tip and in the region to its upper left, consistent with the predicted damage distribution. These comparisons indicate that the present model can reproduce the main fracture patterns of eccentrically notched sandstone specimens under three-point bending at different notch heights.
Previous studies have shown that crack propagation from pre-existing flaws in rock-like materials under three-point bending is predominantly governed by tensile fracture (Zhang et al., 2026). Under dynamic loading, localized compaction and rate-dependent plastic deformation near the loading point further contribute to the failure process. Figure 9 shows the distributions of hydrostatic pressure, plastic damage, and bond damage for the specimen with H = 12.23 mm at different loading velocities. At a loading displacement of 0.1 mm, the hydrostatic pressure near the loading point increases from 16.2 to 141.6 MPa as the loading velocity increases from 0.2 to 1.5 m/s, accompanied by increasingly pronounced pressure concentration and plastic damage. According to Eq. (18), plastic damage is driven by both volumetric and deviatoric plastic deformation. However, their respective contributions are difficult to distinguish from plastic damage contours alone. Figure 10 therefore shows the variations in mean equivalent plastic strain , hydrostatic pressure P, and plastic dilatation θp with loading displacement.
Equivalent plastic strain characterizes deviatoric plastic deformation, whereas plastic dilatation θp reflects irreversible volumetric deformation. At loading velocities of 1.0 and 1.5 m/s, the mean hydrostatic pressure exhibits two distinct peaks, with a minor initial peak followed by a more pronounced second peak (Figure 10(b)). At a loading displacement of approximately 0.05 mm, the mean equivalent plastic strain remains zero in both cases despite a marked increase in hydrostatic pressure. Plastic dilatation begins to develop at this stage (Figure 10(c)), indicating that volumetric plastic compaction precedes deviatoric plastic strain accumulation.
At a loading displacement of 0.1 mm, distinct damage zones extend from the notch tip at loading velocities of 0.2 and 0.5 m/s, accompanied by relatively high mean equivalent plastic strain. In contrast, at 1.5 m/s, plastic damage remains concentrated near the loading point (Figure 9(d)), while the mean equivalent plastic strain remains close to zero. The contour plots and response curves indicate that plastic damage near the loading point is primarily associated with volumetric plastic compaction, whereas crack propagation is accompanied by greater deviatoric plastic strain accumulation. Volumetric plastic deformation persists even after hydrostatic pressure decreases, further indicating the irreversible nature of plastic compaction. These results indicate that the proposed model can capture the evolution of volumetric and deviatoric plastic deformation. It also distinguishes plastic compaction near the loading point from deviatoric deformation in the crack propagation region.
With continued loading, the displacement required for through-going crack formation increases with loading velocity, reaching 0.104, 0.16, 0.24, and 0.29 mm at 0.2, 0.5, 1.0, and 1.5 m/s, respectively (Figure 9). At a given displacement, higher loading velocities are associated with reduced deviatoric plastic strain accumulation and delayed crack propagation. This trend is consistent with strain-rate strengthening in the proposed model, which increases resistance to plastic flow. The final damage patterns (Figure 8 and Figure 9) show that the crack exit points along the specimen’s upper edge progressively shift toward midspan as loading velocity increases from 0.2 to 1.0 m/s. At 1.5 m/s, the midspan crack and cracks originating from the notch tip propagate toward the loading region. The midspan crack becomes through-going first, shifting the dominant failure path from flaw-tip propagation to midspan cracking. The proposed model also captures loading-dependent changes in local deformation, including increased localized compaction and delayed deviatoric plastic strain accumulation.
3.2. SHPB Test
A three-dimensional peridynamic model was established to assess the constitutive model’s ability to capture damage evolution under impact loading. The numerical model is shown in Figure 11. The sandstone specimen measures 45 mm × 35 mm × 35 mm and contains a centrally located, 7-mm-long pre-existing crack inclined at 45∘. The incident and transmitted bars were each 3 m long. Impact loading is applied at the far end of the incident bar by prescribing a pressure-time history P(t). The strain-rate strengthening factor is determined using Eqs. (16) and (17), while the remaining HJC model parameters are taken from Ref. (Zhou et al., 2026). The sandstone specimen is discretized with a particle spacing of 0.5 mm. The critical fracture energy of sandstone is set to Gc = 70 N/m (Yang et al., 2020). To reduce computational cost, the incident and transmitted bars are represented by a one-dimensional, linearly elastic OSB-PD model (Ba et al., 2026b), with a particle spacing of 1 mm. Contact interactions between the one-dimensional bars and the three-dimensional sandstone specimen are treated using displacement projection and momentum correction (Sun et al., 2024; Wang et al., 2025a).
Figure 12 compares the damage patterns and stress-wave responses with experimental results. The simulated major crack patterns were generally consistent with the experimental observations. As shown in Figure 12(c) and (d), the model reasonably reproduced the overall shapes and peak times of the reflected and transmitted waves.
Figure 13(a) presents the hydrostatic pressure, equivalent plastic strain, damage and plastic dilatation fields at different times. These fields illustrate the spatial evolution of deformation and fracture. At 700 µs, local pressure concentrations form near the tips of the pre-existing flaw, and spatially distinct regions of localized volumetric and deviatoric plastic deformation emerge. At 720 µs, as loading continues, the damage zones near the flaw tips extend outward, and localized plastic compaction develops further. By 740 µs, the damage zones expand markedly, forming an X-shaped shear failure pattern.
At 700 µs, shortly before crack initiation, volumetric plastic deformation is mainly concentrated above the upper-left flaw tip and below the lower-right flaw tip, whereas deviatoric plastic deformation occurs primarily in adjacent lateral regions. To explain this spatial distribution, an inclined crack in an infinite plate is considered. The elastic stress field near the crack tip is used as a reference. As shown in Figure 13(b), a local coordinate system is defined at the upper-left flaw tip, with its reference axis aligned with the outward extension of the pre-existing flaw in the nominal crack propagation direction. Under the plane-stress assumption, the local normal stresses are expressed as follows (Zhu et al., 2021):
where r denotes the distance from the crack tip, and KI and KII are the mode I and mode II stress intensity factors, respectively. T denotes the T-stress contribution. The hydrostatic pressure P can be expressed as:
Eq. (48) indicates that the pressure above the crack tip is substantially higher than that to its left. This difference helps explain why the region above the tip satisfies the compaction onset criterion and undergoes irreversible volumetric compression. This corresponds to the region of localized volumetric plastic deformation shown in Figure 13(a). In contrast, lower pressure in the lateral region leads to weaker pressure hardening under comparable damage and strain-rate conditions, facilitating deviatoric yielding and plastic strain accumulation.
This analysis reveals the distinct spatial distributions of volumetric plastic compaction and deviatoric plastic strain accumulation near crack tips. The elastic crack-tip stress field provides a theoretical explanation for compaction above the crack tip and deviatoric plastic strain accumulation to its left, consistent with the numerical result. These results reflect the relationships among local compaction, plastic deformation, and fracture evolution.
4. SPH-PD Simulation of Single-Hole Rock Blasting
4.1. Cylindrical TNT Charge Detonation
The accuracy of the present Riemann-SPH solver is assessed through a three-dimensional simulation of detonation in a cylindrical TNT charge (Chen et al., 2020). The numerical model in Figure 14 is used to examine pressure evolution behind the detonation front. The outer surfaces are treated as free boundaries, allowing the detonation products to expand. The initial pressure of the unreacted explosive is set to zero. The JWL equation of state parameters are A = 371.2 GPa, B = 3.21 GPa, R1 = 4.15, R2 = 0.95, ωjwl = 0.3, and e0 = 4.29 MJ/kg. The SPH particle spacing is set to 0.167 mm. Detonation is initiated at the center of one end face. Following initiation, a spherical detonation wave propagates through the explosive at a constant speed of 6930 m/s.
Figure 15 compares the pressure and velocity fields predicted by the present SPH model with previously reported results. As the detonation wave propagates, a pronounced pressure peak develops in the central region, while the pressure remains relatively low near the free surfaces.
Figure 16 shows the axial pressure profiles of the gaseous detonation products at different times. At 13 µs, the peak pressure reaches 19 GPa, close to the theoretical value of 19.5 GPa. This agreement supports the accuracy of the SPH model in predicting detonation gases.
4.2. Single-Hole Rock Blasting
To investigate single-hole rock blasting with a cylindrical charge, the SPH-PD method is employed to simulate the dynamic responses of the detonation products and surrounding rock. The rock specimen is cylindrical, with a diameter of 144 mm and a height of 150 mm. A borehole with a diameter of 6.4 mm is located at the center, and the charge radius is 0.7 mm, as shown in Figure 17. The particle spacings for the rock and TNT are set to 1 mm and 0.2 mm, respectively. The HJC constitutive parameters for granite are taken from Ref. (Wu et al., 2025), while the JWL equation of state parameters are adopted from Ref. (Dehghan Banadaki and Mohanty, 2012). The fracture energy is set to 70 N/m (Yang et al., 2024). The PD time step is set to 0.02 µs.
To evaluate the computational performance of the proposed heterogeneous CPU-GPU parallel algorithm, SPH-PD coupled simulations are performed on a platform equipped with an Intel Core i9-13900KF CPU and an NVIDIA GeForce RTX 2060 GPU. The number of PD particles is fixed at 813,000, while the SPH particle count is varied to assess its effect on computational efficiency. The results for 100 PD time steps are presented in Table 1. For SPH particle counts ranging from 13,000 to 104,000, the mean CPU utilization remains between 87% and 88%, exceeding that of the GPU. When the SPH particle count exceeds 104,000, the mean GPU utilization reaches 90%-95% and exceeds that of the CPU, accompanied by an increase in runtime. The computational time for each PD time step is primarily determined by the slower computational component. These trends suggest that the computational bottleneck shifts from the CPU to the GPU as the SPH particle count increases. Parallel performance therefore depends on both particle count and hardware configuration.
A further comparison with a CPU OpenMP implementation is conducted under identical conditions, using 813,000 PD particles and 46,920 SPH particles. The CPU implementation requires approximately 99 s, whereas the heterogeneous implementation reduces the runtime by approximately 53.1%. These results indicate that distributing the computational workload between the CPU and GPU can reduce runtime for simulations in which the SPH particle count is substantially lower than the PD particle count.
Figure 18 and Figure 19 compare the predicted damage patterns and peak radial stresses with experimental (Dehghan Banadaki and Mohanty, 2012) and numerical results (Zhu and Zhao, 2021). The simulations reveal a highly damaged zone surrounding the borehole, with radial damage bands extending outward. Reflected tensile waves further induce localized circumferential cracks. The overlaid simulated and experimental crack patterns show good agreement in crack propagation directions and spatial extent, capturing the main features of the crushed zone and radial cracking. The predicted peak radial stress decays with increasing radial distance, consistent with previous numerical simulations. The results indicate that the proposed model captures the main rock failure patterns and the decay of peak radial stress under single-hole blasting.
The simulation shown in Figure 18 is further analyzed to examine the relationships among local compaction, plastic strain, and crack propagation. Figure 20 presents the time histories of spatially averaged hydrostatic pressure, plastic dilatation, equivalent plastic strain, and total dilatation. Representative times are selected from these curves, and corresponding contour plots are presented in Figure 21.
Following detonation, the detonation products expand and transfer pressure to the borehole wall through the FSI interface. At 24.1 µs, high pressure is concentrated near the borehole wall, producing a localized annular damage zone accompanied by plastic damage accumulation. During this stage, the mean plastic dilatation decreases rapidly and then stabilizes, whereas the mean equivalent plastic strain has only begun to increase. The contour plots indicate that intense shock compression produces a crushed zone around the borehole. Irreversible volumetric plastic compaction initially dominates in this region, followed by deviatoric plastic strain accumulation. As stress waves propagate outward and attenuate, the rock response gradually shifts from intense compression near the borehole to deformation driven by stress waves in the surrounding rock.
At 29.3 µs, the mean hydrostatic pressure reaches its first positive peak of approximately 3.5 MPa, while the mean dilatation reaches its minimum, indicating pronounced rock compression. The pressure contours show an outward-propagating annular compressive wave approaching the specimen boundary. Although the local peak pressure is lower than at 24.1 µs, the expanding compressed region increases the mean pressure. Meanwhile, the mean plastic dilatation remains nearly constant, suggesting that further volumetric deformation is predominantly recoverable under compressive wave loading.
Upon reaching the free boundary, the compressive wave is reflected as a tensile wave, inducing localized annular damage near the specimen edge. Tensile stresses behind the compressive wave initiate radial cracks and drive their outward propagation, primarily through tensile regions. Meanwhile, the mean hydrostatic pressure changes from positive to negative and reaches its minimum at 39.1 µs. The mean equivalent plastic strain increases rapidly, whereas the mean plastic dilatation remains nearly constant. At this stage, the tensile stress induced by the stress wave exceeds the rock’s tensile strength, while the compressive stress remains below its compressive strength. Plastic strain accumulation near the radial cracks is primarily associated with deviatoric plastic deformation.
From 39.1 to 57.7 µs, continued crack propagation gradually releases local tensile stresses, reducing their negative contribution to the mean hydrostatic pressure. Meanwhile, stress redistribution following cracking enhances the compressive response within the damaged regions. Together, these effects contribute to a positive peak in the mean hydrostatic pressure at 57.7 µs. As crack propagation slows, the accumulation rate of mean equivalent plastic strain decreases. The volumetric response during this stage is primarily characterized by unloading and compressive reloading.
These results indicate that the proposed formulation captures the progression from localized compaction near the borehole to outward crack propagation. The separate volumetric and deviatoric responses help interpret the roles of irreversible compaction and deviatoric plastic strain accumulation in this process.
5. Conclusion
To address the nonlinear deformation and fracture of rock under impact loading, this study presents a modified HJC elastoplastic model within the OSB-PD framework. A heterogeneous CPU-GPU parallel SPH-PD framework is also established for FSI simulations. The main conclusions are as follows:
(1) The model incorporates distinct strain-rate effects in tension and compression through a lower bound and quintic smoothing of the strain-rate strengthening relation. The nonlocal formulation integrates HJC pressure-dependent yielding, nonlinear volumetric response and plastic damage evolution. Return mapping updates the plastic state by solving a scalar consistency equation incorporating the coupled effects of pressure, strain rate and plastic damage.
(2) In three-point bending, volumetric plastic compaction near the loading region precedes deviatoric plastic strain accumulation, which is pronounced along propagating cracks. Higher loading velocities intensify local compaction, reduce deviatoric plastic strain accumulation, and delay crack propagation at the same loading displacement. As loading velocity increases from 0.2 to 1.0 m/s, crack exits along the upper edge shift toward midspan. At 1.5 m/s, the midspan crack becomes through-going first and dominates failure.
(3) In SHPB simulations, the model captures volumetric plastic compaction in high-pressure regions at crack tips and deviatoric plastic strain accumulation in adjacent regions and crack propagation bands. It also captures the local pressure release associated with damage.
(4) Single-hole rock blasting simulations reproduce the crushed zone around the borehole, radial cracks and localized circumferential damage. Early volumetric plastic compaction near the borehole is followed by deviatoric plastic strain accumulation during radial crack propagation. Heterogeneous CPU-GPU parallelization reduces runtime by 53.1% relative to the CPU parallel implementation.
References
- Adami, S.; Hu, X.Y.; Adams, N.A. A generalized wall boundary condition for smoothed particle hydrodynamics. J. Comput. Phys. 2012, 231(21), 7057–7075. [Google Scholar] [CrossRef]
- Ba, J.L.; Wang, J.X.; Liu, X.C.; Sun, G.; Han, R.B.; Jia, Z.X. A coupled smoothed particle hydrodynamics-peridynamics model with adaptive particle conversion for shaped charge jet formation. Comput. Struct. 2026a, 330, 108345. [Google Scholar] [CrossRef]
- Ba, J.L.; Wang, J.X.; Liu, X.C.; Sun, G.; Yu, H.Y.; Tian, J.R. Efficient SPH-PD FSI model for blast-induced crack initiation and propagation in rocks. Int. J. Fract. 2026b, 250(2), 31. [Google Scholar] [CrossRef]
- Brent, R.P. An algorithm with guaranteed convergence for finding a zero of a function. Comput. J. 1971, 14(4), 422–425. [Google Scholar] [CrossRef]
- Chen, D.; Yu, Z.Y.; Yao, X.H.; Zhou, Z.T.; Wang, M.Y.; Huang, D. Modeling and analysis of non-explosive underwater shock loading using a PD-SPH coupling method. Explos. Shock Waves 2026, 46(1), 011107. (in Chinese). [Google Scholar] [CrossRef]
- Chen, J.Y.; Feng, D.L.; Deng, S.X.; Peng, C.; Lien, F.S. GPU-accelerated smoothed particle hydrodynamics modeling of jet formation and penetration capability of shaped charges. J. Fluids Struct. 2020, 99, 103171. [Google Scholar] [CrossRef]
- Chen, Z.G.; Niazi, S.; Bobaru, F. A peridynamic model for brittle damage and fracture in porous materials. Int. J. Rock Mech. Min. Sci. 2019, 122, 104059. [Google Scholar] [CrossRef]
- Chi, L.Y.; Zhang, Z.X.; Aalberg, A.; Yang, J.; Li, C.C. Measurement of shock pressure and shock-wave attenuation near a blast hole in rock. Int. J. Impact Eng. 2019, 125, 27–38. [Google Scholar] [CrossRef]
- Dehghan Banadaki, M.M.; Mohanty, B. Numerical simulation of stress wave induced fractures in rock. Int. J. Impact Eng. 2012, 40-41, 16–25. [Google Scholar] [CrossRef]
- Del Castillo, E.M.; Fávero Neto, A.H.; Borja, R.I. Fault propagation and surface rupture in geologic materials with a meshfree continuum method. Acta Geotech. 2021, 16(8), 2463–2486. [Google Scholar] [CrossRef]
- Fakhimi, A.; Lanari, M. DEM-SPH simulation of rock blasting. Comput. Geotech. 2014, 55, 158–164. [Google Scholar] [CrossRef]
- Fan, H.F.; Bergel, G.L.; Li, S.F. A hybrid peridynamics-SPH simulation of soil fragmentation by blast loads of buried explosive. Int. J. Impact Eng. 2016, 87, 14–27. [Google Scholar] [CrossRef]
- Fan, H.F.; Li, S.F. Parallel peridynamics-SPH simulation of explosion induced soil fragmentation by using OpenMP. Comput. Part. Mech. 2017, 4(2), 199–211. [Google Scholar] [CrossRef]
- Gharehdash, S.; Shen, L.M.; Gan, Y.X. Numerical study on mechanical and hydraulic behaviour of blast-induced fractured rock. Eng. Comput. 2020, 36(3), 915–929. [Google Scholar] [CrossRef]
- Gingold, R.A.; Monaghan, J.J. Smoothed particle hydrodynamics: theory and application to non-spherical stars. Mon. Not. Roy. Astron. Soc. 1977, 181(3), 375–389. [Google Scholar] [CrossRef]
- Han, Z.Y.; Li, D.Y.; Zhou, T.; Zhu, Q.Q.; Ranjith, P.G. Experimental study of stress wave propagation and energy characteristics across rock specimens containing cemented mortar joint with various thicknesses. Int. J. Rock Mech. Min. Sci. 2020, 131, 104352. [Google Scholar] [CrossRef]
- Huang, X.P.; Kong, X.Z.; Chen, Z.Y.; Fang, Q. Peridynamics modelling of dynamic tensile failure in concrete. Int. J. Impact Eng. 2021, 155, 103918. [Google Scholar] [CrossRef]
- Huang, X.P.; Zhu, B.; Chen, Y.M. A coupled peridynamics-smoothed particle hydrodynamics model for fluid-structure interaction with large deformation. Phys. Fluids 2024, 36(11), 117131. [Google Scholar] [CrossRef]
- Huang, X.P.; Zhu, B.; Chen, Y.M. A rate-dependent peridynamic-SPH coupling model for damage and failure analysis of concrete dam structures subjected to underwater explosions. Int. J. Impact Eng. 2025, 200, 105270. [Google Scholar] [CrossRef]
- Li, D.Y.; Han, Z.Y.; Zhu, Q.Q.; Zhang, Y.; Ranjith, P.G. Stress wave propagation and dynamic behavior of red sandstone with single bonded planar joint at various angles. Int. J. Rock Mech. Min. Sci. 2019, 117, 162–170. [Google Scholar] [CrossRef]
- Lin, Q.; Fakhimi, A.; Haggerty, M.; Labuz, J.F. Initiation of tensile and mixed-mode fracture in sandstone. Int. J. Rock Mech. Min. Sci. 2009, 46(3), 489–497. [Google Scholar] [CrossRef]
- Ling, T.L.; Wu, S.F.; Liu, D.S.; Liang, S.F.; Li, C.; Ma, J.H. Determination of Holmquist-Johnson-Cook model parameters for sandstone. J. China Coal Soc. 2018, 43(8), 2211–2216. (in Chinese). [Google Scholar] [CrossRef]
- Liu, K.; Wu, C.Q.; Li, X.B.; Li, Q.Y.; Fang, J.G.; Liu, J. A modified HJC model for improved dynamic response of brittle materials under blasting loads. Comput. Geotech. 2020a, 123, 103584. [Google Scholar] [CrossRef]
- Liu, X.; Kong, X.Z.; Fang, Q.; Meng, Y. Modelling blast wave propagation and failure in concrete induced by internal charge explosion by coupled peridynamics and smoothed particle hydrodynamics. Int. J. Impact Eng. 2025, 201, 105268. [Google Scholar] [CrossRef]
- Liu, Z.M.; Bie, Y.H.; Cui, Z.Q.; Cui, X.Y. Ordinary state-based peridynamics for nonlinear hardening plastic materials' deformation and its fracture process. Eng. Fract. Mech. 2020b, 223, 106782. [Google Scholar] [CrossRef]
- Lu, C.P.; Dou, L.M.; Wu, X.R.; Xie, Y.S. Case study of blast-induced shock wave propagation in coal and rock. Int. J. Rock Mech. Min. Sci. 2010, 47(6), 1046–1054. [Google Scholar] [CrossRef]
- Madenci, E.; Oterkus, S. Ordinary state-based peridynamics for plastic deformation according to von Mises yield criteria with isotropic hardening. J. Mech. Phys. Solids 2016, 86, 192–219. [Google Scholar] [CrossRef]
- Meng, Z.F.; Wang, P.P.; Zhang, A.M.; Ming, F.R.; Sun, P.N. A multiphase SPH model based on Roe’s approximate Riemann solver for hydraulic flows with complex interface. Comput. Meth. Appl. Mech. Eng. 2020, 365, 112999. [Google Scholar] [CrossRef]
- Parshikov, A.N.; Medin, S.A. Smoothed particle hydrodynamics using interparticle contact algorithms. J. Comput. Phys. 2002, 180(1), 358–382. [Google Scholar] [CrossRef]
- Quentrec, B.; Brot, C. New method for searching for neighbors in molecular dynamics computations. J. Comput. Phys. 1973, 13(3), 430–432. [Google Scholar] [CrossRef]
- Shen, W.L.; Shi, G.C.; Wang, Y.G.; Bai, J.B.; Zhang, R.F.; Wang, X.Y. Tomography of the dynamic stress coefficient for stress wave prediction in sedimentary rock layer under the mining additional stress. Int. J. Min. Sci. Technol. 2021, 31(4), 653–663. [Google Scholar] [CrossRef]
- Shi, H.T.; Yuan, G.Y.; Ni, B.Y.; Zhang, L.W. Quasi-brittle ice breaking mechanisms by high-velocity water jet impacts: An investigation based on PD-SPH coupling model and experiments. J. Mech. Phys. Solids 2024, 191, 105783. [Google Scholar] [CrossRef]
- Silling, S.A. Reformulation of elasticity theory for discontinuities and long-range forces. J. Mech. Phys. Solids 2000, 48(1), 175–209. [Google Scholar] [CrossRef]
- Silling, S.A.; Epton, M.; Weckner, O.; Xu, J.F.; Askari, E. Peridynamic states and constitutive modeling. J. Elast. 2007, 88(2), 151–184. [Google Scholar] [CrossRef]
- Sun, G.; Wang, J.X.; Tang, S.; Zhang, Z.R.; Guo, L.J. A dynamic damage constitutive model and three-dimensional internal crack propagation of rock-like materials in bond-based peridynamic. Theor. Appl. Fract. Mech. 2024, 130, 104320. [Google Scholar] [CrossRef]
- Sun, G.; Wang, J.X.; Tian, J.R.; Han, R.B.; Ba, J.L.; Wang, H.; Yu, H.Y. Dynamic mechanical behaviors and cracking mechanisms of non-straight flaws in tuff. Int. J. Mech. Sci. 2025, 295, 110303. [Google Scholar] [CrossRef]
- Tian, L.Y.; Xu, X.Y. An improved SPH method for simulating near-surface underwater explosions in shallow water. Eur. J. Mech. B. Fluids 2026, 116, 204420. [Google Scholar] [CrossRef]
- Wang, J.X.; Sun, G.; Tang, S.; Wu, J.X.; Yu, H.Y. A dynamic damage constitutive model and crack propagation characteristics of heterogeneous rocks in uni-bond dual-parameter peridynamics. Comput. Geotech. 2025a, 178, 106940. [Google Scholar] [CrossRef]
- Wang, P.P.; Meng, Z.F.; Zhang, A.M.; Ming, F.R.; Sun, P.N. Improved particle shifting technology and optimized free-surface detection method for free-surface flows in smoothed particle hydrodynamics. Comput. Meth. Appl. Mech. Eng. 2019, 357, 112580. [Google Scholar] [CrossRef]
- Wang, P.P.; Zhang, A.M.; Fang, X.L.; Khayyer, A.; Meng, Z.F. Axisymmetric Riemann-smoothed particle hydrodynamics modeling of high-pressure bubble dynamics with a simple shifting scheme. Phys. Fluids 2022, 34(11), 112122. [Google Scholar] [CrossRef]
- Wang, S.Y.; Wang, L.J.; Wang, Y.T.; Liu, F.R.; Zhao, L.B. A rate-dependent elastoplastic ordinary state-based peridynamic model for concrete under impact loading. Int. J. Plast. 2025b, 193, 104427. [Google Scholar] [CrossRef]
- Wu, H.; Zhang, Y.; Cheng, Y.H.; Cen, G.H. Design of rock-rubble concrete shield against the combination of penetration and explosion of warheads. Explos. Shock Waves 2025, 45(4), 043302. (in Chinese). [Google Scholar] [CrossRef]
- Wu, L.W.; Huang, D. Peridynamic modeling and simulations on concrete dynamic failure and penetration subjected to impact loadings. Eng. Fract. Mech. 2022, 259, 108135. [Google Scholar] [CrossRef]
- Xie, L.X.; Lu, W.B.; Zhang, Q.B.; Jiang, Q.H.; Chen, M.; Zhao, J. Analysis of damage mechanisms and optimization of cut blasting design under high in-situ stresses. Tunn. Undergr. Space Technol. 2017, 66, 19–33. [Google Scholar] [CrossRef]
- Xu, J.X.; Wang, J. Node to node contacts for SPH applied to multiple fluids with large density ratio. In Proceedings of the 9th European LS-DYNA Users' Conference, Manchester, UK, 2013. [Google Scholar]
- Xu, X.Y.; Ouyang, J.; Yang, B.X.; Liu, Z.J. SPH simulations of three-dimensional non-Newtonian free surface flows. Comput. Meth. Appl. Mech. Eng. 2013, 256, 101–116. [Google Scholar] [CrossRef]
- Xu, X.Y.; Tian, L.Y.; Sun, Y.J.; Kang, J.N. 2D and 3D SPH simulations of transient non-isothermal viscoelastic injection molding process with complex-shaped cavities. J. Non-Newton. Fluid Mech. 2025, 336, 105377. [Google Scholar] [CrossRef]
- Yan, Z.L.; Dai, F.; Liu, Y.; Du, H.B.; Luo, J. Dynamic strength and cracking behaviors of single-flawed rock subjected to coupled static-dynamic compression. Rock Mech. Rock Eng. 2020, 53(9), 4289–4298. [Google Scholar] [CrossRef]
- Yang, C.Y.; Zhu, F.; Zhao, J.D. A multi-horizon fully coupled thermo-mechanical peridynamics. J. Mech. Phys. Solids 2024, 191, 105758. [Google Scholar] [CrossRef]
- Yang, S.Q.; Yang, Z.; Zhang, P.C.; Tian, W.L. Experiment and peridynamic simulation on cracking behavior of red sandstone containing a single non-straight fissure under uniaxial compression. Theor. Appl. Fract. Mech. 2020, 108, 102637. [Google Scholar] [CrossRef]
- Yao, X.H.; Huang, D. Coupled PD-SPH modeling for fluid-structure interaction problems with large deformation and fracturing. Comput. Struct. 2022, 270, 106847. [Google Scholar] [CrossRef]
- Zhang, H.; Huang, D.; Zhang, X. Peridynamic modeling of elastic-plastic ductile fracture. Comput. Meth. Appl. Mech. Eng. 2024, 418, 116560. [Google Scholar] [CrossRef]
- Zhang, L.M.; Ning, Z.G.; Miao, S.J.; Feng, Z.M.; Sun, J.L.; Cai, M.F.; Xi, X. Experimental and numerical investigations on the mixed-mode fracture of granite under offset three-point bending loads. Rock Mech. Rock Eng. 2026, 59(1), 1223–1251. [Google Scholar] [CrossRef]
- Zhang, Q.B.; Zhao, J. A review of dynamic experimental techniques and mechanical behaviour of rock materials. Rock Mech. Rock Eng. 2014, 47(4), 1411–1478. [Google Scholar] [CrossRef]
- Zhang, Z.X.; Chi, L.Y.; Qiao, Y.; Hou, D.F. Fracture initiation, gas ejection, and strain waves measured on specimen surfaces in model rock blasting. Rock Mech. Rock Eng. 2021, 54(2), 647–663. [Google Scholar] [CrossRef]
- Zheng, J.W.; Wang, J.; Lu, Y.; Gu, X.; Pastor, M.; Tayyebi, S.M.; Chen, Y.J. A multiresolution smoothed particle hydrodynamics-peridynamics coupling framework for fluid-structure interaction. Phys. Fluids 2026, 38(7), 073327. [Google Scholar] [CrossRef]
- Zhou, X.P.; Zhang, T.; Qian, Q.H. A two-dimensional ordinary state-based peridynamic model for plastic deformation based on Drucker-Prager criteria with non-associated flow rule. Int. J. Rock Mech. Min. Sci. 2021, 146, 104857. [Google Scholar] [CrossRef]
- Zhou, Y.W.; Wang, W.; Liu, J.N.; Ouyang, X.; Liu, J. Static and dynamic mechanical tests and numerical simulation on the Holmquist-Johnson-Cook constitutive model for red sandstone. Explos. Shock Waves 2026, 46(8), 083102. (in Chinese). [Google Scholar] [CrossRef]
- Zhu, F.; Zhao, J.D. Modeling continuous grain crushing in granular media: A hybrid peridynamics and physics engine approach. Comput. Meth. Appl. Mech. Eng. 2019, 348, 334–355. [Google Scholar] [CrossRef]
- Zhu, F.; Zhao, J.D. Peridynamic modelling of blasting induced rock fractures. J. Mech. Phys. Solids 2021, 153, 104469. [Google Scholar] [CrossRef]
- Zhu, F.J.; Liu, H.Y.; Yao, L.H.; Mei, G. Stress field analysis of an infinite plate with a central closed inclined crack under uniaxial compression. Theor. Appl. Fract. Mech. 2021, 116, 103111. [Google Scholar] [CrossRef]
Figure 1.
Neighborhood distribution of material points.
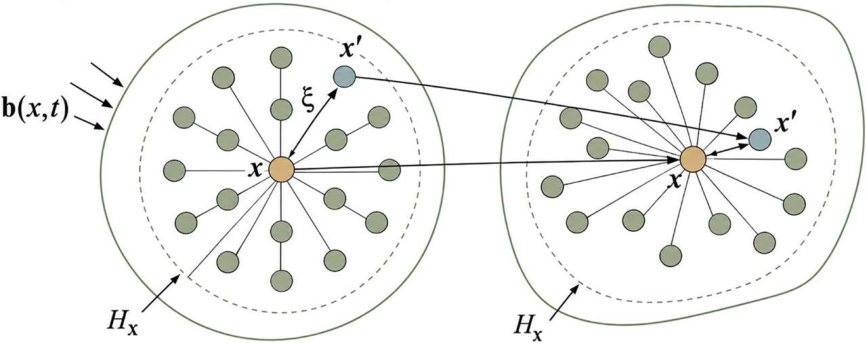
Figure 2.
Comparison of the original (Xie et al., 2017) and modified strain-rate strengthening factors.
Figure 2.
Comparison of the original (Xie et al., 2017) and modified strain-rate strengthening factors.
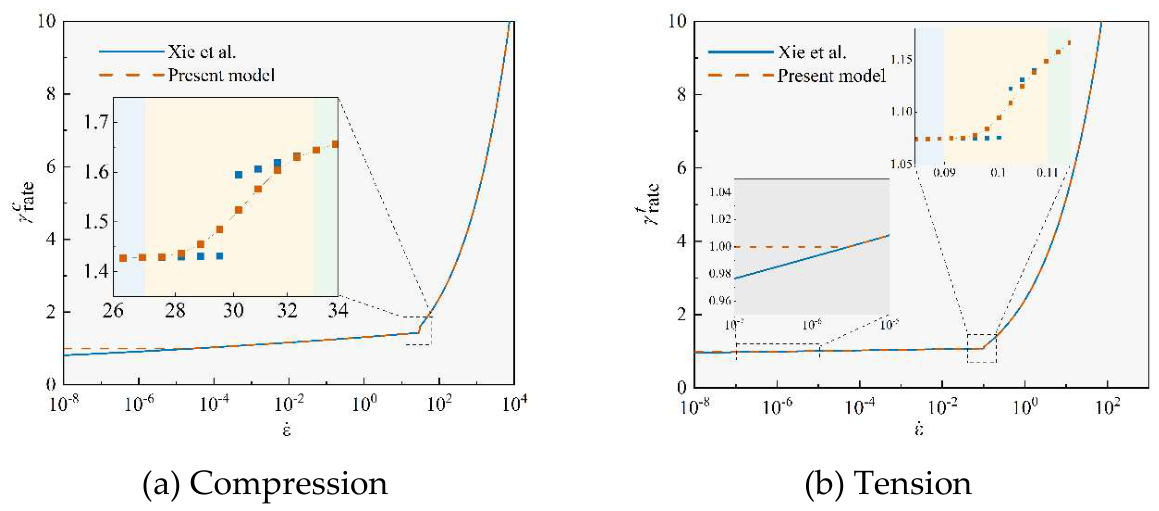
Figure 3.
Flowchart of the constitutive update.
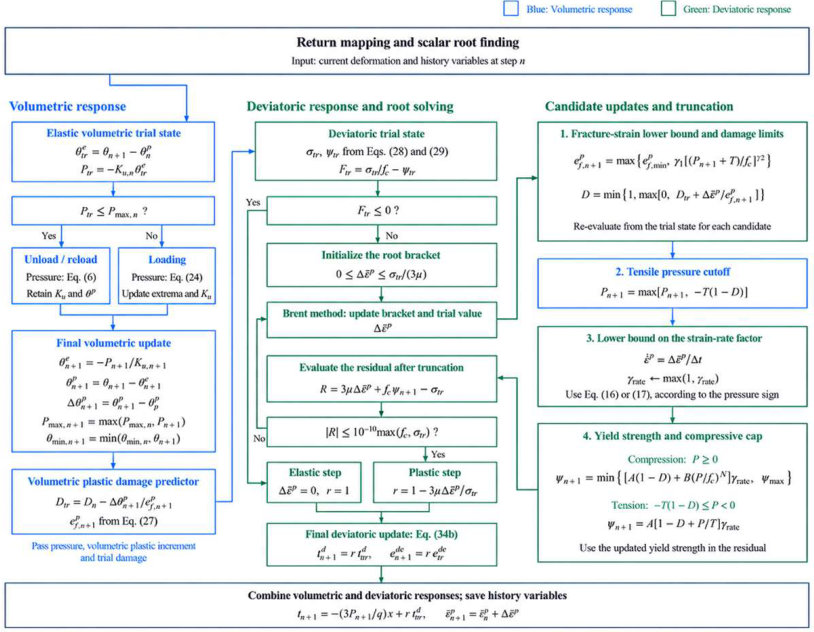
Figure 4.
Riemann SPH.
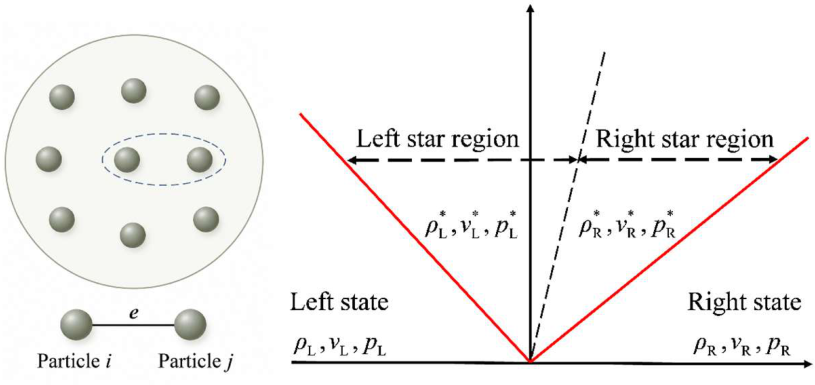
Figure 5.
Computational flow.
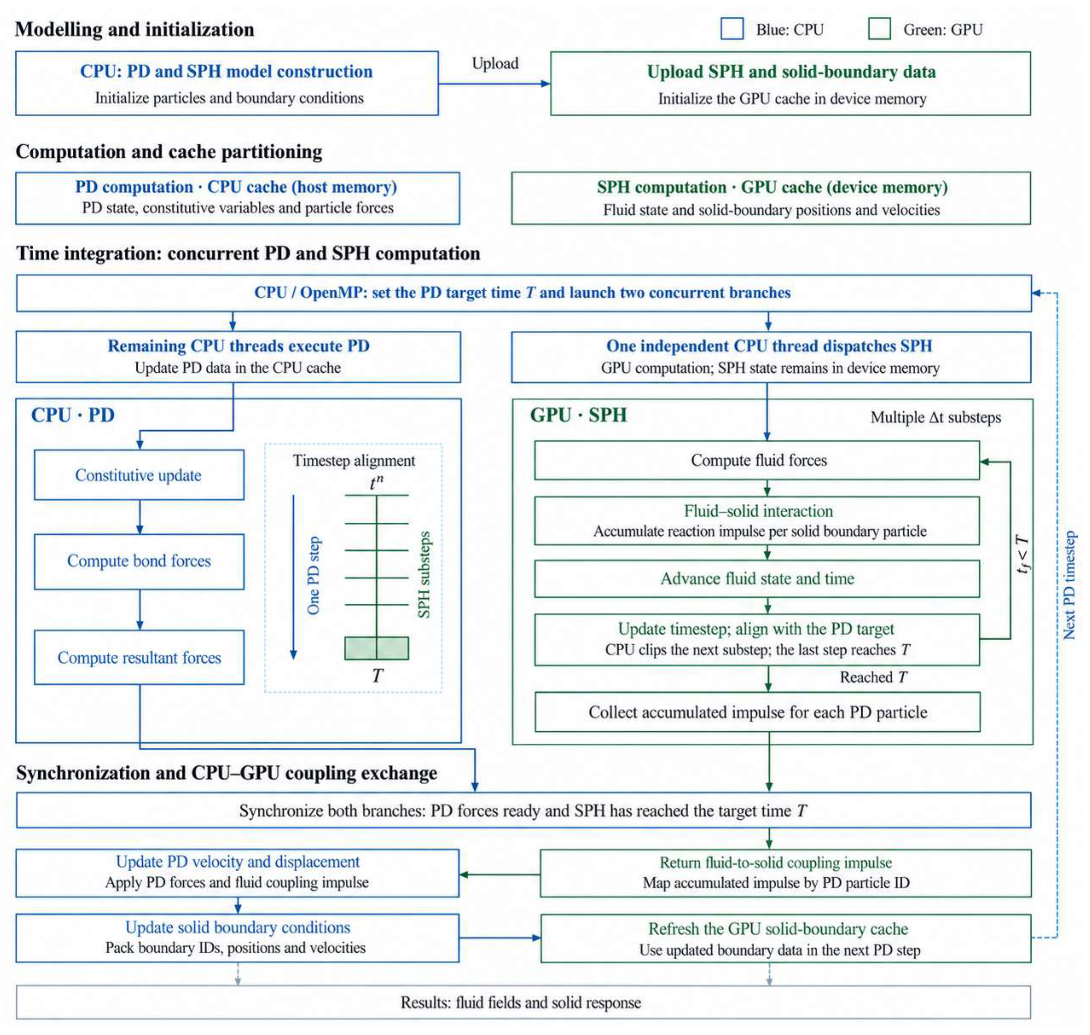
Figure 6.
Interface identification, particle mapping, and force transfer in the SPH-PD framework.
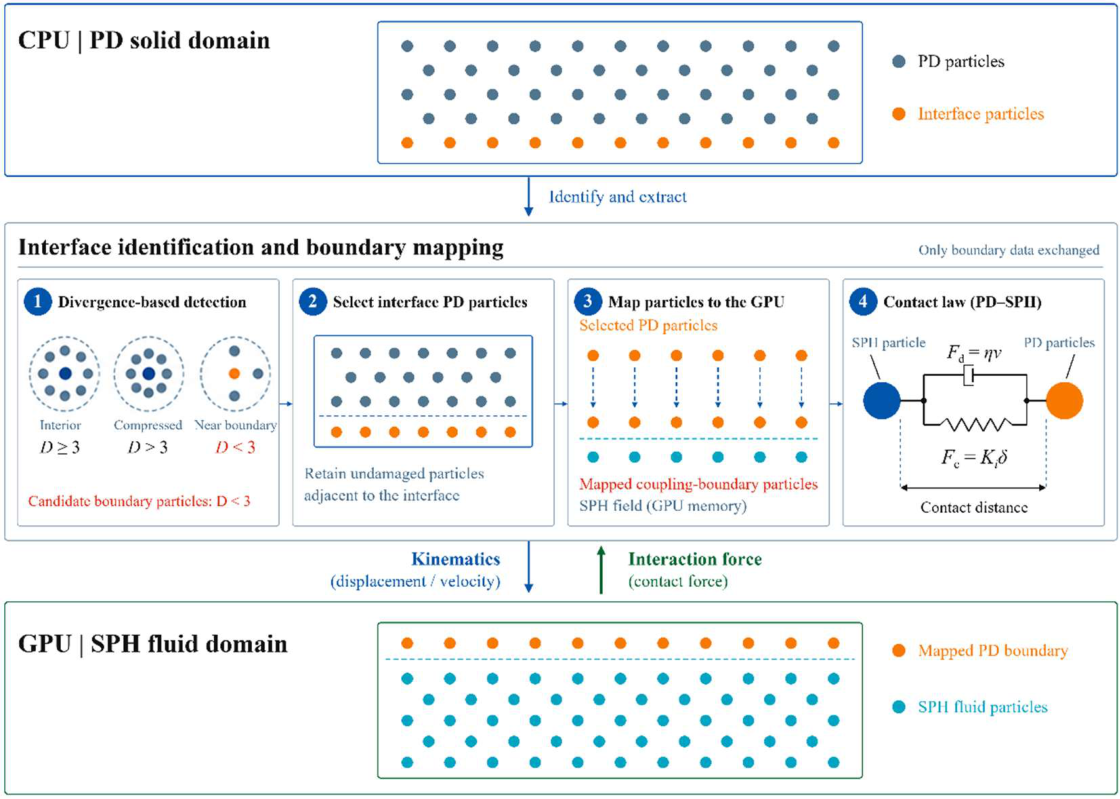
Figure 7.
Three-point bending specimen with a pre-existing notch height H of either 5.65 or 12.23 mm.
Figure 7.
Three-point bending specimen with a pre-existing notch height H of either 5.65 or 12.23 mm.
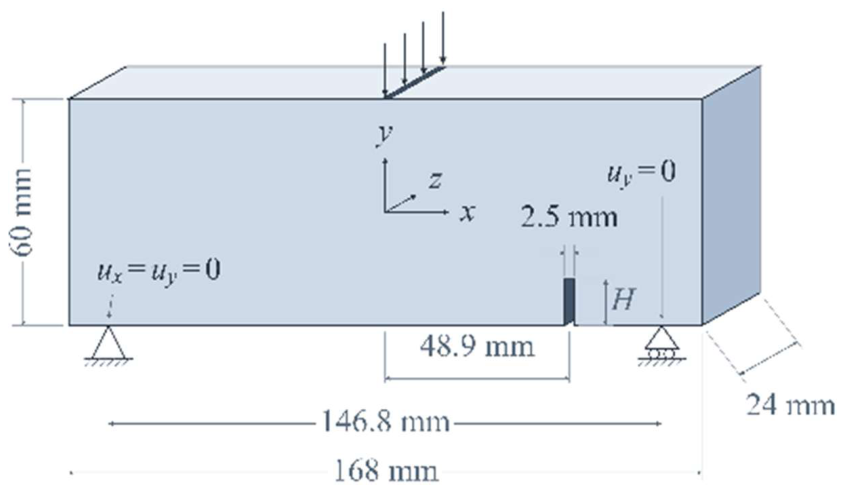
Figure 8.
Comparison of present results with previous numerical (Chen et al., 2019) and experimental (Lin et al., 2009) results.
Figure 8.
Comparison of present results with previous numerical (Chen et al., 2019) and experimental (Lin et al., 2009) results.
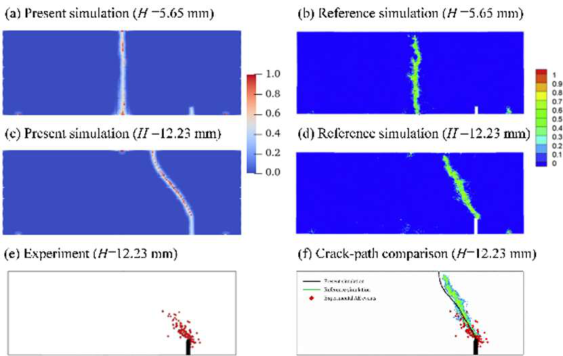
Figure 9.
Hydrostatic pressure P, plastic damage D, and damage at u = 0.1 mm, and final damage at different loading velocities.
Figure 9.
Hydrostatic pressure P, plastic damage D, and damage at u = 0.1 mm, and final damage at different loading velocities.
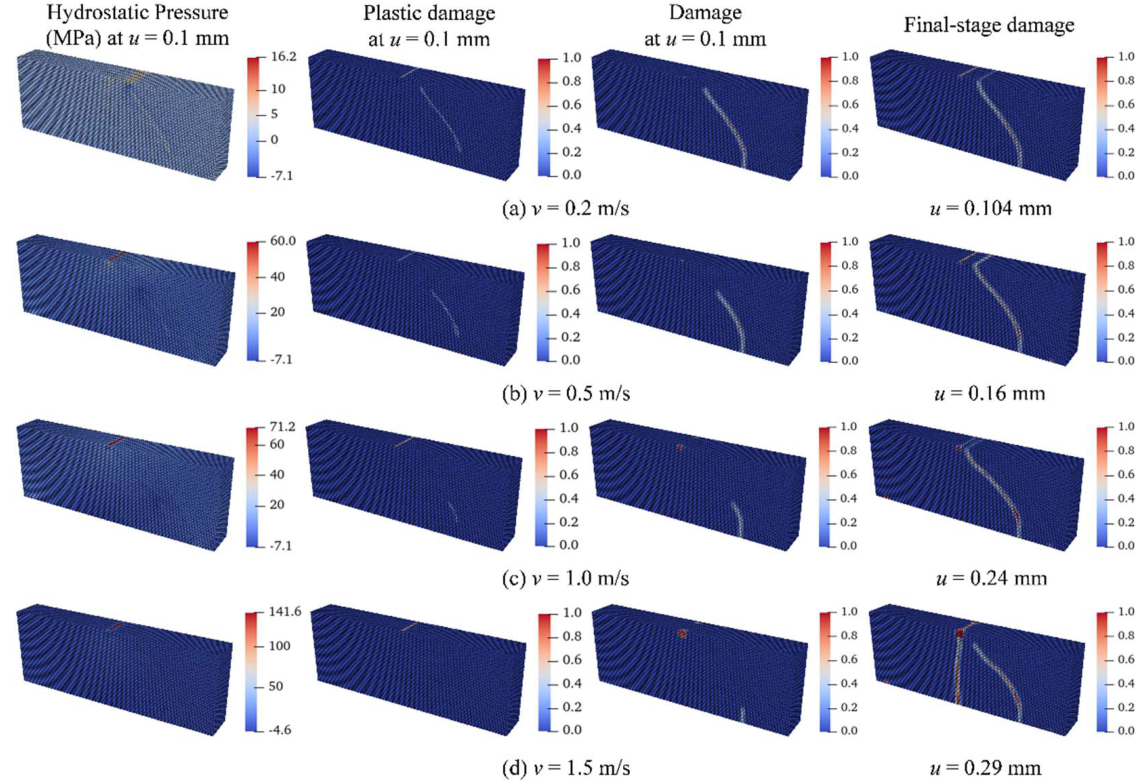
Figure 10.
Evolution of equivalent plastic strain, hydrostatic pressure, and plastic dilatation under different loading velocities.
Figure 10.
Evolution of equivalent plastic strain, hydrostatic pressure, and plastic dilatation under different loading velocities.
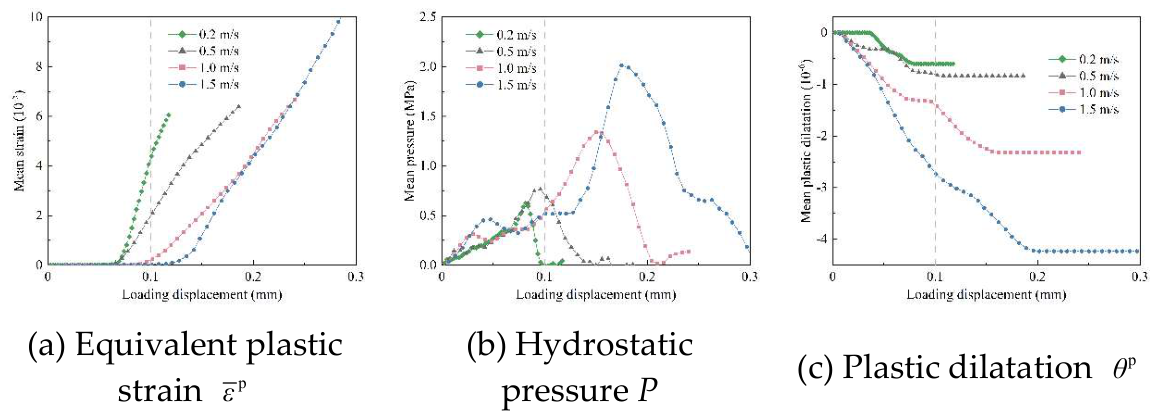
Figure 11.
Geometry of the SHPB test model.

Figure 12.
Comparison of present numerical results with experimental (Yan et al., 2020) results.
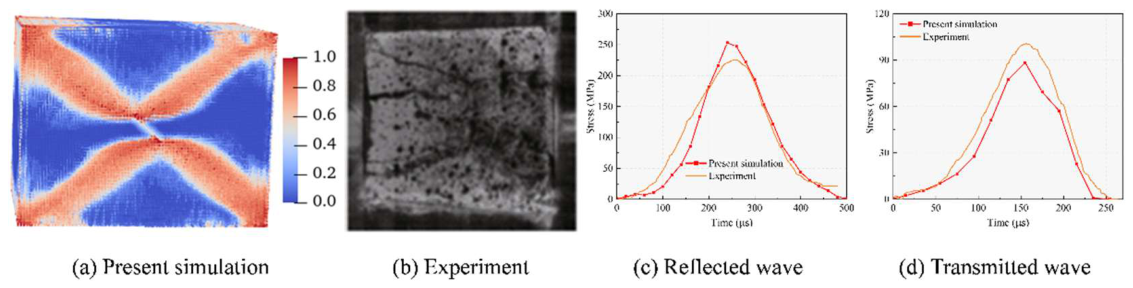
Figure 13.
Field evolution and coordinate systems.
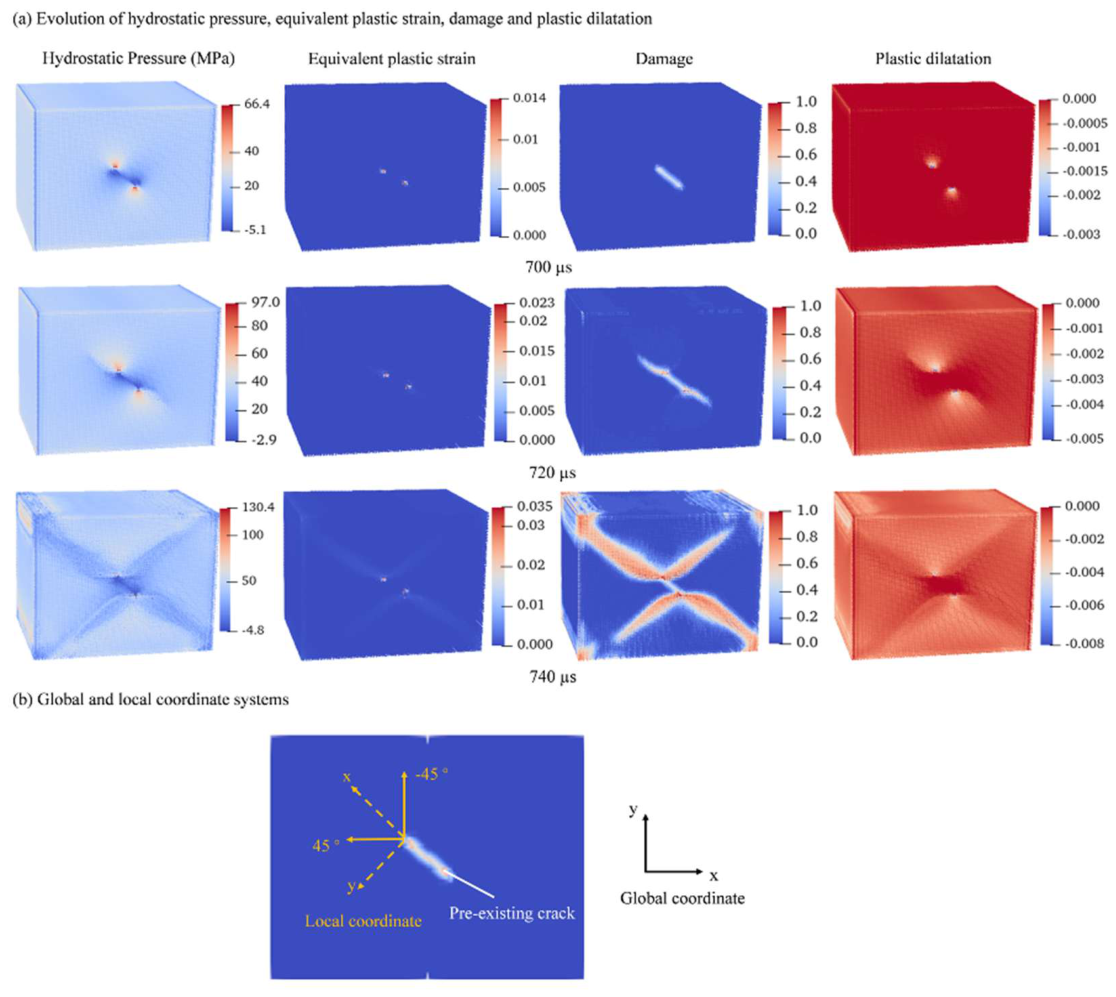
Figure 14.
Numerical model.
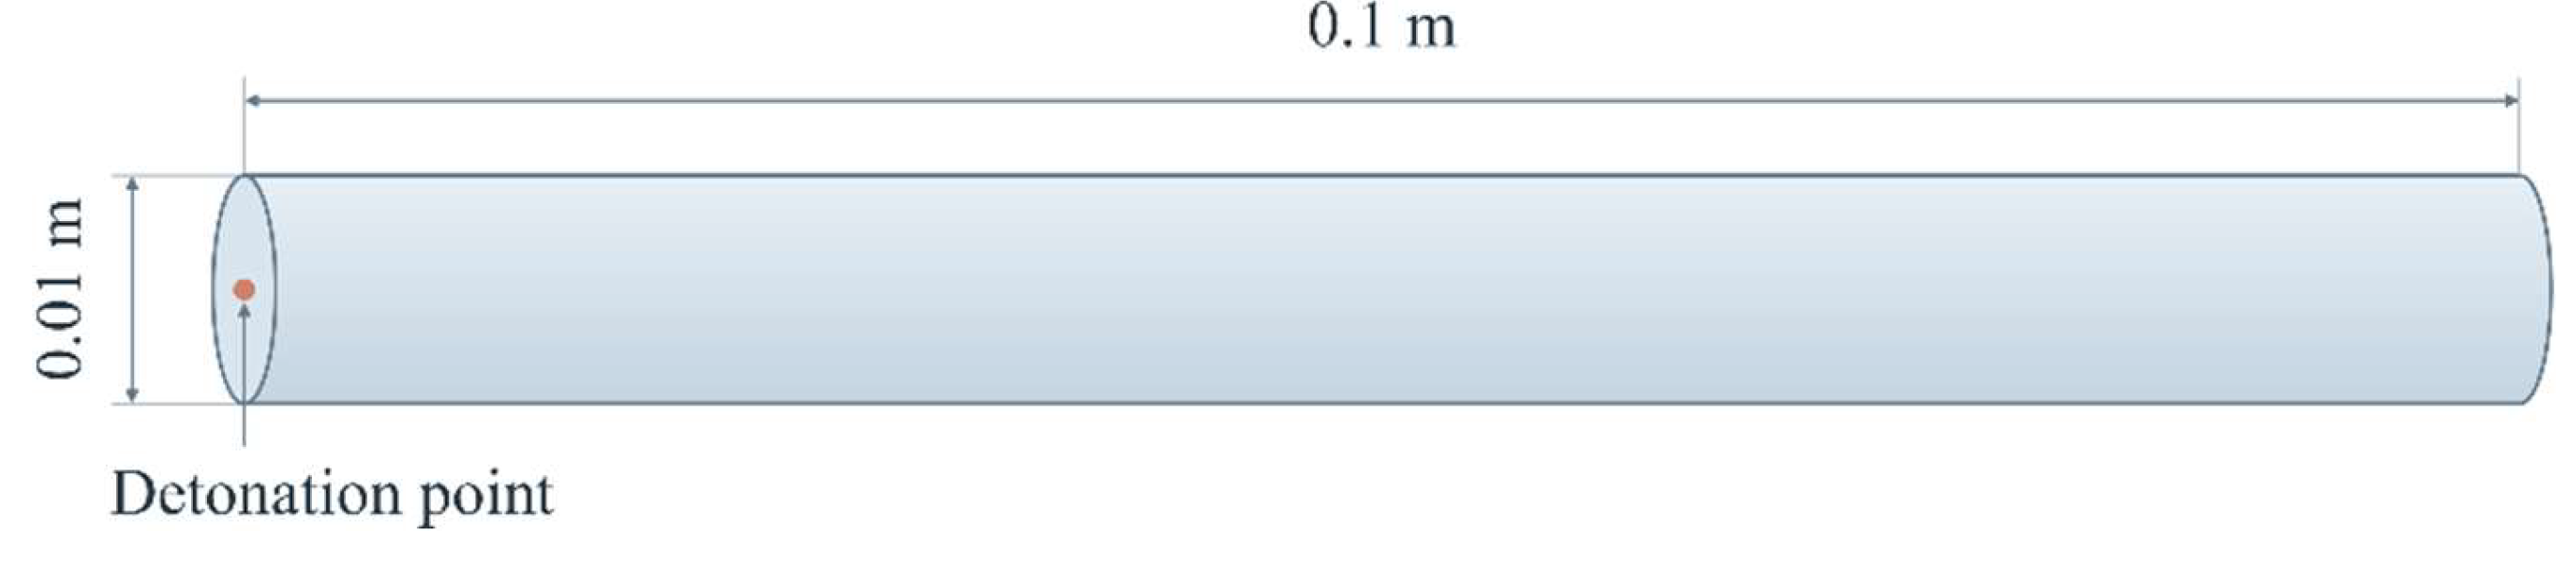
Figure 15.
Comparison with previously reported numerical results (Chen et al., 2020).
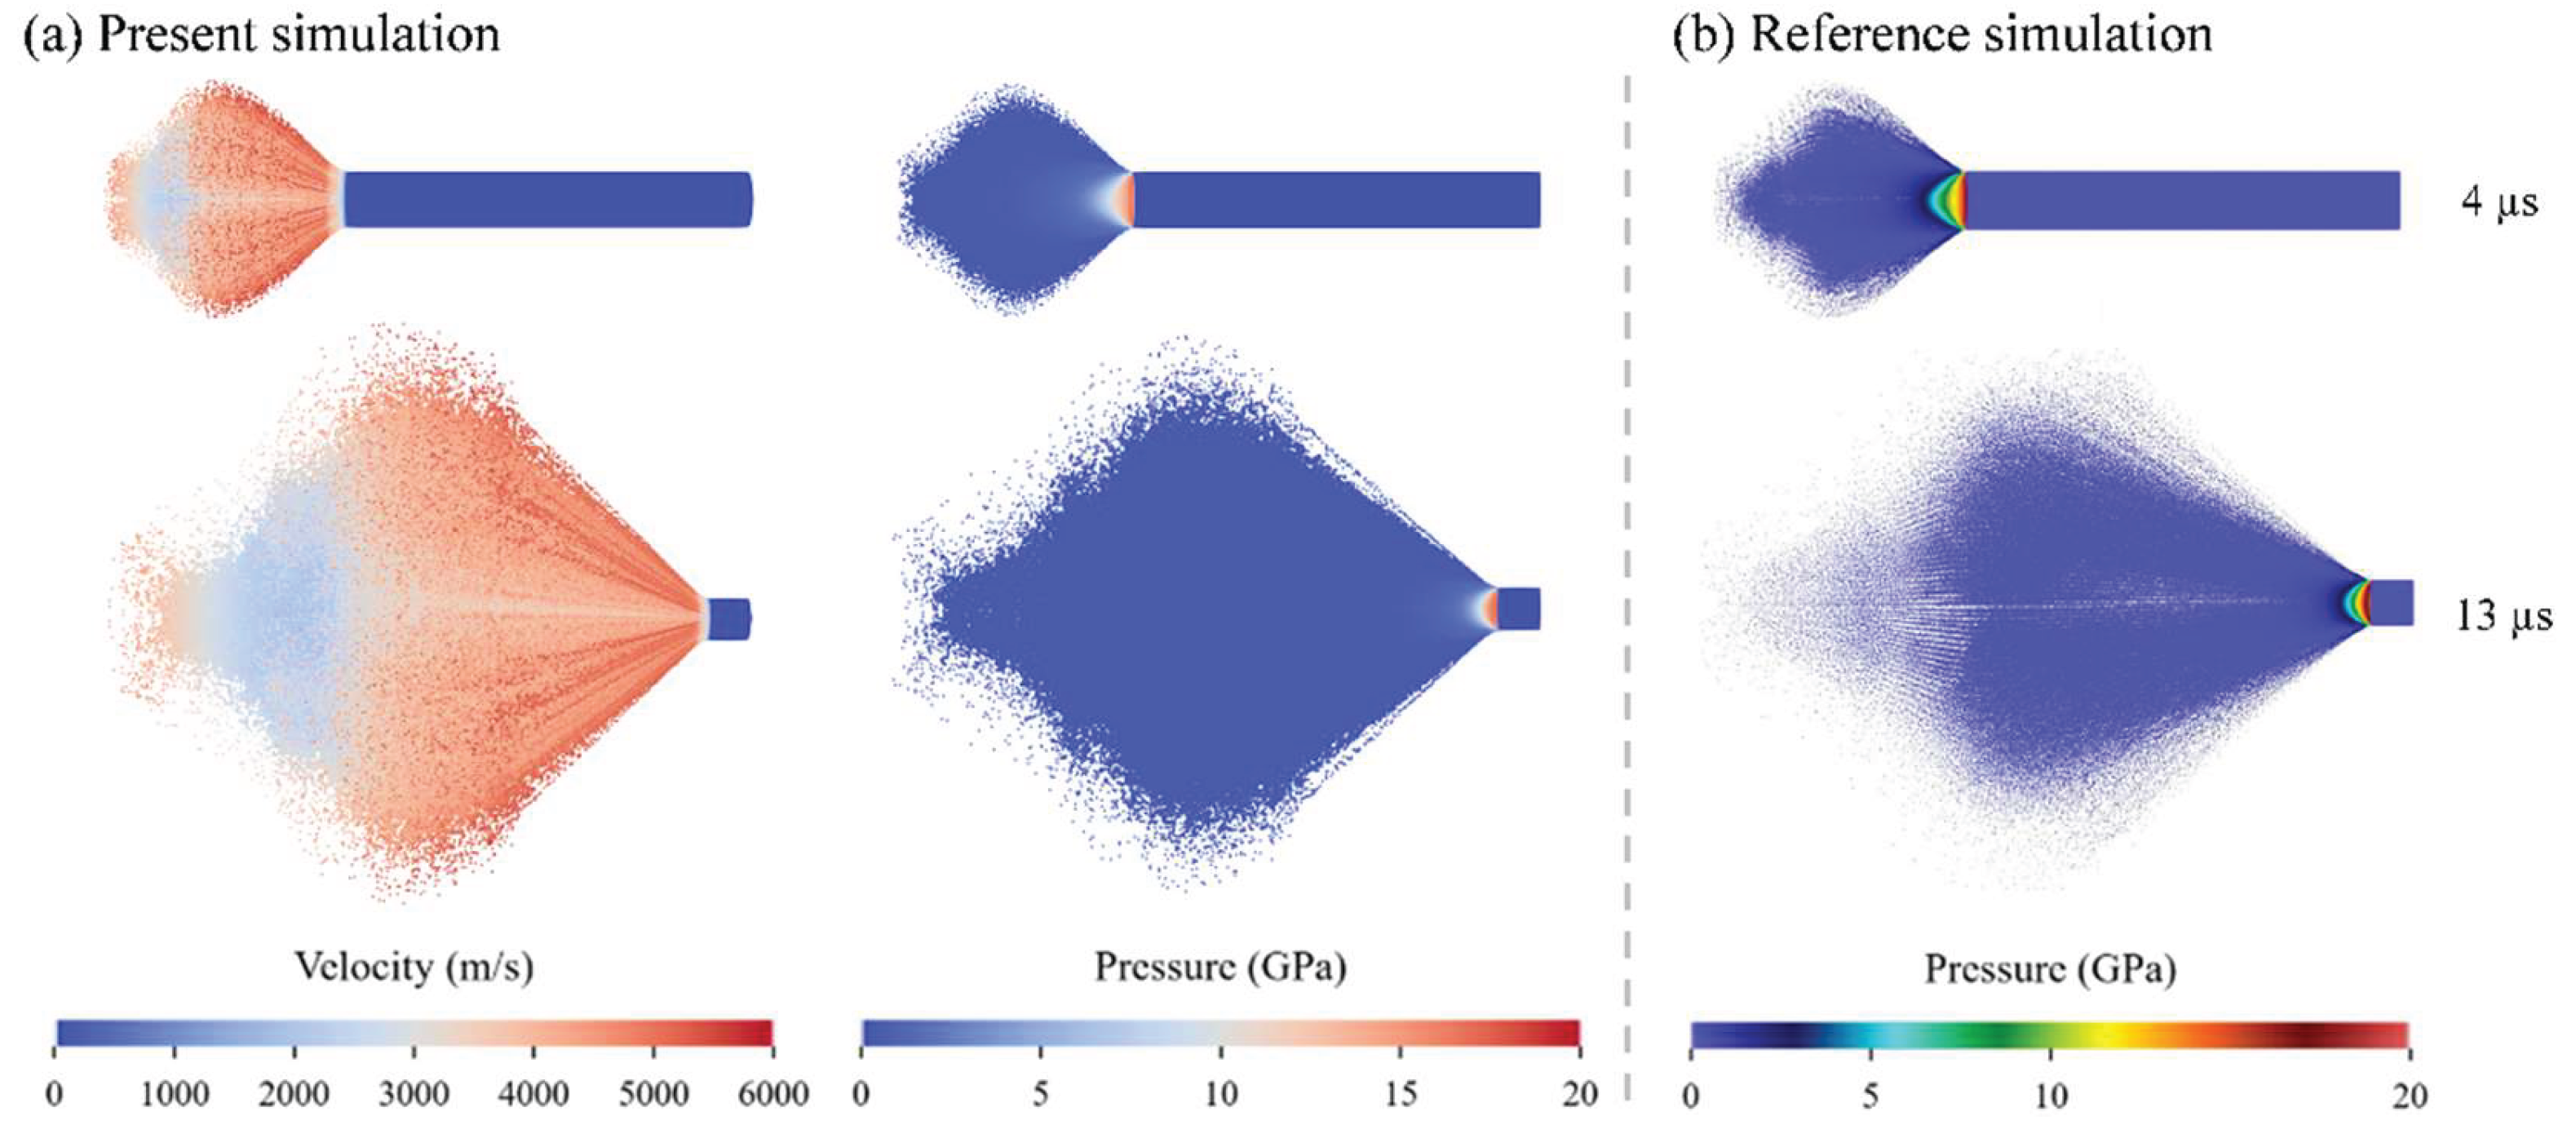
Figure 16.
Comparison of axial pressure distributions at 4 and 13 µs.
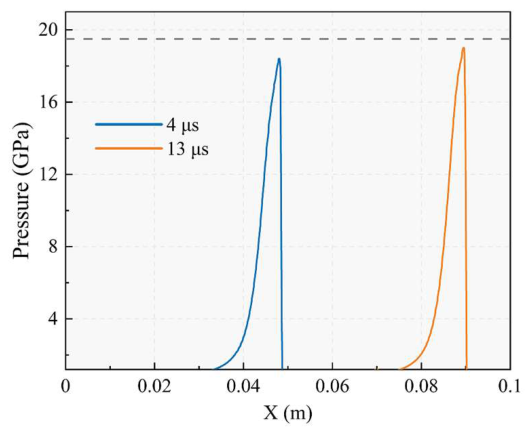
Figure 17.
Numerical model of single-hole rock blasting.
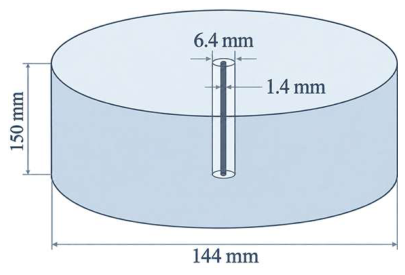
Figure 18.
Comparison of rock damage patterns.
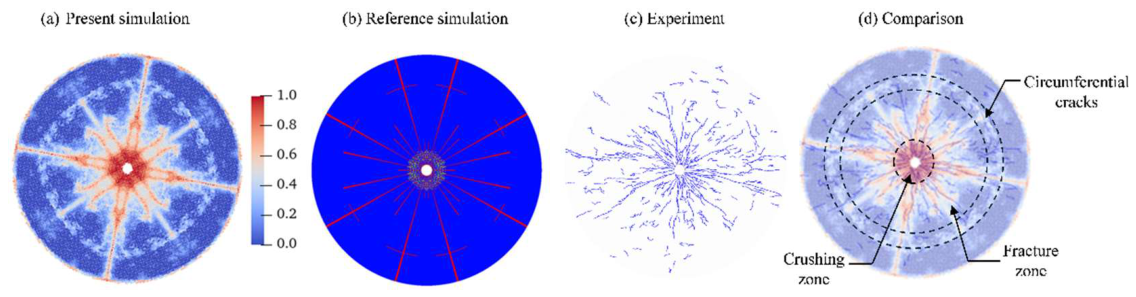
Figure 19.
Comparison of peak radial stress.
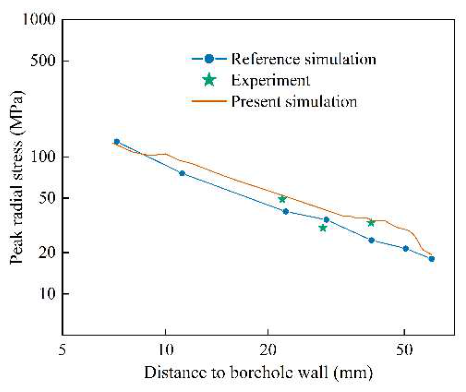
Figure 20.
Evolution of equivalent plastic strain, hydrostatic pressure, dilatation, and plastic dilatation.
Figure 20.
Evolution of equivalent plastic strain, hydrostatic pressure, dilatation, and plastic dilatation.
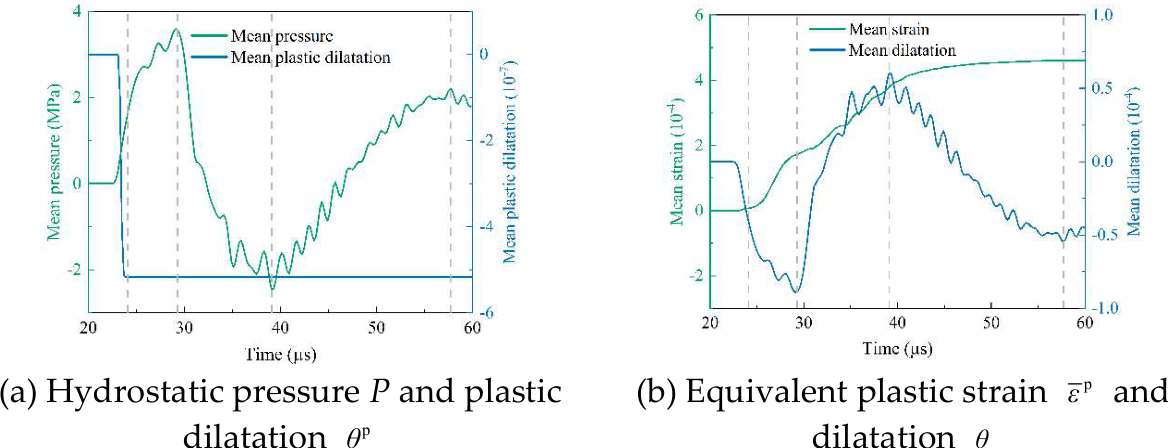
Figure 21.
Evolution of damage, plastic damage, and hydrostatic pressure.
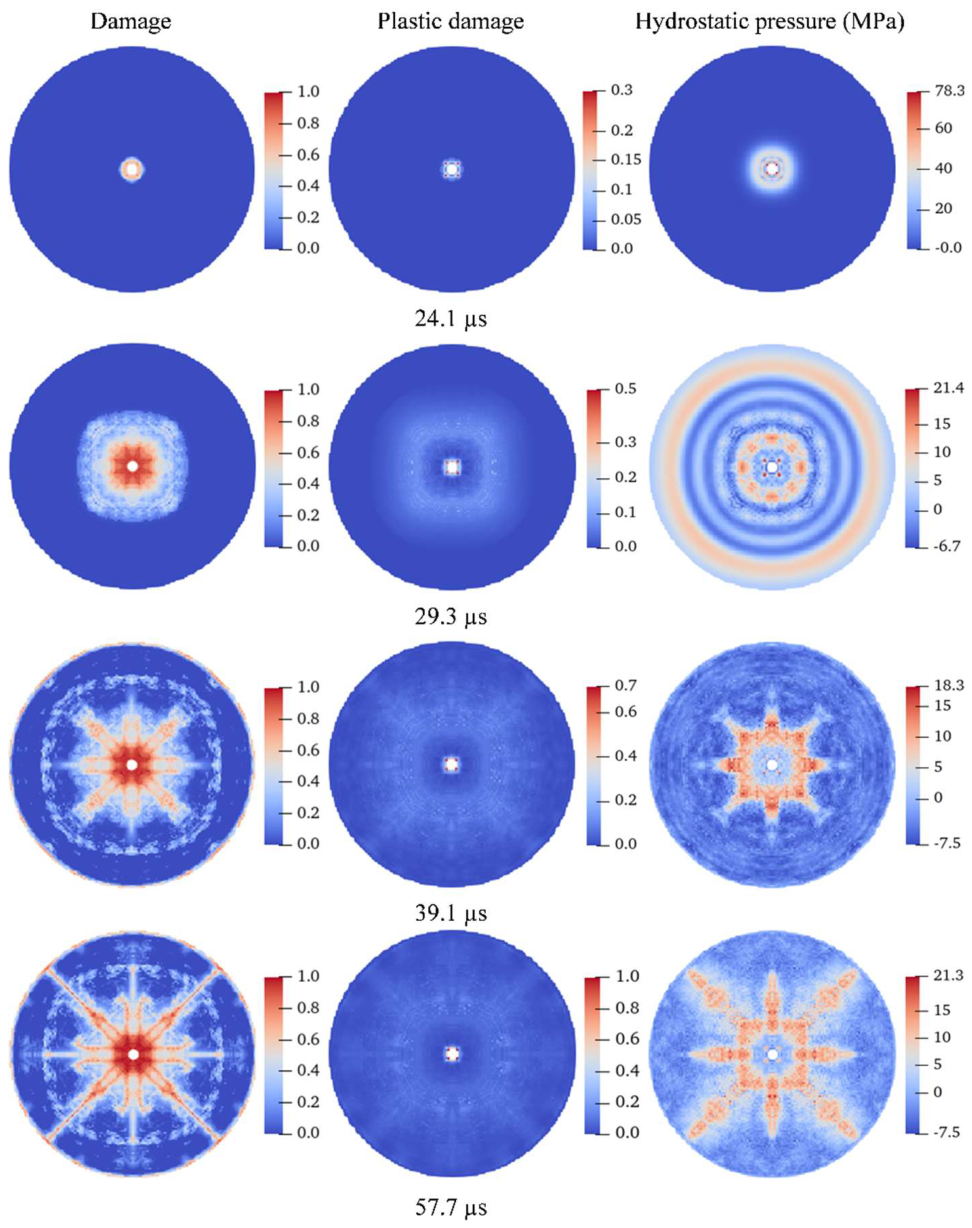

Table 1.
CPU-GPU utilization and runtime for different SPH particle counts.
| PD particle count | SPH particle count | Mean CPU utilization (%) | Mean GPU utilization (%) | Runtime (s) |
| 813,000 | 13,000 | 88 | 14 | 46.18 |
| 813,000 | 46,920 | 87 | 25 | 46.45 |
| 813,000 | 104,000 | 87 | 77 | 47.04 |
| 813,000 | 135,656 | 74 | 90 | 54.21 |
| 813,000 | 197,500 | 44 | 95 | 86.35 |
Disclaimer/Publisher’s Note: The statements, opinions and data contained in all publications are solely those of the individual author(s) and contributor(s) and not of MDPI and/or the editor(s). MDPI and/or the editor(s) disclaim responsibility for any injury to people or property resulting from any ideas, methods, instructions or products referred to in the content. |
© 2026 by the authors. Licensee MDPI, Basel, Switzerland. This article is an open access article distributed under the terms and conditions of the Creative Commons Attribution (CC BY) license.
Copyright: This open access article is published under a Creative Commons CC BY 4.0 license, which permit the free download, distribution, and reuse, provided that the author and preprint are cited in any reuse.