
Submitted:
10 November 2026
Posted:
11 November 2026
You are already at the latest version
Abstract
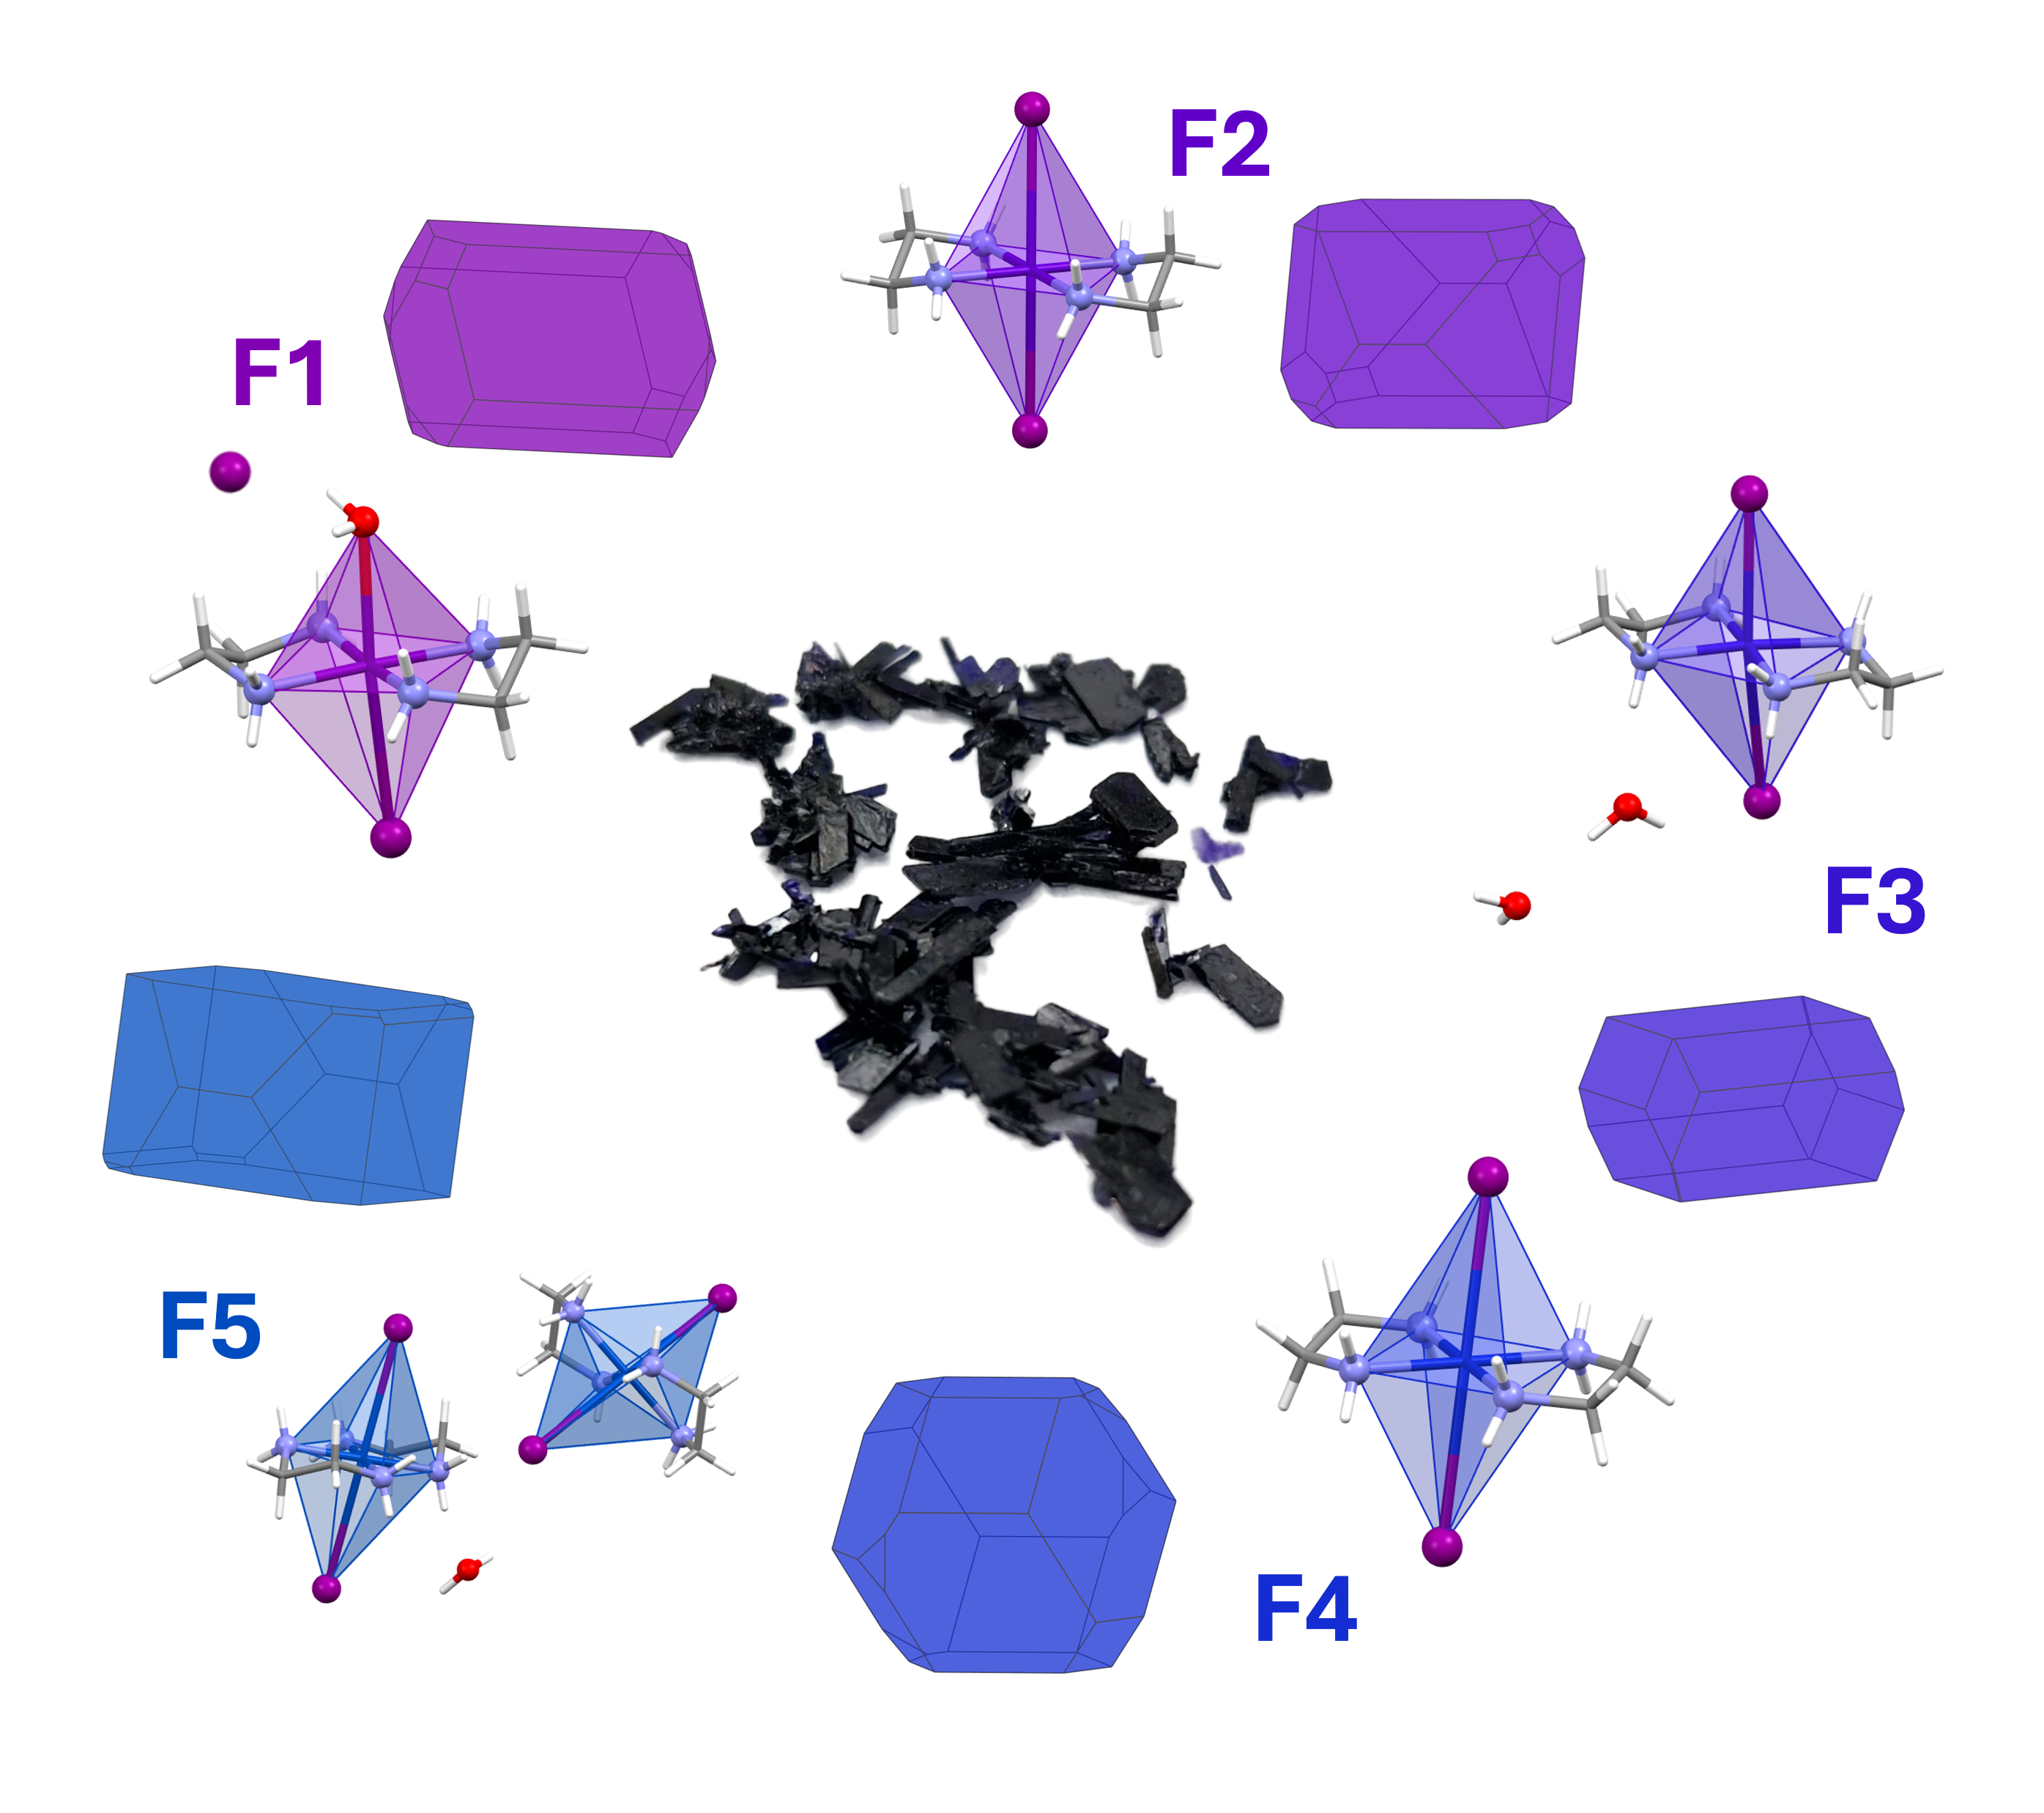
Five new crystalline phases from coordination compounds containing copper(II) ethylenediamine and iodine (F1-F5) were obtained and identified by Single Crystal X-Ray Diffraction (SCXRD). The compounds present a coordination environment where the four nitrogen atoms are located in a square planar geometry and two apical positions complete an octahedron with different degrees of distortion from the ideal geometry. These two opposite vertices are occupied by one iodide and one water molecule in F1 or two iodide ligands in F2-F5. The compounds can easily be synthesized and undergo several transformations that were monitored and studied. A comparative study of the crystal packing was performed to understand the stability of the different phases.
Keywords:
SCXRD
; Cu(II) coordination compounds
; ethylenediamine
; solid state
; crystal structure
; phase transition
; topology
1. Introduction
Copper(II) diamine complexes are coordination compounds that have showed interesting physical and chemical properties and have been explored as chemotherapy drugs [1], catalysts [2], flame retardants and resin hardeners [3], among others. Although some of these applications occur in solution, the arrangement in the solid state is key to explain the chemical behaviour and stability of the compounds. However, structural data from their crystalline phases and their transformations are scarce.
The reaction of copper(II) acetate, ethylenediamine (en) and potassium iodide had been reported by Baker [4], who described the obtention of a single phase of the ionic compound [Cu(en)2(H2O)2]I2 in the shape of fine violet crystals appearing either by cooling the solution or by adding ethanol as an antisolvent. However, the structure for that compound was neither included in the article nor reported afterwards. After repeating the experimental procedure, we characterized the resulting solids finding that they did not contain the reported species, and that the compounds present in them were strongly dependent on the obtention conditions.
2. Materials and Methods
All reagents used in the syntheses were obtained from the following suppliers: ethylenediamine (99%) and copper(II) acetate monohydrate (99.99%) from Sigma Aldrich; ethanol (≥99.9%) from Scharlau and potassium iodide (≥99.5%) from Honeywell. Ultrapure water was obtained from a Milli-Q system (Milli-Q Type I H₂O, 18.2 MΩ × cm).
Elemental Analyses (EA) were made with a LECO CHNS-932 elemental analyzer (Eltra); Fourier Transform Infrarred (FTIR) spectra were recorded using a PerkinElmer 100 spectrophotometer with ATR sampling; Powder X-ray Diffraction (PXRD) measurements were carried out using a Rigaku Miniflex 600 diffractometer with a copper X-ray source set to a power of 600 W. Mechanical grinding was made with an Ultra-Turrax IKA ball mill. The crystal structures for F1-F5 were solved by SCXRD using a XtaLAB Synergy S diffractometer equipped with a Mo microsource and a HyPix detector. Details about the crystal structure solution are collected in section S1 in the Supplementary Material. Data have been deposited in the CSD with reference numbers 2375969 (F1), 2375970 (F2), 2498843 (F3), 2577707 (F4) and 2583812 (F5).
2.1. Obtention of the Crystalline Phases F1-F5
The procedure described by Baker [4] was initially performed, and the five crystalline phases were obtained as follows. All the bulk solids were characterized by EA, FTIR and PXRD.
2.2. Obtention of F1, [Cu(en)2(H2O)I]I
In a 50 mL flask, 1.9180 g (9.5 mmol) of copper acetate monohydrate and 2.0 mL (1.8 g, 30 mmol) of ethylenediamine were added at room temperature observing an immediate colour change in the solution from the initial blue to purple and a spontaneous rise in temperature. Meanwhile, 4.2027 g (25 mmol) of potassium iodide were dissolved in 3 mL of water. After dissolved, it was added to the reaction flask. When all the solids were completely dissolved the reaction temperature was raised to 60 °C under constant stirring. As soon as this temperature was reached, the mixture was filtered whilst hot and the solution placed in an ice bath. After 15 minutes, a solid (Sol 1) crystallized as dark purple-violet pleochroic prisms and was separated from the solution by filtration under vacuum. A suitable single crystal was isolated to solve the structure of F1 by SCXRD, (Section S1.1). The presence of F1 as the only crystal phase in the bulk solid was confirmed both by EA (Table S32) and by PXRD analysis (Figure S22).
2.3. Obtention of F2, [Cu(en)2I2] · EtOH
The mother liquor obtained after filtering Sol 1 was transferred to a flask, and 8 mL of ethanol added dropwise. After the addition of the antisolvent, a crystalline precipitate was formed. This solid (Sol 2) was filtered under vacuum, yielding F2 as small pink-violet dichroic thin needles, rhombohedral plates and small prisms together with ribbon-shaped crystals of F1. The crystal structure of F2 was solved by SCXRD (Section S1.2). PXRD analysis of Sol 2 confirmed that it consisted of a mixture of F1 and F2 (Figure S23).
2.4. Obtention of F3, [Cu(en)2I]I · 2H2O
Once Sol 2 was separated from the mixture, the remaining solution was left to crystallize. After 24h, large aggregates of prismatic crystals from F1 could be seen at the bottom of the flask, together with smaller dark purple-violet pleochroic prisms from two new solid phases (F3 and F5). The crystal structure of F3 was solved by SCXRD (Section S1.3). PXRD analysis was carried out on Sol 3, revealing that it consisted of a mixture of phases, being F1 and F5 more prevalent (Figure S24A).
2.5. Obtention of F4, [Cu(en)2I2]
To obtain F4 two different physical procedures were carried out, starting from any of the previously obtained crystalline phases (F1, F2, F3 or F5). The first of them involved the heating of the solids on a hotplate at 120 °C for 72 hours. During this period, a phase transformation occurred, changing the initial larger single crystals into a polycrystalline solid. After analyzing one of these smaller crystals by SCXRD, the structure for F4 was obtained (Section S1.4). PXRD and EA was carried out on the different solids after heating, confirming the complete transformation to F4 (Figure S25 and table S32).
The second method involved the physical grinding of F1, F2, F3 or F5. This transformation was first obtained by manual grinding of a small amount of Sol 1 (approximately 200 mg) in an agate mortar for five minutes. PXRD was carried out and it was proved that the solid changed to yield F4 (Figure S26). To standardize this process, the grinding was also performed using a ball mill for 10 minutes at maximum power. This procedure was applied to F1, F2, F3 and F5 yielding F4 (Figure S27).
2.6. Obtention of F5, [Cu(en)2I2] · 0.5H2O
Although phase F5 had appeared previously in small quantities as small crystals by slow evaporation of the mother liquor together with F1 and F3, it was found to be spontaneously formed from crystals corresponding to any of the other phases left in ambient conditions in the presence of atmospheric water. The crystal structure of F5 was solved by SCXRD (Section S1.5). This transformation was observed in thin platelets of F2 as soon as 48 hours, although it logically took a longer time (up to 1 month) for bulkier crystals from F1. It was monitored both in a portion of Sol 3 stored in a closed vial which still contained small traces of water from the recrystallisation, and also in filtered large crystals of F1 exposed to ambient conditions with an atmospheric humidity around 30% (Figure S39). PXRD and EA confirm the complete transformation of the previous phases to F5 (Figure S24B and Table S32).
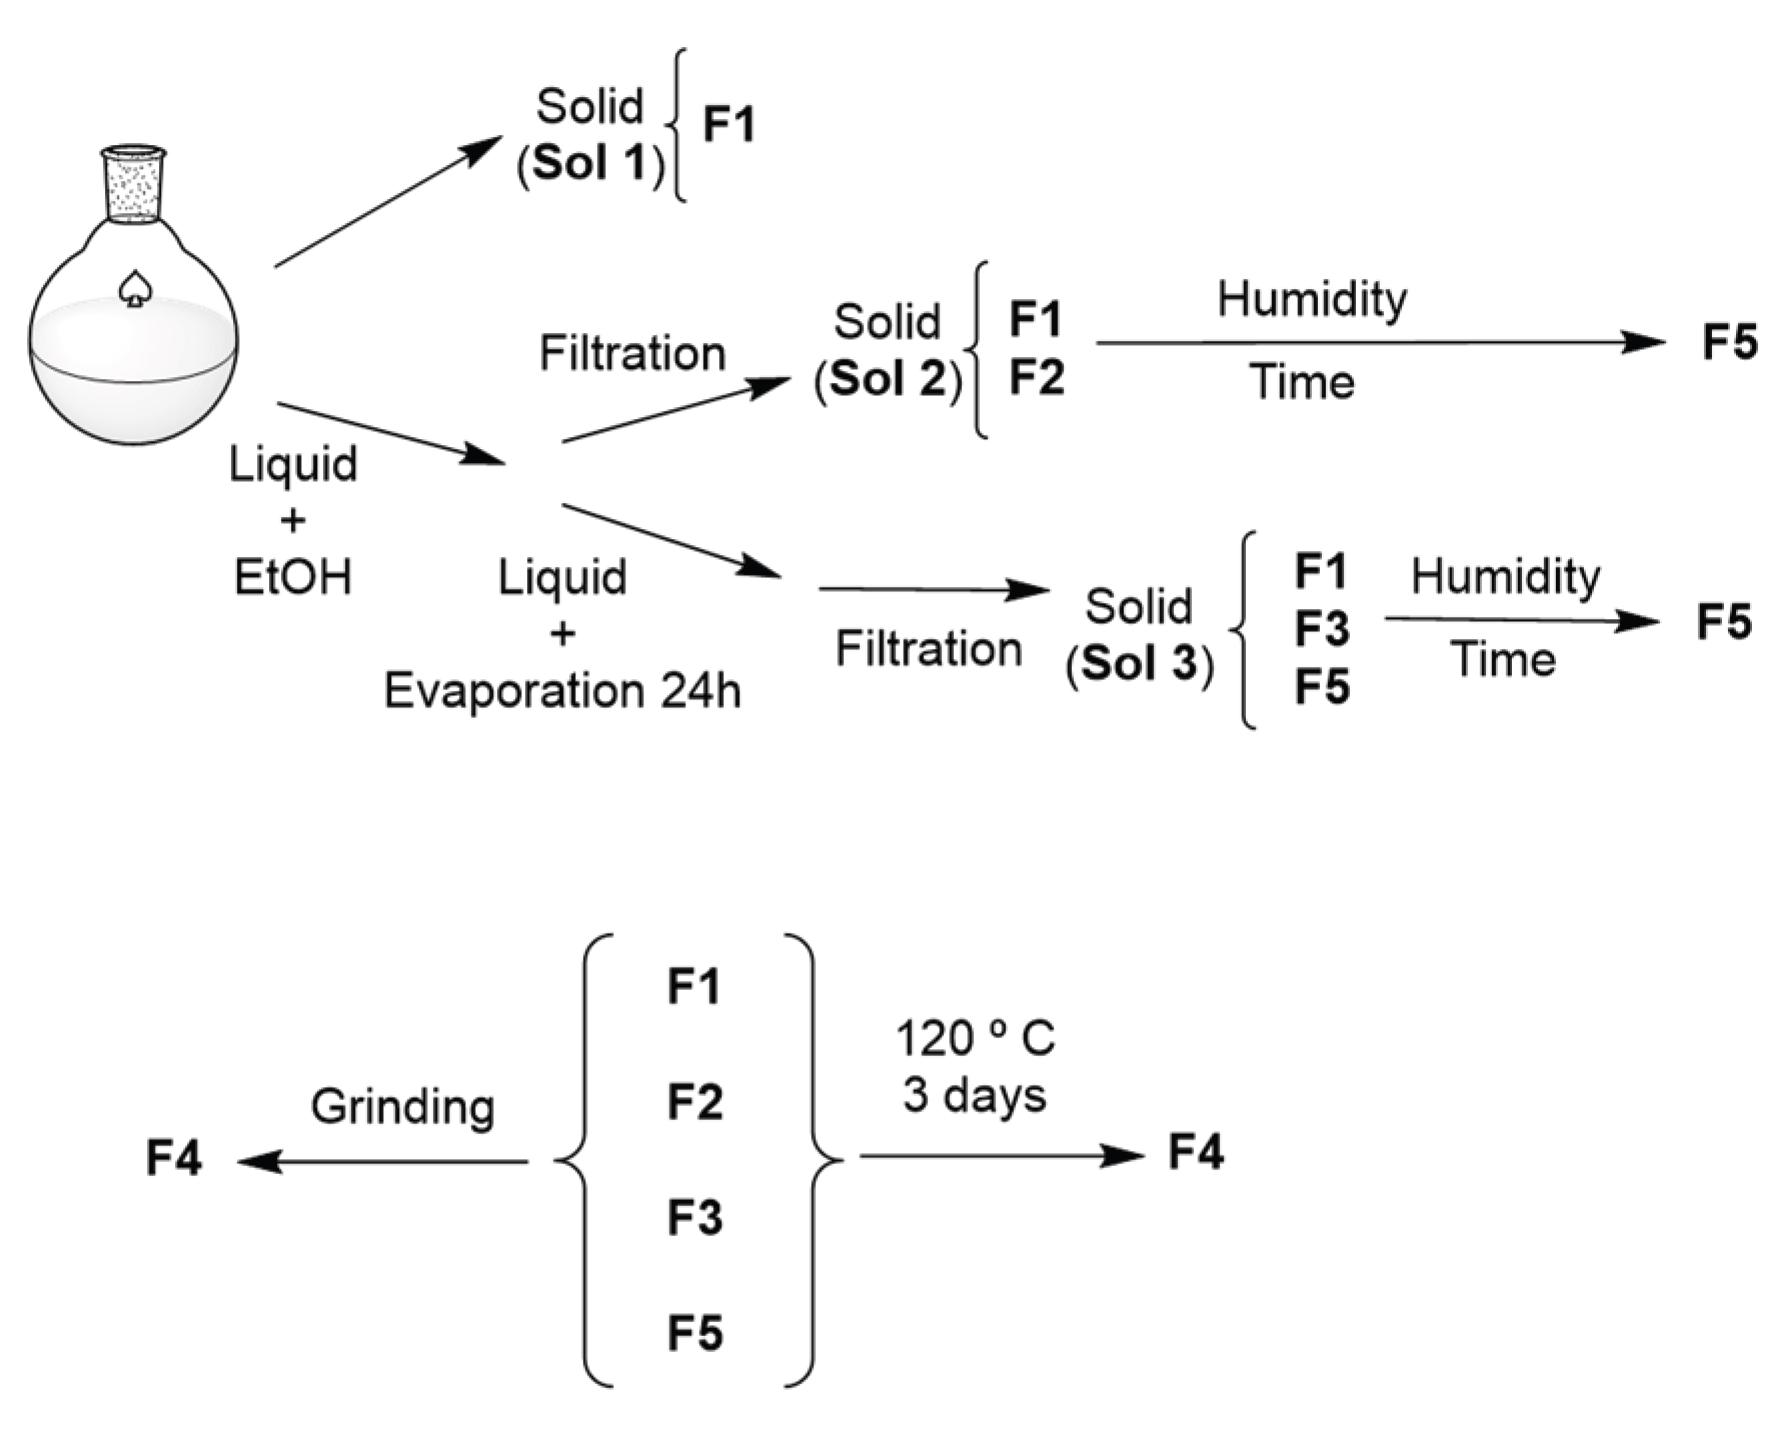
Scheme 1.
Obtention of crystal phases F1-F5 and transformations between them.
3. Results
3.1. Structure Determination by SCXRD
The structures for the five different crystalline phases obtained were solved by SCXRD (see Figure 1, Table 1 and Section S1). All of the crystals are pleochroic, presenting colours that range from magenta to ink blue (see Figure S1, Figure S3, Figure S5, Figure S7 and Figure S9) under transmitted light, and bulky crystals from all of the phases are opaque deep purple (S35 and S37).
Compound F1, with formula [Cu(en)2(H2O)I]I, forms crystals in the monoclinic P21/n space group containing an ionic pair in the asymmetric unit. The crystals were found to be isostructural to the previously reported compounds [Cu(en)2(H2O)Cl]Cl [7,8] and [Cu(en)2(H2O2)Br]Br [2]. The cationic moiety [Cu(en)2(H2O)I]+ consists of a copper atom surrounded by four nitrogens from the chelating en ligands, with bond distances comparable to the related Cl and Br derivatives. The Cu atom is displaced 0.037 Å from the mean plane defined by the N atoms towards the halogen ligand, as also happens with the two related compounds. The apical positions are occupied by one iodide atom and one water molecule giving rise to a logically distorted octahedron due to the difference between Cu-O and Cu-I distances. Regarding the crystal packing, N-H···I, C-H···I and N-H···O interactions are present (Table S2), giving rise to supramolecular layers parallel to the (010) plane.
F2 crystallizes in the monoclinic I2/a space group and consists of [Cu(en)2I2] octahedra that display half a molecule in the asymmetric unit with the copper atom sitting on an inversion centre. Consequently, the CuN4I2 environment is an elongated octahedron with the copper atom located in the exact centre. The packing of the molecules is achieved by N-H···I and C-H···I interactions to yield layers parallel to the (001) plane. There are interstitial channels parallel to the a vector where highly disordered molecules are lodged. A solvent mask was calculated using SQUEEZE [9] finding 104 electrons in a volume of 384 A3 in one void per unit cell. This is consistent with the presence of 0.5 EtOH per asymmetric unit, which account precisely for 104 electrons per unit cell, yielding the formula [Cu(en)2I2] · EtOH.
Compound F3 ([Cu(en)2I]I · 2H2O) crystallizes in the triclinic P-1 space group with one formula in the asymmetric unit. The coordination environment for the metal atom could be described either as CuN4I2 in a highly distorted octahedron (Cu-I2 distance, collected in Table S15, is considerably larger than Cu-I1, and clearly exceeds the sum of the Van der Waals radii) or alternatively as a CuN4I square pyramid with the copper displaced 0.064 Å from the mean plane defined by the nitrogen atoms. Despite the long Cu-I2 distance, it is remarkable that this iodine atom is located in a position coincident with the vertex of a distorted octahedron. This geometry has also been found in other compounds containing the [Cu(en)2]2+ moiety [10,11,12,13] with Cu-I distances and I-Cu-I angles similar to the ones found in F3. The two interstitial water molecules per formula unit contribute to the crystal packing creating supramolecular interactions N-H···O, N-H···I, O-H···O and O-H···I (see Table S6) that give rise to layers parallel to the (112) plane.
Crystals of F4 (orthorhombic Cmce space group) contain half a [Cu(en)2I2] molecule in the asymmetric unit where the metal atom is located at an inversion centre. The en ligands are disordered in two alternative positions with 62% (A) and 38% (B) relative occupations. The CuN2I2 environment in F4 is an elongated octahedron with distances and angles analogous to the ones found in F2. Regarding the arrangement in the solid, [Cu(en)2I2] polyhedra are closely packed by N-H···I and C-H···I interactions resulting in a dense 3D arrangement (see Figure S8).
Phase F5, with formula [Cu(en)2I2] · 0.5H2O, crystallizes in the monoclinic I2/a space group. The asymmetric unit consists of two halves of [Cu(en)2I2] octahedra that present slightly different geometrical parameters, together with one half of a water molecule. The two crystallographically independent copper atoms are located again at inversion centres, and the oxygen from the water molecule is coincident with a twofold axis. The metal environment displays bond distances and angles comparable to the ones found in compounds F2 and F4, with a more pronounced axial distortion in one of the octahedra (Cu1-I1= 3.36696(17), Cu2-I2 = 3.16436(17) Å). The coordination polyhedra are connected by N-H···O, N-H···I, O-H···I and C-H···I interactions that give rise to a compact 3D packing (see Figure S10).
3.2. PXRD
PXRD analysis was performed to characterize the solids and to identify the different crystalline phases (see Section S3) comparing the experimental measurements with the theoretical diffractograms simulated from the SCXRD structures solved for F1–F5 (Figure 2).
The diffractograms for the different phases display intense characteristic peaks that allow the identification of the structural types even in the mixtures, and prove the validity of PXRD as a technique useful to study this system.
3.3. FTIR
The FTIR spectra corresponding to crystalline phases F1, F2, F4 and F5 are shown in Section S4 (F3 could not be isolated in a sufficient amount to perform this analysis). As expected, it was observed that the spectra are highly similar, with the main absorption bands (due to the en ligands) at the same positions. Some differences were observed in weak bands appearing in the high-wavenumber region (around 3500 cm-1), associated with the hydrogen bonds present in the structural types. However, the spectroscopic differences related with metal–ligand vibrational modes, and in particular with vibrations related to Cu–I bonds, would be expected mainly in the low-wavenumber region. Unfortunately, this region is not routinely measured and could not be recorded with the available ATR-FTIR equipment. Therefore, it was concluded that FTIR spectroscopy does not allow the unequivocal identification of these crystalline phases.
3.4. Elemental Analysis
The C, H and N content of the phases that could be separated in a quantity enough for this type of analysis (F1, F4 and F5, Table S32) was determined by EA to ensure the purity of the compounds, as the diffractometric techniques do not give enough information about the amorphous solids. The obtained bulk solids Sol 1, Sol 2 and Sol 3 were also analyzed (Table S32). The results are consistent with the presence of F1 in Sol 1, a mixture of F1 and F2 in Sol 2, and the existence of several phases in Sol 3. These results are in accordance with the results from the PXRD analysis, but they also manifest that the small differences in composition for the pure compounds, together with the presence of solvents adsorbed in the solids, makes this technique unsuitable for the precise characterization of the mixtures.
4. Discussion
The initial goal of our work was to solve by SCXRD the structure of the crystalline solid previously reported by Baker [4]. According to the experimental procedure, crystals from the ionic solid [Cu(en)2(H2O)2]I2 were formed both in the first step and after the addition of ethanol. Interestingly, after the experimental procedure was repeated we observed that the morphology of the crystals in the first solid obtained (Sol 1) was very different from the one that appeared after adding the antisolvent (Sol 2), and consequently the two of them were analyzed separately.
The morphological diversity of the crystals from all of the phases, their pleochroism and the opacity of large crystals, prevented in many cases the visual identification of the phases based on their physical appearance (see Figure 3 and Section S5). Furthermore, PXRD analysis of the solids (Section S3) proved that the compounds often appeared as a mixture, and that some of the crystals underwent phase transformations. Consequently, a careful analysis and monitorization of the solids was needed to identify, separate and characterize the phases.
4.1. Phase Changes and Relative Stability of F1-F5
In order to better understand the occurrence and stability of the five structural types, the experimental procedure was repeated several times and the resulting solids carefully studied. A similar chemical composition regarding N and H (see section S6) and the overall resemblance in the most intense IR bands for F1-F5 disqualified EA and FTIR to unequivocally characterize the obtained solids and to identify the presence of the different phases in the mixtures. In contrast, PXRD was found to be suitable to identify the phases present in the solids by comparison with the simulated patterns from the solved SCXRD structures. However, the transformation of all the solids to F4 after grinding (needed for the loss of a preferred orientation of the crystallites) difficulted the preparation of the powdered sample. Fortunately, a gentle grinding of the solids for a short period of time (less than two minutes) yielded homogeneous powdered samples without altering the structure of the phases.
Regarding the stability of the different structural types, it was found that F1 was always formed first from the aqueous solution as the kinetically more stable product, except after the addition of ethanol as an antisolvent to obtain F2. F3 proved to be the least common one, having been found only during a short period in the solution and always coexisting with other phases. It appears in small amounts of isolated crystals (see Figure S38), quickly redissolving in the mother liquor. The fact that all of the phases revert to F5 in ambient conditions proves that this is thermodynamically the most stable phase. F4 would also be most stable when the solids are forced to lose their coordination or interstitial solvent molecules, either by heating or under pressure.
The relative stability of the five structural types was found to be clearly related to their density in the solid state: F4 and F5 display the highest values (2.431 and 2.432 g/cm3 respectively), closely followed by F1 (2.338 g/cm3). To compare the supramolecular interactions in the crystals, a topological study was made with TOPOS Pro [14], considering the ions and molecules as nodes and the most relevant interactions as linkers (see Figure 4 and section S2). The underlying nets for F4 and F5 reveal dense three-dimensional packings, while the nets found in F1, F2 and F3 are bidimensional. Concerning the connectivity of the nodes, the highest one is logically found in the phase obtained under pressure (F4) with 8-connected nodes that yield a body-centered cubic bcu topology. In contrast, the most open topological type (a trinodal net with 2-, 3- and 4-connected nodes) is found in the least stable F3 solid.
4.2. Coordination Geometry and Analysis of Octahedral Distortion Due to the Jahn-Teller Effect
The analysis of the crystal structures of compounds F1–F5 reveals that, in all cases, the Cu(II) ion is situated in a coordination environment that can be described as CuN4IO (F1) or CuN4I2 (F2-F5) octahedral. Due to the d9 configuration of the Cu(II) atom, the geometries present significant Jahn-Teller distortion, resulting in elongated octahedra that deviate from an ideal polyhedron.
The equatorial plane CuN4 has a very similar disposition in all five structures, being defined by four nitrogen atoms from two chelating ethylenediamine molecules. The Cu–N bond distances range from 1.998(11) to 2.035(2) Å and the maximum deviation of the copper atom from this plane is 0.064 Å (F3). This similarity of the equatorial plane allows the discussion to focus on the geometric variability observed along the axial axis of the octahedron, where the distortion is most significant.
In F2, F4 and F5 the axial ligands are two identical iodide ions, situated in ideal trans positions due to the presence of an inversion centre coincident with the copper atom. The Jahn-Teller distortion in these structures manifests as a significant elongation of the axial Cu-I bonds, with bond lengths of 3.2717(2) Å in F2, 3.2549(4) Å in F4, 3.16436(17) Å and 3.36696(17) Å in F5. These bond lengths are indeed larger than the sum of the covalent radii of Cu plus I (≈ 2.70 Å) and result in octahedra with a very pronounced axial elongation.
In F1, the [Cu(en)2(H2O)I]+ cation exhibits a logical break in axial symmetry due to the difference in bond lengths between the water molecule and the iodide ion (Cu–O = 2.631(3) Å, Cu–I = 3.1303(4) Å). Furthermore, the axis loses the linearity observed in the centrosymmetric octahedra of F2, F4 and F5, exhibiting a slightly smaller angle (I-Cu-O = 174.92(5)°).
The polyhedron in F3 presents the greatest deviation from ideal octahedral symmetry within the series of compounds studied; despite having two chemically identical axial iodide ligands, the structure displays drastic axial asymmetry, with dissimilar bond distances of 3.1112(3) Å and 3.4618(3) Å, combined with the most pronounced deviation from linearity in the entire series (I-Cu-O = 170.179(11)°). Although consistent with a strong elongation of the octahedron, the second iodine atom (I2) is located at a distance that could be considered too long to stay within the coordination sphere. This significant deformation of the octahedron demonstrates the versatility of this coordination environment and the lability of the axial positions, proving that non-covalent crystalline packing forces such as hydrogen bonds can alter this coordination geometry, which is a phenomenon typically associated with Jahn-Teller distortion.
5. Conclusions
The use of diffraction techniques has allowed the identification and characterization of five new crystalline phases (F1-F5) obtained from a straightforward and well-known reaction to prepare coordination compounds containing (bis(en)copper(II))2+ and I-. The careful study of the solids formed in different conditions has permitted the understanding of the rationale behind the sequential formation of the different crystalline phases and the transformations that occur between them. The comparative topological study performed on the solved SCXRD structures can explain the different stability of the crystal packings.
Supplementary Materials
The following supporting information can be downloaded at the website of this paper posted on Preprints.org.
Author Contributions
Conceptualization, J.P.; methodology, J.P., P.M.-M., R.S.I.; software, P.M.-M., M.R.-F., R.S.I.; formal analysis, J.P., P.M.-M., R.S.I., M.R.-F.; writing—original draft preparation, J.P., P.M.-M., R.S.I.; writing—review and editing, J.P., P.M.-M., R.S.I., P.A.-O.; visualization, J.P., P.M.-M., R.S.I., M.R.-F.; supervision, J.P. and P.A.-O.; funding acquisition, P.A.-O. All authors have read and agreed to the published version of the manuscript.
Funding
This work has been supported by MCINN/AEI/10.13039/5011000011033 under the National Program of Sciences and Technological Materials (PID2022-138968NB-C21 and PID2025-169304NB-C22) and Ministerio de Ciencia e Innovación/European Union Next Generation funds with the acquisition of the SCXRD equipment (EQC2021-007518-P/AEI/10.13039/501100011033).
Data Availability Statement
The structures of F1-F5 have been deposited in the CSD with reference numbers 2375969 (F1), 2375970 (F2), 2498843 (F3), 2577707 (F4) and 2583812 (F5) and can be retrieved free of charge from https://www.ccdc.cam.ac.uk/structures/.
Acknowledgments
We thank Antonio Almorín (SIdI-UAM), and Luis Larumbe and Sara Martínez (FTIR and EA Laboratory, SIdI-UAM) for the characterization of the compounds. We also thank Sonia Aragón for her help providing the initial samples.
Conflicts of Interest
The authors declare no conflicts of interest. The funders had no role in the design of the study; in the collection, analyses, or interpretation of data; in the writing of the manuscript; or in the decision to publish the results.
Abbreviations
The following abbreviations are used in this manuscript:
| en | ethylenediamine |
| SCXRD | Single Crystal X-Ray Diffraction |
| PXRD | Powder X-ray Diffraction |
| FTIR | Fourier Transform Infrared Spectroscopy |
| EA | Elemental Analysis |
References
- Warad, I.; Awwadi, F. F.; Abd Al-Ghani, B.; Sawafta, A.; Shivalingegowda, N.; Lokanath, N. K.; Mubarak, M. S.; Ben Hadda, T.; Zarrouk, A.; Al-Rimawi, F.; Odeh, A. B.; Barghouthi, S. A. Ultrasound-assisted synthesis of two novel [CuBr(diamine)2·H2O]Br complexes: Solvatochromism, crystal structure, physicochemical, Hirshfeld surface thermal, DNA/binding, antitumor and antibacterial activities. Ultrason. Sonochem. 2018, 48, 1–10. [Google Scholar] [CrossRef] [PubMed]
- Myznikov, L. V.; Fisher, A. I.; Dmitrieva, U. N.; Artamonova, T. V.; Zevatskii, Y. E. Novel Mixed Complexes of Copper(II) and Ethylenediamine: Synthesis, Crystal Structure, and Catalytic Activity in the Cross-Coupling Reaction of 1-Phenyl-5H-tetrazole-5-thiol and Iodobenzene. Russ. J. Gen. Chem. 2018, 88, 495–498. [Google Scholar] [CrossRef]
- Mykhalichko, B.; Lavrenyuk, H.; Mykhalichko, O. A flame retardant-hardener for epoxy resins: Synthesis, structural, and DFT studies of the [Cu(H2NC2H4NH2)2(H2O)Cl]Cl complex. Turk. J. Chem. 2021, 45, 1865–1872. [Google Scholar] [CrossRef] [PubMed]
- Baker, A. T. The ligand field spectra of copper(II) complexes. J. Chem. Educ. 1998, 75, 98–99. [Google Scholar] [CrossRef]
- Vegas, V. G.; García-Hernán, A.; Aguilar-Galindo, F.; Perles, J.; Amo-Ochoa, P. Structural and Theoretical Study of Copper(II)-5-fluoro Uracil Acetate Coordination Compounds: Single-Crystal to Single-Crystal Transformation as Possible Humidity Sensor. Polymers 2023, 15, 2827. [Google Scholar] [CrossRef] [PubMed]
- Maldonado, N.; Perles, J.; Martínez, J. I.; Gómez-García, C. J.; Marcos, M.; Amo-Ochoa, P. Experimental and Theoretical Study of Dynamic Structural Transformations between Sensing Copper(II)-Uracil Antiferromagnetic and Metamagnetic Coordination Compounds. Cryst. Growth Des. 2020, 20, 5097–5107. [Google Scholar] [CrossRef]
- Ball, R. D.; Hall, D.; Rickard, C. E. F.; Waters, T. N. The colour isomerism and structure of some copper co-ordination compounds. Part XIV. The crystal structure of chloroaquobis(ethylenediamine)copper(II) chloride. J. Chem. Soc. 1967, 2, 1435–1437. [Google Scholar] [CrossRef]
- Selimović, E.; Komolkin, A. V.; Davletbaeva, D. A.; Egorov, A. V.; Soldatović, T. V. Interactions of nitrogen-donor biomolecules with copper(II) complexes in Tris buffer. J. Coord. Chem. 2020, 73, 17–34. [Google Scholar] [CrossRef]
- Spek, A. L. PLATON SQUEEZE: a tool for the calculation of the disordered solvent contribution to the calculated structure factors. Acta Crystallogr. C Struct. Chem. 2015, 1, 9. [Google Scholar] [CrossRef] [PubMed]
- Freckmann, B.; Tebbe, K. Z. Naturforsch. Die Kristallstruktur des Bis(l,2-diaminoethan)-kupfer(II)- diiodocuprats(I), [Cu(H2NCH2CH2NH2)2(CuI4/2)2]. Z. Naturforschung B 1980, 35, 1319–1321. [Google Scholar]
- Zhang, S.; Cao, Y.; Zhang, H.; Chai, X.; Chen, Y.; Sun, R. Influence of synthesis condition on product formation: hydrothermal auto-oxidated synthesis of five copper halides with ratio of Cu(I)/Cu(II) in 1:1, 2:1, 3:1, 4:1 and 1:0. J. Solid State Chem. 2008, 181, 3327–3336. [Google Scholar] [CrossRef]
- Li, H.; Sun, L.; Chen, Z.; Wang, Y.; Li, J. Incorporating a Transition Metal Complex into Polymeric Iodoplumbate: Structure Characterization, Properties and Theoretical Study of a Unprecedented Hybrid Semiconductor: {[Cu(en)2][Pb2I6]}n. Aust. J. Chem. 2008, 615, 391–396. [Google Scholar] [CrossRef]
- Wieczorrek, C. Bis-triiodide von 1, 2-ethandiaminkomplexen am beispiel des metalls kupfer. Cryst. Struct. Com. 2000, 56, 1085–1087. [Google Scholar] [CrossRef] [PubMed]
- Blatov, V.A.; Shevchenko, A.P.; Proserpio, D.M. Applied topological analysis of crystal[MR1.1] structures with the program package ToposPro. Cryst. Growth Des. 2014, 14, 3576–3586. [Google Scholar] [CrossRef]
Figure 1.
Molecular plots of the solved structures. Top row, from left to right: F1, with formula [Cu(en)2(H2O)I]I; F2, [Cu(en)2I2]·EtOH (disordered solvent not included in the model); F3, [Cu(en)2I]I·2H2O. Bottom row: left, F4 with formula [Cu(en)2I2] and right, F5, [Cu(en)2I2]·0.5H2O. Copper atoms are depicted in dark blue, iodine in purple, oxygen in red, nitrogen in pale blue, carbon in grey and hydrogen in white.
Figure 1.
Molecular plots of the solved structures. Top row, from left to right: F1, with formula [Cu(en)2(H2O)I]I; F2, [Cu(en)2I2]·EtOH (disordered solvent not included in the model); F3, [Cu(en)2I]I·2H2O. Bottom row: left, F4 with formula [Cu(en)2I2] and right, F5, [Cu(en)2I2]·0.5H2O. Copper atoms are depicted in dark blue, iodine in purple, oxygen in red, nitrogen in pale blue, carbon in grey and hydrogen in white.
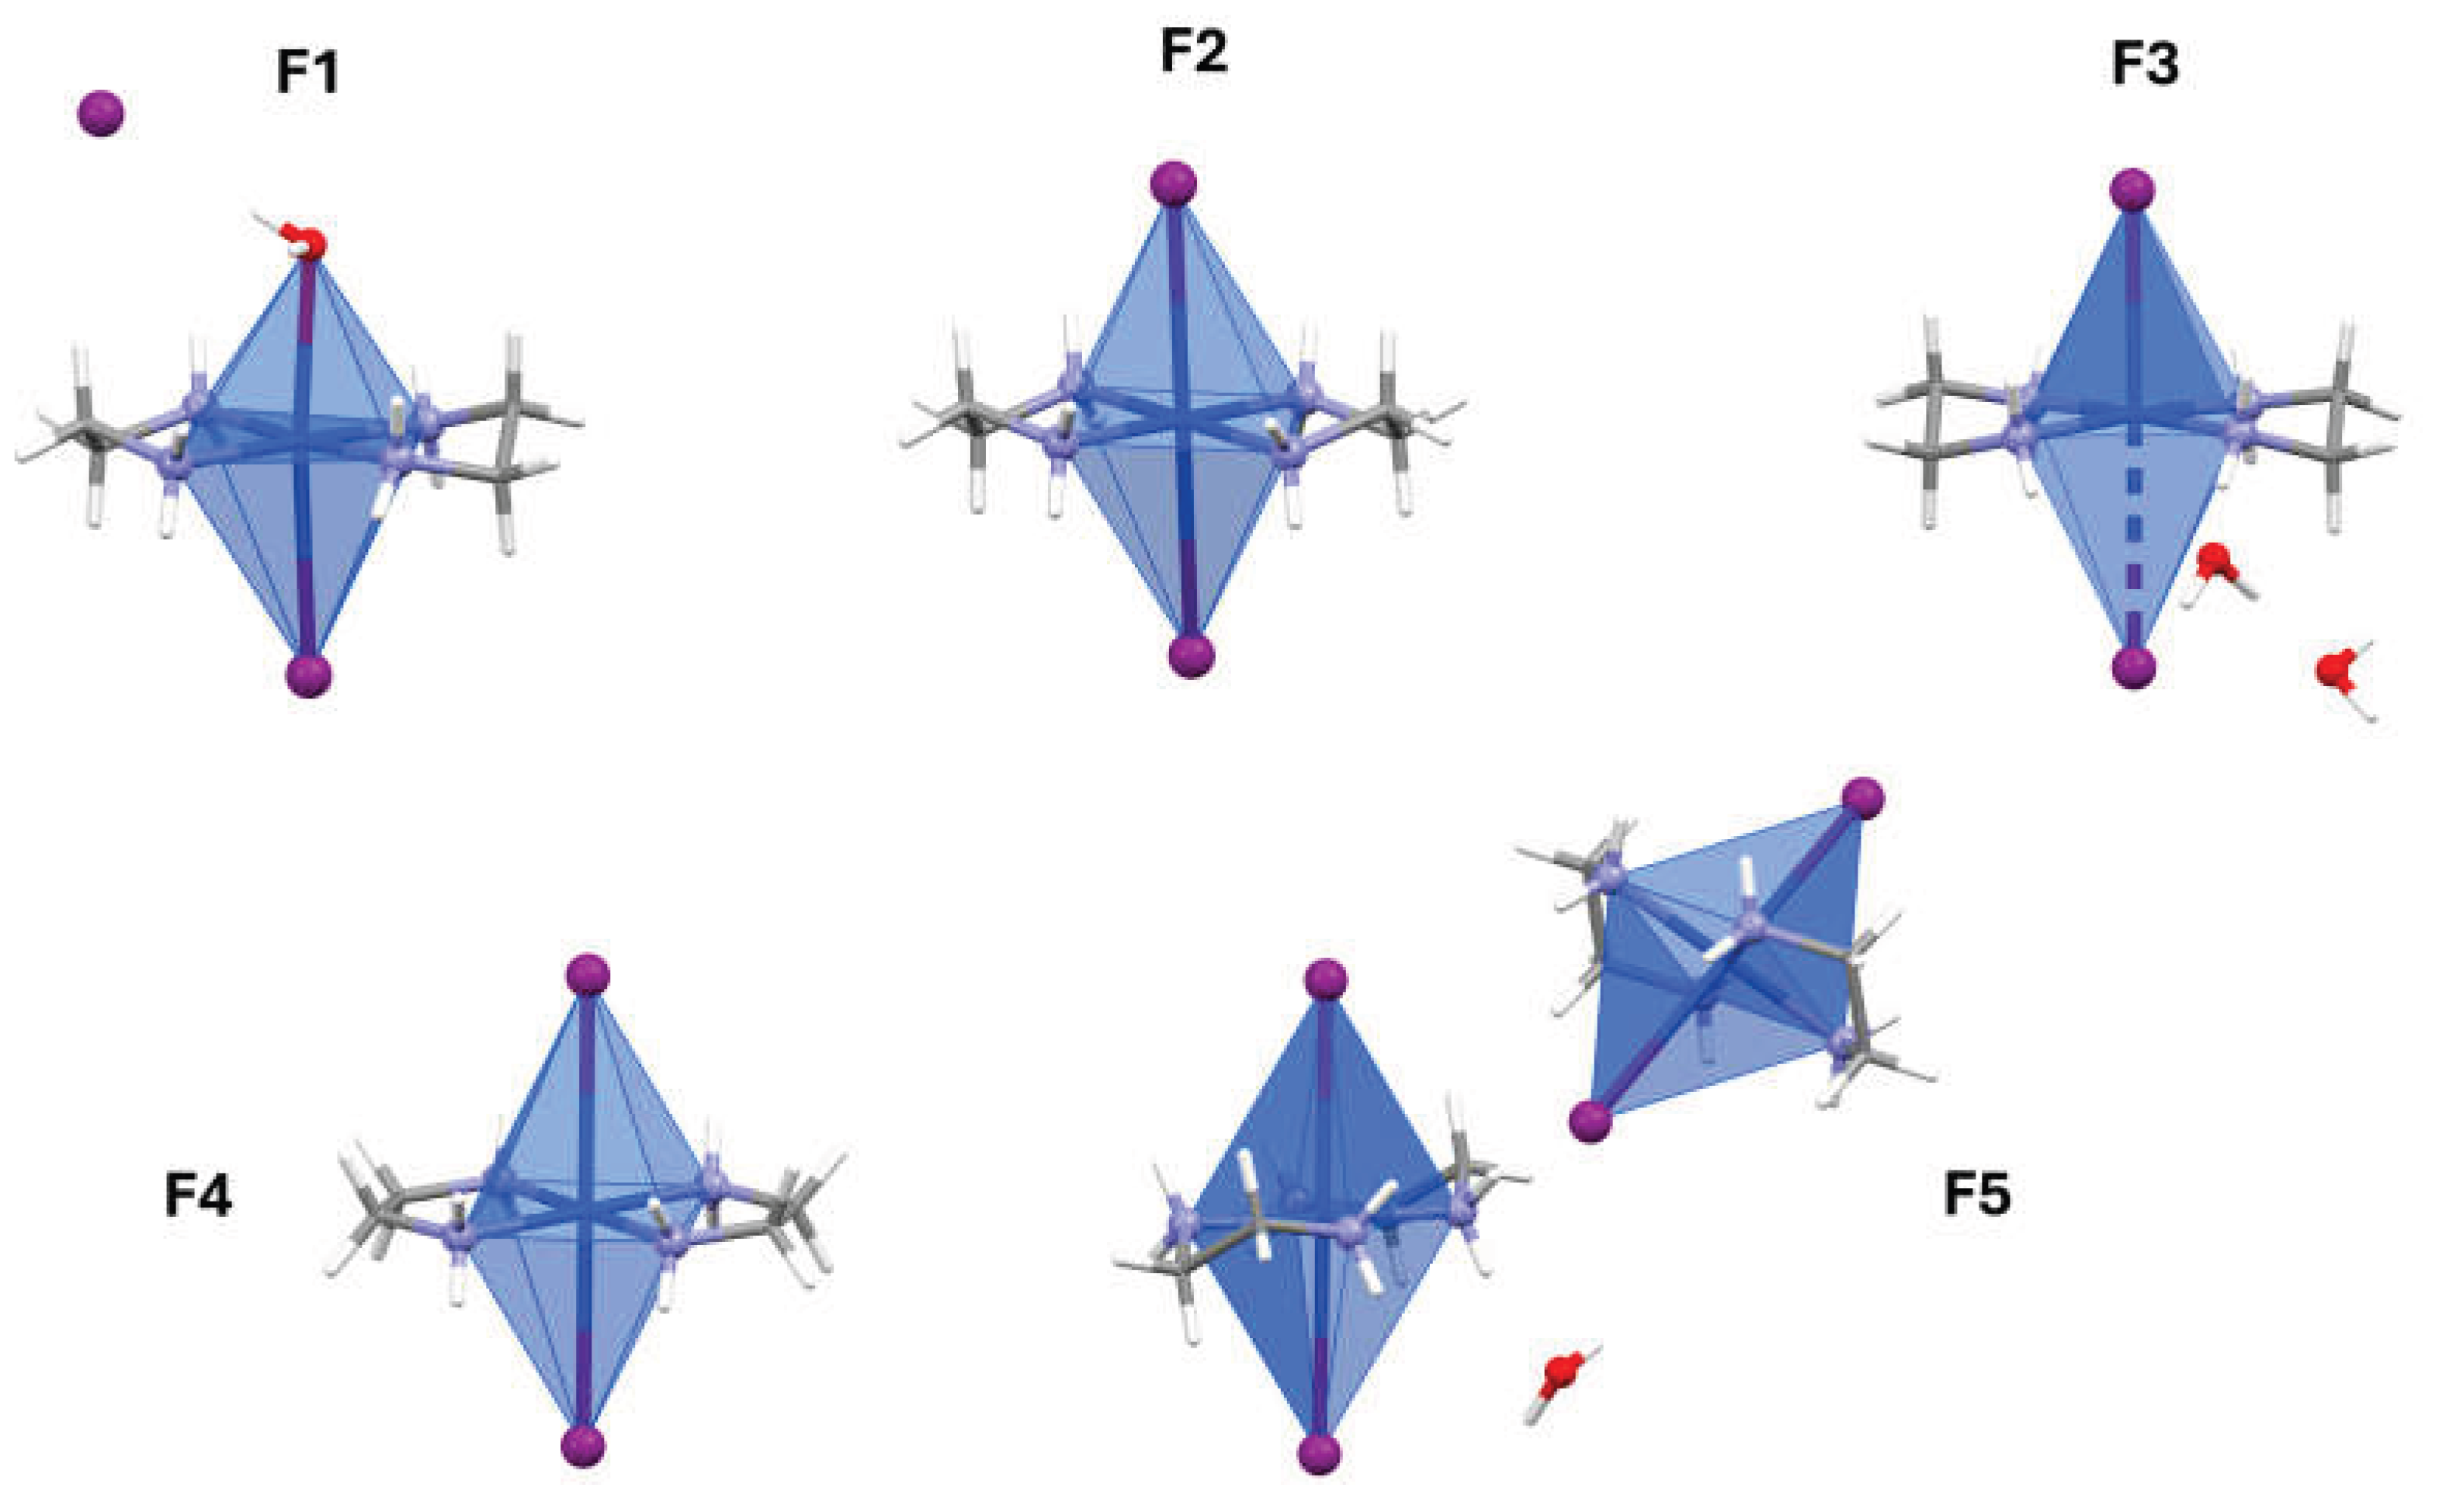
Figure 2.
Simulated PXRD patterns of F1 (black), F2 (red), F3 (blue), F4 (pink) and F5 (green).
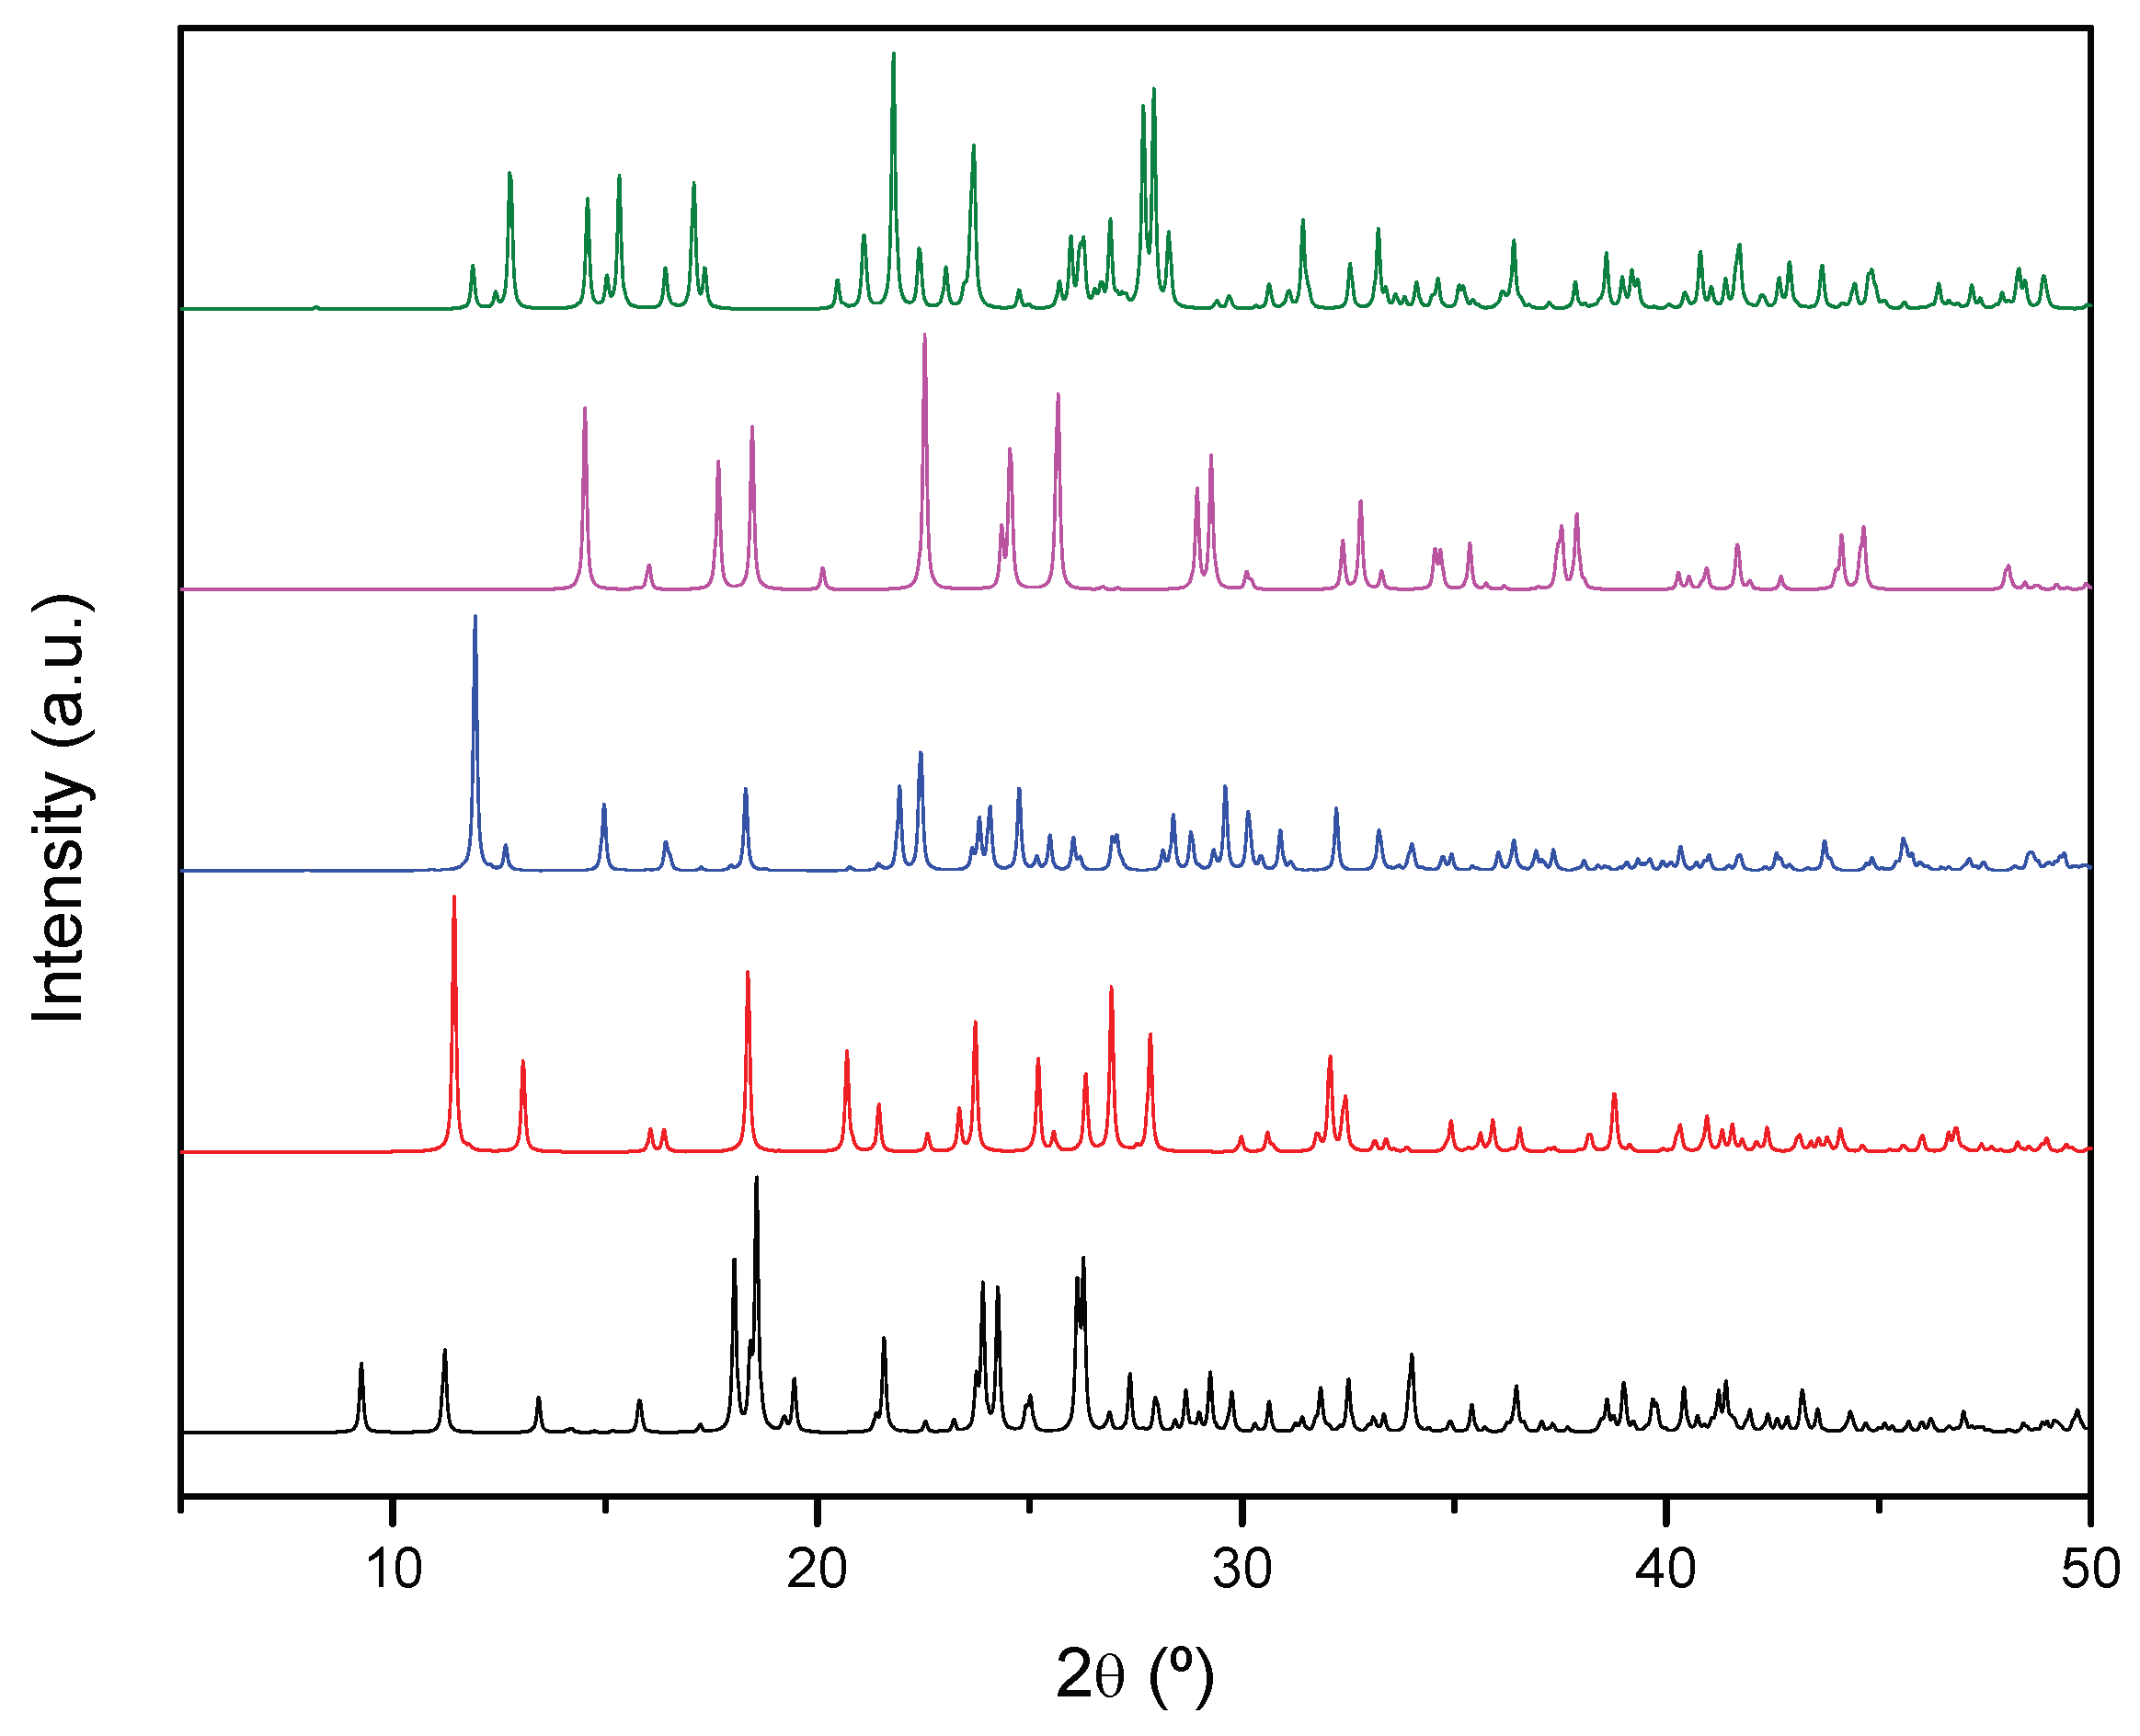
Figure 3.
Microscope images under transmitted light with the polarizer in two orientations (0° and 90°) from a mixture of crystals formed in the solution, illustrating both the morphological diversity and the colour change due to pleochroism.
Figure 3.
Microscope images under transmitted light with the polarizer in two orientations (0° and 90°) from a mixture of crystals formed in the solution, illustrating both the morphological diversity and the colour change due to pleochroism.
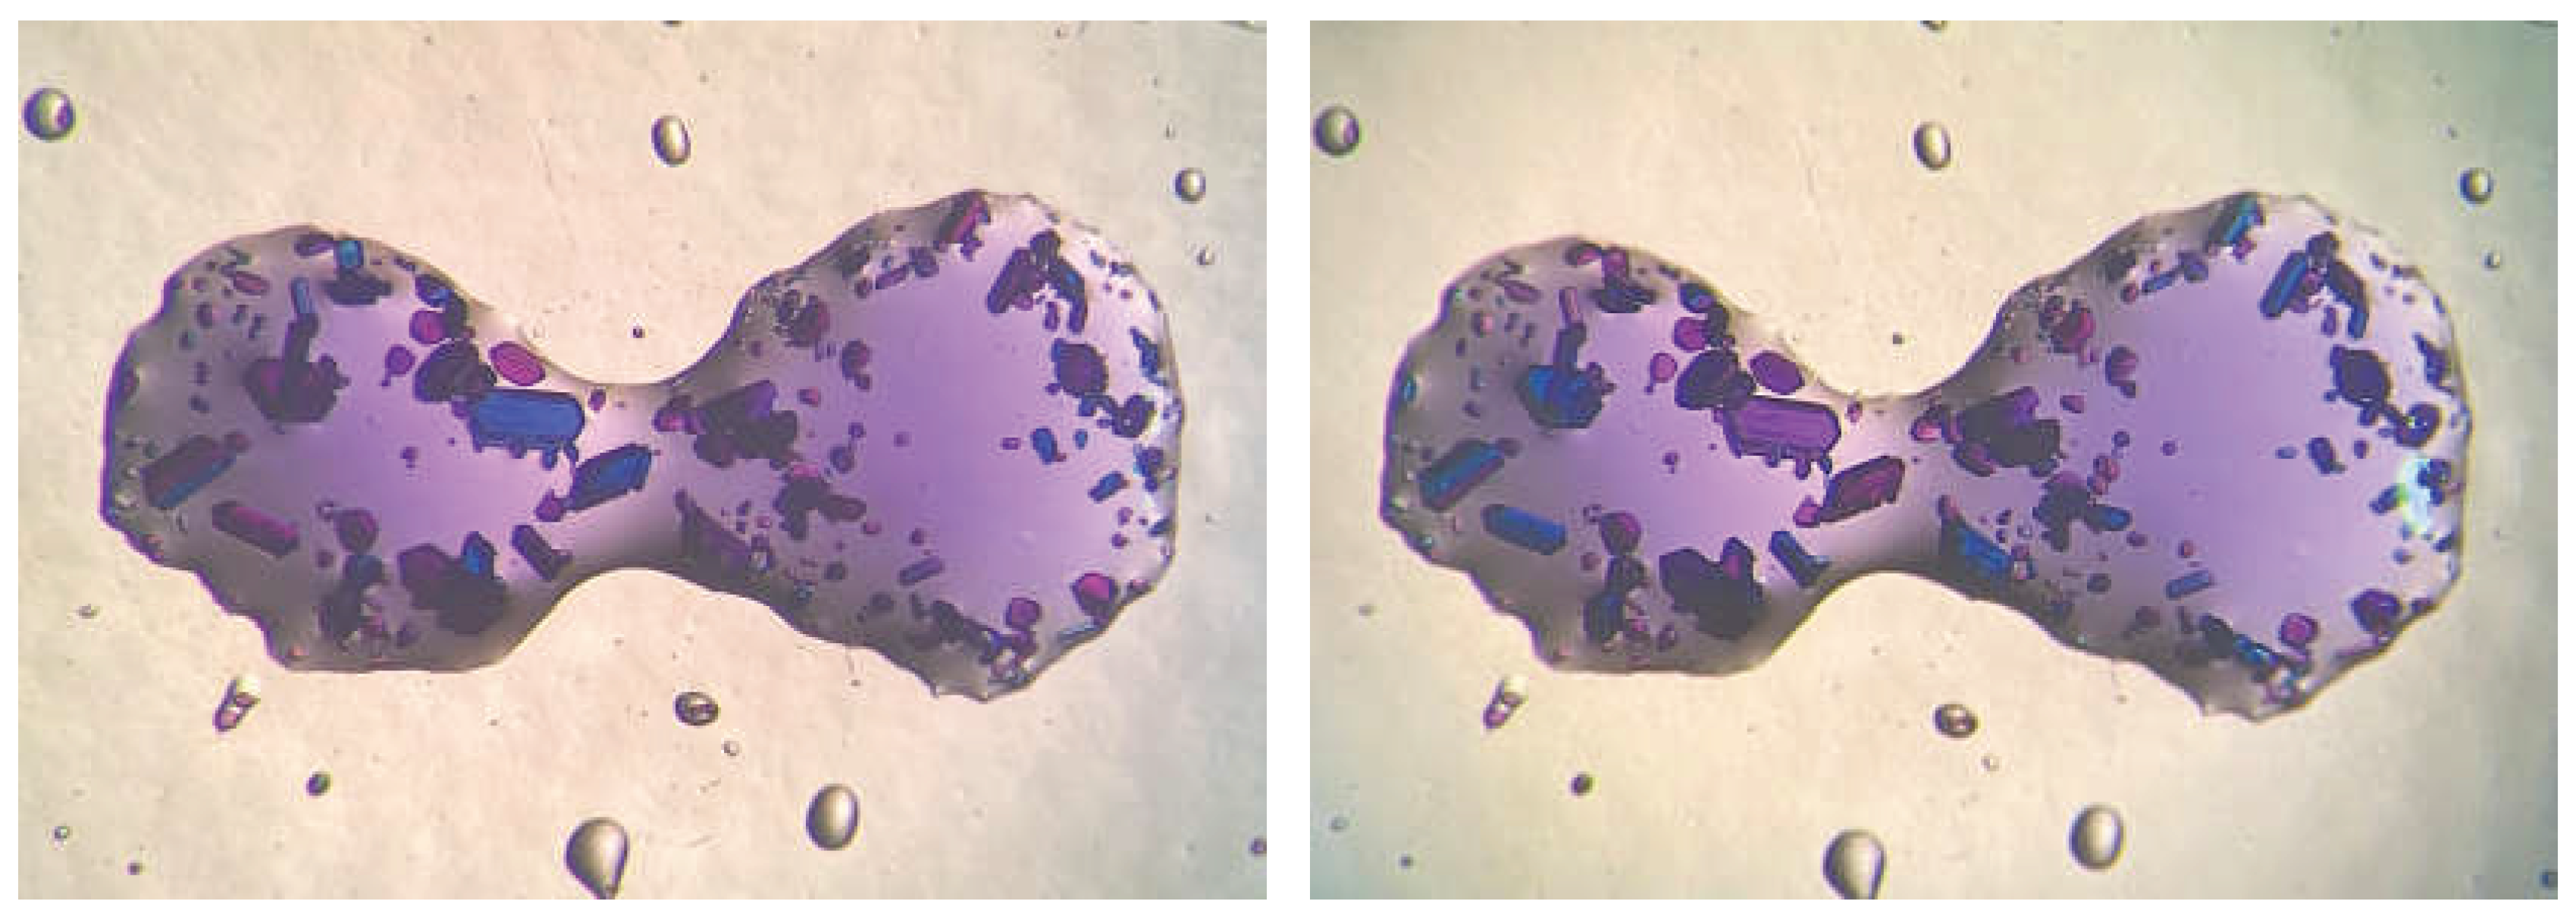
Figure 4.
Underlying nets found in the different crystal structures considering supramolecular interactions as connectors. Magenta spheres represent the copper coordination octahedra, purple ones are the iodine anions and blue ones the interstitial water molecules.
Figure 4.
Underlying nets found in the different crystal structures considering supramolecular interactions as connectors. Magenta spheres represent the copper coordination octahedra, purple ones are the iodine anions and blue ones the interstitial water molecules.
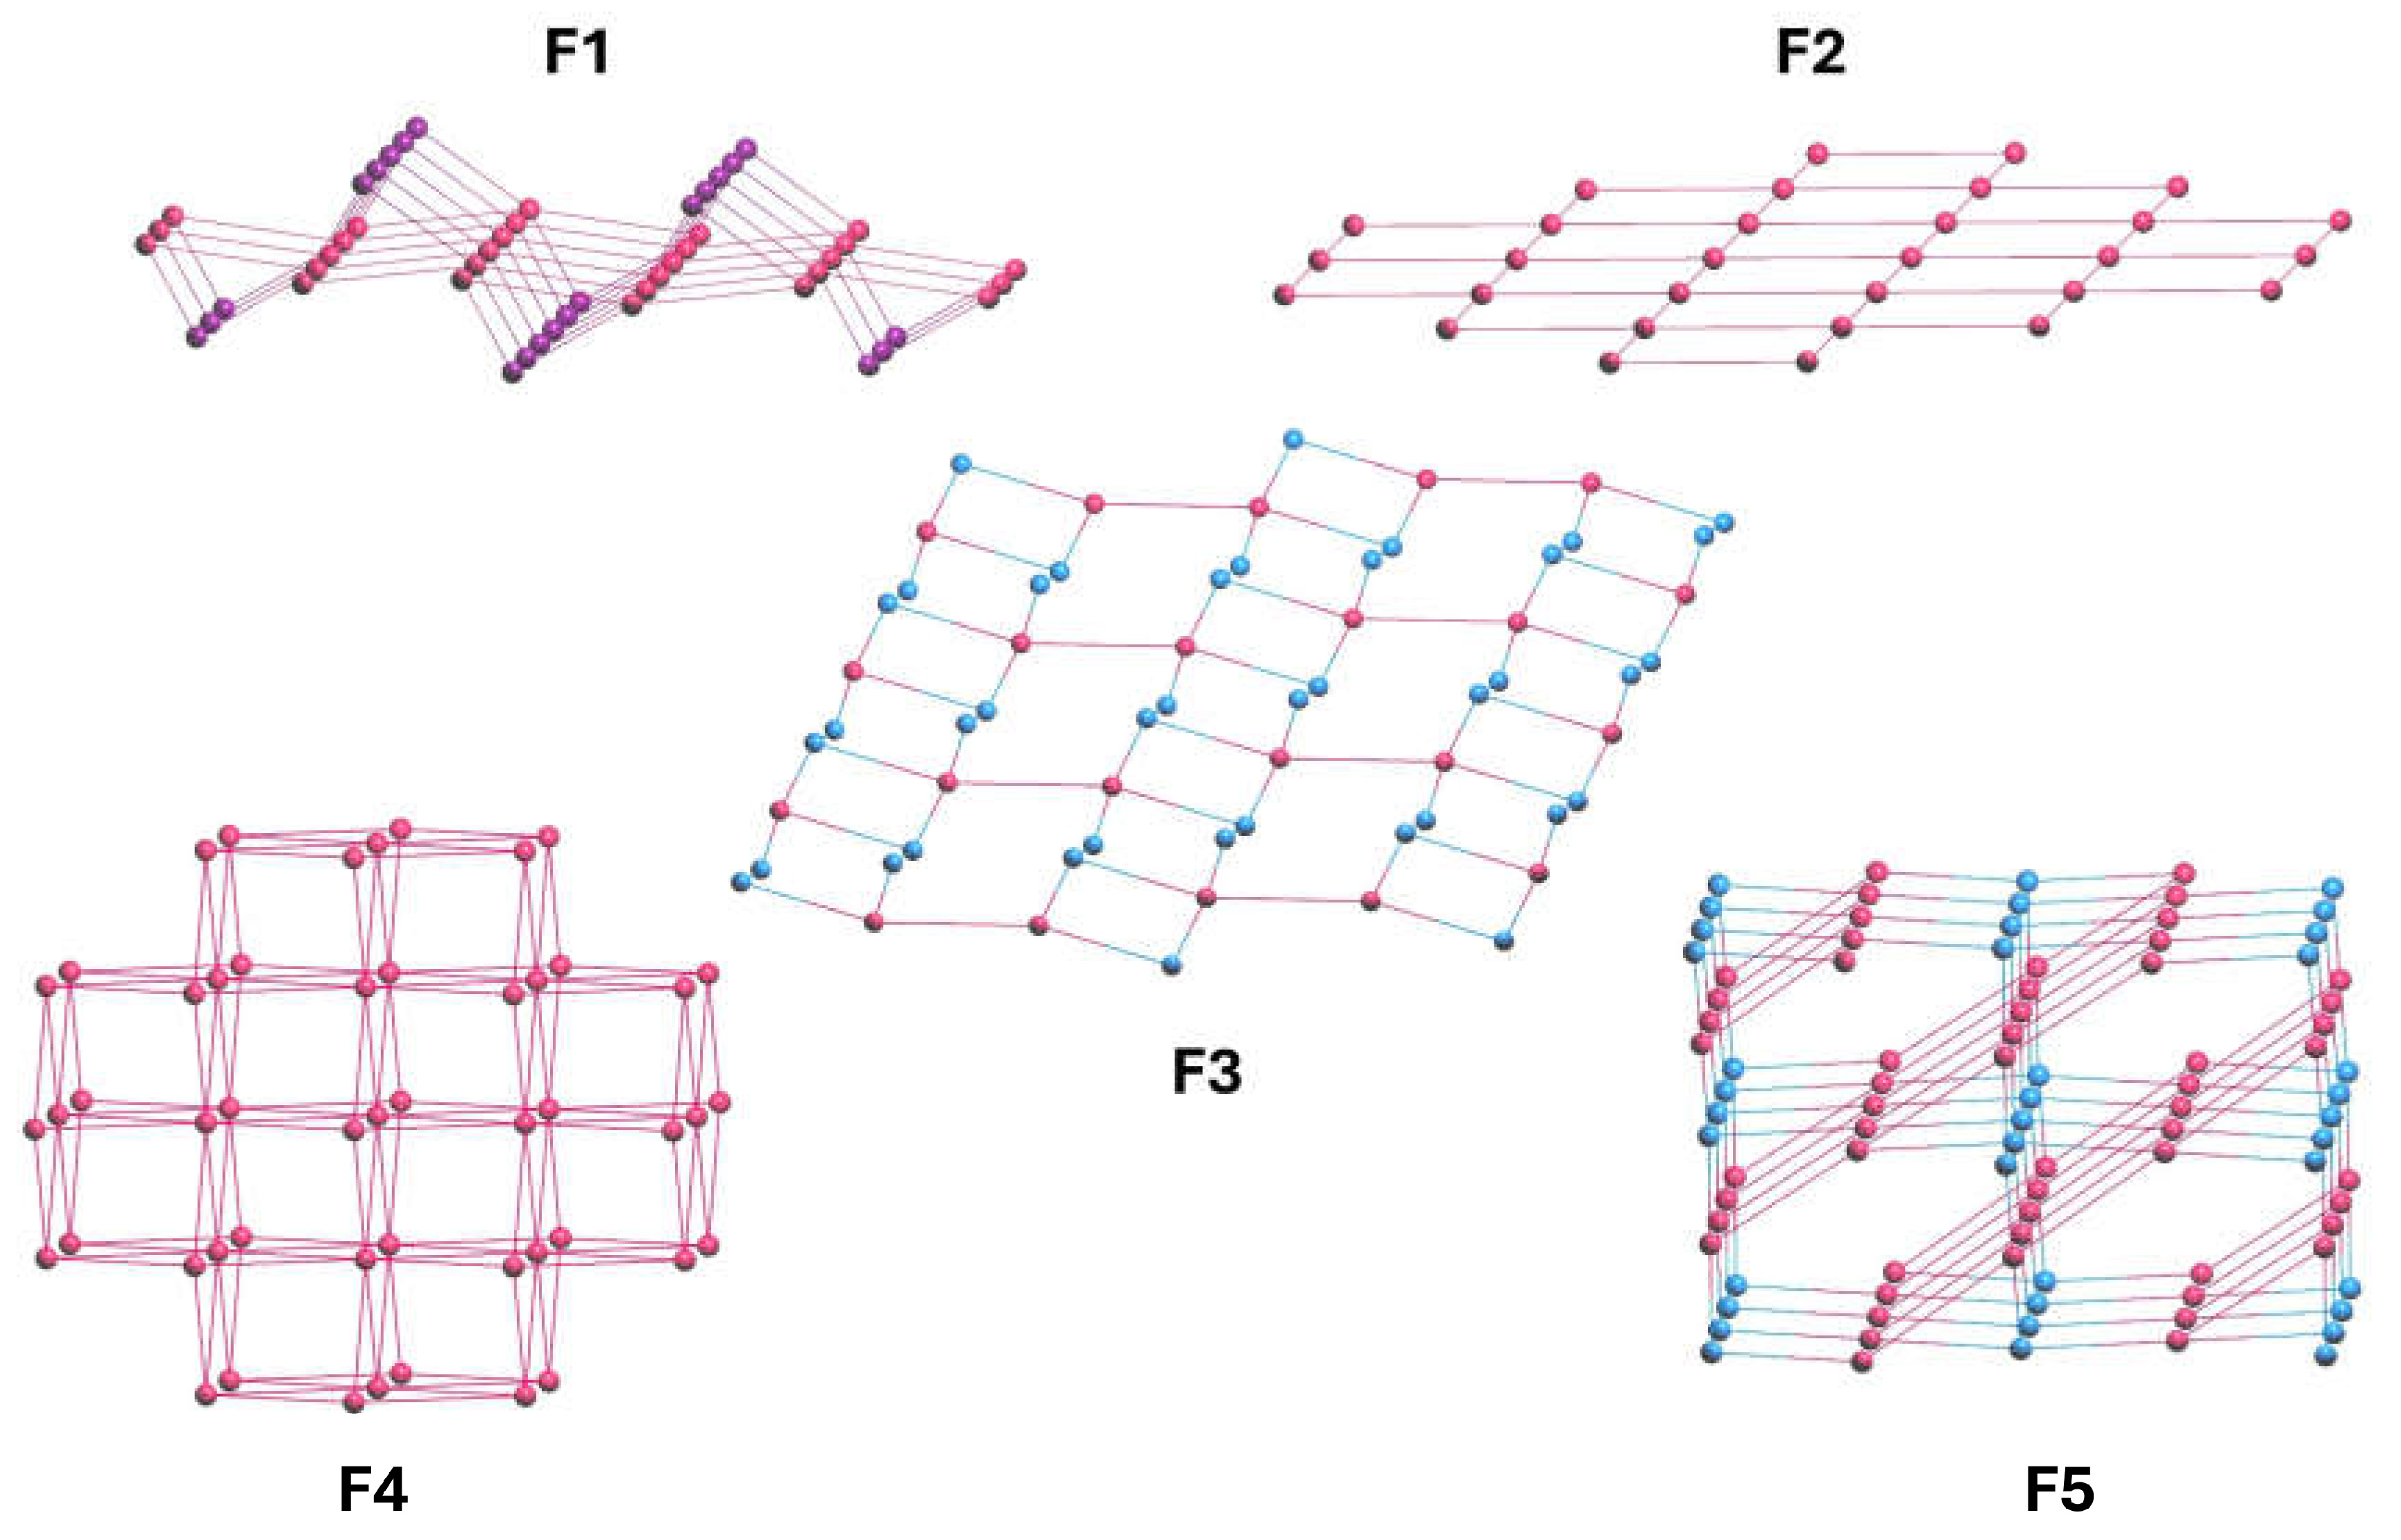

Table 1.
Structural parameters of F1-F5.
| F1 | F2 | F3 | F4 | F5 | |
|---|---|---|---|---|---|
| Formula | C4H18CuI2N4O | C6H16CuI2N4O | C4H20CuI2N4O2 | C4H16CuI2N4 | C4H17CuI2N4O0.5 |
| Space Group | P21/n | I2/a | P-1 | Cmce | I2/a |
| a/ Å | 6.8435(2) | 11.2211(5) | 7.5138(2) | 9.6022(6) | 14.2615(3) |
| b/ Å | 15.7667(4) | 8.5742(3) | 8.35160(10) | 11.2644(6) | 7.9304(2) |
| c/ Å | 12.1069(3) | 15.7225(7) | 11.8903(2) | 11.0518(6) | 21.5896(5) |
| α / ° | 90 | 90 | 75.8560(10) | 75.8560(10) | 90 |
| β / ° | 97.748(2) | 100.640(4) | 73.204(2) | 90 | 92.558(2) |
| γ / ° | 90 | 90 | 85.650(2) | 90 | 90 |
| V / Å3 | 1294.40(6) | 1486.68(11) | 692.65(2) | 90 | 92.558(2) |
| Z | 4 | 4 | 2 | 4 | 8 |
| Dcalc. / g cm-3 | 2.338 | 2.161 | 2.271 | 2.431 | 2.432 |
| μ / mm-1 | 6.430 | 5.605 | 6.018 | 6.951 | 6.819 |
| R1 (all data) | 0.0248 | 0.0221 | 0.0160 | 0.0417 | 0.0235 |
| wR2 (all data) | 0.0523 | 0.0450 | 0.0386 | 0.0867 | 0.0419 |
| GooF | 1.032 | 1.032 | 1.089 | 1.041 | 1.043 |
Disclaimer/Publisher’s Note: The statements, opinions and data contained in all publications are solely those of the individual author(s) and contributor(s) and not of MDPI and/or the editor(s). MDPI and/or the editor(s) disclaim responsibility for any injury to people or property resulting from any ideas, methods, instructions or products referred to in the content. |
© 2026 by the authors. Licensee MDPI, Basel, Switzerland. This article is an open access article distributed under the terms and conditions of the Creative Commons Attribution (CC BY) license (http://creativecommons.org/licenses/by/4.0/).
Copyright: This open access article is published under a Creative Commons CC BY 4.0 license, which permit the free download, distribution, and reuse, provided that the author and preprint are cited in any reuse.